
95% of researchers rate our articles as excellent or good
Learn more about the work of our research integrity team to safeguard the quality of each article we publish.
Find out more
HYPOTHESIS AND THEORY article
Front. Environ. Sci. , 25 November 2022
Sec. Environmental Economics and Management
Volume 10 - 2022 | https://doi.org/10.3389/fenvs.2022.1067835
This article is part of the Research Topic Resources and Environmental Management for Green Development View all 26 articles
 Yunyan Li1†
 Ying Zhang1,2*†
Tourism eco-efficiency is an important index to measure the sustainable development of the tourism industry. The super-SBM (slacked-based measure) model based on undesired output, geographical spatial analysis method, and panel Tobit regression model were used to explore the spatial-temporal evolution characteristics of tourism eco-efficiency and its influencing factors on 13 cities in China’s Beijing-Tianjin-Hebei region from 2010 to 2019. The results reveal that: 1) During the study period, high-efficiency cities were mainly in Beijing, Tianjin, and their surrounding areas, and the number of these cities did not change, whereas low-efficiency areas were farther away from central cities, and the number of these cities increased earlier but decreased later. 2) The tourism eco-efficiency in the Beijing-Tianjin-Hebei region exhibits significant positive spatial autocorrelation characteristics, and the driving effect of the spatial radiation of high-efficiency cities on low-efficiency cities in the urban agglomeration is more obvious. 3) The levels of economic development, tourism industry structure, urbanization, and technological progress have a greater impact on tourism ecological efficiency.
Tourism has experienced significant growth over the last few decades and has become one of the largest economic sectors in the world (Candia and Pirlone, 2022). Tourism development is directly relevant to achieving economic growth and happiness, as well as eliminating poverty. For a long time, tourism has been considered an environmentally friendly industry with low energy consumption, low emission, and low pollution. However, as the scale of the tourism industry continues to grow, it causes serious ecological and environmental problems (Wang et al., 2021). For instance, an increase in the scale of the tourism industry increases energy consumption, sewage discharge, and garbage generation because of the large-scale off-site activities of tourists (Yang and Yang, 2019), thereby imposing great ecological risk (Ruan et al., 2019). Green development concentrate on rational utilization of resources and energy, moderate economic and social development, mutual balance of loss compensation, and harmonious coexistence between human and nature (Jiang and Xiang, 2013). Therefore, tourism development needs to follow a green development path, considering its impact on the ecological environment (Paiano et al., 2020). Previous studies have demonstrated that tourism eco-efficiency can comprehensively reflect the coordinated development level of tourism economic activities and the ecological environment, and it is an important indicator that has often been applied to measure the quality of green tourism development (Gӧssling et al., 2005; Yao and Chen, 2016; Peng et al., 2017).
Beijing-Tianjin-Hebei region are located in the heart of China’s Bohai Sea Rim. It is the largest and most dynamic economic region in northern China, with abundant tourism resources. As a major national strategy, the strategy of Coordinated Development of the Beijing-Tianjin-Hebei Region brings new opportunities to the tourism development and plays an important role in promoting the coordinated development of tourism within the Beijing-Tianjin-Hebei region. However, different geographical locations and economic bases have created the unbalanced development trend of tourism. Beijing and Tianjin have a long history and cultural resources and a solid foundation for tourism. Under the strategic Beijing-Tianjin-Hebei collaborative development, Hebei Province is actively promoting the integration of “tourism +” deepening cooperation in the field of public services and focusing on promoting the integration of transportation, ecology, and the tourism industry. Tourism is an industry that promotes green development in the Beijing-Tianjin-Hebei region, but its high-speed development has also caused a series of environmental problems, such as an imbalance between tourism economic growth and ecological environmental protection as well as having a negative impact on the ecological environment (Ozturk et al., 2016; Sun et al., 2020). Therefore, it is of great significance to explore the spatial-temporal evolution characteristics and influencing factors of tourism eco-efficiency in the Beijing-Tianjin-Hebei region for realizing sustainable tourism development.
This study adopts the super-efficiency SBM model to measure the tourism eco-efficiency in the Beijing-Tianjin-Hebei region from 2010 to 2019 and then conducts exploratory spatial analysis to determine its spatial-temporal evolution characteristics. Moreover, it analyzes the influencing factors using the Tobit regression model. The contribution of this study lies in the following three areas: first, we constructed the index system of tourism eco-efficiency, considering undesired output. Second, we chose 13 cities in the Beijing-Tianjin-Hebei as the empirical research objet to analyze tourism eco-efficiency, which enriches relevant research at the level of prefecture-level cities. Third, combined with exploratory spatial analysis and ArcGIS technology, we accurately demonstrate the tourism eco-efficiency of different cities from static and dynamic levels, which provides reference to make the corresponding ecological strategy for the tourism sustainable development and promote the high-quality economic development in the Beijing-Tianjin-Hebei region.
The remainder of this study is organized as follows. Section 2 presents a literature review on the tourism eco-efficiency. Section 3 introduces the research methods, including the Super-SBM model and panel Tobit regression model. Section 4 provides the results and discussion. Section 5 presents conclusions based on the empirical results and provides some policy implications.
Research on tourism eco-efficiency mainly focuses on the concept, measurement, influencing factors, countermeasures, and suggestions for promoting tourism eco-efficiency. The concept of tourism eco-efficiency was proposed by Gӧssling et al. (2005). He calculated the tourism eco-efficiency in the Rocky Mountains, France, Amsterdam, Siena, and other places using carbon dioxide emission and income index and indicated that eco-efficiency is a useful concept for analyzing the combined environmental and economic performance of tourism. Later, Karadayi and Isik (2018), Yao and Chen (2015), Ma and Liu (2016), and other scholars discussed the concept of tourism eco-efficiency. They pointed out that tourism eco-efficiency is an important index for measuring the proportional relationship between the benefits of tourism development and the environmental impacts to achieve “minimum resource input and environmental damage, maximum economic and social output.”
Previous studies have proposed a number of different approaches to the assessment of eco-efficiency (Kytzia et al., 2011). The single-ratio method and data envelopment analysis (DEA) method are two important analysis methods for assessing tourism eco-efficiency. Liu et al. (2019) used the single-ratio method to measure the tourism eco-efficiency value of various regions in China; Perch-Nielsen et al. (2010) used the added value of tourism to characterize the economic value of tourism and measured the eco-efficiency of tourism in Switzerland using the single-ratio method. However, the single ratio method, in which tourism eco-efficiency is represented by the ratio of tourism environmental impact and tourism income, is not sufficient to measure regional tourism eco-efficiency (Huang et al., 2014).
In recent years, scholars have analyzed tourism eco-efficiency by DEA method. DEA is a nonparametric tool for eco-efficiency assessment, DEA users do not need to unify the units, consider the functional form, pre-estimate the model parameters, and make a distributional assumption (Lampe and Hilgers, 2015). With the improvement, the DEA model, super-efficiency model, three-phase DEA model, and bootstrap DEA model has been widely used in the measurement of tourism eco-efficiency. Liu et al. (2017) measured the tourism eco-efficiency of 53 coastal cities in China by DEA method, and used the Tobit model to analyze the factors affecting the tourism eco-efficiency of coastal areas. Wang et al. (2021) used the undesirable SBM-DEA model to estimate the tourism eco-efficiency of 31 provinces in China from 1997 to 2016 and analyzed the spatial-temporal evolutionary trends of eco-efficiency in China using the hot spot model and spatial center of gravity model. Song and Li (2019) used the traditional DEA and bootstrap-DEA methods to evaluate the efficiency of China’s tourism industry from the perspective of sustainable development and found the key factors and the best path for the sustainable development of tourism under the constraints of environmental protection. Sun and Hou (2021) measured the tourism eco-efficiency of 41 cities in the Yangtze River Delta and explored the spatial network structure and evolution trend of tourism eco-efficiency with a modified gravity model and social network analysis method. Chen et al. (2020) evaluate the regional eco-efficiency and tourism economic development level of China’s 30 provinces and cities by using the super-efficiency DEA model and the grey entropy weight method. These achievements use DEA method to measure tourism eco-efficiency, but most of them mainly discussed in the national region and Yangtze River Economic Belt, while there is little literature on the Beijing Tianjin Hebei region.
Furthermore, some scholars discussed influencing factors of tourism eco-efficiency. The main influencing factors of regional tourism eco-efficiency are technical level, economic development level, traffic accessibility, industrial structure, urbanization and environmental regulation factors (Chen et al., 2020; Li et al., 2022). The same views are held by other scholars, such as Liu et al. (2021), who studied the determinants of tourism eco-efficiency of 30 provinces in China, pointed out that the level of economic development, traffic conditions, the professional level of tourism, and openness degree can significantly promote tourism efficiency. An empirical study conducted by Zhang et al. (2022) also indicates that urbanization plays a great role on tourism eco-efficiency.
Summarizing the above literature, it can be observed that research on tourism eco-efficiency has achieved fruitful results, but it is still limited. On the one hand, there has been insufficient attention to the regional tourism eco-efficiency of Beijing-Tianjin-Hebei in China, and hardly discusses tourism eco-efficiency of regional tourism at city level. On the other hand, traditional DEA model and undesired SBM-DEA model were used, which are unable to further distinguish decision making unit, resulting in a deviation of the efficiency value, so the research method needs to be improved. Because of this, this paper utilizes a non-radial super-SBM model and the spatial correlation analysis method to respectively discuss 2010–2019 tourism eco-efficiency. The panel Tobit model is employed to explore the influencing factors on tourism eco-efficiency in the Beijing-Tianjin-Hebei region.
The SBM-DEA model is based on slacked variables, which directly incorporates the slacked variables into the objective function not only to the benefit ratio but also to maximize the actual profit. However, the SBM model cannot distinguish the size of decision units when the efficiency value is 1. To solve this problem, Andersen and Petersen (1993) proposed the super-efficiency model in 1993. Later, based on the SBM model and the super-efficiency model, Tone (2002) proposed the super-efficiency SBM model to further perform the efficiency measurement of the SBM effective decision units and realize the complete ranking of decision units, producing more objective and accurate efficiency measurement results. Therefore, based on MaxDEA8.3 software, this study uses the super-SBM DEA model containing undesired outputs to measure the eco-efficiency of tourism in the Beijing-Tianjin-Hebei region, so as to fully solve the problem that multiple decision-making units may be effective at the same time. The super-efficient SBM-DEA model is constructed as follows:
In this expression, ρ* indicates the eco-efficiency value; n, m, q1, and q2 denote the number of DMUs, inputs, desirable outputs, and undesired outputs, respectively;
The eco-efficiency of DMU is considered to be in an effective state only when ρ*≥1, and the eco-efficiency of input–output elements is considered ineffective when ρ*<1.
The kernel density function estimation method is an important tool to study the non-equilibrium of spatial distribution by estimating the probability density of variables, describing the distribution posture of variables with density curves, and reflecting the information on distribution location, shape, and extension of variables (Chen et al., 2019). Moreover, the kernel density function is weakly dependent on the model and has strong robustness. If the kernel density function exhibits two-wave distribution postures, it indicates that there is convergence in two directions in the economy, and if the height of the wave exhibits a decreasing trend, it indicates that the differences in the values of the evaluated economic attributes keep decreasing, and the concentration of the distribution also exhibits a decreasing trend. In the data, X1, X2, ..., Xn, that is, the probability density of the random variable at point X, is estimated using the following formula (Hou and Yao, 2018):
where n represents the number of observations, which in this study refers to 13 cities in the Beijing-Tianjin-Hebei region; Xi denotes the observed value;
The global spatial auto-correlation portrays the clustering of the spatial distribution of tourism eco-efficiency in the regional space as a whole and examines whether there are spatial clustering characteristics. Moran’s index is used to analyze the global spatial correlation of tourism eco-efficiency in the Beijing-Tianjin-Hebei region, and the Moran’s index is calculated as follows:
In the equations, n represents the total number of cities; wij represents the spatial weight matrix; i = 1, 2,...,n, j = 1, 2,...,n; xi and xj stand for the tourism eco-efficiency of cities i and j, respectively;
Local spatial auto-correlation is used to measure the local correlation between a certain region and the neighboring regions. It is applied to test the agglomeration and dispersion effects between regions. Usually, Moran scatter plots are used to analyze spatial correlation. Local Moran’s I can be calculated as follows:
In Eq. 3, Ii denotes the local Moran’s index of city i; wij represents the spatial weight matrix and the proximity or distance between regional units i and j, which is equivalent to the correlation coefficient. If the local Moran’s index is positive, it indicates the agglomeration distribution of attributes with similar types, that is, a high-value area is surrounded by a high-value area, or a low-value area is surrounded by a low-value area. In contrast, if it is negative, it means aggregation distribution of heterogeneous attribute values, that is, a high-value area is surrounded by a low-value area, or a low-value area is surrounded by a high-value area. The larger the absolute value of Ii, the higher the degree of aggregation.
The panel Tobit regression model was proposed by American economist Tobin (1958) to mainly solve the problem of limited or truncated dependent variables. In this study, the value of tourism eco-efficiency in the Beijing-Tianjin-Hebei region is greater than 0, which is a censored data. If ordinary least square method (OLS) is used, it will produce deviation, resulting in inconsistency with the actual results. Therefore, this study uses the panel Tobit regression model to analyze the influencing factors of tourism eco-efficiency in the Beijing-Tianjin-Hebei region, to avoid the problem of inconsistent and biased estimation of parameters. The expression of the model is as follows:
where Y denotes the restricted dependent variable vector; X stands for the explanatory variable; β0 represents the constant term; βt represents the estimated coefficient of the model; t = 1, 2, 3……n, with n representing different years; εi represents the random error disturbance term, εi ∼ N (0, σ2).
Referring to the results of previous research (Liu. et al., 2021; Wang et al., 2021; Zha et al., 2020), this study selects the number of A-level scenic spots, the number of practitioners in the tertiary industry, and the investment in fixed assets of tourism to represent the input indicators. The total tourism revenue is used to represent the expected output, whereas the tourism sewage discharge, tourism domestic garbage discharge, and tourism SO2 emissions represent undesired output indicators.
The data of this study are mainly from the China Urban Statistical Yearbook, China Urban Construction Statistical Yearbook, Beijing Statistical Yearbook, Tianjin Statistical Yearbook, Hebei Economic Yearbook, Hebei Municipal Statistical Yearbooks, and the statistical bulletins on the national economic and social development of each city in the corresponding years. For some of the missing data, this study uses the linear interpolation method to complete them.
According to the results, the average value of tourism eco-efficiency in the Beijing-Tianjin-Hebei region from 2010 to 2019 is 0.846, which reveals an overall trend of small fluctuation and increase from 0.803 to 0.940. Figure 1 depicts the tourism eco-efficiency of each city in the Beijing-Tianjin-Hebei region from 2010 to 2019. We find that cities with higher tourism eco-efficiency are Beijing, Tianjin, and Langfang, which are closely connected geographically, whereas cities with lower tourism eco-efficiency are Hengshui, Zhangjiakou, and Shijiazhuang. From the perspective of geographical location, the farther the distance from the two central cities of Beijing and Tianjin, the lower the tourism eco-efficiency.

FIGURE 1. The average value of tourism eco-efficiency in the Beijing-Tianjin-Hebei region from 2010 to 2019.
Overall, there is a large gap in tourism eco-efficiency in the region, with cities around Beijing and Tianjin having a relatively high tourism eco-efficiency, because of rich tourism resources and good tourism industrial development foundation. In these cities, there is little long-term negative impact on the environment, thus the efficiency value is at a high level. However, other cities which didn’t take into account the resource limitation, ecological damage and other issues at early stage, may have lower tourism eco-efficiency value, which restricts the sustainable development of the regional tourism industry.
As depicted in Figure 2, the overall trend reveals that the tourism eco-efficiency of 2010, 2013, 2016, and 2019 indicates a “bimodal” distribution trend, implying that the two levels of tourism eco-efficiency are more obvious. The tourism eco-efficiency of the first wave is in the range of 0.4–0.6, and that of the second wave is in the range of 1–1.2. In general, the number of cities in the first wave is the same as that in the second wave. From the state of the kernel density function distribution curve, the wave crests of the tourism eco-efficiency kernel density curves of the 4 years move to the right and become higher in height and narrower in width, indicating that, in general, the tourism eco-efficiency of the Beijing-Tianjin-Hebei region exhibits an upward trend, but the differences between the high and low values are still obvious, and the two-level differentiation still exists.
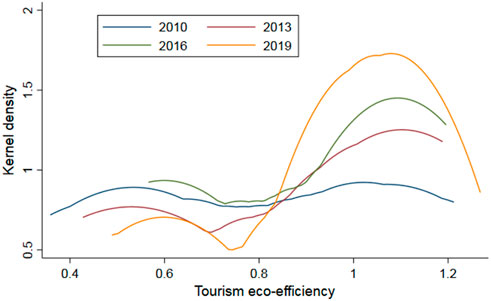
FIGURE 2. Kernel density analysis of tourism eco-efficiency.
For a more comprehensive analysis of the dynamic evolution of tourism eco-efficiency in the Beijing-Tianjin-Hebei region from 2010 to 2019, the natural breaks method (Jenks) in ArcGIS is used to classify the mean tourism eco-efficiency values (TE) of 13 cities in the Beijing-Tianjin-Hebei region. We classify the regions into five types—high-efficiency areas (1.14 ≤ TE ≤ 1.27), relatively high-efficiency regions (1.05 ≤ TE ≤ 1.33), medium-efficiency areas (0.79 ≤ TE ≤ 1.04), low-efficiency areas (0.58 ≤ TE ≤ 0.78), and inefficiency areas (0.36 ≤ TE ≤ 0.57). In this study, the spatial distribution maps of tourism eco-efficiency in the Beijing-Tianjin-Hebei region in 2010, 2013, 2016, and 2019 are selected to demonstrate the dynamic evolution of tourism eco-efficiency (Figure 3).

FIGURE 3. Spatial distribution of tourism eco-efficiency in the Beijing-Tianjin-Hebei region.
In 2010, Tianjin and Cangzhou were the areas with the highest efficiency; Beijing and Langfang belonged to the relatively high-efficiency areas, and Qinhuangdao and Baoding belonged to the medium efficiency areas, but their tourism eco-efficiency values were above 1. The high- and relatively high-efficiency regions were mainly in the central cities of Beijing and Tianjin and their surrounding areas. From 2013 to 2016, the number of inefficient cities decreased significantly, whereas areas with low and medium efficiency increased significantly. The tourism eco-efficiency of Tianjin and Cangzhou decreased from a relatively high to medium-efficiency area, whereas the tourism eco-efficiency of Chengde, Shijiazhuang, Xingtai, Chengde, and other cities improved substantially. In 2019, there were five cities in the high- and relatively high-efficiency areas, with an increase of one city compared to that in 2016. Beijing remained in the high-efficiency region and is the representative of green tourism development in the Beijing-Tianjin-Hebei region; the number of cities in medium-efficiency areas increased, but the tourism eco-efficiency of Zhangjiakou and Handan dropped to inefficiency again.
In summary, the analysis reveals that there was a small increase in the high and relatively high tourism eco-efficiency areas in the Beijing-Tianjin-Hebei region from 2010 to 2019. The number of cities in the inefficiency areas experienced an evolutionary trend of first decreasing and then increasing. Its distribution range narrowed from five cities—Zhangjiakou, Shijiazhuang, Hengshui, Xingtai, and Handan—in 2010 to four cities—Zhangjiakou, Shijiazhuang, Hengshui, and Xingtai—in 2013, and decreased to only one city—Hengshui—in 2016. In 2019, Zhangjiakou and Handan returned to the inefficiency level again. Hengshui was always at the inefficiency level during the study period.
To explore the spatial autocorrelation characteristics of tourism eco-efficiency in the Beijing-Tianjin-Hebei region from 2010 to 2019, we use Geoda1.10 software to calculate the Moran’s index of tourism eco-efficiency in the Beijing-Tianjin-Hebei region for each year, as presented in Table 1. According to the calculated p and z values, only the results in 2019 are not statistically significant. The results of other years passed the significance test, at least at the 5% level, indicating that the tourism eco-efficiency in the Beijing-Tianjin-Hebei region exhibited significant positive spatial autocorrelation characteristics from 2010 to 2018. In 2019, the Moran’s index of tourism eco-efficiency in the Beijing-Tianjin-Hebei region changed to a negative value, indicating that the spatial agglomeration feature of tourism eco-efficiency weakened; the spatial spillover effect of high-efficiency cities was not significant, and the spatial divergence feature of tourism eco-efficiency between neighboring cities strengthened. Although tourism eco-efficiency in 2019 was spatially irrelevant, the overall tourism eco-efficiency in the Beijing-Tianjin-Hebei region had obvious clustering characteristics, which is conducive to the coordinated development of the tourism economy in the region.
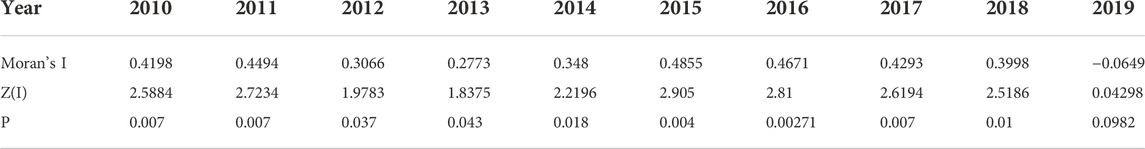
TABLE 1. Global Moran’s index of tourism eco-efficiency in the Beijing-Tianjin-Hebei region.
The spatial evolution of tourism eco-efficiency among cities in the Beijing-Tianjin-Hebei region is depicted on the Moran scatterplot of tourism eco-efficiency for 2010, 2013, 2016, and 2019 (Figure 4). The Moran scatter plot is divided into four quadrants, and different quadrants indicate the local spatial correlation patterns between the tourism eco-efficiency of different cities and the tourism eco-efficiency of their surrounding cities (Zou et al., 2015). Quadrant I (H-H) indicates that cities with high tourism eco-efficiency are surrounded by cities with high tourism eco-efficiency, i.e., a high–high spatial correlation pattern, and cities in this quadrant positively influence the tourism eco-efficiency of surrounding cities. Quadrant II (L-H) indicates that cities with low tourism eco-efficiency values are surrounded by cities with high tourism eco-efficiency values, i.e., low–high spatial correlation pattern, and cities located in this quadrant are surrounded by cities with high and low tourism eco-efficiency, and such areas have large spatial differences and negative spatial autocorrelation of tourism eco-efficiency. Quadrant III (L-L) indicates that cities with low tourism eco-efficiency values are surrounded by cities with low tourism eco-efficiency values, i.e., low–low spatial correlation pattern, and cities in this quadrant have a negative influence on the tourism eco-efficiency of surrounding cities. Such areas have small spatial differences and are dependent on each other. Quadrant IV (H-L) indicates that cities with high tourism eco-efficiency values are surrounded by cities with low tourism eco-efficiency values, i.e., high–low association pattern, and such areas have large spatial differences with the surrounding areas.
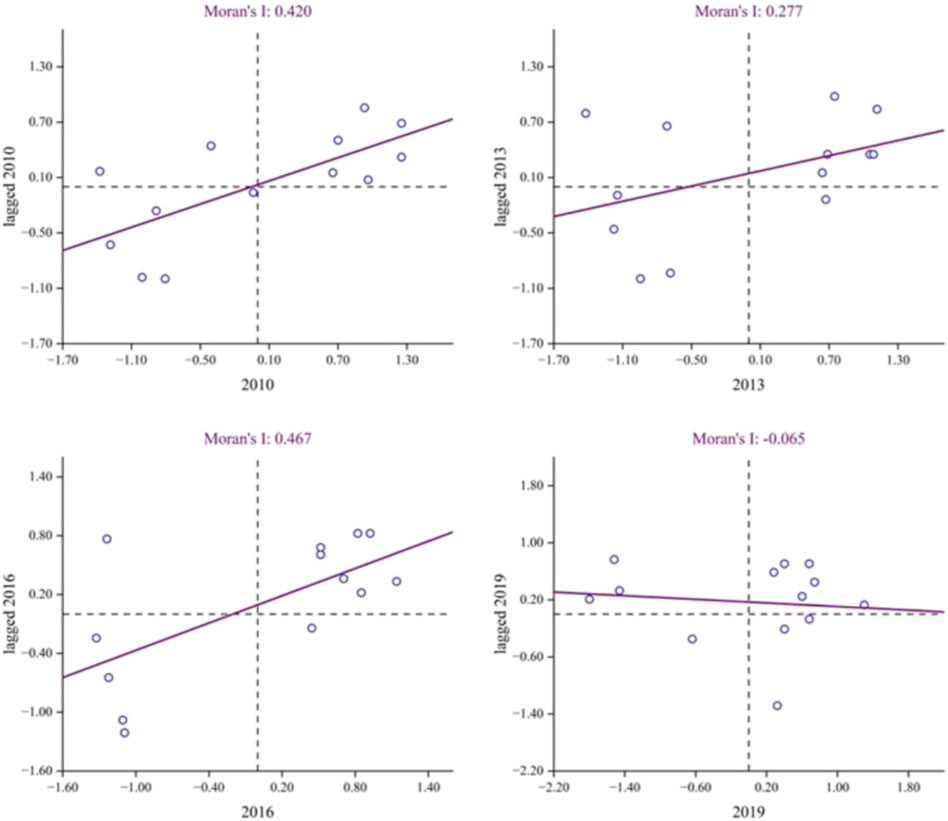
FIGURE 4. Moran scatter plot of tourism eco-efficiency.
Drawing on spatial-temporal leapfrogging method proposed by Rey, (2010), we measure the changes in the spatial association patterns of tourism eco-efficiency in different periods. There are four types of leap paths: in the first one, the observed area leaps to the neighbor quadrant; in the second one, the observed area leaps to the interphase quadrant; in the third one, the observed area does not leap but has a negative correlation with the surrounding area; in the fourth one, the observed area does not leap and has a positive correlation with the surrounding area.
The position of each city in the Moran scatter plot for each year is presented in Table 2. The research results reveal that: 1) There is a significant spatial dependence of tourism eco-efficiency in the Beijing-Tianjin-Hebei region, i.e., the tourism eco-efficiency level and the neighboring regions have clustering characteristics. The main manifestation is that the cities around Beijing and Tianjin are clustered in the diffusion effect area of “high–high” clustering, whereas the rest are mostly clustered in the low growth area of “low–low” clustering, indicating a significant positive correlation. 2) Seven cities experienced leapfrog changes, and all of them belong to the first type, i.e., the observed area leaps to the near quadrant; the area that does not leapfrog is mainly concentrated in the high growth area (high–high), which has a positive correlation with the surrounding area. 3) Before 2019, cities in the Beijing-Tianjin-Hebei region were mainly distributed in Quadrants I and III, whereas in 2019, the spatial distribution pattern of tourism eco-efficiency changed significantly, with more cities falling into Quadrants II and IV. This reveals that the tourism eco-efficiency in the Beijing-Tianjin-Hebei region gradually changed from an initial positive spatial correlation to a spatial competition, indicating that the spatial competition relationship between cities gradually became greater than the spatial cooperation relationship, and the spatial differentiation of tourism eco-efficiency among cities gradually strengthened.
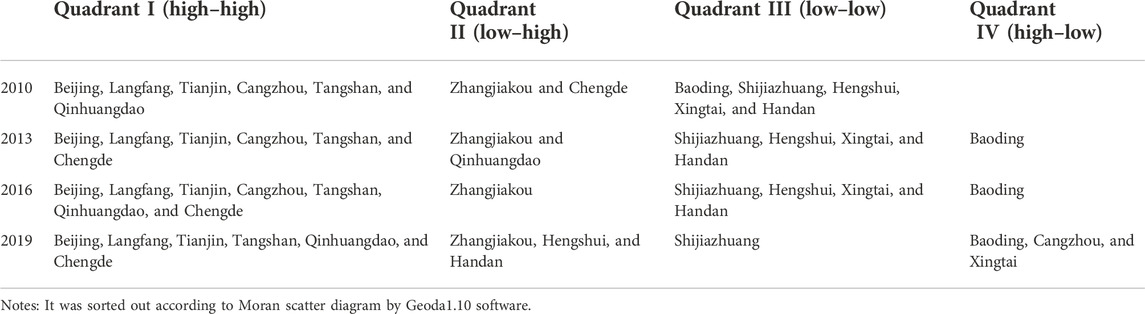
TABLE 2. The spatial distribution of tourism eco-efficiency in the Beijing-Tianjin-Hebei region.
The differences in the temporal and spatial evolution of tourism eco-efficiency are influenced by a number of factors. Based on the existing research literature, the relevant indicators of influencing factors of tourism eco-efficiency are selected as shown in Table 3. 1) Economic development level (ED). Tourism development is closely related to the level of regional economic development. High level of regional economy can provide more convenient conditions for tourism, also introduce environmental pollution. The per capita GDP is selected to measure the economic development level. 2) Industrial structure (IS). As an important part of the tertiary industry, the supporting services of tourism benefit from other corresponding industries, thus, the upgrading and rationalization of industrial structure have an important impact on tourism eco-efficiency. The percentage of the value of the tertiary industry in GDP is selected to represent the industrial structure. 3) Urbanization level (UR). The improvement of urbanization level effectively promotes the development of tourism, provides resources such as capital, talents, technology and information for the improvement of tourism ecological environment, and plays a positive role in promoting energy conservation and emission reduction. On the other hand, from the perspective of economic theory, urbanization may lead to aggravated environmental pollution because of requirement increasing for urban infrastructure and ecological environmental resources. Urbanization is represented by the population of the city. 4) Technological progress (TEC). Technological progress can reduce the energy consumption of tourism, reduce the production of waste water and garbage, and improve the ecological efficiency of tourism. We select the number of patents granted to characterize the technological progress. 5) Environmental Regulation (ER). Environmental regulation is a restraint mechanism for the coordination of tourism economic development and ecological environment protection. From the perspective of pollution control effect, we select three indicators of solid waste comprehensive utilization, sewage treatment and living garbage disposal rates to calculate environmental regulation intensity based on entropy weight method (Ren, et al., 2018; Wang and Wang, 2021). 6) Traffic conditions (RD). Traffic accessibility is the basic condition for tourism development. High accessibility to tourist destinations and convenient transportation in the region can save time cost of tourists, and improve tourism development level. Referencing to research by Li and Wang (2020), we choose road network density, that is, the ratio of highway mileage to regional area, to characterize regional traffic conditions.
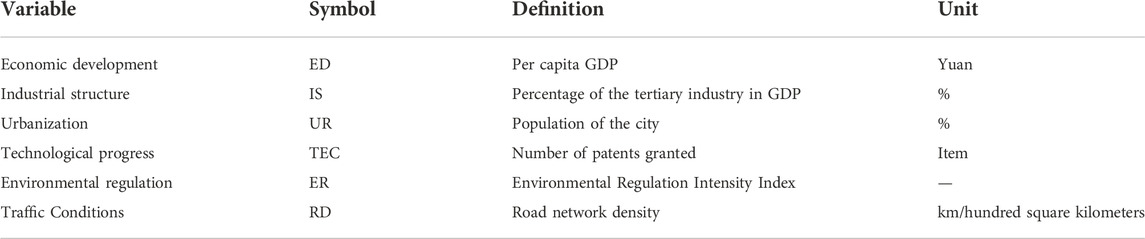
TABLE 3. Variable descriptions of the influencing factors.
Based on the panel data of the Beijing-Tianjin-Hebei region from 2010 to 2019, this study constructs a panel regression model as follows:
where EEit represents the tourism eco-efficiency of city i in year t; α0 is a constant term; βi (i = 1,2, ..., 5) represents the undetermined coefficient of each variable, and εit stands for a random interference item.
The regression results are presented in Table 4.
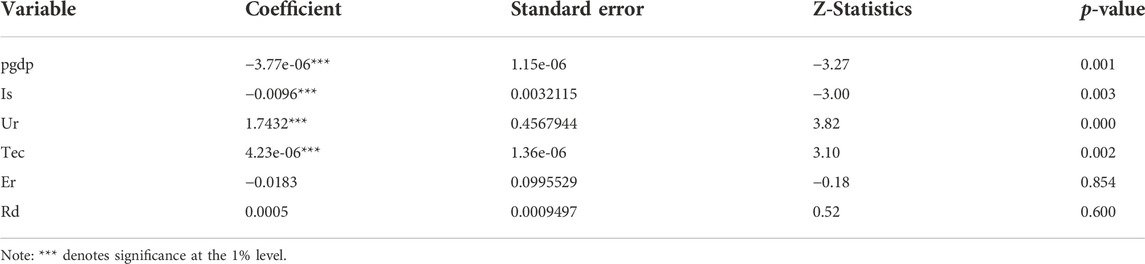
TABLE 4. Tobit regression results.
First, economic development and tourism eco-efficiency are negatively correlated at the 1% significance level. This indicates that the green development level of tourism in the Beijing-Tianjin-Hebei region is low, and high emissions and energy consumption are still the main problems in tourism development. Moreover, this reveals that the development of the economy in the Beijing-Tianjin-Hebei region is still on the left side of the inverted U-curve of the Environmental Kuznets Curve. Despite the growth in GDP, environmental management is still facing serious challenges. Therefore, it is urgent to explore green tourism development.
Second, the correlation between the industrial structure and the tourism eco-efficiency is significantly negative. This indicates that industrial upgrading inhibits the development of tourism eco-efficiency. This may be because Hebei Province is dominated by traditional industries, and the development of modern service industries is relatively slow, so the upgrading of industrial structure will not improve eco-efficiency in the short term. However, as the coefficient is relatively small, its negative impact is not significant.
Third, the level of urbanization exerts a significant and positive impact on tourism eco-efficiency. The current continuous acceleration of the urbanization process in the Beijing-Tianjin-Hebei region is conducive to the agglomeration effect of the tourism industry, thus promoting technological progress and scale efficiency. The mutually reinforcing relationship between urbanization rates and tourism development is recognized by most scholars, with the studies of Wang et al. (2016) and Xu et al. (2018) concluding that the level of urbanization is positively and significantly correlated with tourism efficiency when studying the factors influencing tourism efficiency and performance in different regions. This indicates that although urbanization put great pressure on the ecology and environment, resulting in increased pollution emissions, resource constraints, and damage to resources and the environment due to urban construction, it has a positive impact on tourism development, which outweighs its ecological nuisance. This results in a positive correlation coefficient between the level of urbanization and tourism eco-efficiency.
Fourth, technological progress has a significant influence on tourism eco-efficiency. However, the coefficient of influence is small, indicating that the positive contribution of the level of technological progress to tourism eco-efficiency in the Beijing-Tianjin-Hebei region is less obvious, which is consistent with the results in the study of Zeng (2020). Moreover, the results in the study of Jiao et al. (2018) also indicate that technological progress and innovation, represented by regional patent technology applications, can positively influence the total factor productivity of the tourism industry. On the one hand, technological progress can help tourism sites to innovate ecological and environmental protection activities, improve the efficiency of resource use, enhance the marginal output efficiency of factors, and improve tourism eco-efficiency. On the other hand, the intervention of modern technology has changed the traditional operation and management of tourism, while accelerating the renewal of tourism products and business models, but the R&D of patents has paid little attention to the technological innovation of the tourism economy. Moreover, technological innovations in the tourism economy have not been fully established with a green goal orientation and thus have had a limited effect on improving tourism eco-efficiency.
Fifth, the influence of environmental regulation on tourism eco-efficiency does not pass the significance test, indicating that the influence of environmental regulation on tourism eco-efficiency is not significant. On the one hand, when environmental regulation is strong, enterprises need to invest more capital and labor in environmental management, which may affect tourism economic output to a certain extent, thus inhibiting the improvement of tourism eco-efficiency. On the other hand, environmental regulation prompts tourism enterprises to pay attention to tourism energy consumption and pollution, promoting enterprise innovation, which has a positive effect on tourism eco-efficiency. The offsetting government effects make the impact of environmental regulation on tourism eco-efficiency insignificant. -Sixth, the impact of transportation conditions on tourism eco-efficiency does not pass the significance test, but the regression coefficient is positive, indicating that transportation accessibility contributes to tourism eco-efficiency to a certain extent. Meng et al. (2021) also found that a well-developed transportation network improves tourism development efficiency when studying tourism development efficiency in the Qinba Mountain region, whereas Gong et al. (2016) indicated that transportation conditions have a hindering effect on tourism industry efficiency, thus demonstrating that the influence of regional transportation conditions on tourism eco-efficiency is more complex.
The essence of studying tourism eco-efficiency is to determine the impact of the ecological environment on tourism efficiency and comprehensively analyze the relationship between inputs and desired and non-desired outputs. This study estimates the tourism eco-efficiency of 13 cities in the Beijing-Tianjin-Hebei region from 2010 to 2019 using the super-efficiency SBM-DEA model and demonstrates three aspects of tourism eco-efficiency—characteristics, spatial analysis, and influencing factors. The main conclusions are as follows.
(1) During the study period, the mean value of tourism eco-efficiency in the Beijing-Tianjin-Hebei region is 0.846, which is relatively low. However, it shows a fluctuated increased trend, which is consistent with the existing research results on the eco-efficiency in the Beijing-Tianjin-Hebei (Li, B., et al., 2021). There are big differences among the cities, and the top three cities are Beijing, Tianjin, and Langfang. Because of weak economic foundation and relatively scared tourism resources of some cities in Hebei Province, the overall value of tourism eco-efficiency is not high. Supported by national policies, the advantages of late development are obvious, thus, there is still much room for improving the overall tourism eco-efficiency of the region.
(2) The tourism eco-efficiency of the region reveals an obvious polarization, but the gap among the cities tends to narrow, with a small increase in the high-efficiency areas of tourism. The number of low-efficiency areas experienced an evolutionary trend of first decreasing and then increasing. Hengshui always remained at a low level, with little change in its tourism eco-efficiency values. From 2010 to 2018, the tourism eco-efficiency in the Beijing-Tianjin-Hebei region exhibited a significant positive spatial autocorrelation characteristic, and the high-efficiency cities within the urban agglomeration experienced an obvious spatial spillover effect. In 2019, the spatial distribution pattern of tourism eco-efficiency changed significantly from an initial positive spatial correlation to a negative spatial correlation, indicating that the spatial differentiation of tourism ecological efficiency among cities strengthened.
(3) The tourism eco-efficiency of the Beijing-Tianjin-Hebei region is controlled by multiple factors, with the level of economic development and industrial structure having a negative impact on the tourism eco-efficiency of the region; the level of urbanization and technological progress can significantly promote the tourism eco-efficiency of the Beijing-Tianjin-Hebei region.
Based on the results of the empirical study, the following policy recommendations are put forward.
First, cities with high levels of tourism eco-efficiency have a pronounced spatially radiating and driving effect on cities at lower levels in the Beijing-Tianjin-Hebei region. Therefore, under the strategy of the Beijing-Tianjin-Hebei collaborative development, tourism resources and management technologies should be shared among different cities. Areas with high tourism eco-efficiency, such as Beijing and Tianjin, should play an important role in improving tourism eco-efficiency in neighboring cities. Moreover, Hebei Province needs to enhance its ability to absorb projects, technology, and other elements and actively respond to the radiation effect of Beijing and Tianjin.
Second, the regional industrial structure should be optimized and the upgrading efforts of industrial restructuring should be strengthened to improve tourism eco-efficiency. Optimizing the regional industrial structure requires strengthening the supply-side reform of the regional tourism industry to promote the coordination and adaptation of the tourism supply and demand structure. Moreover, as tourism is a comprehensive industry with many related industries, the Beijing-Tianjin-Hebei region needs to strengthen the relationship between tourism and other industries, improve the overall industry level, and extend the industrial chain.
Third, accelerating the urbanization process; further increasing capital investment to improve urban public infrastructure; advocating green production methods, green lifestyles, and green consumption patterns; and building eco-friendly cities will have a more significant impact on tourism development. The government should continue to innovate the management of environmental protection, clarify the property rights of environmental resources, give full play to the resource allocation role of markets, involve ecological and environmental resources as market factors in market allocation, and reduce energy consumption and pollution emissions.
The original contributions presented in the study are included in the article/supplementary material, further inquiries can be directed to the corresponding author.
Conceptualization: YL and YZ; methodology: YL; formal analysis: YL and YZ; investigation: YZ; writing—original draft preparation: YZ; writing—review and editing, YL. All authors have read and agreed to the published version of the manuscript.
This paper was supported by National Social Science Foundation of China [grant number: 21FJYB023], Natural Science Foundation of Beijing, China [grant number: 9192002], and Social Science Foundation of Beijing,China [grant number: 19YJA002].
The authors declare that the research was conducted in the absence of any commercial or financial relationships that could be construed as a potential conflict of interest.
All claims expressed in this article are solely those of the authors and do not necessarily represent those of their affiliated organizations, or those of the publisher, the editors and the reviewers. Any product that may be evaluated in this article, or claim that may be made by its manufacturer, is not guaranteed or endorsed by the publisher.
Andersen, P., and Petersen, N. C. (1993). A procedure for ranking efficient units in Data Envelopment Analysis. Manage. Sci. 39, 1261–1264. doi:10.1287/mnsc.39.10.1261
Chen, M., Liu, Y., and Zhang, X. (2019). The measurement and trend evolution of the development level of the people’s livelihood in China’s urban agglomeration—an empirical study based on the urban DLI. Chin. Soft. Sci. (01), 45–61.
Candia, S., and Pirlone, F. (2022). Tourism environmental impacts assessment to guide public authorities towards sustainable choices for the Post-COVID Era. Sustainability 18, 18. doi:10.3390/su14010018
Chen, H., Dong, K., Wang, F., and Emmanuel, C. A. (2020). The spatial effect of tourism economic development on regional ecological efficiency. Environ. Sci. Pollut. Res. 27, 38241–38258. doi:10.1007/s11356-020-09004-8
Gong, Y., Zhang, Y., and Tang, C. (2016). A research on the measurement and influential factors of tourism industrial efficiency in the Yangtze River Economic Zone. East China Econ. Manag. 30, 66–74. doi:10.3969/j.issn.1007-5097.2016.09.010
Gӧssling, S., Peeters, P., Ceron, J. P., Dubois, G., Patterson, T., and Richardson, R. B. (2005). The eco-efficiency of tourism. Ecol. Econ. 54 (4), 417–434. doi:10.1016/j.ecolecon.2004.10.006
Hou, M., and Yao, S. (2018). Spatial-temporal evolution and trend prediction of agricultural eco-efficiency in China: 1978-2016. Acta geo. Sin. 73, 2168–2183. (In Chinese). doi:10.11821/dlxb201811009
Huang, J., Yang, X., Cheng, G., and Wang, S. (2014). A comprehensive eco-efficiency model and dynamics of regional eco-efficiency in China. J. Clean. Prod. 67, 228–238. doi:10.1016/j.jclepro.2013.12.003
Jiang, N., and Xiang, R. (2013). Problems of green economic development in China. Contemp. Econ. Res. (02), 50–54.
Jiao, N., Zheng, X., and Yin, J. (2018). A research on spatial-temporal differentiation and influencing factors of hotel industrial efficiency in China coastal areas. J. Chongqing Technol. Busi. Univer( Soc. Sci. Ed. 35, 22–30. doi:10.3696/j.issn.1672-0598.2018.06.004
Karadayi, M. A., and Isik, M. (2018). “Categorical DEA framework for evaluating medical tourism efficiency of “top destinations”,” in Operations research applications in health care management (Cham, Switzerland: Springer).
Kytzia, S., Walz, A., and Wegmann, M. (2011). How can tourism use land more efficiently? A model-based approach to land-use efficiency for tourism destinations. Tour. Manag. 32 (3), 629–640. doi:10.1016/J.TOURMAN.2010.05.014
Lampe, H. W., and Hilgers, D. (2015). Trajectories of efficiency measurement: A bibliometric analysis of DEA and sfa. Eur. J. Operational Res. 240 (1), 1–21. doi:10.1016/j.ejor.2014.04.041
Li, B., He, X., Niu, Z., and Pan, X. (2021). The impact of environmental regulations on green economic efficiency - evidence from beijing-tianjin-hebei urban agglomeration. Pol. J. Environ. Stud. 30 (5), 4039–4057. doi:10.15244/PJOES/130977
Li, S., Ren, T., Jia, B., and Zhong, Y. (2022). The spatial pattern and spillover effect of the eco-efficiency of regional tourism from the perspective of green development: An empirical study in China. Forests 13, 1324. doi:10.3390/f13081324
Li, Z., and Wang, D. (2020). Temporal and spatial differentiation of tourism economy-ecological efficiency and its influencing factors in Wuling Mountain Area. Econ. Geogr. 40 (06), 233–240. doi:10.15957/j.cnki.jjdl.2020.06.025
Liu, J., Wen, D., Tong, Y., and Ma, Y. (2019). Measuring of tourism eco-efficiency and it’s comparative research based on carbon emissions. Acta eco. Sin. 39, 1979–1992. doi:10.5846/stxb201712212290
Liu, J., Zhang, J., and Fu, Z. (2017). Tourism eco-efficiency of Chinese coastal cities—analysis based on the DEA-tobit model. Ocean. Coast. Manag. 148, 164–170. doi:10.1016/j.ocecoaman.2017.08.003
Liu, Z., Lu, C., Mao, J., Sun, D., Li, H., and Lu, C. (2021). Spatial–temporal heterogeneity and the related influencing factors of tourism efficiency in China. Sustainability 13, 5825. doi:10.3390/su13115825
Ma, Y., and Liu, J. (2016). The core value and promotion strategy of tourism ecological efficiency under the background of green development. Tour. Trib. 31, 1–3. doi:10.3969/j.issn.1002-5006.2016.09.001
Meng, Y., Jian, Z., and Ding, Z. (2021). A case study on the spatial patten of tourism development efficiency and its influencing factors at county scale in the Qinba Mountain Area. Tour. Forum 14, 64–76. doi:10.15962/j.cnki.tourismforum.202104033
Ozturk, I., Al-Mulali, U., and Saboori, B. (2016). Investigating the environmental Kuznets curve hypothesis: The role of tourism and ecological footprint. Environ. Sci. Pollut. Res. 23, 1916–1928. doi:10.1007/s11356-015-5447-x
Paiano, A., Crovella, T., and Lagioia, G. (2020). Managing sustainable practices in cruise tourism: The assessment of carbon footprint and waste of water and beverage packaging. Tour. Manag. 77, 104016. doi:10.1016/j.tourman.2019.104016
Peng, H., Zhang, J., Lu, L., Tang, G., Yan, B., Xiao, X., et al. (2017). Eco-efficiency and its determinants at a tourism destination: A case study of huangshan national park, China. Tour. Manag. 60, 201–211. doi:10.1016/j.tourman.2016.12.005
Perch-Nielsen, S., Sesartic, A., and Stucki, M. (2010). The greenhouse gas intensity of the tourism sector: The case of Switzerland. Environ. Sci. Policy 13, 131–140. doi:10.1016/j.envsci.2009.12.002
Ren, S., Li, X., Yuan, B., Li, D., and Chen, X. (2018). The effects of three types of environmental regulation on eco-efficiency: A cross-region analysis in China. J. Clean. Prod. 34 (173), 245–255. doi:10.1016/j.jclepro.2016.08.113
Rey, S. J. (2010). Spatial empirics for economic growth and convergence. Geogr. Anal. 33, 195–214. doi:10.1111/j.1538-4632.2001.tb00444.x
Ruan, W., Li, Y., Zhang, S., and Liu, C. (2019). Evaluation and drive mechanism of tourism ecological security based on the DPSIR-DEA model. Tour. Manag. 75, 609–625. doi:10.1016/j.tourman.2019.06.021
Song, M., and Li, H. (2019). Estimating the efficiency of a sustainable Chinese tourism industry using bootstrap technology rectification. Technol. Forecast. Soc. Change 143, 45–54. doi:10.1016/j.techfore.2019.03.008
Sun, Y., and Hou, G. (2021). Analysis on the spatial-temporal evolution characteristics and spatial network structure of tourism eco-Efficiency in the Yangtze River Delta urban agglomeration. Int. J. Environ. Res. Public Health 18, 2577. doi:10.3390/ijerph18052577
Sun, Y., Hou, G., Huang, Z., and Zhong, Y. (2020). Spatial-temporal differences and influencing factors of tourism eco-Efficiency in China's three major urban agglomerations based on the Super-EBM model. Sustainability 12, 4156. doi:10.3390/su12104156
Tobin, J. (1958). Estimation of relationships for limited dependent variables. Econometrica 26, 24–36. doi:10.2307/1907382
Tone, K. (2002). A slacks-based measure of super-efficiency in data envelopment analysis. Eur. J. Oper. Res. 143, 32–41. doi:10.1016/S0377-2217(01)00324-1
Wang, K., Huang, Z., Cao, F., Yu, F., and Tang, B. (2016). Spatial pattern evolution of urban tourism performance and its influence factors in Pan-Yangtze River Delta. J. Natur. Resour. 31, 1149–1163. doi:10.11849/zrzyxb.20150767
Wang, R., Xia, B., Dong, S., Li, Y., Li, Z., Ba, D., et al. (2021). Research on the spatial differentiation and driving forces of eco-efficiency of regional tourism in China. Sustainability 13, 280. doi:10.3390/su13010280
Wang, Z. F., and Wang, Z. Y. (2021). The impact of environmental regulation on ecological efficiency of tourism industry and its spatial differentiation: Taking the urban agglomeration in the middle reaches of the Yangtze River as an example. Acta eco. Sin. 41, 3917–3928. doi:10.5846/stxb202007221917
Xu, D., Huang, Z., Hu, X., Lv, L., and Cao, Z. (2018). The spatial pattern evolution and its influencing factors of county-scale tourism efficiency in Zhejiang Province. Eco. Geo 38, 197–207. doi:10.15957/j.cnki.jjdl.2018.05.024
Yang, L., and Yang, Y. (2019). Evaluation of eco-efficiency in China from 1978 to 2016: Based on a modified ecological footprint model. Sci. Total Environ. 662, 581–590. doi:10.1016/j.scitotenv.2019.01.225
Yao, Z. G., and Chen, T. (2016). A literature review of tourism eco-efficiency. Tour. Sci. 30, 74–91. doi:10.16323/j.cnki.lykx.2016.06.007
Yao, Z. G., and Chen, T. (2015). Review on overseas tourism eco-Efficiency studies. J. Natur. Resour. 30, 1222–1231. doi:10.11849/zrzyxb.2015.07.014
Zeng, B. (2020). Spacial structure and spillover effect of China’s provincial tourism economic efficiency under environmental constraints. Technol. Econ. 39, 141–174.
Zha, J., Yuan, W., Dai, J., Tan, T., and He, L. (2020). Eco-efficiency, eco-productivity and tourism growth in China: A non-convex metafrontier DEA-based decomposition model. J. Sustain. Tour. 28 (5), 663–685. doi:10.1080/09669582.2019.1699102
Zhang, F., Yang, X., Wu, J., Ma, D., Xiao, Y., Gong, G., et al. (2022). How new urbanization affects tourism eco-efficiency in China: An analysis considering the undesired outputs. Sustainability 14, 10820. doi:10.3390/su141710820
Keywords: tourism eco-efficiency, spatial and temporal evolution, influencing factors, Beijing-Tianjin-Hebei, DEA (Data Envelopment Analysis)
Citation: Li Y and Zhang Y (2022) Spatial-temporal evolution and influencing factors of tourism eco-efficiency in China’s Beijing-Tianjin-Hebei region. Front. Environ. Sci. 10:1067835. doi: 10.3389/fenvs.2022.1067835
Received: 12 October 2022; Accepted: 15 November 2022;
Published: 25 November 2022.
Edited by:
Fengtai Zhang, Chongqing University of Technology, ChinaReviewed by:
Irene Voukkali, Open University of Cyprus, CyprusCopyright © 2022 Li and Zhang. This is an open-access article distributed under the terms of the Creative Commons Attribution License (CC BY). The use, distribution or reproduction in other forums is permitted, provided the original author(s) and the copyright owner(s) are credited and that the original publication in this journal is cited, in accordance with accepted academic practice. No use, distribution or reproduction is permitted which does not comply with these terms.
*Correspondence: Ying Zhang, emhhbmd5aW5nX3NlYUAxMjYuY29t
†These authors have contributed equally to this work
Disclaimer: All claims expressed in this article are solely those of the authors and do not necessarily represent those of their affiliated organizations, or those of the publisher, the editors and the reviewers. Any product that may be evaluated in this article or claim that may be made by its manufacturer is not guaranteed or endorsed by the publisher.
Research integrity at Frontiers
Learn more about the work of our research integrity team to safeguard the quality of each article we publish.