 Xuemin Lin1,2
 Weifeng Li
 Lijian Han
- 1State Key Laboratory of Urban and Regional Ecology, Research Center for Eco-environmental Sciences (CAS), Beijing, China
- 2School of Information Engineering, China University of Geosciences, Beijing, China
Groundwater, an essential component of the hydrological cycle, has been subject to intense pressure worldwide over recent decades, such that reserves have changed appreciably, challenging our ability to deliver on water resource protection goals. While the changes in storage can be quantified, there is little information about what drives the changes in groundwater storage (GWS) and how the impacts of those drivers vary spatially and temporally. In this study, the spatial and temporal variations in GWS across China from 2002 to 2016 are studied, and how GWS was influenced by natural and anthropogenic drivers at multiple scales is examined using Gravity Recovery and Climate Experiment (GRACE) satellite data. The national-scale GWS declined continuously at a rate of −0.27 cm/a over the study period. Interesingly, the difference in the GWS change between the south (increasing) and the north (decreasing) was decreasing, while the gap between the east (increasing) and the west (decreasing) was becoming wider. The main drivers of GWS changes at the national and regional scales were precipitation, agricultural water consumption, and the total population, while industrial water consumption, domestic water consumption, and evapotranspiration were important at the regional and provincial scales. Policies recently implemented to protect GWS have been effective. Given the potential for GWS changes to have impacts at multiple scales, policies and goals should address the drivers of GWS changes at different scales.
1 Introduction
Groundwater, an essential source of freshwater worldwide, plays an important role in agricultural irrigation, industrial manufacturing, domestic use, and other activities (Zou et al., 2015; Gleeson et al., 2020). It is also critical for maintaining aquatic communities and water levels in streams, lakes, and wetlands (Alley et al., 2002). Long-term decreases in groundwater storage disrupt hydrological cycle processes and trigger serious negative impacts, such as land subsidence, seawater intrusion, sea-level rise, and decline in agricultural and industrial productivity (Jin and Feng, 2013; Ye et al., 2016). The rate at which groundwater storage has been declining globally has increased in recent decades, with estimates indicating that the average global groundwater depletion rate increased from 126 ± 32 to 283 ± 40 km3/year between 1960 and 2000 (Frappart and Ramillien, 2018). Groundwater depletion is much more serious in developing countries than in developed countries. For example, India was the country with the highest groundwater depletion rate, and China ranked fifth in the first decade of the 21st century (Döll et al., 2014). If groundwater storage (GWS) continues to decline at such high rates, aquifers will experience enormous stress, and may not be able to support continuing use of the groundwater resource. It is therefore important to have a comprehensive understanding of the stresses behind changes in GWS.
Numerous researchers have carried out studies to explore changes in GWS worldwide. Researchers have used global hydrological models or GRACE satellite data to explore large-scale changes in GWS at global and intercontinental scales (Cuthbert et al., 2019; Herbert and Döll, 2019; Jia et al., 2020; Riedel and Weber, 2020). For example, Döll et al. (2014) combined the WaterGAP Global Hydrology Model (WGHM) and GRACE satellite data and estimated that the average global groundwater depletion rate for 2000–2009 was 113 km³/year (Döll et al., 2014). Regional groundwater depletion is also a cause of much concern in both developed and developing countries, because groundwater extraction can have very localized impacts. Site observations, local hydrological models, and GRACE data are commonly used to assess groundwater at the regional scale (Lakshmi, 2016; Panda and Wahr, 2016; Bai et al., 2022; Zhang et al., 2022). For instance, Scanlon et al. (2012), using the MODFLOW hydrological model, found that groundwater storage across the High Plains Aquifer and California’s Central Valley decreased by about 330 km³ from 1950 to 2007 and by 140 km³ from 1860 to 2003, respectively (Scanlon et al., 2012). Moreover, because of rapid urbanization, some studies have focused on groundwater dynamics at the city scale (Bricker et al., 2017; Gao et al., 2020; Hua et al., 2020). Gao et al. (2020) used the GRACE data and estimated that the groundwater level had declined from −310.9 to −455.6 cm over the period from 1948 to 2018 in Zhangjiakou, Hebei Province, China (Gao et al., 2020). So, while individual studies to date have been carried out at a range of scales, few researchers have considered groundwater dynamics at multiple scales.
Generally, changes in GWS are driven by natural and anthropogenic factors (Gong et al., 2018; Liu et al., 2018; Ahmad and Al-Ghouti, 2020; Jia et al., 2020). Climate change and irrigation are commonly recognized as the main causes of large-scale groundwater changes. Changes in GWS because of climate are generally related to precipitation, because of its direct link with groundwater recharge (Pérez Hoyos et al., 2016; Abiy and Melesse, 2017). Groundwater recharge might decrease to some degree because of increases in evapotranspiration attributable to climate warming (Fu et al., 2019). In cities, intensive socioeconomic activities have a marked effect on groundwater changes. Overall, the main cause of groundwater depletion worldwide is unsustainable extraction of groundwater to support various anthropogenic activities over the long-term. For instance, groundwater accounts for about 40% and 50% of the world’s irrigation and municipal water, respectively (Jakeman et al., 2016). Over-pumping of groundwater for irrigating led to a sharp decline in groundwater in Northwestern India (Panda and Wahr, 2016; Devineni et al., 2022) and California’s Central Valley in the United States (Famiglietti et al., 2011). In the North China Plain, groundwater was over-exploited to support the development of agriculture and manufacturing and service industries, thereby inducing subsidence across an area of 17,500 km2 at a rate of ≥20 mm/year (Ye et al., 2016). The stresses that drive groundwater depletion may vary with spatial scale because of distinct geographical conditions, climate, and socioeconomic development levels. Therefore, to ensure holistic management of groundwater, GWS changes need to be investigated at multiple scales.
In this study, the focus has been on two research questions that, to the best of our knowledge, had not been considered previously in China, as follows. It is attempted to ascertain if GRACE satellite data and in-situ observation data could be combined to examine the GWS changes across vast spatial scales, and then identify the key drivers of GWS change at different scales. The spatial and temporal changes in GWS from 2002 to 2016 at the national, regional, and provincial scales were quantified using GRACE data, Global Land Data Assimilation System (GLDAS) data, and WGHM data. Further, by combining natural and socio-economic factors, the main drivers behind GWS changes at different scales were identified. Finally, how national targets could be allocated at multiple scales to ensure the sustainable use and management of groundwater resources is discussed.
2 Materials and methods
2.1 Study area
China is located east of Eurasia and west of the Pacific Ocean, at latitudes and longitudes ranging from 73°22′E to 135°03′E and 3°51′N to 53°31′N. It covers a total land area of about 9.6 million km2 and comprises 34 provincial administrative units (Figure 1). As the largest developing country in the world, mainland China had a total population of 1.395 billion at the end of 2018, which accounted for about 1/5th of the global population. Its GDP, at about $13.6 trillion, was ranked second in the world in 2018 (NBSC, 2019). However, China has been identified as “water short” by the United Nations, and the average water resource per capita, at 2085.72 m³ between 1988 and 2022, is 1/4 th of the global average and is ranked 128 out of 183 countries worldwide (FAO, AQUASTAT Database, https://www.fao.org/aquastat/en/databases/). Large amounts of groundwater are extracted to satisfy the water demand and this has resulted in serious GWS decline. For example, the GWS in China decreased from 850.186 billion m³ in 2000 to 824.65 billion m³ in 2018 (MWR, 2018). The number of groundwater extraction wells increased from 4 million in 1988 (Chen and Ma, 2017) to 97.49 million in 2011 (MWR, 2011). The climate in China varies significantly between different regions, and can be divided roughly into the eastern monsoon climate zone, northwest temperate continental climate zone, and the Qinghai-Tibet alpine climate zone. Similarly, socioeconomic development is much higher in the east and south than in the north and west.
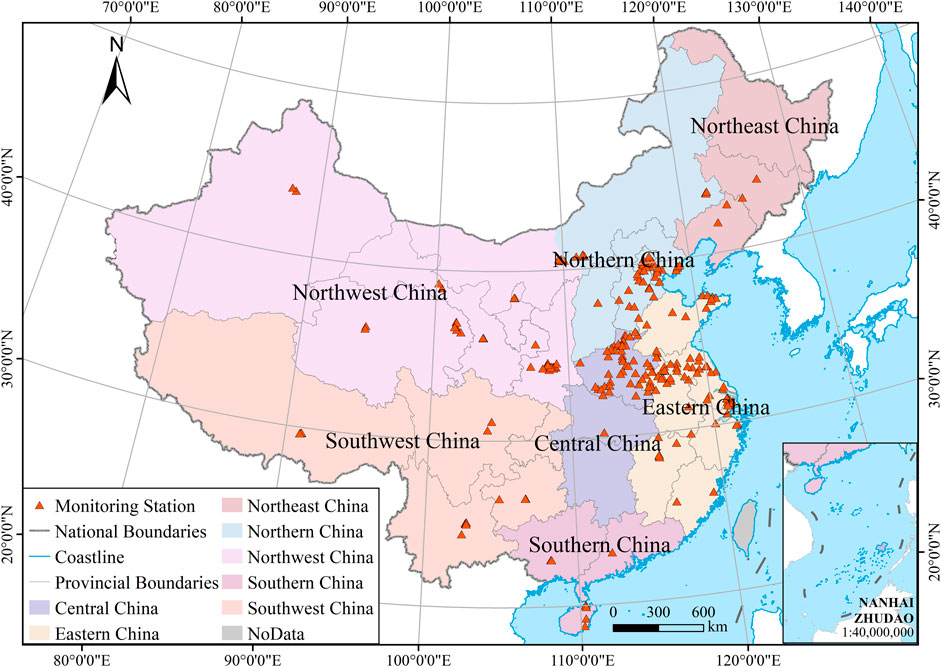
FIGURE 1. Geographical regions in China included in this study.
The effects of both natural and human activities on GWS at national, regional, and provincial scales were analyzed to ensure the results were complete and represented the climatic, geographical, and administrative variations. Mainland China is generally divided into seven geographical regions, namely, Northern China, Northeast China, Eastern China, Central China, Southern China, Southwest China, and Northwest China (Figure 1) (Tian and Zhang, 2020; Chen et al., 2021). Moreover, because of the variability in socioeconomic activities across the nation, decision-making about socioeconomic development is commonly targeted at provincial and regional administrative units. Therefore, to account for the national, regional, and provincial scales, the temporal changes in GWS for the entire mainland of China was quantified, for the seven geographical regions, and for 31 mainland provinces, respectively. Hong Kong, Macao, and Taiwan were not included because no data were available.
Northern China covers four provincial-level administrative units (Beijing, Tianjin, Hebei, and Shanxi) and eight prefecture-level cities in the Inner Mongolia Autonomous Region (Hohhot, Baotou, Hulunbuir, Xingan League, Tongliao, Chifeng, Xilin Gol League, and Ulan Qab League); Northeast China covers three provincial-level administrative units (Liaoning, Heilongjiang, and Jilin); Eastern China covers seven provincial-level administrative units (Shanghai, Jiangsu, Zhejiang, Anhui, Jiangxi, Fujian, and Shandong); Central China covers three provincial-level administrative units (Henan, Hubei, and Hunan); Southern China covers three provincial-level administrative units (Guangdong, Guangxi Zhuang Autonomous Region, and Hainan); Southwest China covers five provincial-level administrative units (Chongqing, Sichuan, Guizhou, Yunnan, and Tibet Autonomous Region), and Northwest China covers five provincial-level administrative units (Shaanxi, Gansu, Qinghai, Ningxia Hui Autonomous Region, and Xinjiang Uygur Autonomous Region) and four prefecture-level cities in the Inner Mongolia Autonomous Region (Alxa League, Bayannaoer, Wuhai, and Ordos).
The framework for investigating the spatial-temporal variation of GWS change and driving forces across China was developed as shown in Figure 2.
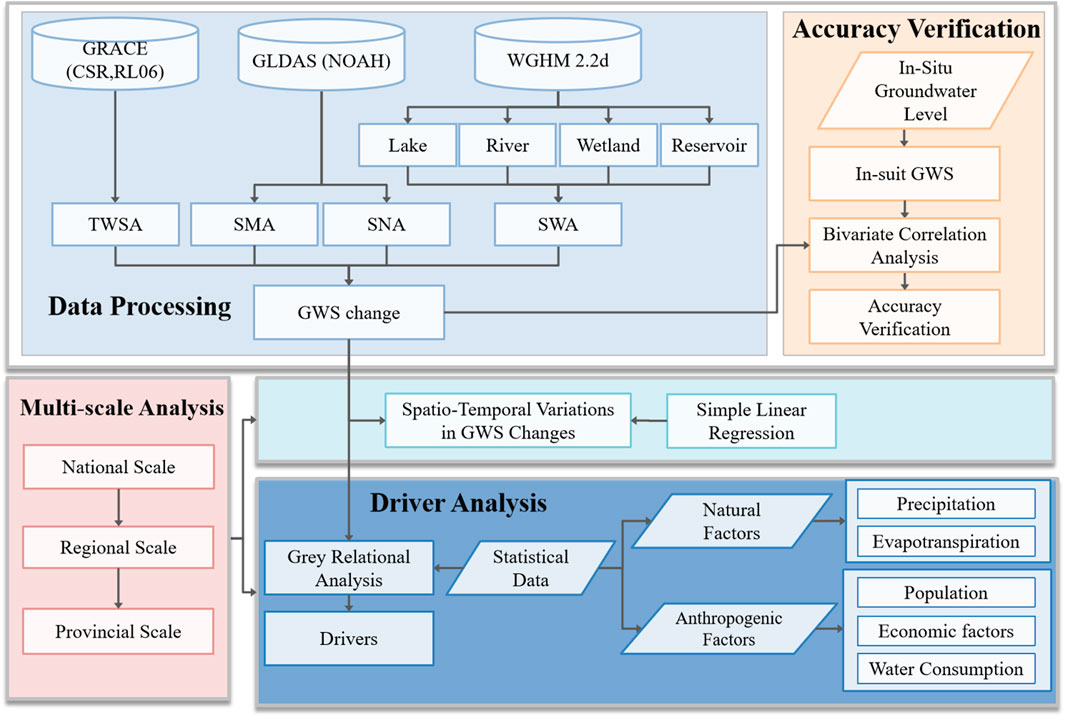
FIGURE 2. Framework for investigating GWS change and driving forces.
2.2 GRACE and hydrological model data
The GRACE mission, launched in March 2002 by NASA and Das Deutsche Zentrum für Luft-und Raumfahrt (DLR), monitors the changes in the earth’s time-varying gravity field, which reflected variations in the terrestrial water storage (TWS) (Long et al., 2020). Therefore, GRACE data does not provide information about the total (absolute) amount of water stored at a location, but represent anomalies with respect to the mean state [i.e., the average surface mass during the baseline time (January 2004–December 2009)], known as Terrestrial Water Storage Anomalies (TWSA), which characterize the relative TWS. In this study, the monthly TWSA products from April 2002 to December 2016 at a resolution of 0.25 ° × 0.25 ° from the Center for Space Research’s TELLUS website (http://www2.csr.utexas.edu/grace) were obtained. There was a 19-month gap in the data of the study period because of issues with the GRACE satellite sensor. The missing values for this period were interpolated by averaging the values of the 2 months before and 1 month after the month without data (Long et al., 2015; Yin et al., 2018).
In addition, other properties of terrestrial water from GLDAS data and WGHM (WaterGAP Global Hydrology Model) data were obtained, including soil moisture (SM), snow water (SN), and surface water (SW). SM and SN data were obtained at a spatial resolution of 0.25 ° × 0.25 ° from the GLDAS-2/NOAH model (monthly product) (https://search.earthdata.nasa.gov/search?q=GLDAS). The SW data from information about the amount of reservoir, lake, river, and wetland storage from the monthly product of the WGHM 2.2 days model were obtained at a spatial resolution of 0.5 ° × 0.5 ° (Huang et al., 2019; Müller Schmied et al., 2021) (https://doi.pangaea.de/10.1594/PANGAEA.918447). The WGHM 2.2 days data were re-gridded to a horizontal grid resolution of 0.25 ° × 0.25 ° to match with the resolution of the GRACE and GLDAS data using ArcGIS 10.6 software (ESRI, Environmental Systems Research Institute). As it was to ensure comparisons against the TWSA are consistent, the temporal mean of each dataset were computed over a common time period and subtracted from the respective time series to obtain soil moisture anomalies (SMA), snow water anomalies (SNA), and surface water anomalies (SWA) (Huang et al., 2015; Chen et al., 2019).
2.3 Estimation of groundwater storage changes based on GRACE
According to the terrestrial water balance equation, TWS is composed of SW, GWS, SN, SM, and biomass water (which is negligible in most cases) (Liesch and Ohmer, 2016). Therefore, the TWSA based on GRACE data can be represented by the anomalies of the different terrestrial water components, as follows:
Of these, TWSA and SWA were derived from the GRACE and WGHM data, respectively, and SNA and SMA were derived from GLDAS data. Eq. 1 therefore becomes:
The GWSA represents the anomalies in GWS relative to the baseline temporal average (i.e., the relative GWS), usually expressed by the equivalent water thickness (cm). For different spatial scales, the GWSA was calculated as the mean value of all the grids summarized by the spatial domain of the mainland, geographic regions, or administrative provinces accordingly.
The GWS change (∆GWS) is the time derivative of the GWSA, which is referred specifically to as dGWSA/dt at the monthly scale, using the simple derivative in Eq. 3:
The linear change trend analysis was used to identify the GWS change during the period of 2002–2016. Moreover, we highlighted the difference in the GWS change between the different three time periods (2002–2006, 2007–2011, and 2012–2016), which approximately aligned with the Chinese national 5-year development programs. These national development plans have deeply affected the socioeconomic development of China, and the related development policies were often substantially adjusted every 5 years.
2.4 Accuracy verification
The accuracy of the GWS estimates was verified against in-situ groundwater water level observations, which were obtained from 289 official national-level monitoring stations (Figure 1). Because of issues with data availability, data were not available for the entire study period. The annual average groundwater level data were obtained from 2005 to 2016 in the China Geological Environment Monitoring Groundwater Level Yearbook. To match the annual time scale of this study, the monthly groundwater level data as annual data was averaged and processed into anomalies, with 2005–2009 as the baseline. The estimated GWS anomalies derived from GRACE were verified by comparing with the observation data using the Pearson correlation coefficient (Nanteza et al., 2016; Gao et al., 2020).
2.5 Drivers of groundwater storage change
Referring to previous studies (Chen et al., 2018; Chen et al., 2020; Zhao et al., 2020), 10 natural and anthropogenic factors that were probably directly or indirectly related to GWS change were selected, namely, precipitation, evapotranspiration, total population, agricultural water consumption, industrial water consumption, domestic water consumption, GDP (Gross Domestic Product) of primary industries, GDP of secondary industries, GDP of tertiary industries, and total GDP. All the data were extracted from Statistical Yearbooks and Water Resources Bulletins from 2002 to 2016.
The Grey Relational Analysis (GRA) to reflect the relationships between GWS change and driving factors was used (Chen et al., 2020). GRA is based on geometrical mathematics and complies with the principles of normality, symmetry, entirety, and proximity, and has been useful for resolving questions about the complex interrelationships between multiple factors and research objects. Thus, GRA can show the similarity in the changes and trends of different subsystems, and is more suitable for systems with a small number of samples than traditional regression analysis (Yi et al., 2021).
In GRA, the closeness of the relationship between the changes in GW storage and multiple influences are judged by determining the geometrical similarity between the reference sequences Y = {Y(k)|k = 1, 2, … , n} and the different comparison series Xi = {Xi(k)|k = 1, 2, … , n}, i = 1, 2, … , m. In this study, the change in the GWS was determined as the reference sequence, while the influential factors were determined as the comparison sequences. Each sequence was initialized separately to unify the dimension (Deng, 1990). The grey relational coefficient was calculated as below. The grey relational grade represents the level of correlation between the reference and comparability sequences and, as the grey relational grade increases, the correlation between the comparability and reference sequences strengthens.
Where r represents the grey relational grade, and i represents the spatio-temporal sequence of the i-th driver, and i = 1, 2,..., 10 represent the 10 drivers. The time length and the time node of the sequence are represented by n and k, respectively. The study period was from 2002 to 2016, so n = 15, and k = 1, 2, … , 15. ξi(k) is the correlation coefficient, that is, the degree of correlation between the reference sequence and the comparison sequence at each time node:
Where, ξi(k) is the grey relational coefficient, ρ is the resolution coefficient, and the strength of the resolution increases as the value decreases, usually ρ = 0.5 (Mo, 2021; Reddy et al., 2021).
3 Results
3.1 National-scale changes in groundwater storage
The change in GWS inverted by GRACE fitted well with the in-situ observation data, with a high significant correlation (value of 0.87, p < 0.01) between the GRACE-based GWS change and the in-situ observations. The results at the grid scale showed obvious spatial and temporal changes in GWS from 2002 to 2016 (Figure 3).
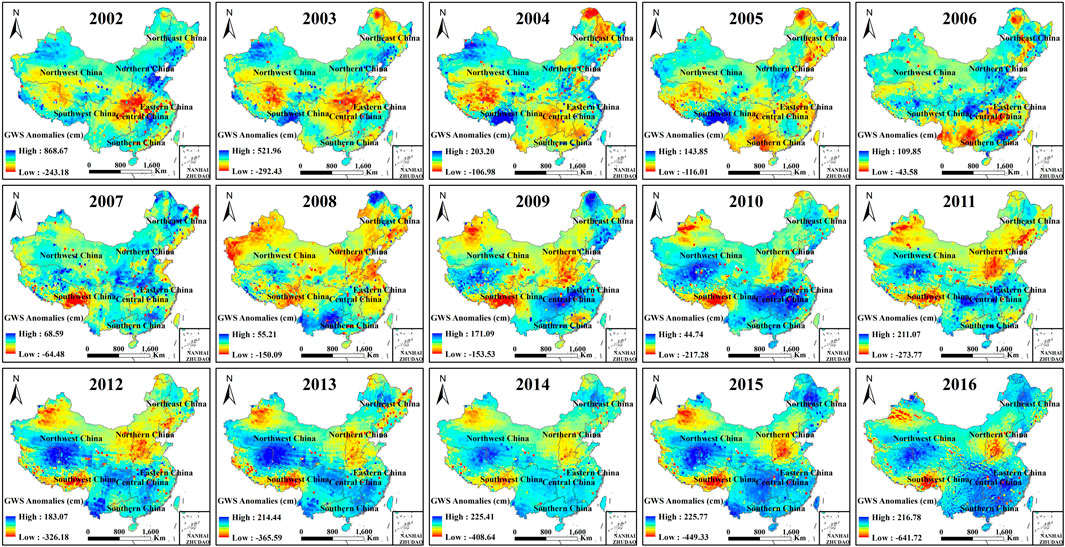
FIGURE 3. GWS anomalies across China from 2002 to 2016.
At the national scale (Figure 4), the mean annual GWS change (i.e., relative GWS) declined by 4.13 cm from 2002 to 2016 at a rate of −0.27 cm/a (p < 0.01). The GWS change fell into three different periods, namely 2002–2006, 2007–2011, and 2012–2016. The rate of decline in the GWS across the entire mainland was highest for 2007–2011 [−0.42 cm/a (p < 0.05)], followed by 2012–2016 (−0.22 cm/a), and was lowest for 2002–2006 (−0.15 cm/a).
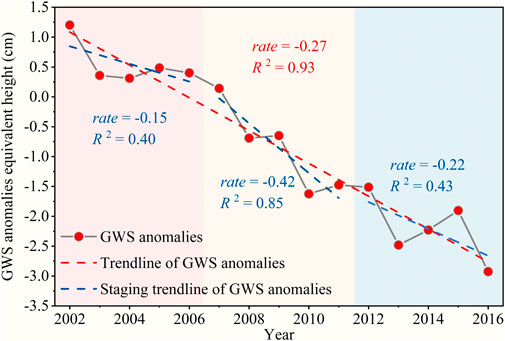
FIGURE 4. GRACE-derived GWS anomalies in China from 2002 to 2016.
3.2 Regional-scale changes in groundwater storage
Our analysis across the seven geographic regions showed that the GWS changes varied considerably across the seven regions (Figure 5). From 2002 to 2016, the GWS decreased significantly in Northern, Northwest, Eastern, Northeast, and Southwest China while it increased significantly in Southern China (0.32 cm/a, p < 0.01), but not in Central China. The rate of decline was most rapid in Northern China (−0.64 cm/a, p < 0.01) and was slowest in Eastern China (−0.11 cm/a, p < 0.05).
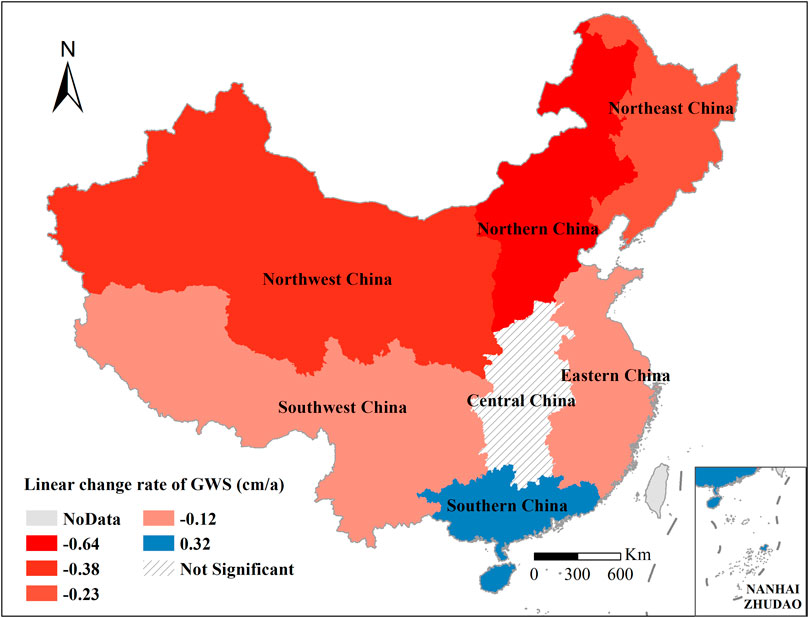
FIGURE 5. Linear rates of change in GWS in the seven regions of China from 2002 to 2016.
The regional GWS change also varied between different periods (Figure 6). Over the three time periods, the GWS decreased continuously in Northern and Northwest China, increased continuously in Central China, and fluctuated in Northeast, Southwest, Eastern, and Southern China. The rate of decrease in the GWS during the middle period (2007–2011) was most rapid in Northern China (−1.19 cm/a, p < 0.01), while the decrease in the GWS in the later period (2012–2016) was most rapid in Northwest China (−0.71 cm/a, p < 0.01). In contrast, the region with the most rapid GWS increase in the early period (2002–2006) was Central China (0.41 cm/a, p < 0.1). In the regions where the GWS changes fluctuated, the GWS first decreased and then increased in Northeast, Eastern, and Southern China, but first increased and then decreased in Southwest China. The acceleration or deceleration of the GWS in five of the seven regions show that the regional-scale GWS improved significantly in the later period.
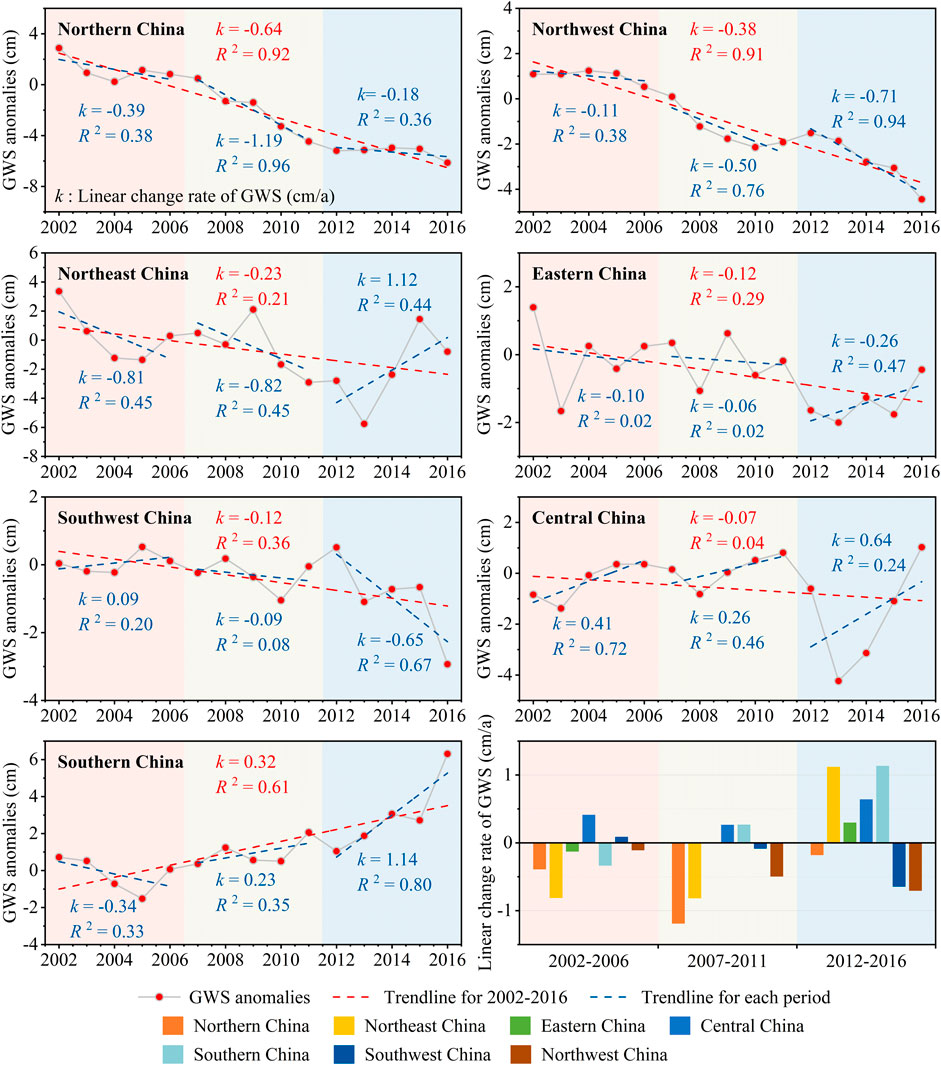
FIGURE 6. Change and linear fit of the GWS derived from GRACE in the seven regions of China.
3.3 Provincial-scale changes in groundwater storage
The GWS changes varied considerably among the different provinces within each region, especially in Southwest, Central, and Eastern China (Figure 7). For example, the GWS decreased in Southwest China at an overall average rate of −0.12 cm/a (p < 0.05) for 2002–2016. Out of the five provinces in the region, only the GWS for Tibet decreased (−0.53 cm/a, p < 0.01), but the GWS for the other four provinces increased significantly, with rates of increase ranging from 0.21 to 1.03 cm/a. In Central China, the change in GWS was not significant at the regional scale, but was significant for some of the individual provinces within it. The GWS of Hunan Province increased at a rate of 0.48 cm/a (p < 0.01) and the GWS of Henan province decreased at a rate of −0.66 cm/a (p < 0.01). There was an overall regional decrease in Eastern China (−0.12 cm/a, p < 0.05), but the GWS increased significantly in two provinces, Jiangxi and Shanghai, at rates of 0.33 (p < 0.05) and 0.17 cm/a (p < 0.05), respectively. The trends in the GWS changes in the provinces in the other four regions (Northern, Northeast, Northwest and Southern China) were consistent with the overall change for the region.
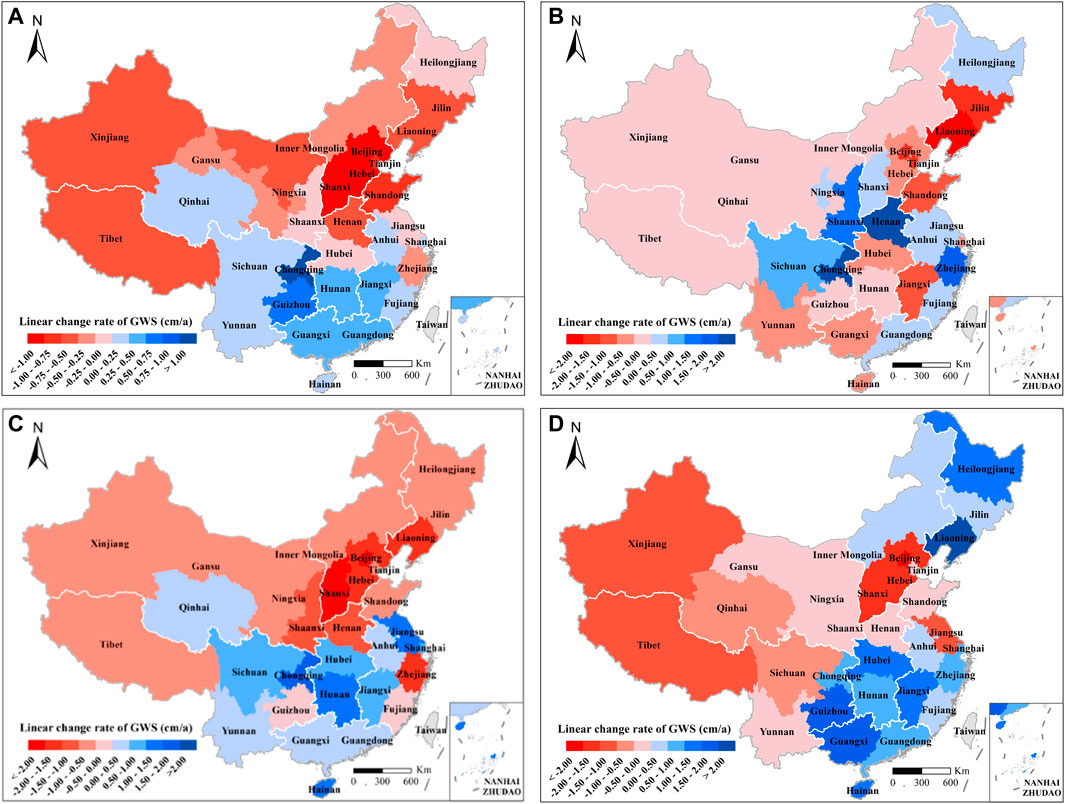
FIGURE 7. Changes in the linear rates of the GWS at the provincial level in China (cm/a) for (A) 2002–2016, (B) 2002–2006, (C) 2007–2011, and (D) 2012–2016.
The GWS changes in the provinces varied in the different time periods (Figures 7B–D). The GWS change at the provincial-scale for 2002–2006, 2007–2011, and 2012–2016 either increased continuously, decreased continuously, or fluctuated. The GWS increased continuously in three of the 32 provinces, namely Chongqing (Southwest China), Guangdong (Southern China), and Anhui (Eastern China). The GWS decreased continuously from 2002 to 2016 in eight provinces, mainly in Northern (e.g., Beijing) and Northwest (e.g., Xinjiang) China. The GWS fluctuated and increased in 2012–2016 in 13 of the 21 provinces in Northeast China (e.g., Liaoning), Eastern China, Central China, and Southern China (e.g., Guangxi), but showed decreasing trends in the remaining eight of these 21 provinces, mainly distributed in Southwest China (e.g., Sichuan) and Northwest China (e.g., Qinghai). Overall, the increase in the GWS for 2012–2016 was greatest in Liaoning and Guangxi, and the decrease was greatest in Beijing, followed by Shanghai, Jiangsu, Xinjiang, and Tibet. Also, fewer provinces had declines in GWS for 2012–2016 than for 2002–2006, which implies that the stress on groundwater exploitation had been relieved in some provinces. The provincial- and regional-scale results were consistent.
3.4 Relationships between the groundwater storage changes and the drivers
The GRA showed that the most important drivers of GWS change at all three spatial scales were precipitation, agricultural water consumption, and the total population, and that some other factors were important in some regions and provinces (Figure 8; Table 1). At the national scale, the grey relational coefficient (GRC) was highest between the GWS change and precipitation (0.87), followed by the agricultural water consumption (0.86) and the total population (0.86). The drivers showed variation at the regional scale. For example, precipitation had the highest GRC in Eastern China (0.83), Central China (0.84), and Southern China (0.84), agricultural water consumption had the highest GRC in Northern China (0.86), and industrial water consumption had the highest GRC in Northeast China (0.77). In contrast, it was difficult to assess the drivers of GWS change in Southwest and Northwest China. For example, precipitation, evapotranspiration, total population, and different types of water consumption had GRC values of 0.76 in Southwest China, while precipitation, industrial water consumption, and domestic water consumption had GRC values of 0.86 in Northwest China. Additionally, there were some differences between the main drivers at the provincial and regional levels. The GRC of the highest ranked drivers at the provincial and regional levels were different, and the primary drivers of 12 provinces were inconsistent with those of the region to which they belonged, mainly in Eastern, Southern, Northern, and Northwest China. For example, industrial water consumption had the highest GRC in Shandong province (Eastern China), while precipitation had the highest GRC at the regional scale. The reason was there existed obvious variability in natural, social, and economic characteristics between different provinces, which was inconsistent with those of the upper regional scale. This resulted in the variety of dominant driving factors across different spatial scales.
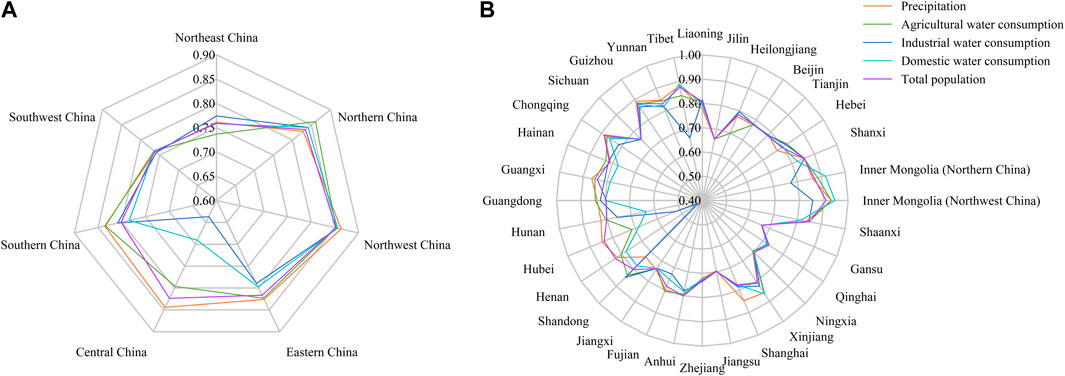
FIGURE 8. Main drivers of regional and provincial GWS change. (A) Regional scale. (B) Provincial scale.
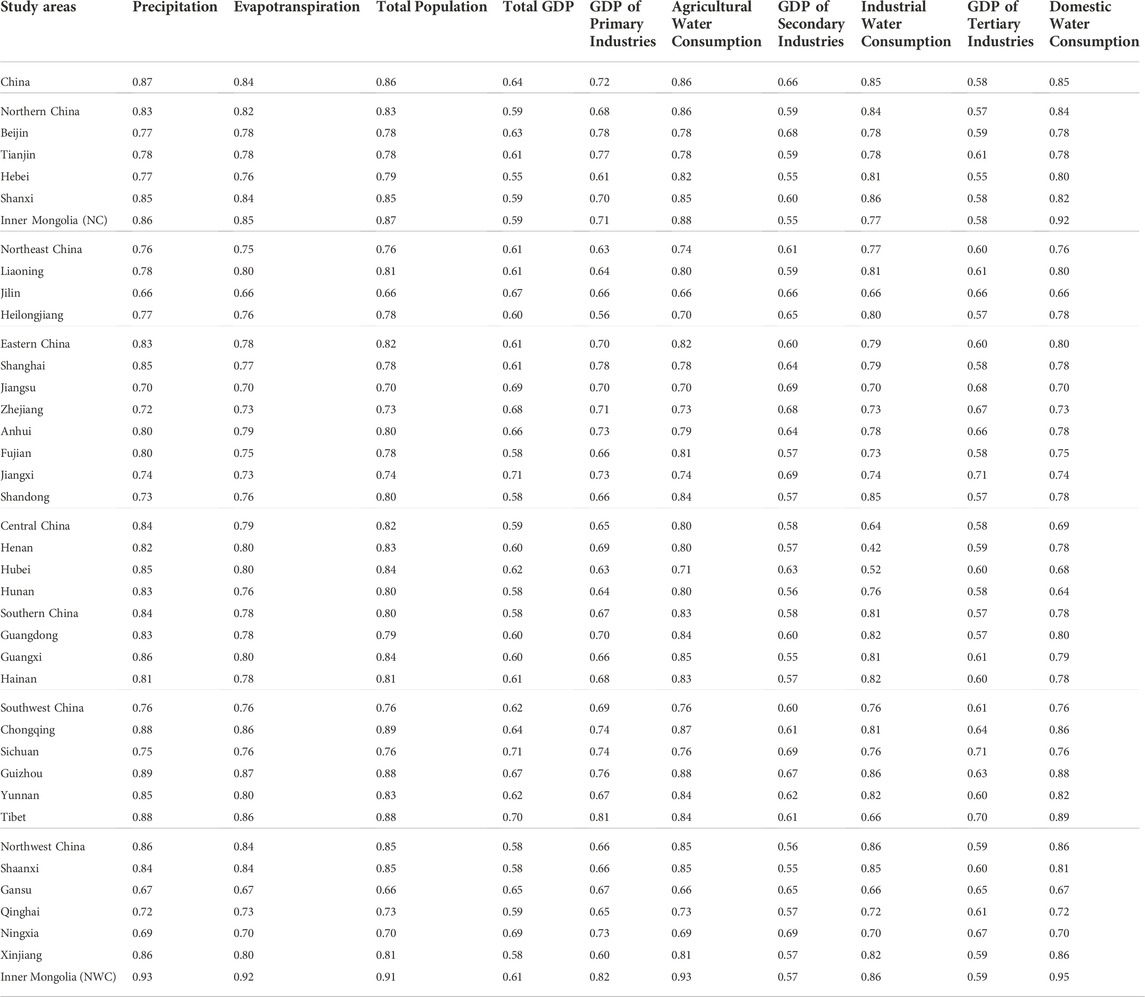
TABLE 1. GRC of GWS change and drivers at the national and regional scales in China.
4 Discussion
4.1 Spatial and temporal variations in groundwater storage changes
China’s GWS declined continuously over the study period, despite the great awareness of the need to protect groundwater. At the national scale, the trend in the GWS was generally inversely related to the changes in the groundwater usage, and a decrease in the GWS was usually accompanied by an obvious increase in the groundwater usage. For example, the national-scale GWS showed an overall decrease (−0.27 cm/a, p < 0.01) from 2002 to 2016, but the groundwater usage increased at a rate of 0.47 billion m3/a (p < 0.05). The decline in the GWS was fastest from 2007 to 2011, mainly reflecting the 3.74% increase in the groundwater usage. The slowdown in the GWS depletion after 2012 shows the results of China’s efforts to control groundwater extraction. For example, China’s groundwater withdrawal decreased by 5.73% from 2012 to 2017, which reflects the effectiveness of the strict groundwater protection measures adopted by the Chinese government. However, relative to the gains reported in other countries, there is still much room for improvement in groundwater conservation in China. For instance, the amounts of groundwater used in Egypt and Ukraine decreased by 13.33% and 47.33% from 2012 to 2017, respectively (FAO, AQUASTAT Database, https://www.fao.org/aquastat/en/). The groundwater will continue to be an important source of water for China into the future. Thus, groundwater in China will face ongoing pressure.
The differences in the GWS changes between the north and the south, and the east and the west, increased. For example, the GWS continued to increase in Southern China from 2002 to 2016 (0.32 cm/a, p < 0.01), but continued to decrease in Northern China (−0.64 cm/a, p < 0.01). Even so, the gap in the GWS change between Northern and Southern China narrowed, because the GWS increased at a faster rate in Southern China and decreased at a much slower rate in Northern China from 2012 to 2016 than in 2007–2011. The accelerated increase in the GWS in Southern China resulted from a 16.21% increase in the average precipitation and 8.31% decrease in the groundwater usage. In contrast, the ongoing decline in the rate of decrease in the GWS in Northern China reflects the combination of an increase of 15.21% in the average precipitation and a decrease of 13.73% in the groundwater usage. So, the net effect of the increase in precipitation and the decrease in the groundwater usage caused the slowdown in the GWS depletion in Northern China. Similarly, the imbalance between groundwater exploitation and replenishment in the west of China intensified from 2002 to 2016, causing an increase in the rate of GWS depletion, and a widening of the gap in the GWS decline between the east and the west. For example, in the absence of significant precipitation changes from 2002 to 2016, groundwater exploitation increased by 44.76% in Northwest China, but decreased by 27.79% in Eastern China (MWR, 2018). The groundwater usage, and so the reliance on groundwater, only increased in Northwest China. Therefore, measures to protect the groundwater usage in the Northwest of China should be urgently minimized.
There was significantly more variation in the GWS changes at the provincial scale than at the regional scale. For example, the GWS in Southwest China decreased (−0.12 cm/a, p < 0.05) from 2002−2016, but increased significantly in four of the five provinces in this area, with a maximum rate of increase of 1.03 cm/a (p < 0.01) in Chongqing. Similarly, the GWS showed a decrease in Eastern China (−0.12 cm/a, p < 0.05), but increased significantly in Jiangxi (0.33 cm/a, p < 0.05) and Shanghai (−0.17 cm/a, p < 0.05). In Central China, there was no significant change in the GWS, but there were significant changes in the GWS in some provinces in this region. These results remind us that some of the variability will be hidden by examining data at a single scale, and that the variability in the GWS changes should be examined at a range of scales.
4.2 Diverse impacts of multiple stresses on groundwater storage changes
Some of the drivers of GWS changes were common across different scales. At the national scale, the main drivers of the GWS change were precipitation, agricultural water consumption, and the total population, while other factors, such as industrial and domestic water consumption and evapotranspiration, were also significant at regional and provincial scales. This shows that changes in these factors can significantly affect the GWS changes at different scales. For example, the strong correlation between precipitation and GWS change was evidenced by the fact that the average precipitation across China decreased from 2002 to 2011 (by 11.94%) and then increased from 2011 to 2016 (by 25.98%), and the increase in the later period greatly slowed the decline in the GWS. Additionally, China is a major agricultural country and so has to address the challenge of high-water consumption due to inefficient irrigation in agriculture. The agricultural sector in China accounts for more than 60% of the water withdrawal, but the effective use coefficient of farmland irrigation water (that is, the ratio of the actual effective use of water irrigated into the field, excluding deep seepage and field loss to the total water introduced from the canal) in China was only 0.55 in 2019, compared with 0.89 in Israel (Martinho, 2020). These figures indicate that the agricultural water demand in China could be reduced by developing high-efficiency water-saving irrigation techniques and adjusting agricultural planting structures (Qiu, 2010).
At regional and provincial scales, other anthropogenic and natural factors, such as water consumption by different sectors and evapotranspiration, noticeably affected the changes in the GWS. For example, in Hebei (Northern China), agricultural water consumption had the highest GRC, followed by industrial water consumption and domestic water consumption. From 2002 to 2016, Hebei’s surface water resource accounted for only 0.23% of the whole nation’s water resource, so about 78.58%, 78.59%, and 83.65% of Hebei’s agricultural water, industrial water, and domestic water came from groundwater, respectively (DWRHP, 2016). In Gansu (Northwest China), the evapotranspiration increased by 20.44% from 2002 to 2016, which potentially reduced the recharge from surface water to groundwater. The differences in the drivers of the GWS change suggest that specific polices are needed for different scales.
The variations in the GWS change and the stresses at different spatial scales across China also reflected the effect of policies. The slowdown in the GWS decline in China from 2012 to 2016 resulted from the implementation of a series of policies, such as water saving, water diversion, and water replenishment. For example, at the national level, policies such as “The National 12th Five-Year Plan” (https://www.gov.cn/) and “The National Land Subsidence Prevention and Control Plan (2011–2020)” focused on promoting a water-saving society, endorsing efficient irrigation technology, and curbing the exploitation of groundwater. With these plans, China’s agricultural water consumption and groundwater extraction decreased by 3.45% and 6.81%, respectively, from 2012 to 2016. Accordingly, specific solutions were adopted by regions and provinces to achieve the national targets. For example, transregional water diversion programs were proposed to alleviate the pressure of groundwater depletion in the north, such as the South-to-North Water Diversion that spans Eastern, Central, and Northern China. By diverting water to Beijing via the South-to-North Water Diversion, the groundwater depletion has decreased by about 3.7 km³, accounting for 40% of the total GWS recovery from 2006 to 2018 (Long et al., 2020). At the provincial level, some provinces have adopted their own groundwater protection policies, such as the “Administrative Measures for the Water Intake Permit System of Hebei Province” (http://slt.hebei.gov.cn/) and the “Groundwater Regulations of Shaanxi Province” (http://www.shaanxi.gov.cn/). In Hebei (North China), 1196 urban wells were closed in 2016, and the ecological water supplement in Shaanxi (Northwest China) increased by 68.28% from 2016 to 2020. China has implemented stricter measures to protect groundwater, and groundwater pumping during the period from 2016 to 2020 was 50% lower than that for 2012 to 2016; also, from 2016 to 2020, the ecological water supplement increased to be five times greater than it was in 2012–2016. The effects of these groundwater protection policies in more detail need to be evaluated in the future.
There were some limitations to this study. For example, 2002–2016 was chosen as the study period because WHGM data were only available up to 2016. As shown in Figure 1, the distribution of national-level stations is not uniform, which would have impacted the accuracy of the results, for example, the accuracy verification of the estimates of GWS derived from remote sensing data. As the groundwater monitoring system is extended, and more in-situ monitoring data become available, the verification accuracy can improve. Additionally, also because of data availability, the hydrological flux variables associated with the physical processes of groundwater changes were not considered, such as groundwater recharge from precipitation and surface water, withdrawals and pumping, capillary rise, and groundwater discharge to streams and lakes. The investigation was focused on the most relevant drivers of GWS change rather than quantifying the precise contribution of each factor. Therefore, when exploring the contribution of climatic and anthropogenic drivers, the collinearity of the variables should be considered. Moreover, as the main aim of this study was to identify the different impacts of human activities on GWS change, the study was based on administrative boundaries rather than natural aquifers.
5 Conclusion
Groundwater over-exploitation is a serious problem in numerous countries worldwide. This over-exploitation must be reduced to ensure the sustainable use and management of water resources. In this study, GWS change across China is presented. At multiple spatial and temporal scales using GRACE data, the impacts of drivers such as climate change and human activities are explored. It is considered how recently implemented policies affected GWS change.
GWS continued to decline at the national scale, but there were different trends at local and regional scales. GWS also showed temporal variation and changed between different time periods, with a narrowing of the gap between South and North, and a widening of the gap between East and West. The changes in the GWS and the drivers were inconsistent at the different spatial and temporal scales, because the variability in natural and anthropogenic characteristics in down-scale was offset in up-scale. At the national scale, the main drivers were precipitation and agricultural water consumption, while other social, economic, and demographic factors were important for the GWS changes at local and regional scales. Anthropogenic effects became more important as the spatial scale decreased, from the national scale to the regional and provincial scales. The findings highlight that targets are needed at multiple scales to deliver the national goal of GW protection. Policymakers face the challenge of finding a balance between the water demands and socioeconomic development, and setting targets to protect groundwater protection at multiple scales. This study builds on previous studies and, by presenting a perspective at different scales, provides new insights into the types of national, regional, and provincial strategies that are needed to protect groundwater resources. The approach we used can be applied in other countries, regions, or specific areas where there is severe stress on groundwater reserves.
Data availability statement
Publicly available datasets were analyzed in this study. This data can be found here: http://www2.csr.utexas.edu/grace.
Author contributions
XL mainly contributed to writing the draft, WL and DM had designed the whole research framework and drafted the manuscript, XB was responsible for related data processing, and LH contributed to the analysis.
Funding
The authors are grateful to the funding support from the National Natural Science Foundation of China (Grant 31971482), and the National Key Research and Development Program (Grant 2022YFF1301301).
Conflict of interest
The authors declare that the research was conducted in the absence of any commercial or financial relationships that could be construed as a potential conflict of interest.
Publisher’s note
All claims expressed in this article are solely those of the authors and do not necessarily represent those of their affiliated organizations, or those of the publisher, the editors and the reviewers. Any product that may be evaluated in this article, or claim that may be made by its manufacturer, is not guaranteed or endorsed by the publisher.
References
Abiy, A. Z., and Melesse, A. M. (2017). Evaluation of watershed scale changes in groundwater and soil moisture storage with the application of GRACE satellite imagery data. Catena 153, 50–60. doi:10.1016/j.catena.2017.01.036
Ahmad, A. Y., and Al-Ghouti, M. A. (2020). Approaches to achieve sustainable use and management of groundwater resources in Qatar: A review. Groundw. Sustain. Dev. 11, 100367. doi:10.1016/j.gsd.2020.100367
Alley, W. M., Healy, R. W., LaBaugh, J. W., and Reilly, T. E. (2002). Flow and storage in groundwater systems. Science 296 (5575), 1985–1990. doi:10.1126/science.1067123
Bai, X., Li, W., Lin, X., Han, L., and Ming, D. (2022). Reconciling regional water diversion and urban growth policies to protect groundwater across a large urban region in China. J. Hydrology 612, 128094. doi:10.1016/j.jhydrol.2022.128094
Bricker, S. H., Banks, V. J., Galik, G., Tapete, D., and Jones, R. (2017). Accounting for groundwater in future city visions. Land Use Policy 69, 618–630. doi:10.1016/j.landusepol.2017.09.018
Chen, H., Zhang, W., Nie, N., and Guo, Y. (2019). Long-term groundwater storage variations estimated in the Songhua River Basin by using GRACE products, land surface models, and in-situ observations. Sci. Total Environ. 649, 372–387. doi:10.1016/j.scitotenv.2018.08.352
Chen, L., and Ma, J. (2017). General survey report on groundwater Intake wells. Beijing: China Water and Power Press.
Chen, X., Hou, B., Zhou, Y., Wang, L., and Huang, Y. (2021). A comparative analysis of the spatial and temporal evolution of water use structure in geographical regions of China. China Rural Water Hydropower (06), 78–85+90.
Chen, X., Jiang, J., Lei, T., and Yue, C. (2020). GRACE satellite monitoring and driving factors analysis of groundwater storage under high-intensity coal mining conditions: A case study of Ordos, northern Shaanxi and Shanxi, China. Hydrogeol. J. 28 (2), 673–686. doi:10.1007/s10040-019-02101-0
Chen, Z., Jiang, W., Wang, W., Deng, Y., He, B., and Jia, K. (2018). The impact of precipitation deficit and urbanization on variations in water storage in the beijing-tianjin-hebei urban agglomeration. Remote Sens. 10 (1), 4. Available at: https://www.mdpi.com/2072-4292/10/1/4. doi:10.3390/rs10010004
Cuthbert, M. O., Gleeson, T., Moosdorf, N., Befus, K. M., Schneider, A., Hartmann, J., et al. (2019). Global patterns and dynamics of climate–groundwater interactions. Nat. Clim. Chang. 9 (2), 137–141. doi:10.1038/s41558-018-0386-4
Devineni, N., Perveen, S., and Lall, U. (2022). Solving groundwater depletion in India while achieving food security. Nat. Commun. 13 (1), 3374. doi:10.1038/s41467-022-31122-9
Döll, P., Müller Schmied, H., Schuh, C., Portmann, F. T., and Eicker, A. (2014). Global-scale assessment of groundwater depletion and related groundwater abstractions: Combining hydrological modeling with information from well observations and GRACE satellites. Water Resour. Res. 50 (7), 5698–5720. doi:10.1002/2014wr015595
DWRHP (2016). Hebei water resources bulletin 2002-2016. Hebei: Department of Water Resources of Hebei Province. Available at: http://slt.hebei.gov.cn/.
Famiglietti, J. S., Lo, M., Ho, S. L., Bethune, J., Anderson, K. J., Syed, T. H., et al. (2011). Satellites measure recent rates of groundwater depletion in California's Central Valley. Geophys. Res. Lett. 38 (3), 2010GL046442. doi:10.1029/2010GL046442
Frappart, F., and Ramillien, G. (2018). Monitoring groundwater storage changes using the gravity recovery and climate experiment (GRACE) satellite mission: A review. Remote Sens. 10 (6), 829. doi:10.3390/rs10060829
Fu, G., Crosbie, R. S., Barron, O., Charles, S. P., Dawes, W., Shi, X., et al. (2019). Attributing variations of temporal and spatial groundwater recharge: A statistical analysis of climatic and non-climatic factors. J. Hydrology 568, 816–834. doi:10.1016/j.jhydrol.2018.11.022
Gao, F., Wang, H., and Liu, C. (2020). Long-term assessment of groundwater resources carrying capacity using GRACE data and Budyko model. J. Hydrology 588, 125042. doi:10.1016/j.jhydrol.2020.125042
Gleeson, T., Cuthbert, M., Ferguson, G., and Perrone, D. (2020). Global groundwater sustainability, resources, and systems in the anthropocene. Annu. Rev. Earth Planet. Sci. 48 (1), 431–463. doi:10.1146/annurev-earth-071719-055251
Gong, H., Pan, Y., Zheng, L., Li, X., Zhu, L., Zhang, C., et al. (2018). Long-term groundwater storage changes and land subsidence development in the North China Plain (1971–2015). Hydrogeol. J. 26 (5), 1417–1427. doi:10.1007/s10040-018-1768-4
Herbert, C., and Döll, P. (2019). Global assessment of current and future groundwater stress with a focus on transboundary aquifers. Water Resour. Res. 55 (6), 4760–4784. doi:10.1029/2018wr023321
Hua, S., Jing, H., Yao, Y., Guo, Z., Lerner, D. N., Andrews, C. B., et al. (2020). Can groundwater be protected from the pressure of China's urban growth? Environ. Int. 143, 105911. doi:10.1016/j.envint.2020.105911
Huang, Z., Pan, Y., Gong, H., Yeh, P. J. F., Li, X., Zhou, D., et al. (2015). Subregional-scale groundwater depletion detected by GRACE for both shallow and deep aquifers in North China Plain. Geophys. Res. Lett. 42 (6), 1791–1799. doi:10.1002/2014gl062498
Huang, Z., Yeh, P. J. F., Pan, Y., Jiao, J. J., Gong, H., Li, X., et al. (2019). Detection of large-scale groundwater storage variability over the karstic regions in Southwest China. J. Hydrology 569, 409–422. doi:10.1016/j.jhydrol.2018.11.071
Jakeman, A. J., Barreteau, O., Hunt, R. J., Rinaudo, J.-D., Ross, A., Arshad, M., et al. (2016). “Integrated groundwater management: An overview of concepts and challenges,” in Integrated groundwater management: Concepts, approaches and challenges. Editors A. J. Jakeman, O. Barreteau, R. J. Hunt, J.-D. Rinaudo, and A. Ross (Cham: Springer International Publishing), 3–20. doi:10.1007/978-3-319-23576-9_1
Jia, X., Hou, D., Wang, L., O'Connor, D., and Luo, J. (2020). The development of groundwater research in the past 40 years: A burgeoning trend in groundwater depletion and sustainable management. J. Hydrology 587, 125006. doi:10.1016/j.jhydrol.2020.125006
Jin, S., and Feng, G. (2013). Large-scale variations of global groundwater from satellite gravimetry and hydrological models. Glob. Planet. Change 106, 20–30. doi:10.1016/j.gloplacha.2013.02.008
Lakshmi, V. (2016). Beyond GRACE: Using satellite data for groundwater investigations. Groundwater 54 (5), 615–618. doi:10.1111/gwat.12444
Liesch, T., and Ohmer, M. (2016). Comparison of GRACE data and groundwater levels for the assessment of groundwater depletion in Jordan. Hydrogeol. J. 24 (6), 1547–1563. doi:10.1007/s10040-016-1416-9
Liu, M., Jiang, Y., Xu, X., Huang, Q., Huo, Z., and Huang, G. (2018). Long-term groundwater dynamics affected by intense agricultural activities in oasis areas of arid inland river basins, Northwest China. Agric. Water Manag. 203, 37–52. doi:10.1016/j.agwat.2018.02.028
Long, D., Yang, W., Scanlon, B. R., Zhao, J., Liu, D., Burek, P., et al. (2020). South-to-North Water Diversion stabilizing Beijing's groundwater levels. Nat. Commun. 11 (1), 3665. doi:10.1038/s41467-020-17428-6
Long, D., Yang, Y., Wada, Y., Hong, Y., Liang, W., Chen, Y., et al. (2015). Deriving scaling factors using a global hydrological model to restore GRACE total water storage changes for China's Yangtze River Basin. Remote Sens. Environ. 168, 177–193. doi:10.1016/j.rse.2015.07.003
Martinho, V. J. P. D. (2020). Efficient water management: An analysis for the agricultural sector. Water Policy 22 (3), 396–416. doi:10.2166/wp.2020.191
Mo, H. (2021). Comprehensive evaluation of flood and flood in the yellow river basin based on gray correlation analysis. J. Geoscience Environ. Prot. 9, 13–24. doi:10.4236/gep.2021.91002
Müller Schmied, H., Cáceres, D., Eisner, S., Flörke, M., Herbert, C., Niemann, C., et al. (2021). The global water resources and use model WaterGAP v2.2d: Model description and evaluation. Geosci. Model Dev. 14 (2), 1037–1079. doi:10.5194/gmd-14-1037-2021
MWR (2011). Bulletin of first national census for water. Beijing: Ministry of Water Resources, PRC. Available at: http://www.mwr.gov.cn/sj/tjgb/dycqgslpcgb/201701/t20170122_790650.html.
MWR (2018). China water resources bulletin beijing: Ministry of water resources, PRC. Available at: http://www.mwr.gov.cn/sj/tjgb/szygb/.
Nanteza, J., de Linage, C. R., Thomas, B. F., and Famiglietti, J. S. (2016). Monitoring groundwater storage changes in complex basement aquifers: An evaluation of the grace satellites over East Africa. Water Resour. Res. 52 (12), 9542–9564. doi:10.1002/2016wr018846
NBSC (2019). China Urban statistical yearbook Beijing: National bureau of statistics of China, NBSC. Available at: http://www.stats.gov.cn/tjsj/ndsj/.
Panda, D. K., and Wahr, J. (2016). Spatiotemporal evolution of water storage changes in India from the updated GRACE-derived gravity records. Water Resour. Res. 52 (1), 135–149. doi:10.1002/2015wr017797
Pérez Hoyos, I. C., Krakauer, N. Y., Khanbilvardi, R., and Armstrong, R. A. (2016). A review of advances in the identification and characterization of groundwater dependent ecosystems using geospatial technologies. Geosciences 6 (2), 17. Available at: https://www.mdpi.com/2076-3263/6/2/17. doi:10.3390/geosciences6020017
Reddy, J. J., Varaprasad, B. J. S., and Reddy, P. V. (2021). Multi-objective optimization of erosion parameters of erodible soils using Taguchi-based gray relation analysis. Arab. J. Geosci. 14 (17), 1723. doi:10.1007/s12517-021-08192-y
Riedel, T., and Weber, T. K. D. (2020). Review: The influence of global change on Europe’s water cycle and groundwater recharge. Hydrogeol. J. 28 (6), 1939–1959. doi:10.1007/s10040-020-02165-3
Scanlon, B. R., Faunt, C. C., Longuevergne, L., Reedy, R. C., Alley, W. M., McGuire, V. L., et al. (2012). Groundwater depletion and sustainability of irrigation in the US high Plains and Central Valley. Proc. Natl. Acad. Sci. U. S. A. 109 (24), 9320–9325. doi:10.1073/pnas.1200311109
Tian, Y., Zhang, J., Wang, L. F., Li, Y. H., Li, T. T., and Liu, W. C. (2020). WDR5a functions in cadmium-inhibited root meristem growth by regulating nitric oxide accumulation in Arabidopsis. Planta 252 (02), 78–87+165166. doi:10.1007/s00425-020-03486-z
Ye, S., Xue, Y., Wu, J., Yan, X., and Yu, J. (2016). Progression and mitigation of land subsidence in China. Hydrogeol. J. 24 (3), 685–693. doi:10.1007/s10040-015-1356-9
Yi, P., Dong, Q., Li, W., and Wang, L. (2021). Measurement of city sustainability based on the grey relational analysis: The case of 15 sub-provincial cities in China. Sustain. Cities Soc. 73, 103143. doi:10.1016/j.scs.2021.103143
Yin, W., Hu, L., Zhang, M., Wang, J., and Han, S.-C. (2018). Statistical downscaling of GRACE-derived groundwater storage using ET data in the North China plain. J. Geophys. Res. Atmos. 123 (11), 5973–5987. doi:10.1029/2017JD027468
Zhang, X., Ren, L., and Feng, W. (2022). Comparison of the shallow groundwater storage change estimated by a distributed hydrological model and GRACE satellite gravimetry in a well-irrigated plain of the Haihe River basin, China. J. Hydrology 610, 127799. doi:10.1016/j.jhydrol.2022.127799
Zhao, Y., Luo, Z., Yu, Y., Chen, Y., Shugang, Z., and Qinghua, Z. (2020). Spatio-temporal changes of groundwater level and its driving factors in a typical region of Beijing-Tianjin-Hebei region, China. J. Nat. Resour. 35 (6), 1301–1313. Available at: http://www.jnr.ac.cn/CN/abstract/article_48573.shtml}. doi:10.31497/zrzyxb.20200604
Keywords: groundwater depletion, grace, multi-scales, driving factors, policy effect
Citation: Lin X, Li W, Bai X, Han L and Ming D (2022) Spatial variation in groundwater depletion across China under multiple stresses. Front. Environ. Sci. 10:1067766. doi: 10.3389/fenvs.2022.1067766
Received: 12 October 2022; Accepted: 18 November 2022;
Published: 08 December 2022.
Edited by:
Vikas Kamal, EHS Guru Sustainable Solutions Private Limited, IndiaReviewed by:
Chuanhao Wu, Jinan University, ChinaVirendra Bahadur Singh, University of Delhi, India
Sadaf Nazneen, Jamia Millia Islamia, India
Copyright © 2022 Lin, Li, Bai, Han and Ming. This is an open-access article distributed under the terms of the Creative Commons Attribution License (CC BY). The use, distribution or reproduction in other forums is permitted, provided the original author(s) and the copyright owner(s) are credited and that the original publication in this journal is cited, in accordance with accepted academic practice. No use, distribution or reproduction is permitted which does not comply with these terms.
*Correspondence: Weifeng Li, bGkud2ZAcmNlZXMuYWMuY24=