- 1Department of Earth System Sciences, Stanford University, Stanford, CA, United States
- 2Earth Surface Geochemistry, GFZ German Research, Centre for Geosciences, Potsdam, Germany
- 3Institute of Geological Sciences, Freie Universität Berlin, Potsdam, Germany
Earth’s biosphere is thought to exert a substantial influence on regolith evolution and chemical weathering rates. However, ecosystems are also highly efficient at retaining and recycling nutrients. Thus, when the ecological demand for rock-derived nutrients (e.g., P, Ca, K) exceeds the rates of regolith supply, ecological retention and recycling strategies can minimize nutrient limitations. To evaluate the balance between nutrient recycling and new nutrient input, we combined a plant model that drives growth according to foliar P levels with a weathering model that includes regolith rejuvenation via erosion and export via chemical weathering according to water flow, regolith thickness, mineral dissolution rates, secondary minerals, and nutrient storage in organic and mineral phases. We find that plant growth is strongly dependent on the total regolith nutrient inventory, resulting in a strong correlation between plant productivity and erosion. Increased water export or decreased regolith thickness diminish the total inventory of nutrient corresponding to lower rates of recycling and lower plant growth. In contrast, purported biogenic drivers of weathering, such as enhanced mineral dissolution, only support higher growth rates at high erosion rates. At erosion rates typical of the global land surface, more rapid mineral dissolution combined with enhanced formation of secondary minerals, depletes the inventory of mineral P, resulting in no benefit for plant growth. We also find that the increased chemical weathering export does not scale directly with plant growth. For example, accelerated mineral weathering does increase chemical weathering export but not potential plant growth. Conversely, thicker regolith is associated with a small increase in weathering export, but a large increase in potential plant growth. Collectively, when plant growth is coupled to regolith weathering our calculations suggest that plant productivity is not directly correlated with silicate weathering fluxes, and that biotic drivers of silicate weathering may only be effective at high erosion rates not typical at the Earth’s surface.
1 Introduction
Because the massive machinery of the biosphere requires rock-derived nutrients (RDNs), it is often assumed that the biosphere exerts a substantial influence on regolith evolution and chemical weathering rates (Kelly et al., 1998; Lucas, 2001; Berner et al., 2003; Pagani et al., 2009; Brantley et al., 2011). As evidence of this machinery, the solar energy captured by plants through photosynthesis exceeds uplift and erosional energy sources by orders of magnitude, suggesting that the geomorphic work performed by biota is a significant driver of landscapes and regolith (Phillips, 2009). In addition, as water percolates through the regolith, it acquires organic acids and dissolved CO2 from plants and microbial communities that, together with rock-inhabiting microorganisms, can accelerate the dissolution of the minerals that contain RDNs, primarily P, K, Ca, and Mg. The fraction of dissolved nutrients and other solutes exported from the regolith in turn sets the chemical weathering rate. Thus, if the biosphere does accelerate chemical weathering and ultimately the transfer of alkalinity to the oceans, then it acts to moderate the removal of atmospheric CO2 over million-year timescales.
Given that the availability of RDNs may limit plant growth (Agren et al., 2012), plant-induced weathering would appear to benefit plant productivity by increasing regolith nutrient inventories. However, accelerating the release of RDNs via weathering does not necessarily provide an advantage to plants. Over the time scales of regolith development (i.e., 1,000 s to 10,000 s of years), dissolved RDNs can either partition into secondary phases and become less available for plant uptake (i.e., occlusion) or be lost from the ecosystem by export as dissolved load (i.e., chemical weathering export). The ensuing nutrient loss can permanently deplete the RDN inventory, imposing limits on reutilization of dissolved nutrients following plant litter mineralization.
However, ecosystems are also efficient recyclers. For example, P recycling can sustain as much as 95%–100% of the net primary productivity (NPP) (Cleveland et al., 2013). For K, global budgets suggest that 97%–98% of the K released from dead vegetation is cycled back to plants each year (Chaudhuri et al., 2007). Even soluble major elements like Ca and Mg can be recycled up to 10 times after release by rock weathering and before export as dissolved load (Bullen and Chadwick, 2016; Schuessler et al., 2018; von Blanckenburg et al., 2021). To achieve such efficient recycling, plants can use diverse strategies, including internal storage facilitated by resorption (Chapin et al., 1990; Franklin and Agren, 2002; Castle and Neff, 2009; Reed et al., 2012); and symbiotic relationships with microbial communities (bacteria, fungi) that supply nutrients from plant litter directly to roots (Attiwill and Adams, 1993; Baskaran et al., 2017; Lang et al., 2017). The resulting nutrient pathways have been called the “organic nutrient cycle” (Uhlig and von Blanckenburg, 2019).
In the presence of a developed organic nutrient cycle, rock weathering is still important for plant growth. Loss of nutrient via dissolved exports must be replaced by “new” nutrient supplied from weathering of the regolith. This form of “new” uptake has been termed the “geogenic nutrient pathway” (Uhlig and von Blanckenburg, 2019). As a fraction of total plant uptake, new nutrient differs between elements and depends on the net demand by plants for a given element and the net dissolution rate. For example, typically more “new” Ca and Mg is supplied by weathering relative to plant uptake, compared to P, which is more efficiently recycled (Uhlig and von Blanckenburg, 2019) The geogenic nutrient pathway, which may also include dust inputs, thus prevents ecosystems from becoming depleted in essential RDN’s.
Across sloping landscapes, which comprise most of the Earth’s surface, erosion is the physical mechanism that ensures the replenishment of primary minerals. Erosion removes weathered products at the surface and introduces primary minerals from fresh bedrock into the regolith (defined here as the weathered layer above bedrock, including saprolite and soil) (Stallard and Edmond, 1983; Waldbauer and Chamberlain, 2005; West et al., 2005; Dixon and von Blanckenburg, 2012). This process, called regolith production, rejuvenates the concentrations of RDNs (Vitousek et al., 2003; Waldbauer and Chamberlain, 2005; Porder et al., 2007; Porder and Hilley, 2011), offsetting losses from physical erosion and chemical weathering. This rejuvenation is also an essential process in ecosystems characterized by low erosion rates, where weathered P is strongly partitioned into secondary minerals making it unavailable to plants (Walker and Syers, 1976; Vitousek and Farrington, 1997; Augusto et al., 2017). Accordingly, the replenishment of rock-derived nutrients depends on a continuous supply of primary minerals into the weathering zone.
In addition to erosion, other factors set the availability of nutrients in the weathering zone. One factor is the depth of the regolith, which controls the nutrient inventory (defined here as the depth-integrated mass of available nutrient in a column of regolith). When all regolith is equally accessible to root uptake, thicker regolith provides more nutrient for uptake and recycling, where uptake can extend to depths of 10 m in both arid (McCulley et al., 2004) and humid climates (Uhlig et al., 2020). A second factor is water infiltration. Large differences between precipitation and evapotranspiration, or high net infiltration, result in deeper regolith (larger nutrient inventory) but also higher chemical weathering export (larger export of nutrient in dissolved form) (Lebedeva and Brantley, 2018). The organic and geogenic pathways are thus interacting with tectonic (erosion), geochemical (regolith thickness and water flux) and hydrologic processes in complex ways.
The fraction of new nutrient available for uptake can also be impacted by biogenic processes. According to the functional equilibrium model, plants allocate resources towards roots when belowground nutrient levels decrease (Wilson, 1988; Poorter and Nagel, 2000). In addition to increased root biomass and activity, enhanced mineral dissolution driven by microbial and fungal communities is associated with localized etching at the surfaces of minerals (van Scholl et al., 2008; Bonneville et al., 2009). However, accelerated rates of mineral dissolution over long time intervals depletes the primary mineral. Thus, although increases in biogenic dissolution may be beneficial for short-term nutrient limitations, it may be of limited long-term utility for ecosystems where the replenishment of RDNs is limited by slow tectonic rejuvenation. Biogenic weathering also interacts with the organic and geogenic pathways, creating the potential for positive feedbacks between accelerated mineral dissolution and nutrient availability that enhance plant growth, or a negative feedback that diminishes nutrient availability and plant growth.
Model approaches have played a key role in understanding these plant-regolith interactions. For example, Porder et al. (2003) used a soil production function to show how available P varies as a function or erosion rate or soil age. Subsequent models have built on these formulations to include plant uptake, soil moisture dependence, and partitioning of P between different soil reservoirs (Buendia et al., 2010; Wang et al., 2010; Buendia et al., 2014). These latter models have primarily focused on abiogenic P availability and supply, and as such have not examined the ways in which plants modulate the supply, uptake and export of RDNs. Here, we consider gradients in erosion and climatic settings to evaluate the extent to which plant growth depends on regolith properties, as evidenced by (1) variable recycling ratios (defined here as the ratio of the uptake rate to the mineral dissolution rate) and (2) variable relationships between plant productivity and chemical weathering export. We hypothesize that thicker regolith (higher chemical weathering export) and lower water fluxes (lower chemical weathering export) both benefit plant growth by enlarging the RDN inventory and increasing the recycling ratio, whereas biogenic enhancement of mineral dissolution rate increases the chemical weathering export but does not benefit plant growth or recycling capacity.
To test this hypothesis, we construct a generalized regolith-plant model by considering a primary “reactor” comprising the regolith, and a secondary reactor, the plant biomass. We consider a range of regolith parameters that could differentially affect both plant growth (through nutrient inventory in the regolith) and chemical weathering export (through mineral dissolution rate law, erosion rate and water flow). This structure allows us to evaluate the ways in which plants may interact with the regolith to alter the balance between chemical weathering export and nutrient cycling. Specifically, we evaluate the following scenarios.
1) Variations in regolith depth due to geology (abiotic) and/or the accessible fraction of regolith due to differences in root uptake, distribution, architecture and morphology (Schenk and Jackson, 2002; Giehl and von Wiren, 2014),
2) Differences in water flux due to soil type and climate (abiotic) or capture and redistribution of water in the root zone (Schymanski et al., 2008; Tang et al., 2016; Brantley et al., 2017)
3) Biogenic weathering, including enhanced mineral dissolution due to symbiotic microbial communities and organic acid exudates (Blum et al., 2002; Hoffland et al., 2003; Bonneville et al., 2009; Ponge, 2013; Bowsher et al., 2016), or production of belowground CO2 via soil respiration that alters soil pH (Berner, 1992; Winnick and Maher, 2018; Stolze et al., 2023).
Scenarios (1)–(3) above are examined by comparing variations in model parameters to a reference model over a range of erosion rates. In contrast to previous models, we consider the abundance of primary minerals (a source of Ca, Mg, K) and an accessory mineral (source of P). To focus on the long-term consequences of plant-regolith interactions, we evaluate the model at steady state, as opposed to transient regolith development associated with chronosequences and/or successional processes (Walker and Syers, 1976), although the model could be adapted to consider transient growth and nutrient dynamics.
2 Materials and methods
2.1 Conceptual model
To link plant nutrient cycling to rejuvenation and removal of nutrients via erosion, we constructed a simplified plant-growth model and coupled it to a regolith weathering model. This combination allowed us to evaluate the direct competition between plant uptake and decomposition (organic pathways) and partitioning into sorption, water flow and erosion (geogenic nutrient pathways). The major reservoirs, in italics below, allow for partitioning of RDNs between the plants (bio) and the regolith (reg) and also determine the magnitude of the fluxes (Figure 1). RDNs, contained in primary minerals (M) derived from the bedrock (prim), such as Ca or K, are either eroded, dissolved (dis), partitioned into secondary minerals (sec), or taken up by plants. The dissolved solute pool is susceptible to flushing (Q), setting the chemical weathering export from the regolith. The primary minerals (e.g., feldspars, biotite), which contain both plant-essential and plant-beneficial elements (e.g., K, Ca, Mg, Si and Fe), comprise the bulk of the mass loss via chemical weathering export. We also consider P, supplied by accessory minerals in the bedrock, primarily apatite. Accessory minerals have different dissolution rates and rate dependences than the major primary minerals and can also be targets for preferential attack by microorganisms, mostly mycorrhizal fungi. Phosphorous is strongly sorbed (sorb) by secondary minerals produced from weathering (Arai and Sparks, 2007), and over time a fraction of the P becomes occluded (occ) or irreversibly incorporated into secondary Al and Fe hydroxides (Walker and Syers, 1976; Yang and Post, 2011).
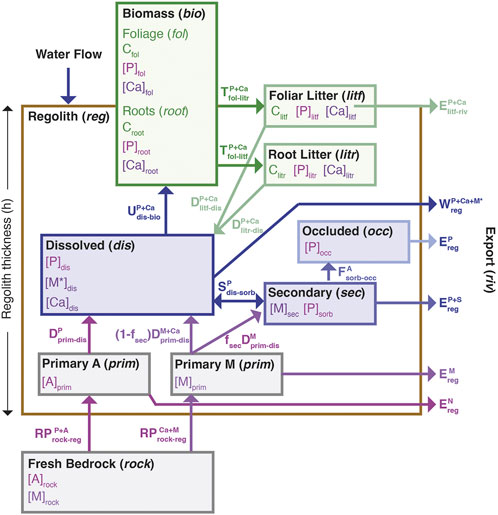
FIGURE 1. Conceptual model of plant nutrient uptake and exchange with regolith. The main reservoirs are shown as boxes with the relevant concentrations (square brackets) indicated. The brown box delineates all sub-compartments of regolith. The fluxes are shown by arrows. Phosphorous (P) is assumed to be the limiting nutrient supplied by an accessory mineral [A]prim, and calcium (Ca) is assumed to be a luxury nutrient supplied by a primary mineral [M]prim.
Plant roots extract nutrients (e.g., Ca, and P) from the dissolved pool as a function of the solute concentrations and root density (root). As foliar tissues (fol) senesce, a fraction of the nutrient is returned to the regolith due to decomposition of both dead roots, termed root litter (litr) and foliar litter (litf). The nutrient released is re-partitioned between the dissolved and sorbed reservoirs and transferred into the occluded pool as above. The sorbed nutrient pool can thus become the predominant reservoir of nutrient when the supply from primary mineral dissolution is limited at low regolith production (erosion rates). In addition to removing primary, secondary and accessory minerals, erosion can also remove a fraction of the nutrient in the litf reservoir, reducing the amount that is cycled between regolith and plants.
Below we present the model formulation in a general way, where the limiting nutrient is assumed to be P [P]i, supplied via apatite dissolution (where i is the reservoir outlined above and in Figure 1 and [P]i denotes the concentration of P in reservoir i), and the major element derived from the primary mineral is [Ca]i, allowing us to compute the concentrations and stoichiometry of the foliage over a range of erosion rates. Individual parameters are then varied to understand the role of key model parameters to assess in a general way how ecosystem growth is maximized across a range of regolith rejuvenation rates.
2.2 Nutrient uptake model
2.2.1 Growth-limiting nutrient uptake
The growth of plants and the associated nutrient stoichiometry is assumed to set the nutrient demand of the ecosystem (Huston and Deangelis, 1994; Agren, 2008; Agren et al., 2012). Accordingly, we track the active plant carbon inventory, Cbio, as the sum of the foliar (Cfol) and root biomass (Croot). Although the model is general, it is parameterized as a broadleaf deciduous forest to represent a mature tropical forested ecosystem (Table 1). Plants are known to invest resources in belowground biomass when a soil nutrient [P]i is limiting and hence the root-to-foliar mass ratio (γrf) defines the allocation of biomass between the foliage and roots (Wilson, 1988). This allocation controls how nutrients are acquired and returned to the regolith reservoirs. Because erosion removes the upper layers of soils, including litter, this proportion can affect the overall nutrient cycling. The net rate of C assimilation is thus calculated as the balance between growth rate (
where δ is the fraction of carbon allocated to microbial community, Gmax is the maximum plant nutrient productivity and b encompasses the factors limiting plant productivity, such as shading, and is on the order of 0.1 for forested ecosystems, [P]fol is the nutrient concentration in the foliage, and the mortality is described as the sum of foliar mortality (μfol) and root mortality (μroot). The mean lifetimes for foliar and root tissues are equal to 1/μfol and 1/μroot, respectively and are treated as unknowns, along with [P]fol, to allow
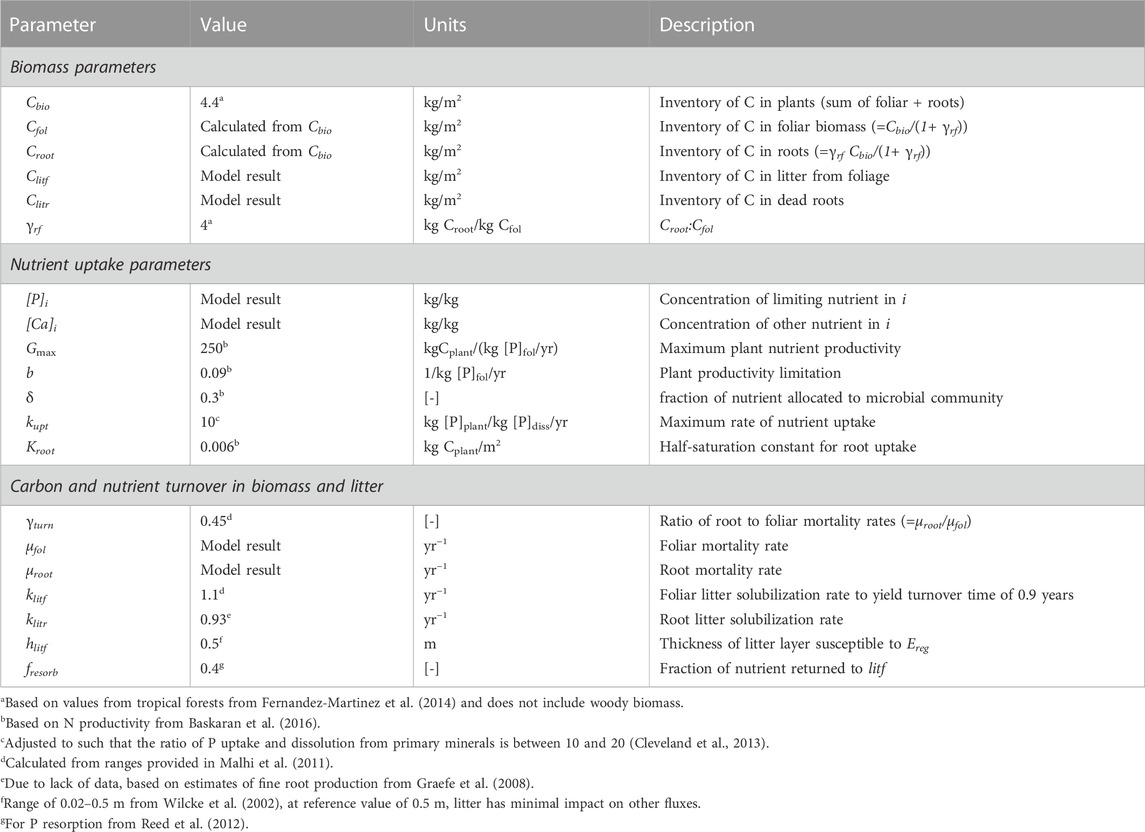
TABLE 1. Parameter values and descriptions for nutrient uptake equations. Parameters computed using the model framework are designated as “model result”, whereas for other values the range considered is provided with the “reference” value in parentheses. The reservoir is indexed according to i as described in text and Figure 1 (i =bio, fol, etc.). [-] denotes unitless parameter.
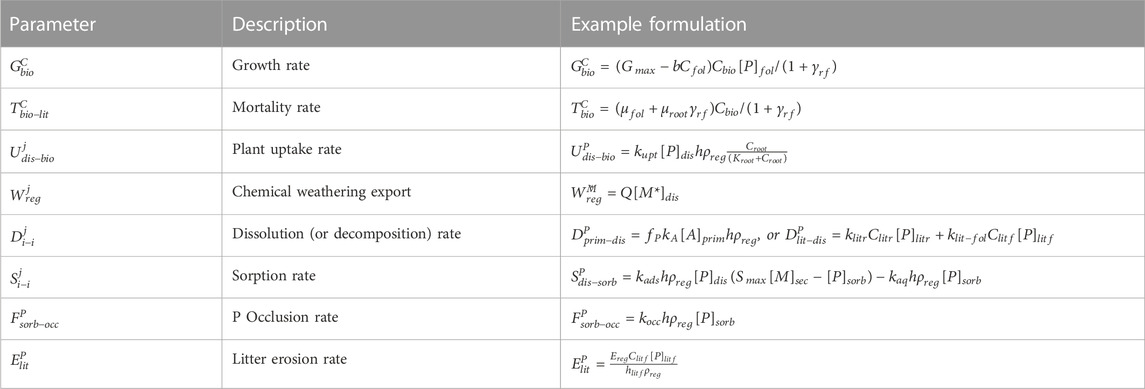
TABLE 2. Model computed fluxes where j corresponds to the element (e.g., P, Ca) or component (e.g., M, A, etc.) and i corresponds to the reservoir, such that the first index shows the original reservoir and the second the reservoir to which the flux is transferring mass.
We ignore woody stems as we assume their turnover is negligible relative to the foliar and root reservoirs (e.g., Raich and Nadelhoffer, 1989; Baskaran et al., 2017). Although wood can dominate the total biomass, nutrient concentrations in wood are typically a factor of 10 lower relative to leaves and roots (Heineman et al., 2016), while the turnover time of woody biomass is approximately 20–50 times slower than root and foliar rates, respectively (Malhi et al., 2011). Due to the low nutrient levels and slow turnover rates of wood, the nutrient fluxes associated with foliar and root compartments are on the order of 30–50 times the wood fluxes and thus negligible in a steady-state model.
As overall biomass increases, nutrient uptake cannot increase indefinitely because roots will compete for the same resources. Thus, the uptake (
where kupt is the maximum uptake rate, [P]dis is the dissolved P concentration per mass of regolith, and hρreg is the mass of the regolith such that
The foliage and roots that senesce enter the litter reservoirs such that γrf,
where klitf [yr−1] is the leaching rate of the litter, Clitf/hlitfρreg is the fraction of litter in the surface layer of regolith that is eroded in proportion to the regolith erosion rate (Ereg), the fraction of litf in the regolith that can be eroded, hlitf, and the regolith bulk density, ρreg. The value of hlit effectively determines the mass of litter eroded relative to the mass of regolith and thus as it approaches zero, removal of litter is nearly complete and nutrient cycling and plant growth is greatly diminished. Weathering mass balance and metal isotope studies have provided potential evidence for plant litter erosion as expressed via the deficit in dissolved export fluxes of plant-beneficial elements (Frings et al., 2021; von Blanckenburg et al., 2021). Unfortunately, there are very few parameterizations of litter erosion outside of agricultural settings. Here, we adopt a reference value of 0.5 m such that litter erosion does not impact the other fluxes. For the model parametrization here, the value of hlit begins to impact results at high erosion rates when it approaches less than 50 mm in thickness.
We use a similar equation to track the concentration of nutrient in the foliar litter ([P]litf) as a function of input from senescing foliage (
The nutrient dissolved from litter is returned to the dissolved nutrient pool.
Similarly, root mortality allows for the accumulation of dead roots, Clitr, and organically bound nutrient [P]litr, which are returned to the dissolved nutrient pool via decomposition, klitr [yr−1]:
For modeling a limiting nutrient, such as P, Eq. 1 through (6) are used and the parameters are defined in Table 1 based on available parameters for tropical broadleaf deciduous forests, which are more likely to be P-limited (Augusto et al., 2017). Accordingly, the reference value for Cbio of 4.4 kg m2 is typical of tropical forests (root = 3.5 kg/m2; foliar = 0.9 kg/m2); (Fernandez-Martinez et al., 2014). At steady state (dCbio/dt = 0, d[P]bio/dt = 0), high growth rates correspond to greater biomass and high [P]dis and high [P]fol (Figure 2A). At a given growth rate, the lower biomass system corresponds to higher [P]dis and [P]fol. For a static biomass, these relationships result in greater biomass P inventories when growth rates are high (Figure 2B). In general, the model reproduces the observed relationships between growth rate and foliar concentrations (e.g., Agren, 2008) and shows that for a given growth rate, foliar and dissolved concentrations are higher for the lower Cbio (e.g., Elser et al., 2010).
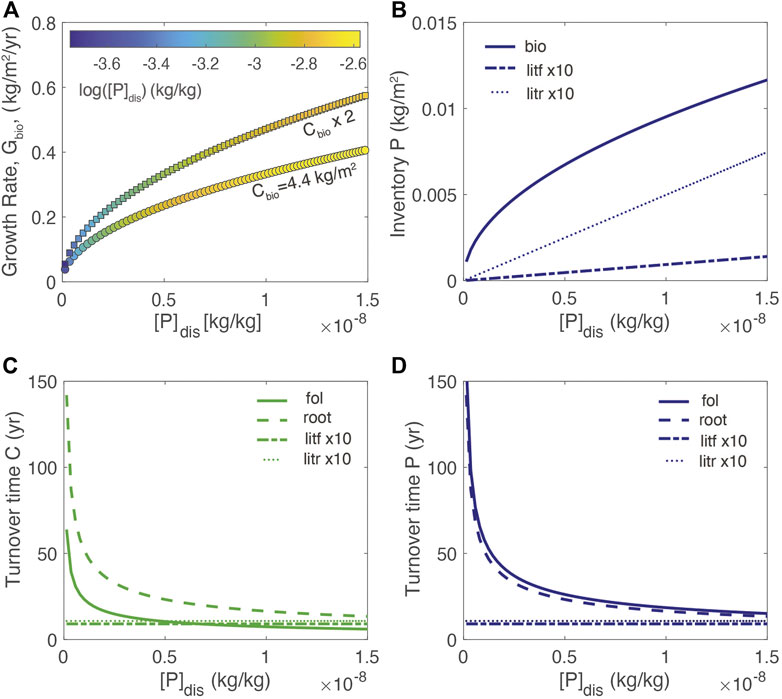
FIGURE 2. (A) Growth rate at different values of [P]dis for two different values of total biomass, Cbio. The color-scale shows [P]fol; (B) inventory of P in root and foliar biomass and litter (C) dependence of turnover time of biomass carbon in the foliage, root, and litter reservoirs on [P]dis; (D) dependence of turnover time of P in the foliage, root, and litter reservoirs on [P]dis. Turnover time is calculated as the quotient of the inventory of nutrient in a particular reservoir, divided by the flux of nutrient out of the reservoir. See Table 1 for additional parameter information.
The resulting turnover times of carbon and P in various reservoirs as a function of [P]dis (where turnover time is defined as the biomass inventory divided by flux out of the reservoir) are shown in Figures 2C, D. As growth (mortality) rates decrease with decreasing [P]dis, the turnover times of foliar and root biomass approach 50–100 years, respectively. In contrast, the litter turnover times remain static because the dissolution rate increases as the inventory increases due to the first-order kinetics. The model results for foliar turnover are in the range of turnover times for aboveground biomass in tropical forests of between 5 and 98 years (Clark et al., 2001).
2.2.2 Plant-essential nutrient uptake
Plants also acquire nutrients that are not necessarily limiting to growth. Such uptake can result in variable foliar chemistry (Elrifi and Turpin, 1985; Agren, 2008) that provides additional information about biogenic cycling relative to the regolith nutrient status. In order to track such uptake for [Ca]i, a parallel set of equations for Eqs 2, 4, 6 are used where [P]i is replaced by [Ca]i. However, the growth rate is defined in Eq. 1 depends only on [P]fol. This results in a system of eight equations for the plant portion of the model, which are coupled to the dissolved nutrient concentrations in the regolith via uptake and the dissolution of the root and foliar litter. The different regolith dynamics ascribed to each element are developed below.
2.3 Regolith weathering model
2.3.1 Weathering model for primary minerals
The mass balance model for the regolith includes soil and the weathering zone beneath it. Regolith thickness can thus be defined by the distance between the surface and the depth of the weathering front. Although an exponential relationship between the thickness of the mobile soil layer and the supply of material into the soil is commonly assumed (Heimsath et al., 1997), no such relationship has been found to describe the thickness of the regolith (Pelletier et al., 2016), and regolith thickness has been thus assumed to be limited by either the extent of the vadose zone (Rempe and Dietrich, 2014), fracturing (St Clair et al., 2015), the depth of iron oxidation (Bazilevskaya et al., 2015), or all of the above.
A framework has been developed to relate regolith thickness (h) to flow rate and erosion rate (Lebedeva et al., 2010; Lebedeva and Brantley, 2018). This framework predicts that h varies only minimally with erosion rate (Table 3) and thus we treat h as a constant that is independent of erosion rate (Figure 1). In order to maintain a constant h, the removal of material via erosion
where [M]rock is the concentration of primary mineral in the unweathered bedrock and ρreg is the bulk regolith density. The rate of dissolution
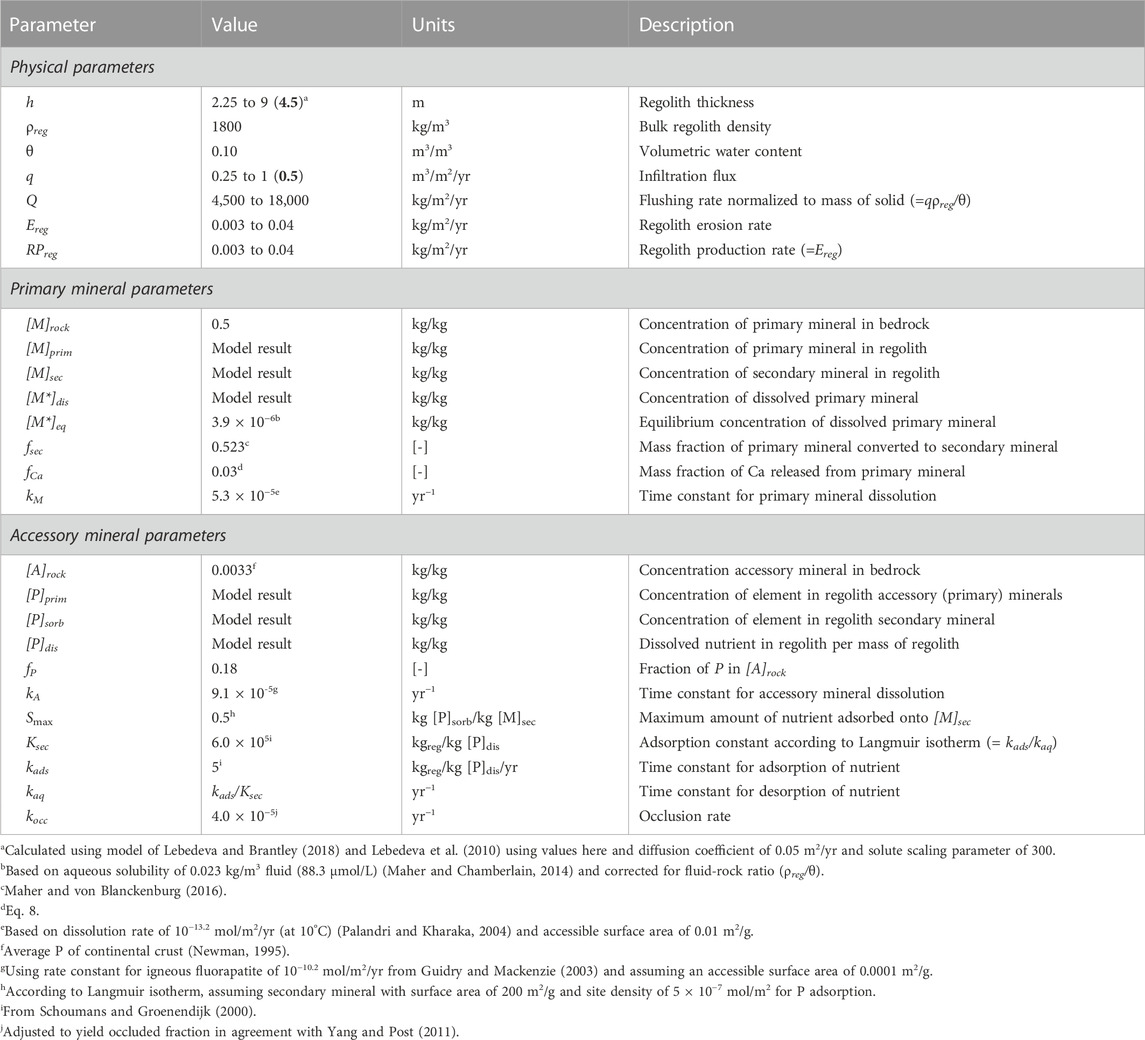
TABLE 3. Parameter values and descriptions for regolith weathering equations. Parameters computed using the model framework are designated as “model result”, whereas for other values the range considered is provided with the “reference” value in bold in parentheses. [-] denotes unitless parameter.
The stoichiometry of the weathering reaction constrains the amount of secondary mineral in the regolith [M]sec, and dissolved solute [M*]dis. For example, plagioclase is converted to kaolinite via:
Although a simplification of typical bedrock compositions, plagioclase is the mineral that often controls the advancement of the weathering front at depth and the solute evolution along the flow path (Maher et al., 2009; Lebedeva et al., 2010). Accordingly, the [M*]eq and kM are calculated using the stoichiometry of Eq. 8 (Winnick and Maher, 2018).
As weathering progresses, secondary minerals [M]sec, such as clays and oxy(hydr)oxides accumulate according to the balance of primary mineral dissolution and removal via erosion:
where fsec is the mass fraction of primary mineral converted into secondary mineral according to Eq. 8, which depends on the stoichiometry of the reactions. For plagioclase weathering to kaolinite, this value is typically 0.523 (Maher and von Blanckenburg, 2016).
The concentration of dissolved primary mineral [M∗]dis.is thus set by the balance between the net rate of primary mineral dissolution (
This equation enables us to compute the weathering rate from the value of [M∗]dis.. In order to maintain consistent units, the flushing rate, Q, depends on the infiltration rate, q [m/yr], and the mass of solid to volume fluid ratio, or ρreg divided by the water content (θ). This expresses the volumetric flushing rate normalized by the mass of regolith, consistent with the dissolved concentrations that are also expressed in terms of mass of regolith.
Plants extract from and return nutrients to a well-mixed dissolved pool according to
where fCa describes the mass fraction of Ca associated with primary mineral. We assume no incorporation of Ca into secondary minerals consistent with kaolinite formation.
Here, fCa is used to weight the
2.3.2 Weathering model for accessory phase nutrient
Following the approach outlined above, we track the transfer of the limiting nutrient ([P]i) from accessory phases contained in the bedrock to the partitioning among the primary, secondary, dissolved and plant pools. For an accessory mineral, such as apatite, the equation is similar to the primary mineral mass balance in Equation 8:
where [A]prim is the concentration of the accessory mineral in the regolith, [A]rock is the concentration in the bedrock, kA is the time constant for accessory mineral dissolution, here reflective of a first-order dependence of the dissolution rate on [A]prim. Assuming no secondary mineral precipitation, the concentration of P in the primary minerals in the regolith is a function of fP, or the fraction of P in [A]prim, allowing for Eq. 13 to directly track [P]prim (not shown).
A fraction of P that is dissolved [P]dis will be partitioned into storage associated with [M]sec. The resulting secondary mineral reservoir [P]sorb, exchanges with dissolved nutrient according to the exchange rate between the dissolved and the accessory phase, while over time a fraction is partitioned irreversibly into the occluded fraction,
The sorption
The corresponding dissolved fraction receives nutrient from dissolution of the litter and dead root fractions and the secondary pool while nutrient is removed via sorption and water flushing:
Finally, the occluded fraction is represented by a separate pool as:
Another potential nutrient input to the regolith is atmospheric deposition (Schlesinger et al., 1982; Arvin et al., 2017; Wang et al., 2017). Exogenous inputs would supplement the rock-derived nutrient supply, acting as an additional source of dissolved nutrient to the system that could be taken up by plants. These are currently not included in the calculations but could be added as inputs via Eqs 7, 11 accordingly. For P, atmospheric deposition in the Holocene is not considered to be a globally important source relative to bedrock supply (Cleveland et al., 2013) although atmospheric Ca input can constitute a larger input in highly weathered or marine aerosol-influenced ecosystems (Clow et al., 1997; Kennedy et al., 1998).
3 Numerical methods, steady-state treatment and sensitivity test
3.1 Numerical methods
The differential mass balance equations outlined above are solved simultaneously at steady state using Newton-Raphson iteration, as implemented in the Matlab R2017b fsolve function. The resulting system of 17 equations are built from: Eqs 1–6 for carbon and the limiting nutrient P, with Eqs 2, 4, 6 repeated for the major element, Ca; Eqs 7, 9, 11, 12 for the primary mineral and nutrient Ca, and Eqs 13–16 for the limiting accessory mineral nutrient. The Matlab input files are available in Supplementary Material. With this system of equations, we are limited to 17 unknown variables, which are also detailed in Tables 1, 3 along with the constitutive equations. The equations presented above are evaluated here in the steady-state case where the input and output fluxes of elements must balance for each reservoir. For the plant C balance, the amount of total C in biomass is assumed, also fixing the Croot and Cfol reservoirs (Baskaran et al., 2017). In order to maintain steady-state Cbio despite nutrient-driven gross productivity, Equation 1 is solved for the bulk mortality rate (μfol + μrootγrf). The remaining equations are solved for either the reservoir (Clitr, Clitf) or the concentration ([P]bio [P]litf [P]litr [P]prim [P]sorb [P]dis [P]occ [Ca]bio [Ca]litf [Ca]litr [Ca]dis [M]prim [M*]dis [M]sec).
3.2 Model assumptions and reference model
Model results in the following section are shown for an assumed value of Cbio typical of tropical forests (4.4 kg/m2). The assumption of steady-state Cbio is consistent with a mature forest ecosystem and the concept of equilibrium nutrient distribution (Waide et al., 1974; Loreau, 1998; Baskaran et al., 2017), rather than a successional one where dCbio/dt is dynamic and non-zero. The approach here could be extended to non-steady-state conditions if appropriate ecological and weathering parameters exist to further constrain the additional 17 unknowns that a non-steady state treatment would require. Additional growth factors, such as water limitation, and resource competition between species, are not included. We also assume that ecosystems can adapt to changing environmental conditions but make no assumptions about how this occurs (e.g., trait expression, species migration, etc.).
The erosion rate in the model is treated as an independent variable based on known relationships between erosion and weathering. We vary Ereg from 0 to 400 t/km2/yr, consistent with the range of rates observed in global soil erosion data (Dixon and von Blanckenburg, 2012).
3.3 Scenarios for plant-weathering interactions
Based on the four drivers of plant-weathering interactions identified above, we vary relevant model parameters relative to the reference model to create three scenarios (Tables 1, 3).
1) Enhanced root uptake via changing regolith thickness, root distribution or root architecture. We vary regolith thickness (h) over a range of 2.25–9 m. This is consistent with maximum rooting depths of tropical shrubs and the global mean rooting depth mean for trees of ca. 6 m (Schenk and Jackson, 2002).
2) Changes in water flow due capture and redistribution of water in the root zone. We vary q from the average global runoff of 0.5 m/yr to 0.25 and 1 m/yr, holding regolith thickness constant at 4.5 m.
3) Combined enhancement of mineral dissolution and soil CO2. To assess interactions between individual parameters we simultaneously increase kA, kM, and [M*]eq by a factor of 10 over the reference model.
4 Results
4.1 Regolith weathering
4.1.1 Regolith composition as a function of erosion and for variable flow rates
At steady state, regolith compositions and associated abiotic fluxes should be independent of the biomass growth rate: a steady-state plant reservoir without appreciable nutrient loss should not affect the regolith mass balance because the uptake by plants and return of nutrient must balance. The resulting steady-state primary mineral and nutrient concentrations and rates match the expected trends as a function of erosion rate (Figure 3). Notably, at higher erosion rates, there is a greater amount of primary silicate mineral in the regolith whereas the amount of secondary mineral is diminished. At low erosion rates,
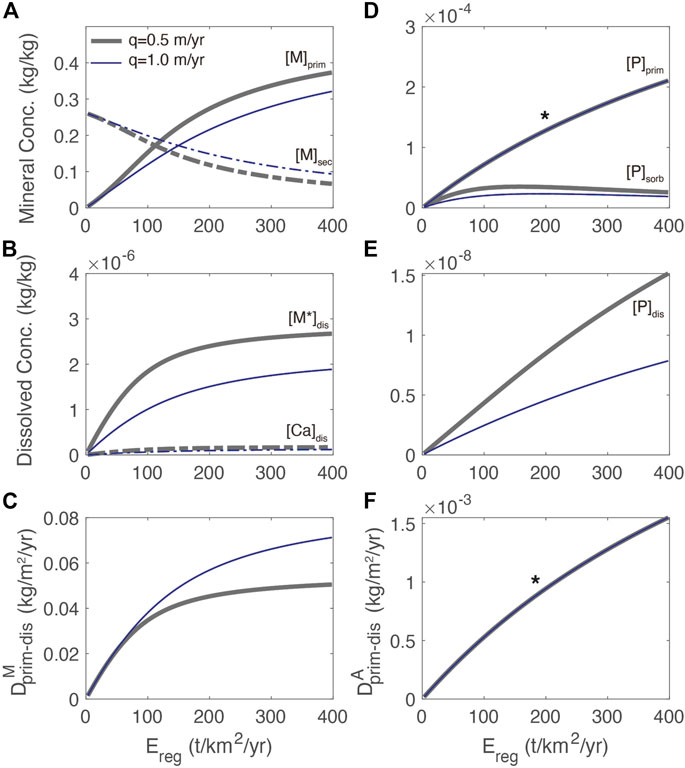
FIGURE 3. Regolith weathering model showing (A) concentrations of primary mineral [M]prim, and secondary mineral [M]sec as a function of total erosion rate, Ereg, for two different flow rates. Reference model of q = .5 m/yr shown in green is approximately global runoff, q = 1 m/yr is more typical of tropical systems; (B) concentration of dissolved primary mineral and Ca dissolved thereof (C) dissolution rates of primary mineral; (D) accessory primary mineral [A]prim, and sorbed P [P]sorb (E) dissolved P [P]dis; and (F) dissolution rate of [A]prim. Note that in (D) and (F), the * indicates two flow rates have identical primary mineral and dissolution rate profiles, respectively.
The results of the regolith weathering model have several implications for the distribution of P as a function of erosion (Figures 3D–F). The first is that both [A]prim and [P]dis are approximately proportional to the erosion and less sensitive to water flux due to the first-order rate law used (Figures 3D, E). The second is that formation of secondary minerals associated with primary minerals is an important control on [P]sorb, which shows a maximum at an erosion rate of about 75 t/km2/yr (Figure 3D). The maximum in [P]sorb is due to the greater amount of secondary minerals and increased supply of P to the dissolved reservoir as the erosion rate increases. The subsequent decrease in [P]sorb is associated with the declining abundance of secondary minerals at high erosion. The third implication is that [P]dis is also higher at a lower flow rate due to reduced export, even though the dissolution rate is less sensitive to flow rate compared to the [M]prim profile in Figure 3A due to the first-order rate law.
4.1.2 Speciation of P in the regolith (and resulting foliar P concentration)
The distribution of the major regolith P pools in the reference model is shown in Figure 4. The concentrations in the regolith are assumed to be uniform over the entire regolith thickness and are compared to a database of soil P speciation, defined operationally as Hedley P fractions (Hedley and Stewart, 1982). These fractions were tabulated for uncultivated soils across the major soil orders and assumed to represent the A horizons of soils, or the upper 15 cm of the regolith (Yang and Post, 2011). The Hedley P fractions are presented according to soil order, from typically less weathered Andisols to more weathered Oxisols and the Hedley P fractions are grouped according to the model definitions used here. To compare to measured values, the organic pool in the model [P]org is calculated as the sum of the root and litter pools distributed over the entire regolith. The model averages over h, whereas the measurements mostly represent the upper 15 cm of the soil profiles. This effect of depth averaging is apparent in comparing the [P]org values to literature values (Uhlig et al., 2020). In general, the reference model approximates the distributions of P observed across a broad range of soil orders and captures the trend of lower concentrations in older more deeply weathered soils (low erosion rates) and higher concentrations in younger and less weathered soils (high erosion rates).
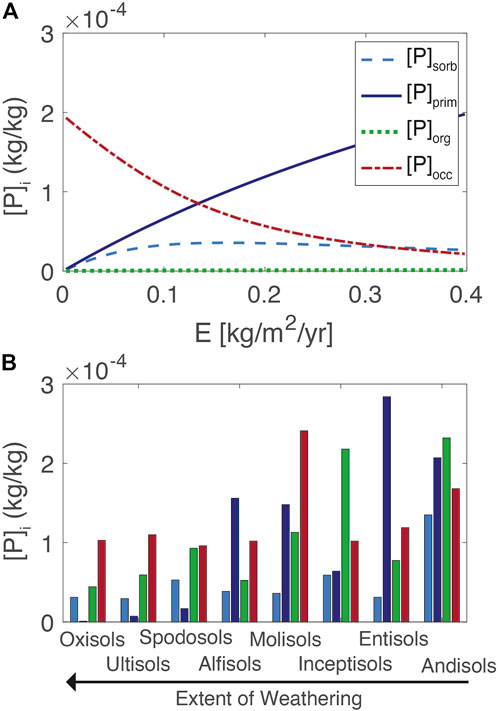
FIGURE 4. Model soil P fractions (A). For comparison, values from major soil orders calculated from the database of Yang and Post (2011) are shown, where the extent of weathering increases from right to left, expected to be inverse to erosion rate (B). Model values are averaged over 4.5 m of regolith whereas the database reflects the shallow soil (ca. Upper 15 cm).
4.1.3 Comparison to observed weathering fluxes
To evaluate the regolith model, we compare the chemical weathering export of [M*]dis and [P]dis to measured values (Figure 5A). Using the parameters in Table 3,
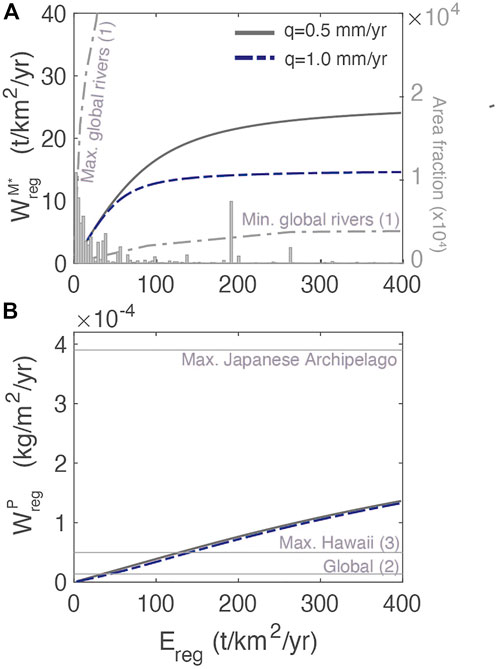
FIGURE 5. Weathering fluxes as a function of total regolith erosion rate for dissolved primary mineral [M*]dis (A) and for dissolved phosphorus (B). In (A) and right axis, histogram of the distribution of global erosion rates with data from Milliman and Syvitski (1992). Comparison to other estimates include: (1) the range of dissolved fluxes from Dixon and von Blanckenburg (2012), (2) the maximum observed P flux in the Japanese Archipelago and the global estimate (both from Hartmann and Moosdorf, 2011), and (3) young soils from Hawaii (Chadwick et al., 1999).
4.2 Organic fluxes and mass balance
4.2.1 Dominance of organic fluxes
At steady state, the fluxes among the reservoirs must balance. From the perspective of the regolith, dissolved nutrients supplied by primary mineral and litter dissolution are removed by uptake into plants, chemical weathering export and the sorbed fraction:
These input and removal fluxes are shown as a function of erosion rate in Figure 6. Litter decomposition and uptake are of the same magnitude as required to balance the biomass reservoir (litter erosion, which is negligible in the reference model, adds an additional loss term). Similarly, the input fluxes of [Ca]dis and [P]dis via dissolution are roughly balanced by the weathering rate. Even though there is an appreciable pool of [P]sorb at moderate erosion rates (Figure 3D), the rate of net sorption is small at steady state but there is a small net flux of P to the secondary phase reservoir due to the irreversible transfer of P into the occluded fraction. Because occlusion occurs via the secondary phase reservoir, occlusion is not specifically included in Figure 6 but is reflected in the net flux to the secondary P reservoir.
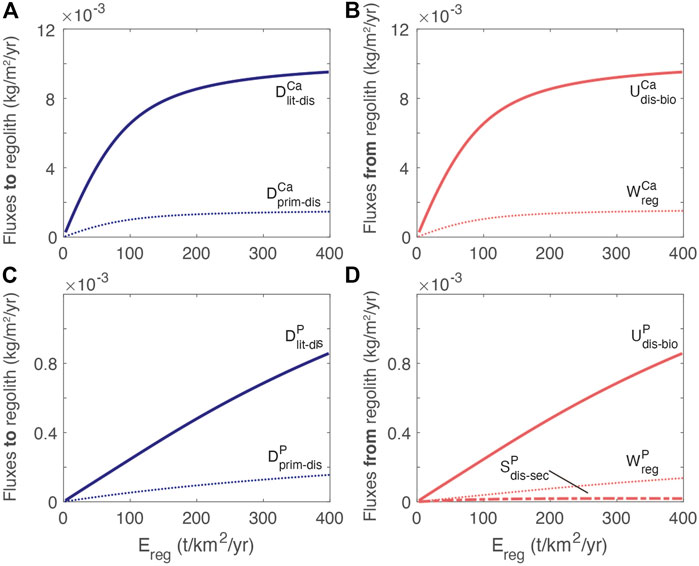
FIGURE 6. Exchanges between reservoirs. (A) Ca fluxes into dissolved regolith pool from mineral dissolution (
The dependence of the Ca fluxes on erosion rate differs from P because of the different rate laws (Figure 3). Notably, the uptake of Ca plateaus relative to the uptake of P due to the non-linear dissolution rate law. The high uptake of nutrient relative to both the release by primary mineral dissolution and chemical weathering export is consistent with other estimates documenting efficient recycling of nutrients by the biosphere (e.g., Cleveland et al., 2013; Uhlig and von Blanckenburg, 2019; von Blanckenburg et al., 2021).
4.2.2 Vegetation turnover and foliar traits as a function of regolith thickness, flow rate and enhanced weathering
In general, growth rates are lower in response to thin regolith and increased water flow (Figure 7) because these scenarios result in a smaller P inventory. At higher erosion rates, the greater abundance of primary mineral in the weathering zone and enhanced supply of P supports higher growth rates and foliar concentrations across all three scenarios. In the reference model, maximum [P]fol values are consistent with estimates of the maximum values for evergreen needle and broadleaf forests from Wang et al. (2010) and bracket the foliar concentrations typical of tropical deciduous forests from Kattge et al. (2011). These estimates are biome averages and do not account for variations in erosion rate or regolith properties. For [Ca]bio, the profile shows a maximum at moderate erosion rates (Figure 7C) that coincides with the plateau in concentration and dissolution rate (e.g., Figures 3B, C). Because greater P availability also corresponds to a higher uptake of both Ca and P, the soluble Ca reservoir becomes depleted at higher erosion rates as the P-driven uptake is greater, resulting in the inflection point in foliar Ca concentrations.
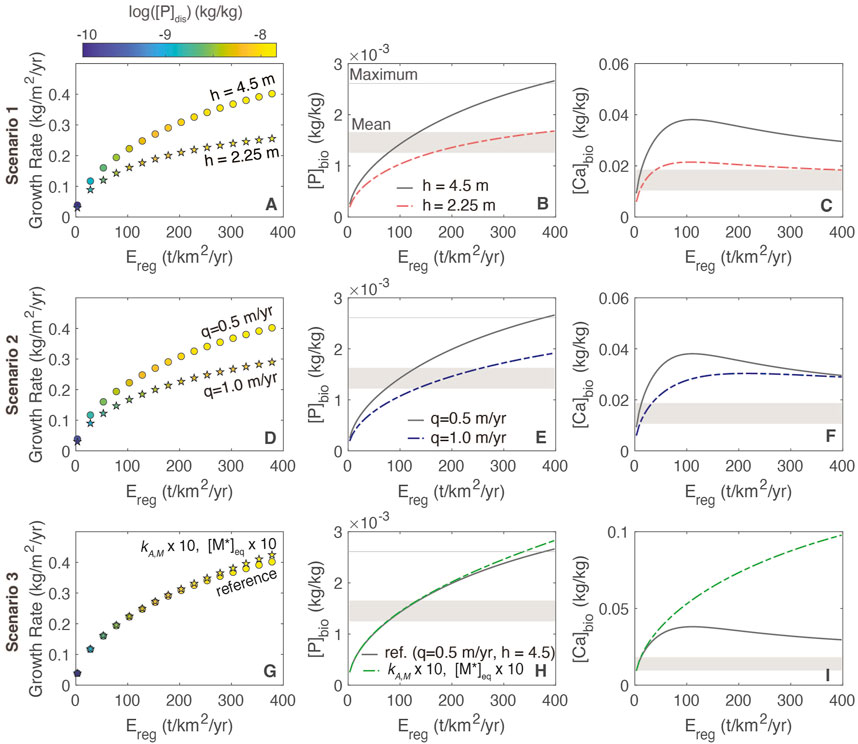
FIGURE 7. Relationships among growth rate, foliar stoichiometry and erosion rate for different plant-regolith interaction scenarios. (A–C) regolith thickness (scenario 1); (D–F) different flow rates (scenario 2); (G–I) increased mineral dissolution rates and increased [M*]eq (scenario 3). In panels A, D and G, circles correspond to the reference model and stars correspond to scenarios. The grey shaded bar shows the range of foliar concentrations typical of tropical deciduous forests from Kattge et al. (2011). The light grey lines in B, E and H are the maximum [P]fol levels from Wang et al. (2010).
Importantly, growth rates do not change in response to aggregated biogenic amplification of dissolution rates (Figures 7G, H). This is because at steady state [A]prim is inversely correlated with the rate constant at a given erosion rate (Eq. 13) such that dissolution rates do not change appreciably in response to biogenic amplification. This self-limiting behavior is evident in the similarity between [P]bio profiles for the reference case and scenario 3. For Ca, the foliar levels are elevated at high erosion due to the increase in primary mineral dissolution, combined with similar rates of uptake to the reference model.
5 Discussion
As opposed to the erosional gradient examined here, many studies of rock-derived nutrient cycling between regolith and plants have considered chronosequences. In these studies, regolith evolves from a discrete starting event and ecosystem properties are evaluated as a function of age (Kennedy et al., 1998; Chadwick et al., 1999; Hayes et al., 2014; de Tombeur et al., 2020). In erosional gradient studies, regolith residence times, or the ratio of regolith mass to erosion rate, allow for comparisons of regolith evolution between stable and eroding surfaces (Porder and Hilley, 2011; Egli et al., 2014). However, our model differs from previous erosional gradient models in that we hold regolith thickness constant with erosion rate, rather than treat it as a function of erosion. Model regolith residence times here extend from 20 kyr at high erosion rates to 2.6 Myr at low erosion rates (h = 4.5 m), similar to the age range of many chronosequence studies. Our results generally match the pattern of decreasing foliar P levels with increasing regolith age observed for dune sands (Hayes et al., 2014; de Tombeur et al., 2020) even though the parent material is different. Other RDN profiles are complex at the dune sites, with Ca showing minimal variation with soil age (Hayes et al., 2014) to a decrease with soil age (de Tombeur et al., 2020) depending on foliar sample selection. For plants with similar nutrient acquisition strategies, other RDNs show no systematic increase with age, consistent with our prediction for foliar Ca (Hayes et al., 2014).
The modeling approach used here also has a similar structure to the models presented in Buendia et al. (2010; Buendia et al. 2014) but with a different intent. We include the removal of regolith and litter via erosion and focus on an idealized ecosystem without flexible allocation and growth. Nevertheless, the basic predictions of the two approaches are similar: limitations to P availability can be an important inhibitor of biomass production, and furthermore, P uptake and is highly dependent on rejuvenation by primary minerals in the regolith. In short, it is the overall inventory of available P that dictates biomass production. To demonstrate the importance of the nutrient inventory relative to the fluxes, we first analyze the flux ratios that describe nutrient cycling for the scenarios described in section 3.3. Based on these results, we then examine the extent to which these interactions influence organic nutrient pathways, plant nutrient status and chemical weathering export.
5.1 Ecosystem recycling and reliance on the geogenic pathway
Even though the uptake rates of P and Ca into biomass exceed the rates of dissolution in regolith by an order of magnitude, our results suggest that biomass growth cannot be entirely decoupled from weathering processes. This is because the small proportion of P lost continuously from the regolith needs to be replaced. The replacement of lost P by “new” nutrient provides the coupling between the geogenic and the organic nutrient pathways. A measure of the reliance on new nutrient is the inverse of the fraction of new RDN, or the recycling ratio,
This ratio quantifies the number of times an element passes through biomass after release from regolith and before loss into runoff. It differs slightly from the recycling parameter defined using chemical weathering export in the demoninator (Schuessler et al., 2018; Uhlig and von Blanckenburg, 2019; von Blanckenburg et al., 2021) by accounting for the competition between uptake and sorption at low erosion rates. It is the inverse of that presented for P in Cleveland et al. (2013), for the fraction of new NPP associated with primary mineral weathering. Given the assumptions in the model parameterization, Eq. 18 simplifies to:
where β is a lumped parameter containing the constants reflecting the balance of the root uptake and the dissolution kinetics terms defined. An analogous equation can be written for Ca.
Across all simulations,
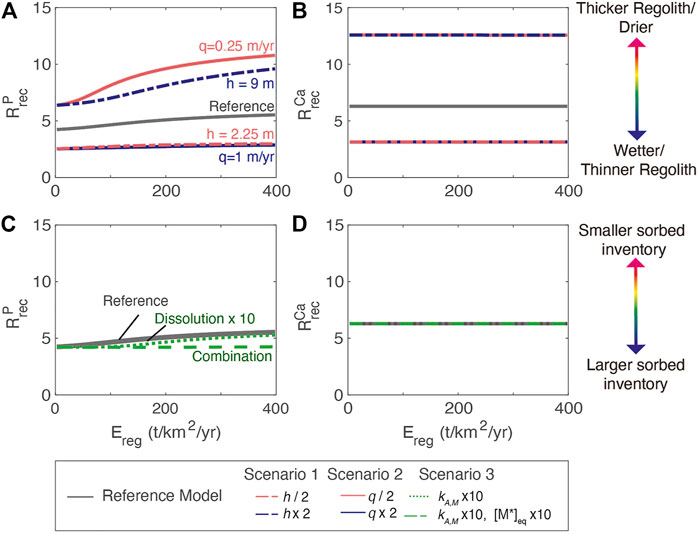
FIGURE 8. (A) Dependence of phosphorous recycling,
Among the regolith scenarios, the lower nutrient inventories associated with thin regolith (scenario 1) and high water flushing (scenario 2) result in greater reliance on new P, or lower
For biogenic enhancement of weathering (scenario 3), changes in
5.2 Tradeoffs between increased plant growth and weathering
To demonstrate the feedbacks between regolith and plant growth we assume that ecosystems with similar traits and total biomass exist across the extremely broad spectrum of erosion rates. In reality, ecosystems can respond to limitations in supply through increases in diversity, changes in total biomass or biomass allocation, and/or changes in nutrient acquisition strategies. Despite these simplifications, our model results highlight the relative tradeoffs across different physical and biotic conditions. Model simulations suggest that erosion, a well-known driver of chemical weathering export, is a critical control on nutrient inventories and thus on plant growth. Accepting erosion as an overarching driver for both, the three scenarios reveal complex tradeoffs between conditions that favor plant growth and those that accelerate chemical weathering export (Figure 9).
• Scenario 1: thicker regolith increases plant growth by increasing the [P]dis inventory and supporting higher
• Scenario 2: low water flow increases plant growth by increasing [P]dis and increasing
• Scenario 3: biogenic enhancement of weathering via increasing mineral dissolution rates and belowground CO2 has minimal impact on plant growth. However, higher [M*]eq combined with higher dissolution rate constants does increase silicate weathering rates but only at high erosion rates.
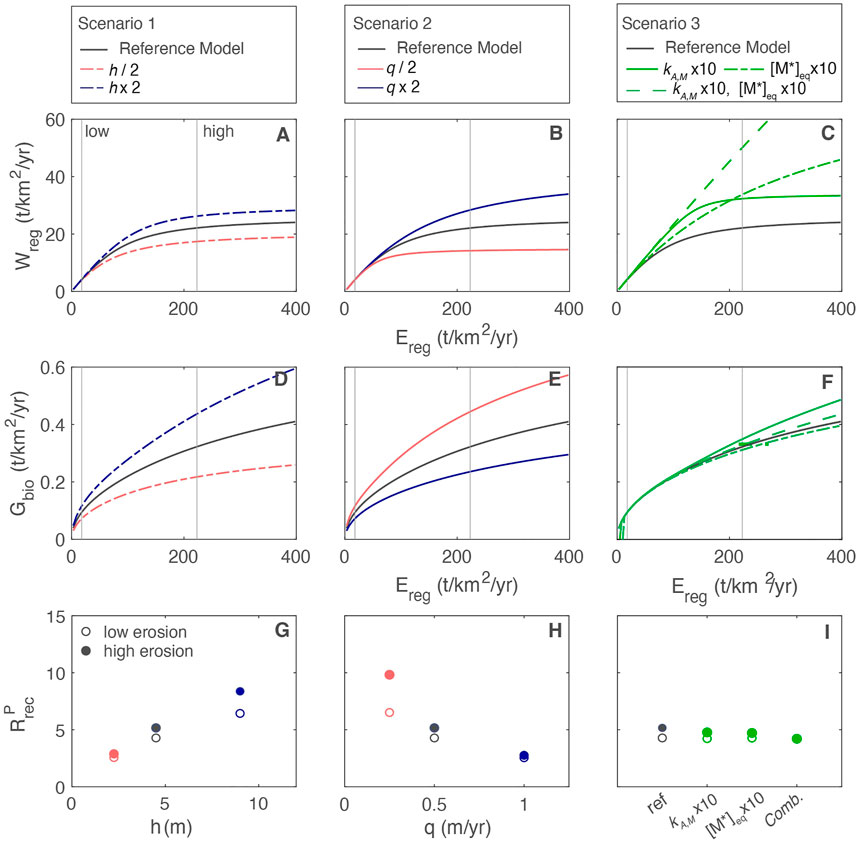
FIGURE 9. (A–C) Chemical weathering export
Thus, not all scenarios that result in favorable nutrient conditions correspond to increased weathering fluxes. In general, conditions that optimize the growth rate and lower the dependence on new P have minimal impact on chemical weathering exports.
Although we focus here on the net export of weathered products, Si uptake by vegetation is noted to represent a substantial biogenic flux at Earth’s surface (Conley, 2002; de Tombeur et al., 2020) that is not explicitly accounted for in the model. However, the extent to which the weathering flux of silica is impacted by plant growth is still a largely open question (Cornelis et al., 2011). In contrast to the plant essential nutrients (P, Ca, Mg, and K), which are released rapidly during litter decomposition, Si is returned to soil as biogenic silica contained in phytoliths and is not resorbed during senescence. Depending on climatic and soil chemical conditions, this biogenic silica may be transferred into secondary clay phases (Lucas, 2001). Accordingly, estimates of Si recycling suggest low values of <1 to 3 (von Blanckenburg et al., 2021; Alexandre et al., 1997) when compared to RDNs. Although the model here could be expanded to consider Si cycling in the future through several modifications, we ultimately focus on the plant essential nutrients P and Ca, which together with Mg and K, may be more sensitive indicators of the biogenic impact on weathering.
6 Implications: Why would plants accelerate weathering?
The potential connections among regolith properties, such as primary mineral abundance and composition, water storage, and regolith thickness, and the ability of an ecosystem to maximize growth, have led to numerous hypotheses about the importance of couplings between the biosphere and chemical and physical weathering processes (Kelly et al., 1998; Zechmeister-Boltenstern et al., 2015; Augusto et al., 2017; Uhlig and von Blanckenburg, 2019). In particular, it has been hypothesized that plants are a major driver of weathering fluxes globally (Berner, 1992; Pagani et al., 2009; Lenton et al., 2012; Mills et al., 2021). Most controlled experiments of biotic weathering that measure enhanced dissolution (scenario 3) consider short time spans of days to months and commence with fresh rock as the starting material. In agreement with these results, our model suggests that enhanced biotic weathering is highly effective in rapidly rejuvenated regolith (Figure 9), or above a threshold value for erosion rate of ca. 40 t/km2/yr. However, based on erosion rates inferred from river loads, large parts of the Earth’s surface are well below this value and thus the consequences of biotic weathering may be small relative to current estimates.
Importantly, although biotically stimulated weathering can increase weathering fluxes, most of these changes result in self-limiting behavior. For example, an increase in the dissolution rate of apatite driven by microbial activity merely depletes primary apatite with minimal change in dissolution rate and nutrient status. Increases in the primary mineral dissolution rate also result in more P in the occluded fraction, with negative consequences for plant growth. Thus, even though plants undoubtedly can alter dissolution rates, such strategies may lead to long-term depletion of plant-available P from the regolith and ultimately impair plant growth. The “organic nutrient pathway” may provide an alternative strategy for plants to obtain mineral nutrient: an increase in the efficiency of nutrient recycling, rather than uptake of fresh nutrient via the “geogenic pathway”. This strategy has existed since the development of vascular plants that supported a litter layer, likely after the Late Ordovician (Porada et al., 2016). The development of the biogenic pathway, which mitigates the dependence on mineral nutrient supply may have dampened silicate weathering by enabling ecosystems to develop robust nutrient cycling with less reliance on the slow process of rock dissolution.
7 Conclusion
We present a framework for linking plant growth to regolith properties, including regolith thickness (scneario 1), water flux (scenario 2) and mineral dissolution kinetics (scenario 3), under steady-state conditions. Erosion, which sets the supply of primary RDNs, determines the magnitude of the differences between each scenario, with greater sensitivity at higher erosion rates. Higher rates of plant growth are associated with increased regolith thickness/lower water flow rates, but not with biogenic mineral dissolution. This is true across all erosion rates. Higher rates of chemical weathering export are associated with biogenic mineral dissolution, followed by increased water flux/increased regolith thickness. This is only true for moderate to high erosion rates, with miminal to no effect observed at low erosion rates. These contrasting responses are distinguished by the RDN inventory: larger inventories (thicker regolith/lower water flux) correspond to greater plant growth and nutrient recycling and a reduced dependence on “new” RDN. Biogenic mineral dissolution, which does not affect the RDN inventory, is thus less effective at supporting plant growth. As a result of these variable interactions, when evaluating the couplings between the biosphere and chemical and physical weathering processes, the distinct relationships between plant growth, regolith properties, erosion and nutrient inventories must be considered. Most notably, our results suggest that biologically enhanced RDN dissolution will only impact chemical weathering exports at high erosion rates uncharacteristic of most of the Earth’s surface.
Data availability statement
The original contributions presented in the study are included in the article/Supplementary Material, further inquiries can be directed to the corresponding author.
Author contributions
KM and FvB co-designed the study, interpreted model results, and wrote the text. KM developed the model formulation.
Funding
This project was supported by funding from the U.S. Department of Energy BER Awards DE-SC0018155 (KM), the National Science Foundation NSF-1841547 (KM) and by the German National Science foundation Priority Program “EarthShape—Earth Surface Shaping by Biota” (FvB). We further acknowledge the support of the Blaustein (FvB) and Helmholtz Fellowship (KM) programs.
Acknowledgments
We are grateful to K. Dana Chadwick, Patrick Frings, Daniel Poppe and Zsuzsanna Balogh-Brunstad for comments and suggestions that greatly improved this manuscript.
Conflict of interest
The authors declare that the research was conducted in the absence of any commercial or financial relationships that could be construed as a potential conflict of interest.
Publisher’s note
All claims expressed in this article are solely those of the authors and do not necessarily represent those of their affiliated organizations, or those of the publisher, the editors and the reviewers. Any product that may be evaluated in this article, or claim that may be made by its manufacturer, is not guaranteed or endorsed by the publisher.
Supplementary material
The Supplementary Material for this article can be found online at: https://www.frontiersin.org/articles/10.3389/fenvs.2022.1066959/full#supplementary-material. The archive contains the Matlab input file (steadystatebioweathering.m) and the template for fsolve (biosolve.m).
References
Agren, G. I. (2008). Stoichiometry and nutrition of plant growth in natural communities. Annual review of ecology evolution and systematics 39, 153–170. doi:10.1146/annurev.ecolsys.39.110707.173515
Agren, G. I., Wetterstedt, J. A. M., and Billberger, M. F. K. (2012). Nutrient limitation on terrestrial plant growth - modeling the interaction between nitrogen and phosphorus. New Phytol. 194 (4), 953–960. doi:10.1111/j.1469-8137.2012.04116.x
Alexandre, A., Meunier, J. D., Colin, F., and Koud, J. M. (1997). Plant impact on the biogeochemical cycle of silicon and related weathering processes. Geochimica Et Cosmochimica Acta 61 (3), 677–682. doi:10.1016/s0016-7037(97)00001-x
Arai, Y., and Sparks, D. L. (2007). Phosphate reaction dynamics in soils and soil components: A muiltiscale approach. Adv. Agron. Editor D. L. Sparks, Vol 94, 135–179. doi:10.1016/s0065-2113(06)94003-6
Arvin, L. J., Riebe, C. S., Aciego, S. M., and Blakowski, M. A. (2017). Global patterns of dust and bedrock nutrient supply to montane ecosystems. Sci. Adv. 3 (12), eaao1588. doi:10.1126/sciadv.aao1588
Attiwill, P. M., and Adams, M. A. (1993). Nutrient cycling in forests. New Phytol. 124 (4), 561–582. doi:10.1111/j.1469-8137.1993.tb03847.x
Augusto, L., Achat, D. L., Jonard, M., Vidal, D., and Ringeval, B. (2017). Soil parent material-A major driver of plant nutrient limitations in terrestrial ecosystems. Glob. Change Biol. 23 (9), 3808–3824. doi:10.1111/gcb.13691
Baskaran, P., Hyvonen, R., Berglund, S. L., Clemmensen, K. E., Agren, G. I., Lindahl, B. D., et al. (2017). Modelling the influence of ectomycorrhizal decomposition on plant nutrition and soil carbon sequestration in boreal forest ecosystems. New Phytol. 213 (3), 1452–1465. doi:10.1111/nph.14213
Bazilevskaya, E., Rother, G., Mildner, D. F. R., Pavich, M., Cole, D., Bhatt, M. P., et al. (2015). How oxidation and dissolution in diabase and granite control porosity during weathering. Soil Sci. Soc. Am. J. 79 (1), 55–73. doi:10.2136/sssaj2014.04.0135
Berner, E. K., Berner, R. A., and Moulton, K. L. (2003). “Plants and mineral weathering: Present and past,” in Treatise on geochemistry: Surface and ground water, weathering, and soils. Editor J. I. Drever (Amsterdam: Elsevier), 169–188.
Berner, R. A. (1992). Weathering, plants, and the long-term carbon-cycle. Geochimica Cosmochimica Acta 56 (8), 3225–3231. doi:10.1016/0016-7037(92)90300-8
Blum, J. D., Klaue, A., Nezat, C. A., Driscoll, C. T., Johnson, C. E., Siccama, T. G., et al. (2002). Mycorrhizal weathering of apatite as an important calcium source in base-poor forest ecosystems. Nature 417 (6890), 729–731. doi:10.1038/nature00793
Bonneville, S., Smits, M. M., Brown, A., Harrington, J., Leake, J. R., Brydson, R., et al. (2009). Plant-driven fungal weathering: Early stages of mineral alteration at the nanometer scale. Geology 37 (7), 615–618. doi:10.1130/g25699a.1
Bowsher, A. W., Ali, R., Harding, S. A., Tsai, C. J., and Donovan, L. A. (2016). Evolutionary divergences in root exudate composition among ecologically-contrasting Helianthus species. Plos One 11 (1), e0148280. doi:10.1371/journal.pone.0148280
Brantley, S. L., Eissenstat, D. M., Marshall, J. A., Godsey, S. E., Balogh-Brunstad, Z., Karwan, D. L., et al. (2017). Reviews and syntheses: On the roles trees play in building and plumbing the critical zone. Biogeosciences 14 (22), 5115–5142. doi:10.5194/bg-14-5115-2017
Brantley, S. L., Megonigal, J. P., Scatena, F. N., Balogh-Brunstad, Z., Barnes, R. T., Bruns, M. A., et al. (2011). Twelve testable hypotheses on the geobiology of weathering. Geobiology 9 (2), 140–165. doi:10.1111/j.1472-4669.2010.00264.x
Buendia, C., Arens, S., Hickler, T., Higgins, S. I., Porada, P., and Kleidon, A. (2014). On the potential vegetation feedbacks that enhance phosphorus availability - insights from a process-based model linking geological and ecological timescales. Biogeosciences 11 (13), 3661–3683. doi:10.5194/bg-11-3661-2014
Buendia, C., Kleidon, A., and Porporato, A. (2010). The role of tectonic uplift, climate, and vegetation in the long-term terrestrial phosphorous cycle. Biogeosciences 7 (6), 2025–2038. doi:10.5194/bg-7-2025-2010
Bullen, T., and Chadwick, O. (2016). Ca, Sr and Ba stable isotopes reveal the fate of soil nutrients along a tropical climosequence in Hawaii. Chem. Geol. 422, 25–45. doi:10.1016/j.chemgeo.2015.12.008
Casper, B. B., and Jackson, R. B. (1997). Plant competition underground. Annu. Rev. Ecol. Syst. 28, 545–570. doi:10.1146/annurev.ecolsys.28.1.545
Castle, S. C., and Neff, J. C. (2009). Plant response to nutrient availability across variable bedrock geologies. Ecosystems 12 (1), 101–113. doi:10.1007/s10021-008-9210-8
Chadwick, O. A., Derry, L. A., Vitousek, P. M., Huebert, B. J., and Hedin, L. O. (1999). Changing sources of nutrients during four million years of ecosystem development. Nature 397(6719), 491–497. doi:10.1038/17276
Chapin, F. S., Schulze, E. D., and Mooney, H. A. (1990). The ecology and economics of storage in plants. Annu. Rev. Ecol. Syst. 21, 423–447. doi:10.1146/annurev.es.21.110190.002231
Chaudhuri, S., Clauer, N., and Semhi, K. (2007). Plant decay as a major control of river dissolved potassium: A first estimate. Chem. Geol. 243 (1-2), 178–190. doi:10.1016/j.chemgeo.2007.05.023
Clark, D. A., Brown, S., Kicklighter, D. W., Chambers, J. Q., Thomlinson, J. R., Ni, J., et al. (2001). Net primary production in tropical forests: An evaluation and synthesis of existing field data. Ecol. Appl. 11 (2), 371–384. doi:10.1890/1051-0761(2001)011[0371:nppitf]2.0.co;2
Cleveland, C. C., Houlton, B. Z., Smith, W. K., Marklein, A. R., Reed, S. C., Parton, W., et al. (2013). Patterns of new versus recycled primary production in the terrestrial biosphere. Proc. Natl. Acad. Sci. U. S. A. 110 (31), 12733–12737. doi:10.1073/pnas.1302768110
Clow, D. W., Mast, M. A., Bullen, T. D., and Turk, J. T. (1997). Strontium 87/strontium 86 as a tracer of mineral weathering reactions and calcium sources in an Alpine/Subalpine Watershed, Loch Vale, Colorado. Water Resour. Res. 33 (6), 1335–1351. doi:10.1029/97wr00856
Conley, D. J. (2002). Terrestrial ecosystems and the global biogeochemical silica cycle. Glob. Biogeochem. Cycles 16 (4), 68–8. doi:10.1029/2002gb001894
Cornelis, J. T., Delvaux, B., Georg, R. B., Lucas, Y., Ranger, J., and Opfergelt, S. (2011). Tracing the origin of dissolved silicon transferred from various soil-plant systems towards rivers: a review. Biogeosciences 8 (1), 89–112. doi:10.5194/bg-8-89-2011
de Tombeur, F., Turner, B. L., Laliberte, E., Lambers, H., Mahy, G., Faucon, M. P., et al. (2020). Plants sustain the terrestrial silicon cycle during ecosystem retrogression. Science 369(6508), 1245-1248. doi:10.1126/science.abc0393
Dixon, J. L., and von Blanckenburg, F. (2012). Soils as pacemakers and limiters of global silicate weathering. Comptes rendus - Geosci. 344, 597–609. doi:10.1016/j.crte.2012.10.012
Egli, M., Dahms, D., and Norton, K. (2014). Soil formation rates on silicate parent material in alpine environments: Different approaches-different results? Geoderma 213, 320–333. doi:10.1016/j.geoderma.2013.08.016
Elrifi, I. R., and Turpin, D. H. (1985). Steady-state luxury consumption and the concept of optimum nutrient ratios: A study with phosphate and nitrate limited selenastrum minutum (chlorophyta)1. J. Phycol. 21 (4), 592–602. doi:10.1111/j.0022-3646.1985.00592.x
Elser, J. J., Fagan, W. F., Kerkhoff, A. J., Swenson, N. G., and Enquist, B. J. (2010). Biological stoichiometry of plant production: Metabolism, scaling and ecological response to global change. New Phytol. 186 (3), 593–608. doi:10.1111/j.1469-8137.2010.03214.x
Fernandez-Martinez, M., Vicca, S., Janssens, I. A., Luyssaert, S., Campioli, M., Sardans, J., et al. (2014). Spatial variability and controls over biomass stocks, carbon fluxes, and resource-use efficiencies across forest ecosystems. Trees-Structure Funct. 28 (2), 597–611. doi:10.1007/s00468-013-0975-9
Franklin, O., and Agren, G. I. (2002). Leaf senescence and resorption as mechanisms of maximizing photosynthetic production during canopy development at N limitation. Funct. Ecol. 16 (6), 727–733. doi:10.1046/j.1365-2435.2002.00674.x
Frings, P. J., Schubring, F., Oelze, M., and von Blanckenburg, F. (2021). Quantifying biotic and abiotic Si fluxes in the critical zone with Ge/Si ratios along a gradient of erosion rates. Am. J. Sci. 321 (8), 1204–1245. doi:10.2475/08.2021.03
Giehl, R. F. H., and von Wiren, N. (2014). Root nutrient foraging. Plant Physiol. 166 (2), 509–517. doi:10.1104/pp.114.245225
Graefe, S., Hertel, D., and Leuschner, C. (2008). Estimating fine root turnover in tropical forests along an elevational transect using minirhizotrons. Biotropica 40 (5), 536–542. doi:10.1111/j.1744-7429.2008.00419.x
Guidry, M. W., and Mackenzie, F. T. (2003). Experimental study of igneous and sedimentary apatite dissolution: Control of pH, distance from equilibrium, and temperature on dissolution rates. Geochimica Cosmochimica Acta 67 (16), 2949–2963. doi:10.1016/S0016-7037(03)00265-5
Hartmann, J., and Moosdorf, N. (2011). Chemical weathering rates of silicate-dominated lithological classes and associated liberation rates of phosphorus on the Japanese Archipelago-Implications for global scale analysis. Chem. Geol. 287 (3-4), 125–157. doi:10.1016/j.chemgeo.2010.12.004
Hayes, P., Turner, B. L., Lambers, H., and Laliberte, E. (2014). Foliar nutrient concentrations and resorption efficiency in plants of contrasting nutrient-acquisition strategies along a 2-million-year dune chronosequence. J. Ecol. 102 (2), 396–410. doi:10.1111/1365-2745.12196
Hedley, M. J., and Stewart, J. W. B. (1982). Method to measure microbial phosphate in soils. Soil Biol. Biochem. 14 (4), 377–385. doi:10.1016/0038-0717(82)90009-8
Heimsath, A. M., Dietrich, W. E., Nishiizumi, K., and Finkel, R. C. (1997). The soil production function and landscape equilibrium. Nature 388 (6640), 358–361. doi:10.1038/41056
Heineman, K. D., Turner, B. L., and Dalling, J. W. (2016). Variation in wood nutrients along a tropical soil fertility gradient. New Phytol. 211 (2), 440–454. doi:10.1111/nph.13904
Hertel, D., and Leuschner, C. (2010). Fine root mass and fine root production in tropical moist forests as dependent on soil, climate, and elevation, 428–444.
Hoffland, E., Giesler, R., Jongmans, A. G., and van Breemen, N. (2003). Feldspar tunneling by fungi along natural productivity gradients. Ecosystems 6(8), 739–746. doi:10.1007/s10021-003-0191-3
Huston, M. A., and Deangelis, D. L. (1994). Competition and coexistence - the effects of resource transport and supply rates. Am. Nat. 144 (6), 954–977. doi:10.1086/285720
Kattge, J., Diaz, S., Lavorel, S., Prentice, C., Leadley, P., Bonisch, G., et al. (2011). TRY-a global database of plant traits. Global Change Biology 17 (9), 2905–2935. doi:10.1111/j.1365-2486.2011.02451.x
Kelly, E. F., Chadwick, O. A., and Hilinski, T. E. (1998). The effect of plants on mineral weathering. Biogeochemistry 42 (1-2), 21–53. doi:10.1023/a:1005919306687
Kennedy, M. J., Chadwick, O. A., Vitousek, P. M., Derry, L. A., and Hendricks, D. M. (1998). Changing sources of base cations during ecosystem development, Hawaiian Islands. Geology 26 (11), 1015–1018. doi:10.1130/0091-7613(1998)026<1015:csobcd>2.3.co;2
Lang, F., Kruger, J., Amelung, W., Willbold, S., Frossard, E., Bunemann, E. K., et al. (2017). Soil phosphorus supply controls P nutrition strategies of beech forest ecosystems in Central Europe. Biogeochemistry 136 (1), 5–29. doi:10.1007/s10533-017-0375-0
Lebedeva, M. I., and Brantley, S. L. (2018). A clarification and extension of our model of regolith formation on hillslopes. Earth Surf. Process. Landforms 43 (13), 2715–2723. doi:10.1002/esp.4426
Lebedeva, M. I., Fletcher, R. C., and Brantley, S. L. (2010). A mathematical model for steady-state regolith production at constant erosion rate. Earth Surf. Process. Landforms 35 (5), 508–524. doi:10.1002/esp.1954
Lenton, T. M., Crouch, M., Johnson, M., Pires, N., and Dolan, L. (2012). First plants cooled the Ordovician. Nat. Geosci. 5 (2), 86–89. doi:10.1038/ngeo1390
Loreau, M. (1998). Biodiversity and ecosystem functioning: A mechanistic model. Proc. Natl. Acad. Sci. U. S. A. 95 (10), 5632–5636. doi:10.1073/pnas.95.10.5632
Lucas, Y. (2001). The role of plants in controlling rates and products of weathering: Importance of biological pumping. Annu. Rev. Earth Planet. Sci. 29, 135–163. doi:10.1146/annurev.earth.29.1.135
Maher, K., and Chamberlain, C. P. (2014). Hydrologic regulation of chemical weathering and the geologic carbon cycle. Science 343, 1502–1504. doi:10.1126/science.1250770
Maher, K., Steefel, C. I., White, A. F., and Stonestrom, D. A. (2009). The role of reaction affinity and secondary minerals in regulating chemical weathering rates at the Santa Cruz Soil Chronosequence, California. Geochimica Cosmochimica Acta 73 (10), 2804–2831. doi:10.1016/j.gca.2009.01.030
Maher, K., and von Blanckenburg, F. (2016). Surface ages and weathering rates from 10Be (meteoric) and 10Be/9Be: Insights from differential mass balance and reactive transport modeling. Chem. Geol. 446, 70–86. doi:10.1016/j.chemgeo.2016.07.016
Makela, A., Valentine, H. T., and Helmisaari, H. S. (2008). Optimal co-allocation of carbon and nitrogen in a forest stand at steady state. New Phytol. 180 (1), 114–123. doi:10.1111/j.1469-8137.2008.02558.x
Malhi, Y., Doughty, C., and Galbraith, D. (2011). The allocation of ecosystem net primary productivity in tropical forests. Philosophical Trans. R. Soc. B-Biological Sci. 366 (1582), 3225–3245. doi:10.1098/rstb.2011.0062
McCulley, R. L., Jobbagy, E. G., Pockman, W. T., and Jackson, R. B. (2004). Nutrient uptake as a contributing explanation for deep rooting in arid and semi-arid ecosystems. Oecologia 141 (4), 620–628. doi:10.1007/s00442-004-1687-z
Milliman, J. D., and Syvitski, J. P. M. (1992). Geomorphic tectonic control of sediment discharge to the ocean- the importance of small mountainous rivers. J. Geol. 100, 525–544. doi:10.1086/629606
Mills, B. J. W., Tennenbaum, S., and Schwartzman, D. (2021). Exploring multiple steady states in earth's long-term carbon cycle. Am. J. Sci. 321 (7), 1033–1044. doi:10.2475/07.2021.01
Oeser, R. A., and von Blanckenburg, F. (2020). Do degree and rate of silicate weathering depend on plant productivity? Biogeosciences 17 (19), 4883–4917. doi:10.5194/bg-17-4883-2020
Pagani, M., Caldeira, K., Berner, R., and Beerling, D. J. (2009). The role of terrestrial plants in limiting atmospheric CO2 decline over the past 24million years. Nature 460, 85–88. doi:10.1038/nature08133
Palandri, J. L., and Kharaka, Y. K. (2004). A compilation of rate parameters of water-mineral interaction kinetics for application to geochemical modeling, 2004–1068. Reston, VA, USA: US Geological Survey Open File Report.
Pelletier, J. D., Broxton, P. D., Hazenberg, P., Zeng, X. B., Troch, P. A., Niu, G. Y., et al. (2016). A gridded global data set of soil, intact regolith, and sedimentary deposit thicknesses for regional and global land surface modeling. J. Adv. Model. Earth Syst. 8 (1), 41–65. doi:10.1002/2015ms000526
Phillips, J. D. (2009). Biological energy in landscape evolution. Am. J. Sci. 309 (4), 271–289. doi:10.2475/04.2009.01
Ponge, J. F. (2013). Plant-soil feedbacks mediated by humus forms: A review. Soil Biol. Biochem. 57, 1048–1060. doi:10.1016/j.soilbio.2012.07.019
Poorter, H., and Nagel, O. (2000). The role of biomass allocation in the growth response of plants to different levels of light, CO2, nutrients and water: A quantitative review. Aust. J. Plant Physiology 27 (6), 595–607. doi:10.1071/pp99173
Porada, P., Lenton, T. M., Pohl, A., Weber, B., Mander, L., Donnadieu, Y., et al. (2016). High potential for weathering and climate effects of non-vascular vegetation in the Late Ordovician. Nat. Commun. 7, 12113. doi:10.1038/ncomms12113
Porder, S., and Hilley, G. E. (2011). Linking chronosequences with the rest of the world: Predicting soil phosphorus content in denuding landscapes. Biogeochemistry 102(1-3), 153–166. doi:10.1007/s10533-010-9428-3
Porder, S., Vitousek, P. M., Chadwick, O. A., Chamberlain, C. P., and Hilley, G. E. (2007). Uplift, erosion, and phosphorus limitation in terrestrial ecosystems. Ecosystems 10 (1), 159–171. doi:10.1007/s10021-006-9011-x
Raich, J. W., and Nadelhoffer, K. J. (1989). Belowground carbon allocation in forest ecosystems - global trends. Ecology 70 (5), 1346–1354. doi:10.2307/1938194
Reed, S. C., Townsend, A. R., Davidson, E. A., and Cleveland, C. C. (2012). Stoichiometric patterns in foliar nutrient resorption across multiple scales. New Phytol. 196 (1), 173–180. doi:10.1111/j.1469-8137.2012.04249.x
Rempe, D. M., and Dietrich, W. E. (2014). A bottom-up control on fresh-bedrock topography under landscapes. Proc. Natl. Acad. Sci. U. S. A. 111 (18), 6576–6581. doi:10.1073/pnas.1404763111
Schenk, H. J., and Jackson, R. B. (2002). Rooting depths, lateral root spreads and below-ground/above-ground allometries of plants in water-limited ecosystems. J. Ecol. 90(3), 480–494. doi:10.1046/j.1365-2745.2002.00682.x
Schlesinger, W. H., Gray, J. T., and Gilliam, F. S. (1982). Atmospheric deposition processes and their importance as sources of nutrients in a chaparral ecosystem of southern-California. Water Resour. Res. 18 (3), 623–629. doi:10.1029/WR018i003p00623
Schoumans, O. F., and Groenendijk, P. (2000). Modeling soil phosphorus levels and phosphorus leaching from agricultural land in The Netherlands. J. Environ. Qual. 29 (1), 111–116. doi:10.2134/jeq2000.00472425002900010014x
Schuessler, J. A., von Blanckenburg, F., Bouchez, J., Uhlig, D., and Hewawasam, T. (2018). Nutrient cycling in a tropical montane rainforest under a supply-limited weathering regime traced by elemental mass balances and Mg stable isotopes. Chem. Geol. 497, 74–87. doi:10.1016/j.chemgeo.2018.08.024
Schymanski, S. J., Sivapalan, M., Roderick, M. L., Beringer, J., and Hutley, L. B. (2008). An optimality-based model of the coupled soil moisture and root dynamics. Hydrology Earth Syst. Sci. 12 (3), 913–932. doi:10.5194/hess-12-913-2008
St Clair, J., Moon, S., Holbrook, W. S., Perron, J. T., Riebe, C. S., Martel, S. J., et al. (2015). Geophysical imaging reveals topographic stress control of bedrock weathering. Science 350 (6260), 534–538. doi:10.1126/science.aab2210
Stallard, R. F., and Edmond, J. M. (1983). Geochemistry of the amazon .2. The influence of geology and weathering environment on the dissolved-load. J. Geophys. Research-Oceans Atmos. 88 (NC14), 9671–9688. doi:10.1029/jc088ic14p09671
Stolze, L., Arora, B., Dwivedi, D., Steefel, C., Li, Z., Carrero, S., et al. (2023). Aerobic respiration controls on shale weathering. Geochimica et Cosmochimica Acta 340, 172–188. doi:10.1016/j.gca.2022.11.002
Tang, G. P., Carroll, R. W. H., Lutz, A., and Sun, L. (2016). Regulation of precipitation-associated vegetation dynamics on catchment water balance in a semiarid and arid mountainous watershed. Ecohydrology 9 (7), 1248–1262. doi:10.1002/eco.1723
Uhlig, D., Amelung, W., and Blanckenburg, F. (2020). Mineral nutrients sourced in deep regolith sustain long-term nutrition of mountainous temperate forest ecosystems. Glob. Biogeochem. Cycles 34. doi:10.1029/2019gb006513
Uhlig, D., and von Blanckenburg, F. (2019). How slow rock weathering balances nutrient loss during fast forest floor turnover in montane, temperate forest ecosystems. Front. Earth Sci. 7 (159). doi:10.3389/feart.2019.00159
Van Riemsdijk, W. H., Boumans, L. J. M., and Dehaan, F. A. M. (1984). Phosphate sorption by soils: I. A model for phosphate reaction with metal-oxides in soil. Soil Sci. Soc. Am. J. 48 (3), 537–541. doi:10.2136/sssaj1984.03615995004800030013x
van Scholl, L., Kuyper, T. W., Smits, M. M., Landeweert, R., Hoffland, E., and van Breemen, N. (2008). Rock-eating mycorrhizas: Their role in plant nutrition and biogeochemical cycles. Plant Soil 303 (1-2), 35–47. doi:10.1007/s11104-007-9513-0
Vitousek, P., Chadwick, O., Matson, P., Allison, S., Derry, L., Kettley, L., et al. (2003). Erosion and the rejuvenation of weathering-derived nutrient supply in an old tropical landscape. Ecosystems 6 (8), 762–772. doi:10.1007/s10021-003-0199-8
Vitousek, P. M., and Farrington, H. (1997). Nutrient limitation and soil development: Experimental test of a biogeochemical theory. Biogeochemistry 37 (1), 63–75. doi:10.1023/a:1005757218475
Vogt, K. A., Grier, C. C., and Vogt, D. J. (1986). Production, turnover, and nutrient dynamics of above- and belowground detritus of world forests. Adv. Ecol. Res. 15, 303–377. doi:10.1016/s0065-2504(08)60122-1
von Blanckenburg, F., Schuessler, J. A., Bouchez, J., Frings, P. J., Uhlig, D., Oelze, M., et al. (2021). Rock weathering and nutrient cycling along an erodosequence. Am. J. Sci. 321 (8), 1111–1163. doi:10.2475/08.2021.01
Waide, J. B., Krebs, J. E., Clarkson, S. P., and Setzler, E. M. (1974). A linear systems analysis of the calcium cycle in a forested watershed ecosystem. Prog. Theor. Biol. 3, 261–345.
Waldbauer, J. R., and Chamberlain, C. P. (2005). “Influence of uplift, weathering and base cation supply on past and future CO2 levels,” in Ecological studies 177: A history of atmospheric CO2 and its effects on plants, animals and ecosystems. Editor E. e. al. (Springer-Verlag), 166–184.
Walker, T., and Syers, J. (1976). The fate of phosphorus during pedogenesis. Geoderma 15 (1), 1–19. doi:10.1016/0016-7061(76)90066-5
Wang, R., Goll, D., Balkanski, Y., Hauglustaine, D., Boucher, O., Ciais, P., et al. (2017). Global forest carbon uptake due to nitrogen and phosphorus deposition from 1850 to 2100. Glob. Change Biol. 23 (11), 4854–4872. doi:10.1111/gcb.13766
Wang, Y. P., Law, R. M., and Pak, B. (2010). A global model of carbon, nitrogen and phosphorus cycles for the terrestrial biosphere. Biogeosciences 7 (7), 2261–2282. doi:10.5194/bg-7-2261-2010
West, A. J., Galy, A., and Bickle, M. (2005). Tectonic and climatic controls on silicate weathering. Earth Planet. Sci. Lett. 235 (1-2), 211–228. doi:10.1016/j.epsl.2005.03.020
Wilcke, W., Yasin, S., Abramowski, U., Valarezo, C., and Zech, W. (2002). Nutrient storage and turnover in organic layers under tropical montane rain forest in Ecuador. Eur. J. Soil Sci. 53 (1), 15–27. doi:10.1046/j.1365-2389.2002.00411.x
Wilson, J. B. (1988). A review of evidence on the control of shoot-root ratio, in relation to models. Ann. Bot. 61 (4), 433–449. doi:10.1093/oxfordjournals.aob.a087575
Winnick, M. J., and Maher, K. (2018). Relationships between CO2, thermodynamic limits on silicate weathering, and the strength of the silicate weathering feedback. Earth Planet. Sci. Lett. 485, 111–120. doi:10.1016/j.epsl.2018.01.005
Yang, X., and Post, W. M. (2011). Phosphorus transformations as a function of pedogenesis: A synthesis of soil phosphorus data using Hedley fractionation method. Biogeosciences 8 (10), 2907–2916. doi:10.5194/bg-8-2907-2011
Keywords: rock-derived nutrients, Phosphorous cycling, ecosystem nutrition, chemical weathering, nutrient cycling, ecological model
Citation: Maher K and von Blanckenburg F (2023) The circular nutrient economy of terrestrial ecosystems and the consequences for rock weathering. Front. Environ. Sci. 10:1066959. doi: 10.3389/fenvs.2022.1066959
Received: 11 October 2022; Accepted: 30 December 2022;
Published: 12 January 2023.
Edited by:
Dipankar Dwivedi, Berkeley Lab (DOE), United StatesReviewed by:
Daniel Puppe, Leibniz Center for Agricultural Landscape Research (ZALF), GermanyZsuzsanna Balogh-Brunstad, Hartwick College, United States
Copyright © 2023 Maher and von Blanckenburg. This is an open-access article distributed under the terms of the Creative Commons Attribution License (CC BY). The use, distribution or reproduction in other forums is permitted, provided the original author(s) and the copyright owner(s) are credited and that the original publication in this journal is cited, in accordance with accepted academic practice. No use, distribution or reproduction is permitted which does not comply with these terms.
*Correspondence: Kate Maher, a21haGVyQHN0YW5mb3JkLmVkdQ==
 Kate Maher
 Friedhelm von Blanckenburg