 Junxia Zhang
 Pingyan Li2
94% of researchers rate our articles as excellent or good
Learn more about the work of our research integrity team to safeguard the quality of each article we publish.
Find out more
ORIGINAL RESEARCH article
Front. Environ. Sci. , 20 January 2023
Sec. Environmental Economics and Management
Volume 10 - 2022 | https://doi.org/10.3389/fenvs.2022.1066122
There is growing concern about carbon emissions as the economy grows, which is of great importance to the implementation of the green Belt and Road Initiative (BRI) development strategy. Using panel data of 282 prefecture-level cities in China from 2006–2020 and the difference-in-differences method, this paper empirically examines the effects of the BRI on carbon emissions. Both theoretical and empirical analyses indicate that the BRI can significantly reduce the carbon emission level of cities along the routes, but the impact varies in different regions and cities. The mechanism analysis shows that the BRI reduces the carbon emission level of the Belt and Road cities through the economic agglomeration effect and industrial structure effect. Therefore, China should vigorously promote green Belt and Road construction, implement a regional integration strategy, and promote the transformation and upgrading of the industrial structure. These findings have a certain reference value for the follow-up implementation of the BRI.
With increasing globalization, we have witnessed a sharp rise in carbon emissions, and extreme weather caused by global warming has become an enormous challenge to sustainable development (Jiang et al., 2021). As the largest energy consumer and carbon emitter in the world, China has committed to achieving a peak in national carbon emissions and reducing its carbon intensity by 60%–65% from the 2005 level by 2030. At the UN General Assembly in September 2020, it was proposed that the peak in carbon dioxide emissions be reached by 2030 and carbon neutrality be achieved by 2060. To achieve the “dual carbon” goals, the 14th Five-Year Plan calls for accelerating the development of the green economy, reducing carbon emission intensity, and supporting regions where conditions permit taking the lead in achieving the “carbon peak”. At present, China’s economic development has entered a new normal, with economic growth slowing down and industrial structure being constantly upgraded. Previously, extensive economic growth was like a persistent disease affecting the quality of the economy. For half of the time since 1998, China’s economy has suffered from overcapacity, presenting an energy-intensive economic development model with a strong duality in terms of economic structure. In February 2017, the European Parliament passed a proposal to raise carbon trading fees to reduce carbon emissions. In March 2018, US President Trump signed an executive order to impose tariffs of 25% on steel and 10% on aluminum imports, targeting China’s carbon emissions. Since 2016, many parts of China have been shrouded in smog, with the PM2.5 index exceeding the peak and affecting 17 provinces, autonomous regions and municipalities and more than 71 cities suffering from severe pollution. Clearly, the resource waste and environmental pollution brought by the traditional economy have become an “obstacle” to China’s high-quality economic development, and economic development urgently needs low-carbon transformation. In September 2013, the proposal of the BRI provided an opportunity to solve excess capacity and greatly promote exchanges and cooperation among countries along the routes of the BRI. However, with the promotion of the BRI, people from all circles gradually noticed the impact of the BRI on carbon emissions. Most scholars believe that international trade has a significant impact on the environment (Zhang et al., 2017). As China is the largest trading nation and greenhouse gas emitter, a large part of its carbon emissions come from the processing and trade of export commodities (Wei et al., 2011). Since the BRI has moved from concept to action, global openness has further promoted trade and cooperation between countries and regions. The BRI countries have become important trade partners with China, and researchers have increasingly focused on trade and foreign direct investment (FDI) among the BRI countries (Jahanger, 2021), their CO2 emissions and the environmental impacts caused by trade between China and the BRI countries (Cai et al., 2018; Abban et al., 2020; Fan et al., 2020). As important subjects of economic and social development, cities play an important role in the low-carbon transition. Studies show that more than 70% of China’s carbon emissions come from cities (Cai et al., 2019). Therefore, it is practical and necessary to study urban carbon emissions.
There are many studies on the impact of the BRI on carbon emissions in the regions along the routes, and most of them consider the relationship between the BRI and carbon emissions from the perspectives of economic development (Andreoni and Levinson, 2001; Shuai et al., 2018; Zheng et al., 2020), technological advancement associated with opening-up (Verbano and Crema, 2016; Jiang et al., 2018; Fan et al., 2019; Xu et al., 2022), industrial structure (Fisher-Vanden et al., 2006; Gerlagh, 2007), infrastructure construction (Teo et al., 2019), etc. Some researchers think that the infrastructure construction associated with the BRI will inevitably destroy the natural landscape and increase carbon emissions while promoting local economic growth (Zhang et al., 2017; Shuai et al., 2018; Teo et al., 2019). However, others think that the BRI will improve energy efficiency and reduce carbon emissions (Han et al., 2018; Wu et al., 2021; Mao and Wang, 2022). How does the BRI affect carbon emissions in regions along the routes? At present, no consensus has been reached, and few studies have focused specifically on the impact of the BRI on the carbon emissions of cities along the routes in China. This paper will take the BRI as an entry point and will focus on whether the BRI has reduced carbon emissions in Chinese cities and the mechanisms of this impact. In this study, the difference-in-differences model is used to study the effect of carbon emissions on cities along the Chinese routes based on the diverse data of 282 Chinese cities from 2016 to 2020. Studies conclude that the BRI can significantly reduce the carbon emission level of cities along the routes through the economic agglomeration effect and industrial structure effect, but the impact varies in different regions and cities. The conclusions of this paper will help us understand the mechanisms of this impact of the BRI on the urban environment along the routes.
The marginal contributions of this paper are as follows. First, the paper evaluates the impact of the BRI on the carbon emissions of Chinese cities along the routes, which may be conducive to the implementation of the Green BRI and the formulation of appropriate emission reduction schemes by the government. Second, the heterogeneous impacts of the BRI on cities in different regions and with different carbon emission intensities are evaluated by using the difference-in-differences (DID) method (Ashenfelter, 1978). Third, we innovatively study the impact mechanism of the BRI on the carbon emissions of cities along the routes from the three aspects of economic agglomeration, technological progress and industrial structure, broadening the depth of policy evaluation.
The second part presents a literature review and the mechanism design, discussing the influence mechanism of the BRI on the carbon emissions of cities along the routes based on the systematic review of Chinese and foreign research results. The third part is the regression analysis, including the data processing and model construction. The fourth part presents the mechanism assessment. Finally, we offer the conclusion and discuss the policy implications.
Recently, the commercial connection between China and cities along the Belt and Road has become closer. The study of the low-carbon effect of the BRI has become one of the topics of academic focus domestically and abroad, and there have been many academic achievements on this topic. However, an extensive literature review indicates that different viewpoints exist among scholars. Studies can be broadly divided into the following categories.
Some scholars think that the BRI will promote economic growth but damage the environment. For example, in the early 1970s, the Club of Rome proposed the growth limit hypothesis, which argued that economic growth would increase global carbon emissions. These scholars proposed that industrial production and pollution are among the top five reasons for the increase in carbon emissions (Zheng et al., 2020). Shuai et al. (2018) proposed that GDP per capita contributes most to carbon emissions. Energy consumption is the basis of economic development, and economic growth increases energy consumption, which in turn expands carbon emissions. Energy consumption is the basis of economic growth, but carbon emissions expand as energy consumption increases. In the initial stage, the BRI mainly focused on infrastructure construction, although this increased the speed of economic development of the countries along the routes and altered the local natural landscape and the pattern of land use. In such a case, the biological balance and environmental quality may be reduced with the accelerated use and exploration of natural resources (Ascensao et al., 2018; Teo et al., 2019).
The relationship between the BRI and carbon emissions has also been discussed from the perspective of openness to the outside world. As the main driving force of economic development, foreign trade and technological innovation have a profound impact on green development (Jiang et al., 2018). However, some scholars believe that the process of foreign trade is accompanied by a larger amount of environmental pollution. Advanced economies tend to transfer high-polluting and energy-consuming industries to lagging economies, especially regions with low environmental regulations, and investments in the BRI countries may significantly increase carbon emissions and have a pollution haven effect (Leonard, 1984). In addition, the export of energy-intensive products has great environmental costs. The energy trade associated with the BRI brings new challenges to environmental governance, and the energy trade not only affects the energy exporting countries but also causes pollution in the process of use by the energy importing countries (Zivkovic et al., 2017). Therefore, international trade contributes to domestic carbon emissions (Cai et al., 2018). In addition, the adjustment of the industrial structure has a certain impact on carbon emissions. The increase in the proportion of the secondary industry is an important reason for the increase in energy consumption and carbon emissions in China (Fisher-Vanden et al., 2006; Gerlagh, 2007).
Other scholars believe that China’s FDI can reduce the carbon emissions of the BRI countries, and the pollution halo effect may arise because transnational investment can export pollution to the host country and bring advanced environmental protection technology and standards, which can reduce carbon emission intensity to a certain extent (Birdsall and Wheeler, 1993; Wu et al., 2021). Scholars have discovered that with the emergence of economies of scale and the technological effects of investment, environmental pollution levels show a downward trend. To a certain extent, this proves that the pollution halo effect of the Chinese BRI and the environmental impact of outward investment from developing and developed countries are different (Liu et al., 2020).
Scholars have also discussed the carbon emissions of countries involved in the BRI from the perspective of technological innovation and industrial structure upgrading. They consider that the technology effect can effectively restrain carbon emissions, and that the application of carbon emission reduction technology plays a positive role in limiting carbon emissions (Xu et al., 2022). In addition, technological innovation can effectively convert traditional energy to clean energy and reduce carbon emissions (Gerlagh, 2007). By using index decomposition analysis (IDA) to explore the driving factors of urban carbon emissions, scholars have found that a decrease in carbon emission intensity significantly hinders the growth of carbon emissions, while a change in the production structure can promote an increase in urban carbon emissions (Wang et al., 2013; Wei et al., 2017; Li et al., 2018). Industrial structure adjustment is one of the important ways to reduce pollution (Xu et al., 2014; Shuai et al., 2018). As an important link between human economic activities and air quality, industrial structure is a key factor to solve the contradiction between economic development and the environment and an important lever to realize the optimization and upgrading of industrial structure (Zheng et al., 2020), accelerate economic development and achieve carbon emission reduction goals (Xu et al., 2014; Shuai et al., 2018).
Studies also argue that dissimilar patterns of BRI collaborations or different countries may present different environmental effects. In terms of dissimilar patterns, the Green Development Capability (GDC) index was established by Huang, and the spatial Durbin model was used to conduct empirical tests on countries with different cooperation modes with China. The results show that economic development cooperation and sustainable cooperation are conducive to improving the GDC, while resource utilization cooperation based on fossil energy transactions is not conducive to improving the green development level of a region (Huang and Li, 2020). In addition, Muhammad et al. studied the impact of urbanization and international trade on carbon missions across 65 countries of the BRI and found that foreign direct investment could increase carbon missions in all BRI countries (Muhammad et al., 2020). However, exports decreased carbon emissions in low-and high-income BRI countries and increased in lower-middle-income BRI countries, while imports increased in low-income countries but decreased in middle-and high-income countries.
In conclusion, the BRI may have an important effect on carbon emissions, and the influence direction is inconsistent and needs to be tested empirically (Liu et al., 2018). Throughout the low-carbon BRI research, most studies focus on the counties along the Belt and Road. Although Kong studied whether the BRI affects the quality of economic growth in Chinese cities along the Belt and Road (Kong et al., 2021), there is still a lack of research on the environmental impact of the BRI policy based on big data and considering Chinese cities. The low-carbon development of the Belt and Road cities plays an important supporting role in the construction of the BRI. Therefore, it is necessary to study the impact of the BRI on urban carbon emissions, discover the carbon emissions of node cities, and analyze the impact of the BRI on the carbon emissions of cities along the BRI, which is of great significance to the green and low-carbon construction of the BRI according to local conditions.
As the bridgehead for external development, the Belt and Road cities play an important role in regional economic cooperation. With the goal of bringing benefits to all, the BRI focuses on promoting policy coordination, connectivity of infrastructure and facilities, unimpeded trade, financial integration, and closer people-to-people ties. The adjustment of foreign policies, trade policies and dividends promote the infrastructure construction, industrial structure adjustment and economic development level of cities along the Belt and Road and then affects their carbon emissions. The specific mechanisms of the impacts of the BRI on the carbon emissions of cities along the routes are as follows:
First, the BRI leads to preferential policies toward cities along the routes, which further promotes the relocation of some enterprises to cities along the BRI and generates corresponding agglomeration effects through the redistribution of economic factors (Shao et al., 2019). In different stages of economic development, economic agglomeration has different effects on energy conservation and emission reduction. In the early stage of economic development, due to the size of the agglomeration effect and spillover effects, various factors of element concentration are helpful to save costs and improve efficiency, and energy and the environment are the factors of production input conditions. The agglomeration process helps improve the utilization efficiency of energy and environmental elements and thus to a certain extent reduces carbon emissions. In addition, the process of economic agglomeration is accompanied by a variety of positive externalities, which are conducive to promoting technological progress and improving factor productivity, thus playing a positive role in energy conservation and emission reduction and alleviating the pollution haven effect to a certain extent (Zeng and Zhao, 2009; Glaeser and Kahn, 2010). However, with the development of the economy, economic agglomeration accelerates energy consumption and corresponding carbon emissions by expanding the regional production scale and factor input quantity, thus adversely affecting the goal of energy conservation and emission reduction. When the economy continues to develop to a certain stage, the environment begins to have the function of “self-purification”. Therefore, the relationship between economic agglomeration and carbon emissions depends on the stage of economic development (Shao et al., 2019). Since most cities in China have completed the continuous process of transformation to clean energy by the secondary industry, they have experienced advantages in the green transformation and management of the secondary industry, and have given more attention to the impact of economic activities on the environment in the process of economic agglomeration. Accordingly, this paper proposes hypothesis 1:
H1: The BRI may reduce the carbon emissions of cities along the routes through the economic agglomeration effect.Second, the technological effect refers to the BRI’s influence on the environmental quality of cities along the routes by influencing technological progress. According to the Porter hypothesis, strict economic and environmental policies formulated by the government promote technological innovation and achieve a win‒win situation of economic growth and environmental improvement. Technological progress improves energy utilization efficiency and productivity, thus reducing energy consumption and carbon emissions; technological progress also promotes the transformation of the energy structure, which can convert traditional high-carbon energy consumption to renewable clean energy consumption, thus reducing carbon emissions. However, as enterprises pursue profit maximization, technological innovation in practice becomes more about improving efficiency and expanding production, which increases energy consumption and carbon emissions. Based on these theories, this study proposes hypothesis 2:
H2: The BRI may reduce the carbon emissions level of cities along the routes through the technological effect of economic growth.Third, the industrial structure effect refers to the impact of the BRI on the environmental quality of regions along the routes. Generally, the decline in the proportion of the secondary industry and the rise of the proportion of the tertiary industry are conducive to the improvement in environmental quality. This is because secondary industries, such as the power sector, natural gas extraction, petroleum and other industries, are energy and carbon intensive. The average energy intensity of tertiary industries, such as finance and tourism are lower than that of secondary industries (Xu et al., 2014; Mi et al., 2015; Shuai et al., 2018). The Green BRI has identified clean industry as a common demand of all Belt and Road regions, so the BRI can improve environmental quality by promoting a clean industrial structure in cities along the routes. On this basis, this paper proposes hypothesis 3:
H3: The BRI may influence the carbon emission level of cities along the routes through the industrial structure effect.
In recent years, the difference-in-differences (DID) model has been widely used in the quantitative evaluation of the implementation effect of public policies or projects in econometrics. The simplest method to evaluate the effect of policy implementation is to compare the difference before and after the policy’s implementation in the treatment group. However, as the macroeconomic environment changes over time (time effects), simply using the differences after the implementation of the policy cannot reflect the implementation effect of the policy. Therefore, to solve the above problems, we need to use a sample outside the policy implementation region (control group) as the counterfactual reference and then use the difference before and after the policy implementation of the control group as the time effect of the treatment group. The differences before and after policy implementation in the treatment group were subtracted from the differences before and after policy implementation in the control group to obtain more reliable policy estimates (Ashenfelter, 1978; Card and Krueger, 2000). Compared to other natural experimental designs, the advantage of the DID method lies in the use of a quasi-natural experimental method to alleviate the estimation bias caused by endogeneity problems.
Therefore, this paper uses the DID method to study the impact of the BRI on the carbon emissions of cities along the routes. When using the DID method to estimate the effect of policy implementation, the key problem lies in the accurate identification of the treatment group and control group as well as the time of policy impact. Following Kong et al. (Kong et al., 2021), this paper regards the proposal of the BRI in 2013 as the time node of policy impact and treats Chinese cities along the Belt and Road as the treatment group, while the other cities are taken as the control group. The impact of the BRI on carbon emissions is accurately measured by using the DID method. The specific model settings are as follows.
In Eq. 1, subscripts
The carbon emission level is represented by the carbon emission intensity and carbon emission density. Carbon emissions per unit of GDP (also known as carbon intensity, or CEI) can be used to measure regional carbon emission performance. Regional carbon emissions have strong fluctuations, and carbon emission intensity is the carbon emissions per unit GDP, which not only reflects the characteristics of carbon emissions but also has a more normal distribution. Therefore, this paper chooses carbon emission intensity as the dependent variable. For carbon emission calculations, including carbon emissions from direct and indirect energy consumption, such as gas, liquefied petroleum gas, electricity and heat, the carbon emissions generated by direct energy consumption are calculated using the relevant transformation factor provided by IPCC 2006 (Wu et al., 2005; Feng et al., 2010; Jianxin and Zhiyong, 2016). The carbon emissions generated by power consumption are calculated by using the carbon emission factor of each regional power grid (Glaeser and Kahn, 2010).
We use the dummy variables to represent the policy effects of the BRI. The policy implementation is based on the BRI proposed in 2013. This paper takes 2013 as the start of the policy implementation, and the key provinces and node cities mentioned in the Vision and Actions on Jointly Building the Silk Road Economic Belt and 21st-Century Maritime Silk Road, jointly issued by the National Development and Reform Commission, Ministry of Foreign Affairs and Ministry of Commerce in 2015, are taken as the treatment group, and cities not mentioned as are the control group.
For the various factors affecting carbon emissions, we add a group of control variables, including per capita income level, urbanization, total import and export volume, fixed asset investment, technological progress, and industrial structure.
With reference to Shuai et al. (2018), our data are measured by the natural logarithm of the real GDP per capita. According to the classical environmental Kuznets curve (EKC), there is an inverted U-shaped relationship between per capita income and environmental pollution. Therefore, the quadratic term of per capita GDP is added into the model.
Using the study of Zheng et al. (2016) as a reference, the ratio of tertiary to secondary industry represents the industrial structure. The industrial sector is the “largest consumer” of carbon emissions (Shao et al., 2011). There is an agreement that the ratio of tertiary and secondary industry is a factor stimulating carbon emissions (Shuai et al., 2018).
The proportion of the urban population in the total population is measured. On the one hand, the process of urbanization triggers a large energy demand, resulting in a corresponding increase in carbon emissions (Sadorsky, 2013). On the other hand, when the level of urbanization exceeds a certain stage, the application of new environmental protection technologies, the improvement of energy efficiency, the implementation of low-carbon green cities and other factors are conducive to carbon emission reduction. Therefore, both the primary and secondary terms of urbanization are introduced into the model in this paper to verify the inverted U-shaped relationship between urbanization and carbon emissions (He et al., 2017).
Measured by the total amount of deposits and loans of financial institutions at the end of the year, the level of financial development plays an important role in the development of the local economy. Regions with high financial development are more attractive to foreign investment. The expansion of capital and financial markets increases the establishment and purchase of new production lines, which has an important impact on local carbon emissions (Saud et al., 2020).
The total amount of imports and exports represents the level of opening up. Generally, the greater the total amount of imports and exports is, the higher the level of opening-up.
Drawing on the approach of Kong et al. (2021), we use the per capita number of invention patents to measure the technological level of Chinese cities.
Referring to the study of Kong et al. (2021), road miles are used as a measurement. To a certain extent, infrastructure development can contribute to energy savings and emission reduction because infrastructure development, as the cornerstone of economic development, can reduce the time cost of human capital aggregation and the transportation cost of physical capital, thus improving productivity and resource utilization and reducing the level of urban carbon emissions.
This indicator is measured by the total amount of fixed asset investment in the whole society. There is little dispute in the academic community that fixed asset investment induces carbon emissions because it expands the scale of the transportation, construction and manufacturing industries, which are recognized to increase carbon emissions (Ma et al., 2017).
Most scholars use average years of schooling to measure the regional education level per capita, but due to the availability of data, this paper uses the number of students per 10,000 people to measure the human capital of a city. When human capital is closely related to the degree of environmental pollution and trade liberalization and openness increase, a large amount of labor becomes concentrated in pollution-intensive industries. At that time, the increase in human capital accompanies the deterioration of environmental quality (Ma et al., 2017).
The BRI was officially proposed in 2013. However, given that a parallel hypothesis is needed to test the effect of policy shocks, we select the sample period from 2006 to 2020 to expand the sample size and improve the reliability of the empirical results. Since the sample data of some cities along the Belt and Road are not available, we exclude the Tibet Autonomous Region. The objective sample includes the key provinces and cities along the Belt and Road, as defined in Vision and Actions in 2015. Of a total of 282 cities, 149 cities along the Belt and Road are selected as the treatment group, and 133 other cities not affected by the BRI are selected as the control group, which is reported in columns (1–3) of Table 1.
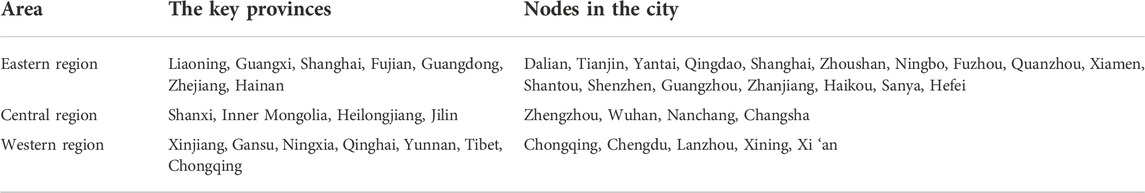
TABLE 1. Key provinces and cities along the BRI.
The number of patent applications granted in this paper is obtained from the Chinese Research Data Services Platform (CNRDS) (https://www.cnrds.com/Home/Login). Regional grid baseline emission factors are retrieved from the website of the Ministry of Resources and Environment. Other data are obtained from the China Statistical Yearbooks, China City Statistical Yearbooks, China Cities Economic Statistical, China Urban Construction Yearbooks, China Energy Statistical Yearbooks, and the Yearbooks of provinces and cities and statistical bulletins of prefecture-level cities. In this paper, the linear interpolation method is used to complete the balanced panel of some prefecture-level cities. Nominal variables, such as GDP, total deposits and loans of financial institutions, investment in fixed assets, and total import and export, are converted into constant prices based on 2006 by using the GDP deflator of each province, and logarithmic processing is performed in the regression process. The descriptive statistics of the main variables are shown in the following table: Table 2.

TABLE 2. Descriptive statistics of the main variables.
The regression results of the benchmark model are shown in Table 3. The first column represents the impact of the BRI on the carbon emission intensity of Chinese cities along the routes. Considering increasing attention to carbon emission reduction at the national level with the development of the economy, cities along the BRI should transition process from high carbon to low carbon rather than being negatively affected by the BRI. Ignoring the change trend of carbon emissions caused by economic development could lead to spurious regression problems. Therefore, this paper sets a continuous variable T to represent the time trend and adds the interaction term between the time trend and the treatment group into the regression model. The second column shows that the results are still significant after the addition of the time trend term. Although the significance decreases, the coefficient increases slightly, which to some extent indicates that it is reasonable to add the time trend term into the model.
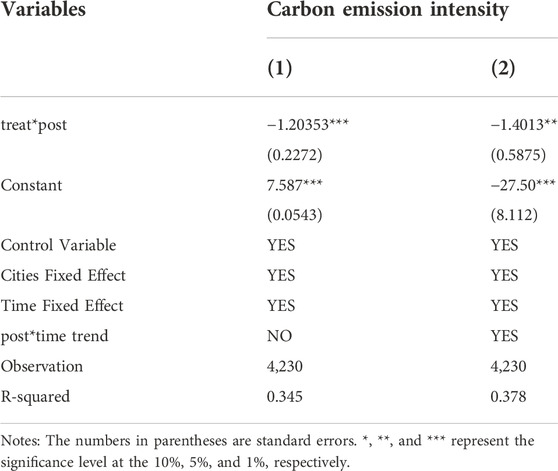
TABLE 3. Benchmark regression.
As seen from the regression results in Table 4, the coefficient of
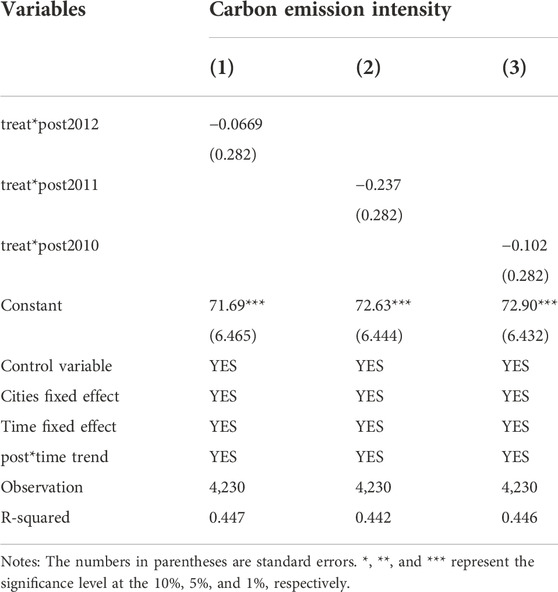
TABLE 4. Placebo test.
The reliability of the empirical results reported by the benchmark model depends on the validity of the multiplier estimation. Therefore, in this section, a series of effectiveness tests will be conducted, including parallel trend tests and several placebo tests.
The key condition of the DID method is to ensure that the treatment and control groups meet the common trend assumption. Therefore, this paper draws on the practice of Beck et al. (2010) to verify the change trend of the treatment group and the control group before the implementation of the BRI. The model is set as follows.
In Eq. 2,
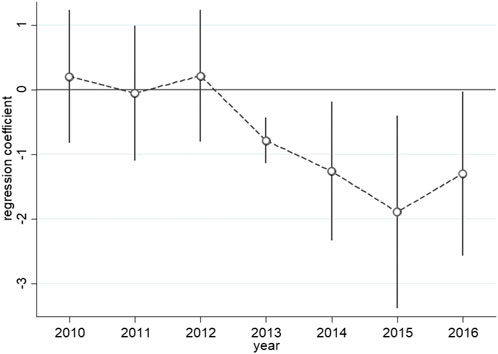
FIGURE 1. Parallel trend test.
To eliminate the influence of policies or random interference factors other than the BRI, this paper advances the start date time of the BRI by 1 year, 2 years, and 3 years, and carries out the placebo test, and the conclusions are shown in Table 5. The estimated coefficients of

TABLE 5. Excluding the interference of other policies.
China also introduced a number of other policies affecting carbon emissions in the sample year. For example, in 2011, the Chongqing-Xinjiang-Europe freight train from Chongqing to Duisburg was officially opened to traffic, becoming the first truly China-Europe freight train. The carbon emission trading policy, launched in 2013, was piloted in seven provinces and cities, including Beijing, Shanghai, Tianjin, Chongqing, Guangdong, Hubei and Shenzhen. The treatment and control groups may be affected by these concurrent policies. Therefore, to solve this problem, this paper sets two additional control variables,

TABLE 6. PSM-DID test.
There may be systemic differences between cities participating in the BRI and other cities, which may lead to bias in the results in dual difference selection. Therefore, the PSM-DID method is used in this paper to test the robustness of the baseline regression. This study uses the level of economic development, level of infrastructure construction, industrial structure, technological innovation, level of opening up and industrial structure as covariables to match the propensity scores of cities participating in the Belt and Road construction. The matching results show that 60 cities failed to find the appropriate control group. In this paper, the matching results were further tested and found to meet the equilibrium conditions. Therefore, the DID method can be used for regression. The regression results are shown in Table 7. Columns (1) and (2) are the results of the random effect regression, and columns (3) and (4) are the results of the fixed effect regression. In terms of the coefficient, symbol and significance of the regression results, whether control variables are added or not, the implementation of the Belt and Road policy has a significant effect on reducing carbon emission intensity, indicating that the conclusion of the basic regression is robust.
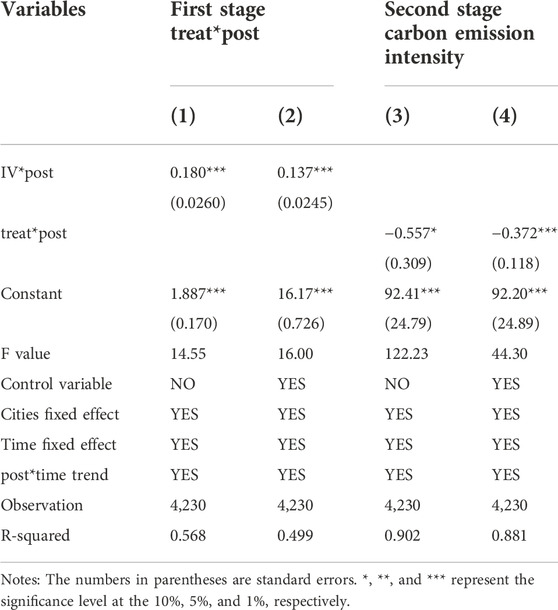
TABLE 7. Endogeneity test: Instrumental variables method.
In this paper, the instrumental variable method is used to eliminate the possible endogeneity problems in the model. Referring to Duranton et al. (2014) and Agrawal et al. (2017), this paper introduces the ancient Silk Road of China as the instrumental variable of cities along the Belt and Road into the model. This instrumental variable theoretically meets two conditions of effective instrumental variables: first, the Belt and Road is based on the ancient Silk Road, and one of its main goals is to revive the ancient Silk Road. Therefore, the selection of cities along the Belt and Road is highly correlated with the regions along the ancient Silk Road routes. Second, the ancient Silk Road is not correlated with the carbon emission level of modern cities, so this instrumental variable meets the exogeneity condition.
In the empirical analysis, we first set the instrumental variable
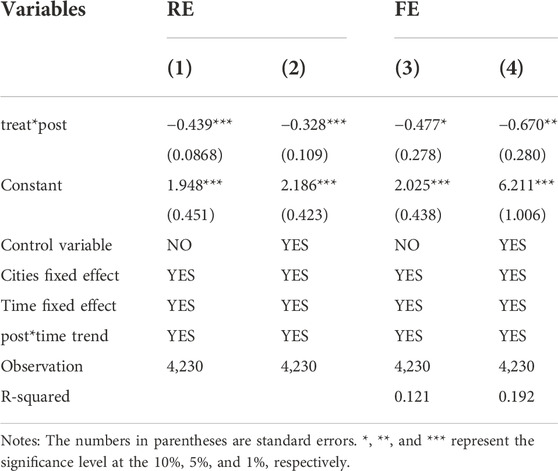
TABLE 8. Using per capita carbon emissions.
Considering that per capita carbon emissions are also a common indicator used to measure carbon emissions, per capita carbon emissions are used to replace the carbon emission intensity indicator to verify the robustness of the model. The regression results are shown in Table 9. Columns (1) and (2) are the results of the random effect regression, and columns (3) and (4) are the results of the fixed effect regression. From the regression results, the implementation of the BRI has a significant reduction effect on the per capita carbon emissions of cities along the routes, indicating that the conclusion of the basic regression is robust.
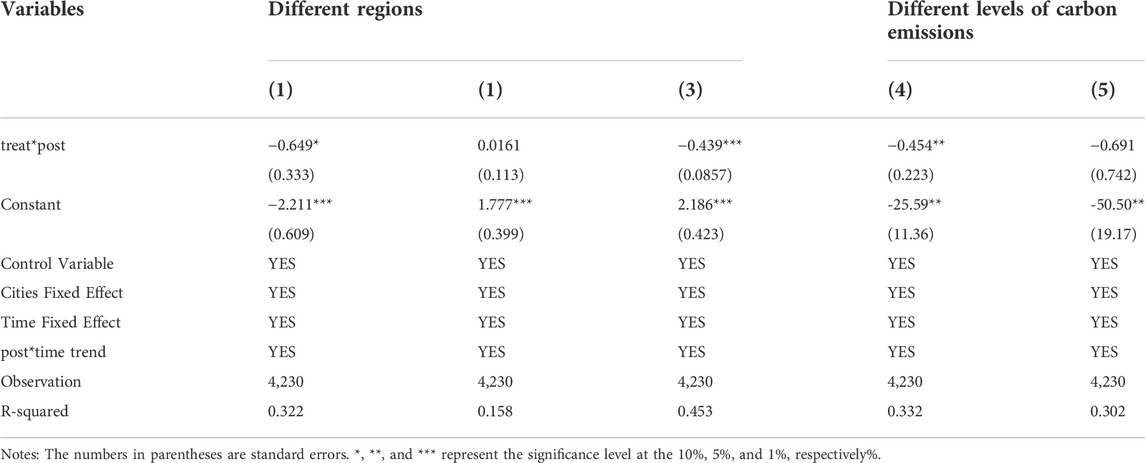
TABLE 9. Heterogeneity test.
This paper examines the heterogeneity of the model from two aspects. First, according to the division of China’s administrative location, the sample is divided into three regions, eastern, central and western areas, to test the impact of the BRI on carbon emissions in different regions. Second, according to the median of carbon emission intensity in 2013, each city is defined as either a high carbon emission city (carbon emission intensity higher than the median of 2013) or a low carbon emission city (carbon emission intensity lower than the median of 2013). The heterogeneity test results are shown in Table 10. Columns (1), (2), and (3) are the regression results based on the sampled cities in the eastern, central and western regions, respectively. Columns (4) and (5) are the regression results based on cities with high and low carbon emissions, respectively. It can be seen that the BRI is more effective in reducing carbon emission intensity in the eastern and western regions, which may be because most cities along the routes are concentrated in the western and eastern regions. In addition, the impact of the BRI is more significant for cities with high carbon emissions than for cities with low carbon emissions, possibly because cities with high carbon emissions have more potential to reduce carbon emission levels.
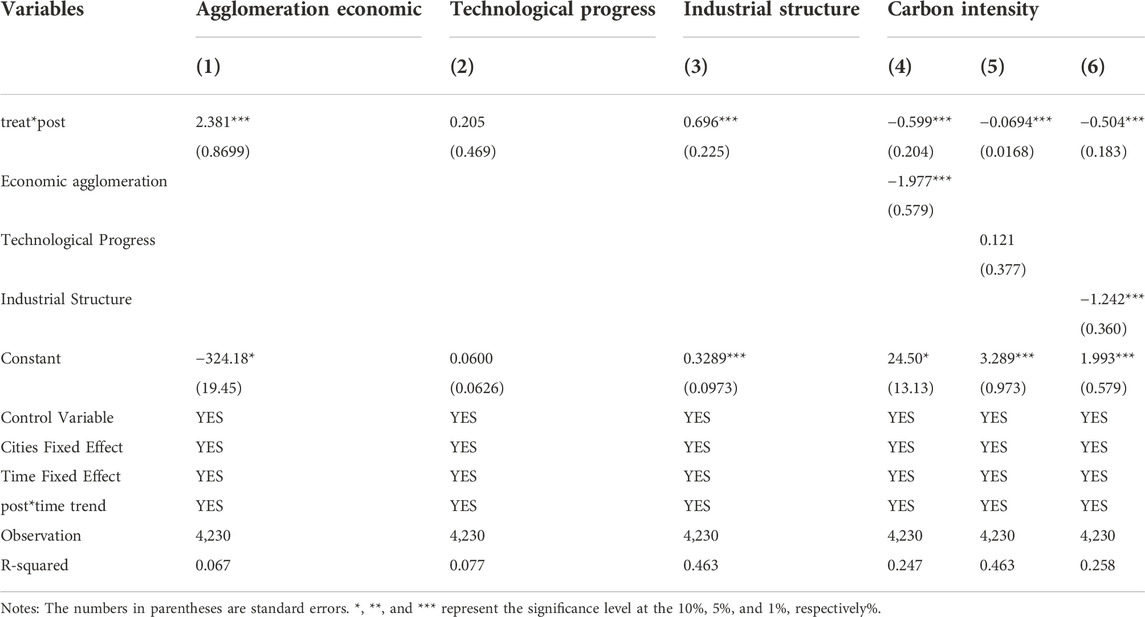
TABLE 10. Test of action mechanism.
The empirical analysis presented in Section IV indicates that the BRI can significantly reduce the carbon emissions in Chinese cities along the routes. Theoretical analysis shows that participation in the construction of the BRI can affect the carbon emissions of cities along the routes through the economic agglomeration effect, technological effect and industrial structure effect. In this section, we test the impact mechanism of the BRI on carbon emissions in Chinese cities along the routes using an intermediary effect model. The specific model is as follows.
To test the validity of the three mechanisms proposed by theoretical mechanism analysis, this paper carries out corresponding empirical tests. The results show that participation in the BRI can reduce carbon emission intensity through the economic agglomeration effect and industrial structure effect, but the effect of reducing carbon emission intensity through the technology effect is not obvious.
Table 10 shows the mechanism of the inspection results. Columns (1–3) present the test of Eq. 3 and are explained by the economic agglomeration, technological progress and industrial structure. Columns (4–5) present the test of Eq. 2, including per capita Eq. 4 GDP, the level of openness, the financial development level, investment in fixed assets, urbanization rate, etc. Columns (1) and (4) show that the BRI can significantly improve the degree of economic agglomeration of cities along the routes, and economic agglomeration can significantly reduce the carbon emission intensity of cities along the routes, indicating that the BRI can reduce carbon emissions by improving the degree of economic agglomeration. Columns (3) and (6) show that the BRI can reduce carbon emissions through industrial structure adjustment. However, according to model (3), the effect of the BRI on the technological progress of cities along the routes is not obvious. According to column (4), the coefficient of technological progress is positive but not significant, indicating that technological progress does not have a positive effect on carbon emission intensity. If technological progress is characterized by a “green bias”, it will not be conducive to energy conservation and emission reduction because it will cause the expansion of the production scale (Shao et al., 2019). Due to the relatively long period of the environmental protection effect of technological progress, local governments may be more inclined to invest fiscal expenditures in areas with more immediate economic growth effects than energy conservation and emission reduction technology (Kezhong et al., 2011). In addition, the development and application of new technologies often have a time lag, and the development and promotion of new energy-saving and emission reduction technologies usually become evident over a certain period. Therefore, current technological advances do not necessarily reduce carbon intensity.
In this paper, the DID method was used to empirically analyze the impact of the BRI on the carbon emissions of cities along the routes of the BRI in China, as well as the heterogeneous impacts of the BRI on cities in different regions and with different carbon emission intensities. Through theoretical and empirical analysis, the following conclusions were drawn. First, the BRI has significantly reduced the carbon intensity of cities along the routes. The results remained robust after the introduction of counterfactual tests, the replacement of carbon emission measures, the use of GMM models to mitigate possible endogeneity, and other robustness tests. Second, the results of heterogeneity analysis show that the BRI has a significant reduction effect on carbon emission intensity in the eastern and western regions but not in the central region. It has a significant effect on cities with higher carbon emission intensity but has no significant effect on cities with lower carbon emission intensity. Finally, the results of the mechanism analysis show that the BRI can reduce the carbon emission level by promoting economic agglomeration and industrial structure adjustment of cities along the Belt and Road, but the impact of reducing carbon emission intensity through technological progress is not significant.
Based on the above conclusions, the following policy recommendations of this study are offered. First, China should continue to adhere to the concept of green development along the Belt and Road; adhere to the general principles of green production, green trade, green finance and green living; expand the coverage of the BRI; and allow more cities to participate in the construction of the BRI. Second, we should vigorously develop the economy of city clusters, support the construction of cities along the Belt and Road, and promote regional economic integration. The results of the mechanism analysis show that the BRI can reduce the carbon emission intensity of cities along the routes through the economic agglomeration effect. This is evidence of the environmental effect of economic agglomeration in Chinese cities and suggests that promoting a regional integration strategy and pursuing China’s energy conservation and emission reduction target may have promising implementation effects. Finally, cities along the routes should focus on adjusting their industrial structure while adhering to the coordinated development of the three major industries. On the one hand, carbon emissions from secondary industries, such as electricity, manufacturing and construction, should be strictly controlled to promote the production capacity of these industries. On the other hand, the development of low-carbon tertiary industry should be encouraged, and the transformation of some industries from secondary industries to tertiary industries should be promoted.
The research deficiencies and future research prospects of this paper are as follows. First, the research data are from the urban level in China. In the following research, it is possible to study carbon emissions from the national level or the industrial level to obtain more targeted policy suggestions. Second, the optimization of the energy structure is the key to carbon neutrality. Will the BRI further promote the upgrading of China’s energy consumption structure while reducing the carbon emissions of Chinese cities? Due to the length and the research topic, we have not engaged in a deep discussion on the above two points, which is not only because of the lack of research in this paper but also shows that there is a potential for future research directions.
The datasets presented in this study can be found in online repositories. The names of the repository/repositories and accession number(s) can be found in the article/supplementary material.
Ethical review and approval was not required for the study on human participants in accordance with the local legislation and institutional requirements. Written informed consent for participation was not required for this study in accordance with the national legislation and the institutional requirements.
ZC: conceptualization, data, methodology, formal analysis, and visualization; JZ: conceptualization, writing—original draft, writing; PL: data, methodology, formal analysis, and visualization; FA: methodology, formal analysis, writing—original draft; FFL: conceptualization, writing—original draft; CL: writing—review and editing.
The work was supported by the Social Science Foundation of Ministry of Education of China (18YJA790007); Philosophy and Social Science Foundation of Gansu Province, China (20YB001); Gansu Province to study and interpret the spirit of the 14th Party Congress special project (2022ZD006).
The authors declare that the research was conducted in the absence of any commercial or financial relationships that could be construed as a potential conflict of interest.
All claims expressed in this article are solely those of the authors and do not necessarily represent those of their affiliated organizations, or those of the publisher, the editors and the reviewers. Any product that may be evaluated in this article, or claim that may be made by its manufacturer, is not guaranteed or endorsed by the publisher.
Abban, O. J., Wu, J. Y., and Mensah, I. A. (2020). Analysis on the nexus amid CO2 emissions, energy intensity, economic growth, and foreign direct investment in belt and road economies: Does the level of income matter? Environ. Sci. Pollut. Res. 27 (10), 11387–11402. doi:10.1007/s11356-020-07685-9
Agrawal, A., Galasso, A., and Oettl, A. (2017). Roads and innovation. Rev. Econ. Stat. 99 (3), 417–434. doi:10.1162/REST_a_00619
Andreoni, J., and Levinson, A. (2001). The simple analytics of the environmental Kuznets curve. J. Public Econ. 80 (2), 269–286. doi:10.1016/S0047-2727(00)00110-9
Ascensão, F., Fahrig, L., Clevenger, A. P., Corlett, R. T., Jaeger, J. A. G., Laurance, W. F., et al. (2018). Environmental challenges for the belt and road initiative. Nat. Sustain. 1 (5), 206–209. doi:10.1038/s41893-018-0059-3
Ashenfelter, O. (1978). Estimating the effect of training programs on earnings. Rev. Econ. Statistics 60 (1), 47–57. doi:10.2307/1924332
Beck, T., Levine, R., and Levkov, A. (2010). Big bad banks? The winners and losers from bank deregulation in the United States. J. Finance 65 (5), 1637–1667. doi:10.1111/j.1540-6261.2010.01589.x
Birdsall, N., and Wheeler, D. (1993). Trade policy and industrial pollution in Latin America: Where are the pollution havens? J. Environ. Dev. 2 (1), 137–149. doi:10.1177/107049659300200107
Cai, B., Cui, C., Zhang, D., Cao, L., Wu, P., Pang, L., et al. (2019). China city-level greenhouse gas emissions inventory in 2015 and uncertainty analysis. Appl. Energy 253, 113579. doi:10.1016/j.apenergy.2019.113579
Cai, X., Che, X., Zhu, B., Zhao, J., and Xie, R. (2018). Will developing countries become pollution havens for developed countries? An empirical investigation in the belt and road. J. Clean. Prod. 198, 624–632. doi:10.1016/j.jclepro.2018.06.291
Card, D., and Krueger, A. B. (2000). Minimum wages and employment: A case study of the fast-food industry in New Jersey and Pennsylvania: Reply. Am. Econ. Rev. 90 (5), 1397–1420. doi:10.1257/aer.90.5.1397
Duranton, G., Morrow, P. M., and Turner, M. A. (2014). Roads and trade: Evidence from the US. Rev. Econ. Stud. 81 (2), 681–724. doi:10.1093/restud/rdt039
Fan, J-L., Da, Y-B., Wan, S-L., Zhang, M., Cao, Z., Wang, Y., et al. (2019). Determinants of carbon emissions in ‘belt and road initiative’ countries: A production technology perspective. Appl. Energy 239, 268–279. doi:10.1016/j.apenergy.2019.01.201
Fan, J-L., Dong, Y., and Zhang, X. (2020). How does “the Belt and Road” and the Sino-US trade conflict affect global and Chinese CO2 emissions? Environ. Sci. Pollut. Res. 27 (31), 38715–38731. doi:10.1007/s11356-020-09935-2
Feng, W., Lihua, W., and Chao, Y. (2010). Driving factors for growth of carbon dioxide emissions during economic development in China. Econ. Res. J. 45 (02), 123–136.
Fisher-Vanden, K., Jefferson, G. H., Ma, J. K., and Xu, J. Y. (2006). Technology development and energy productivity in China. Energy Econ. 28 (5-6), 690–705. doi:10.1016/j.eneco.2006.05.006
Gerlagh, R. (2007). Measuring the value of induced technological change. Energy Policy 35 (11), 5287–5297. doi:10.1016/j.enpol.2006.01.034
Glaeser, E. L., and Kahn, M. E. (2010). The greenness of cities: Carbon dioxide emissions and urban development. J. Urban Econ. 67 (3), 404–418. doi:10.1016/j.jue.2009.11.006
Han, L., Han, B., Shi, X., Su, B., Lv, X., and Lei, X. (2018). Energy efficiency convergence across countries in the context of China’s Belt and Road initiative. Appl. Energy 213, 112–122. doi:10.1016/j.apenergy.2018.01.030
He, Z., Xu, S., Shen, W., Long, R., and Chen, H. (2017). Impact of urbanization on energy related CO2 emission at different development levels: Regional difference in China based on panel estimation. J. Clean. Prod. 140, 1719–1730. doi:10.1016/j.jclepro.2016.08.155
Huang, M-X., and Li, S-Y. (2020). The analysis of the impact of the Belt and Road initiative on the green development of participating countries. Sci. Total Environ. 722, 137869. doi:10.1016/j.scitotenv.2020.137869
Jahanger, A. (2021). Influence of FDI characteristics on high-quality development of China's economy. Environ. Sci. Pollut. Res. 28 (15), 18977–18988. doi:10.1007/s11356-020-09187-0
Jiang, L., Zhou, H-F., Bai, L., and Zhou, P. (2018). Does foreign direct investment drive environmental degradation in China? An empirical study based on air quality index from a spatial perspective. J. Clean. Prod. 176, 864–872. doi:10.1016/j.jclepro.2017.12.048
Jiang, Q., Ma, X., and Wang, Y. (2021). How does the one belt one road initiative affect the green economic growth? Energy Econ. 101, 105429. doi:10.1016/j.eneco.2021.105429
Jianxin, W., and Zhiyong, G. (2016). Research on the convergence of carbon dioxide emissions in China:A continuous dynamic distribution approach. Stat. Res. 33 (01), 54–60. doi:10.19343/j.cnki.11-1302/c.2016.01.008
Kezhong, Z., Juan, W., and Xiaoyong, C. (2011). Fiscal decentralization and environmental pollution: From the perspective of carbon emission. China Ind. Econ. 10, 65–75. doi:10.19581/j.cnki.ciejournal.2011.10.007
Kong, Q., Chen, A., Shen, C., and Wong, Z. (2021). Has the Belt and Road Initiative improved the quality of economic growth in China's cities? Int. Rev. Econ. Finance 76, 870–883. doi:10.1016/j.iref.2021.07.001
Leonard, H. J. (1984). Are environmental regulations driving U.S. Industry overseas? Washington D C: Conservation Foundation.
Li, J. S., Zhou, H. W., Meng, J., Yang, Q., Chen, B., and Zhang, Y. Y. (2018). Carbon emissions and their drivers for a typical urban economy from multiple perspectives: A case analysis for beijing city. Appl. Energy 226, 1076–1086. doi:10.1016/j.apenergy.2018.06.004
Liu, H., Wang, Y., Jiang, J., and Wu, P. (2020). How green is the “belt and road initiative”? – evidence from Chinese OFDI in the energy sector. Energy Policy 145, 111709. doi:10.1016/j.enpol.2020.111709
Liu, Q., Wang, S., Zhang, W., Zhan, D., and Li, J. (2018). Does foreign direct investment affect environmental pollution in China's cities? A spatial econometric perspective. Sci. Total Environ. 613, 521–529. doi:10.1016/j.scitotenv.2017.09.110
Ma, M., Yan, R., Du, Y., Ma, X., Cai, W., and Xu, P. (2017). A methodology to assess China's building energy savings at the national level: An IPAT–LMDI model approach. J. Clean. Prod. 143, 784–793. doi:10.1016/j.jclepro.2016.12.046
Mao, X., and Wang, Y. (2022). Cooperative carbon emission reduction through the belt and road initiative. Environ. Sci. Pollut. Res. 29 (7), 10005–10026. doi:10.1007/s11356-021-16130-4
Mi, Z-F., Pan, S-Y., Yu, H., and Wei, Y-M. (2015). Potential impacts of industrial structure on energy consumption and CO2 emission: A case study of beijing. J. Clean. Prod. 103, 455–462. doi:10.1016/j.jclepro.2014.06.011
Muhammad, S., Long, X., Salman, M., and Dauda, L. (2020). Effect of urbanization and international trade on CO2 emissions across 65 belt and road initiative countries. Energy 196, 117102. doi:10.1016/j.energy.2020.117102
Sadorsky, P. (2013). Do urbanization and industrialization affect energy intensity in developing countries? Energy Econ. 37, 52–59. doi:10.1016/j.eneco.2013.01.009
Saud, S., Chen, S., Haseeb, A., and Sumayya, A. (2020). The role of financial development and globalization in the environment: Accounting ecological footprint indicators for selected one-belt-one-road initiative countries. J. Clean. Prod. 250, 119518. doi:10.1016/j.jclepro.2019.119518
Shao, S., Ke, Z., and Jianmin, D. (2019). Effects of economic agglomeration on energy saving and emission reduction:theory and empirical evidence from China. Manag. World 35 (01), 36–60+226. doi:10.19744/j.cnki.11-1235/f.2019.0005
Shao, S., Yang, L., Yu, M., and Yu, M. (2011). Estimation, characteristics, and determinants of energy-related industrial CO2 emissions in Shanghai (China), 1994-2009. Energy Policy 39 (10), 6476–6494. doi:10.1016/j.enpol.2011.07.049
Shuai, C. Y., Chen, X., Wu, Y., Tan, Y. T., Zhang, Y., and Shen, L. Y. (2018). Identifying the key impact factors of carbon emission in China: Results from a largely expanded pool of potential impact factors. J. Clean. Prod. 175, 612–623. doi:10.1016/j.jclepro.2017.12.097
Teo, H. C., Lechner, A. M., Walton, G. W., Chan, F. K. S., Cheshmehzangi, A., Tan-Mullins, M., et al. (2019). Environmental impacts of infrastructure development under the belt and road initiative. Environments 6 (6), 72. doi:10.3390/environments6060072
Verbano, C., and Crema, M. (2016). Linking technology innovation strategy, intellectual capital and technology innovation performance in manufacturing SMEs. Technol. Analysis Strategic Manag. 28 (5), 524–540. doi:10.1080/09537325.2015.1117066
Wang, Y. F., Zhao, H. Y., Li, L. Y., Liu, Z., and Liang, S. (2013). Carbon dioxide emission drivers for a typical metropolis using input-output structural decomposition analysis. Energy Policy 58, 312–318. doi:10.1016/j.enpol.2013.03.022
Wei, B. Y., Fang, X. Q., and Wang, Y. A. (2011). The effects of international trade on Chinese carbon emissions: An empirical analysis. J. Geogr. Sci. 21 (2), 301–316. doi:10.1007/s11442-011-0846-5
Wei, J., Huang, K., Yang, S. S., Li, Y., Hu, T. T., and Zhang, Y. (2017). Driving forces analysis of energy-related carbon dioxide (CO2) emissions in beijing: An input-output structural decomposition analysis. J. Clean. Prod. 163, 58–68. doi:10.1016/j.jclepro.2016.05.086
Wu, L. B., Kaneko, S., and Matsuoka, S. (2005). Driving forces behind the stagnancy of China's energy-related CO2 emissions from 1996 to 1999: The relative importance of structural change, intensity change and scale change. Energy Policy 33 (3), 319–335. doi:10.1016/j.enpol.2003.08.003
Wu, Y., Chen, C. L., and Hu, C. (2021). Does the belt and road initiative increase the carbon emission intensity of participating countries? China & World Econ. 29 (3), 1–25. doi:10.1111/cwe.12374
Xu, S. C., He, Z. X., and Long, R. Y. (2014). Factors that influence carbon emissions due to energy consumption in China: Decomposition analysis using LMDI. Appl. Energy 127, 182–193. doi:10.1016/j.apenergy.2014.03.093
Xu, Y., Dong, B., and Chen, Z. (2022). Can foreign trade and technological innovation affect green development: Evidence from countries along the belt and road. Econ. Change Restruct. 55 (2), 1063–1090. doi:10.1007/s10644-021-09337-5
Zeng, D. Z., and Zhao, L. (2009). Pollution havens and industrial agglomeration. J. Environ. Econ. Manag. 58 (2), 141–153. doi:10.1016/j.jeem.2008.09.003
Zhang, N., Liu, Z., Zheng, X. M., and Xue, J. J. (2017). Carbon footprint of China's belt and road. Science 357 (6356), 1107. doi:10.1126/science.aao6621
Zheng, H., Hu, J., Guan, R., and Wang, S. (2016). Examining determinants of CO2 emissions in 73 cities in China. Sustainability 8 (12), 1296. doi:10.3390/su8121296
Zheng, Y., Peng, J. C., Xiao, J. Z., Su, P. D., and Li, S. Y. (2020). Industrial structure transformation and provincial heterogeneity characteristics evolution of air pollution: Evidence of a threshold effect from China. Atmos. Pollut. Res. 11 (3), 598–609. doi:10.1016/j.apr.2019.12.011
Zivkovic, S. B., Veljkovic, M. V., Bankovic-Ilic, I. B., Krstic, I. M., Konstantinovic, S. S., Ilic, S. B., et al. (2017). Technological, technical, economic, environmental, social, human health risk, toxicological and policy considerations of biodiesel production and use. Renew. Sustain. Energy Rev. 79, 222–247. doi:10.1016/j.rser.2017.05.048
Keywords: belt and road initiative, carbon emission, difference-in-differences model, cities along the route, environmental impacts
Citation: Zhang J, Li P, Liza FF, Ahmad F, Lv C and Cao Z (2023) How does the belt and road initiative affect the carbon emissions of China’s cities?. Front. Environ. Sci. 10:1066122. doi: 10.3389/fenvs.2022.1066122
Received: 10 October 2022; Accepted: 25 November 2022;
Published: 20 January 2023.
Edited by:
Haider Mahmood, Prince Sattam Bin Abdulaziz University, Saudi ArabiaReviewed by:
Abdul Rauf, Nanjing University of Information Science and Technology, ChinaCopyright © 2023 Zhang, Li, Liza, Ahmad, Lv and Cao. This is an open-access article distributed under the terms of the Creative Commons Attribution License (CC BY). The use, distribution or reproduction in other forums is permitted, provided the original author(s) and the copyright owner(s) are credited and that the original publication in this journal is cited, in accordance with accepted academic practice. No use, distribution or reproduction is permitted which does not comply with these terms.
*Correspondence: Zijian Cao, Y2FvY2FvQGx6dS5lZHUuY24=
Disclaimer: All claims expressed in this article are solely those of the authors and do not necessarily represent those of their affiliated organizations, or those of the publisher, the editors and the reviewers. Any product that may be evaluated in this article or claim that may be made by its manufacturer is not guaranteed or endorsed by the publisher.
Research integrity at Frontiers
Learn more about the work of our research integrity team to safeguard the quality of each article we publish.