 Xinfang Zhang
 Yu Fu
Yu Fu Haitao Zhuang
- Institute of Finance and Economics Research, Shanghai University of Finance and Economics, Shanghai, China
Cities in China are expanding and evolving innovatively at an accelerated rate. In this context, the question of whether all communities and individuals may benefit equally from urbanization and innovation merits investigation. We develop a two-way fixed-effect model employing data from the China Family Panel Studies for 2010, 2012, 2014, 2016, and 2018 to investigate the roles of city size and technological innovation in urban income inequality. In addition, we adopt a model with a mediating effect to study the impact of city size on urban income inequality by technological innovation. The empirical results are as follows: 1) urban income inequality tends to increase with city size, technological innovation, and the effect of city size on urban income inequality by technological innovation. 2) According to a regional heterogeneity test, city size has a significant impact on income inequality in western provinces and in first- and second-tier cities. Likewise, the size of non-resource-based cities has a significant impact on income inequality. Considering the potential endogeneity of city size, we devise an instrumental variable using historical population. The outcomes of a robustness test validate these findings. From the vantage point of city size and technological advancement, this research provides policymakers with a reference for lowering income inequality in urban areas.
1 Introduction
At different times in different countries, income inequality has always been a major issue for humanity. The Italian economist Pareto first proposed that 80% of human wealth was possessed by 20% of the population at the turn of the last century. Approximately a century later, the wealth disparity in the United States reached a new high, with merely 1% of the country’s wealthy families controlling 33.8% of the country’s net wealth. In his book Capitalism in the 21st century, French economist Thomas Piketty (2014) analyzed the changes in wealth and income in 20 Western countries over the past three centuries using voluminous historical data, illustrating that income inequality is a growing problem in all these countries. At the same time, inequality has also increased in the majority of developing countries over the last few decades (Goldberg and Pavcnik, 2007), and Baum-Snow and Pavan (2013) provided evidence of a significant connection between income inequality and city size with a significant positive correlation. While the effects of urbanization and technological progress on income disparity have been the subject of some academic studies, relatively little is learned regarding these factors in developing countries (Baum-Snow and Pavan 2013; Breau et al., 2014; Gaubert 2018; Aghion et al., 2019; Combes et al., 2020; Law et al., 2020).
China is undergoing rapid urbanization, with the rate increasing from 26.4% in 1990 to 63.89% in 2020, implementing progressive development strategies. At the same time, income inequality has been growing at an alarming rate (Xie and Zhou, 2014; Molero-Simarro, 2017). The Gini coefficient increased from a low level of 0.3 in the early 1980s (Wan et al., 2012) to a high level of 0.465 in 2019, rendering inequality a serious threat to the development of society. Long-term economic and social prosperity can be undermined by growing income inequality. Chen et al. (2018) used data from the fifth census of China in 2005 to explore the impact of urban size on income inequality from the perspective of population migration. The inequality that exists within cities is becoming an increasingly important factor, accounting for 74% of urban inequality in 1992 and increasing to 81% in 2009. Moreover, the relationship between city size and income inequality in China from the perspective of technological innovation has not been addressed in the existing literature. We contribute to bridging this gap by examining the connections between city size, technological innovation, and income inequality in China, an intriguing case study. This paper uses China Family Panel Studies data from 2010, 2012, 2014, 2016, and 2018 for 101 prefecture-level cities in order to fill this gap in the literature. We establish a two-way fixed-effect model to examine the effects of city size and technological innovation on income inequality, and we use a mediating effect model to examine the effect of city size on urban income inequality by technological innovation. The sample is then split into three subsamples based on the geographical location of the city, the level of economic development in the city, and the situation of the resource in the city. These subsamples are then used to discuss the various effects that city size and technological innovation have on income inequality. Finally, in order to create an instrumental variable, given the potential endogeneity of city size, we use a regression-based strategy similar to Chen et al. (2018). We attempt to determine if everyone benefits from rapid urbanization and the implementation of innovation strategies.
We contribute to existing works in the following aspects. First and foremost, we concentrate on China, a large developing country in which city size, technological innovation capacity, and income distributions have experienced substantial variation. While China provides a compelling case study, many Chinese cities do not collect data on income inequality directly. To address these problems and adequately organize the data, we measure income inequality by constructing their city-level Gini coefficients through the China Family Panel Studies (CFPS). Second, this is the first study to examine the effect of city size on urban income inequality as a result of technological innovation. Third, we conduct a multitude of robustness checks to assess the uncertainty of our models and the sensitivity of our results to alterations in possible specifications. When examining the micro mechanism of city size on urban income inequality, we use the mediating effect model to analyze the effect of city size on urban income inequality, with technological innovation serving as the mediator.
The remaining sections of this paper are structured as follows: Section 2 provides a literature review of the relationships between city size and income inequality, technological innovation and income inequality, and city size and technological innovation. Section 3 elaborates the construction of empirical models to describe the effect of city size and technological innovation on urban income inequality and summarizes the data, their source, and the status of empirical models. Section 4 examines the empirical relationship between city size, technological innovation, and income inequality, including an analysis of heterogeneity and the mechanisms underlying the impact of city size on urban income inequality via technological innovation. Section 5 presents the robustness tests, while Section 6 concludes the study with a discussion.
2 Literature review and research hypothesis
In order to gain a deeper understanding of the relationship between the size of a city and urban income inequality through technological innovation, we conduct a literature review focusing on the following three facets.
2.1 City size and income inequality
According to the available literature, there is extensive research undertaken on the evolution and determinants of income inequality at the national level. However, at the municipal level, there is a pronounced lack of empirical research. As the significance and accessibility of cities grew, scholars began to investigate the relationship between city size and inequality at the city level. The majority of urban residents have low incomes, which exacerbates inequality: the larger the city, the greater the inequality (Sarkar et al., 2018). Moreover, the majority of researchers believe that urban inequality increases with city size. The advantages of urbanization are increasingly unequally distributed (Heinrich Mora et al., 2021). Baum-Snow and Pavan (2013) analyzed the relationship between city size and income inequality in the United States using data from 1979 to 2004. In recent decades, they discovered a positive correlation between city size and wage inequality, with within-city inequality being the most influential factor; while skill inequality accounted for one-third of urban income disparity (Glaeser et al., 2009). Castells-Quintana et al. (2020), using a sample of 153 cities from OCED, demonstrated that while growth was desirable when a city was small, it was undesirable when a city was large as it increased inequality and posed a risk of reducing social cohesion. Wroński (2021) found that income inequality was relatively high in the largest cities. Sarkar et al. (2018) discovered that the greater the size of a city in Australia, the greater the concentration of high-income individuals. Lee et al. (2016), Chen et al. (2018), and Hortas-Rico and Rios (2019) analyzed the relationship between city size and inequality in the United Kingdom, China, and Spain and reported that urban income inequality increased with city size.
2.2 Technological innovation and income inequality
The theory of endogenous growth indicates that technological progress is the underlying cause of inequality (Howitt and Aghion 1998). Innovations in technology play a crucial role in fostering economic expansion. Economists, therefore, consider the distributional effects of innovation (Aghion et al., 2005; Scott 2009; Bourne et al., 2011; Krätke 2011; Chaminade et al., 2018; Biggi and Giuliani 2021). Theoretically, Acemoglu (1999) and Acemoglu (2002) demonstrated that technological innovation with a skill bias increased the demand for highly skilled labor and altered the skill structure of the labor force, thereby exacerbating income inequality. The conditions of skill-biased technological change and job polarization were both necessary and insufficient to explain income inequality in large U.S. cities (Florida et al., 2017). The research on the influence of technological innovation on income inequality has advanced steadily. Aghion et al. (2019) suggested that innovation, despite being an essential driver of economic growth, may have a substantial effect on income inequality. Perera-Tallo (2017) argued that technological progress exacerbates income inequality. Inequality on the path of long-term growth was exacerbated by the fact that technological change increased the proportion of factors with unequal distribution. In a study of Canadian cities from 1996 to 2006, Breau et al. (2014) found a correlation between innovation and income inequality. They also observed that cities with higher levels of innovation had a more unequal income distribution. Krugman (2008), Anderson (2011), and Stiglitz (2012) concurred that the rise in income inequality was a result of globalization and technological innovation. Despite the existence of studies on the role of technological change in affecting income inequality, Crespo Cuaresma et al. (2013) argued that education or human capital also played a significant role in reducing income inequality and promoting income convergence. Law et al. (2020) explored the role of innovation in income inequality in 23 developed countries and determined that innovation failed to reduce income inequality and actually increased it.
2.3 City size and technological innovation
Florida et al. (2017) advocated explicitly for “the city as an innovation machine.” According to the findings of various academic studies, the rate of innovative activity in large cities is significantly higher than that of other activities such as population or the overall production of goods and services (Bettencourt et al., 2007; Feldman and Kogler 2010; Carlino and Kerr 2015). Applying data from 14 countries and 110 regions in Europe, Van Oort and Bosma (2013) investigated the relationship between urban scale and innovation. They discovered that the primary mechanism for this relationship is human capital. Large cities, in comparison to smaller ones, had more high-end talent, formed larger labor pools, and had geographical advantages that resulted in more innovations per population and attracted more productive R&D1 personnel (Glaeser 2012; Bettencourt and Lobo 2016; Glaeser and Hausman, 2020). According to Duranton and Puga (2001) and Berkes and Gaetani (2021), technological breakthroughs are more prevalent in large cities. According to Shukai et al. (2021), the increase in urban population density had a significant and positive effect on the output of urban innovation in medium- and low-density cities. Lu and Huang (2012) determined a five-tier innovation system for Chinese cities, with the level of technological innovation correlated to the corresponding city tier. Comprehensive public services, transparency, etc., would be more commonplace in high-tier cities (Li et al., 2016). Fan et al. (2021) argued that when the scale of a city reached a certain threshold value, its impact on innovation agglomeration increased significantly. Shearmur (2012) stated that the city was the primary location for innovative and creative activities due to its capacity to provide an ideal environment, such as proximity, density, and diversity, for the generation of innovation activities, thereby allowing for the integration of all elements to generate a series of innovative activities.
3 Data and methods
3.1 The model
The relationship between the size of a city, technological innovation, and income inequality is the principal focus of this study. Referencing Baum-Snow and Pavan (2013), Breau et al. (2014), and Chen et al. (2018), we developed an ordinary panel regression model (as shown in Eq. 1) and a two-way fixed-effect model (as shown in Eq. 2) to analyze the factors that affect income inequality.
where
After the provincial time mean is subtracted, the urban heterogeneity of each explanatory variable is retained, ensuring that the model can be identified and endogenous problems can be managed or mitigated.
3.2 Income data and measure of inequality
The China Family Panel Studies (CFPS), the largest and most thorough social panel survey in China, was introduced in 2010 by Peking University and is the source of our income data. The survey collects longitudinal data on individuals, families, and communities in contemporary China. The CFPS3 collects a lot of data on topics such as economic activities, family relationships, and family dynamics. Specifically, at the individual and family levels, the CFPS collects data on monthly income and working hours. The Institute of Social Science Survey (ISSS) at Peking University has thus far conducted five rounds of the CFPS (2010, 2012, 2014, 2016, and 2018). The CFPS survey, which covers all 25 provinces in China, includes data from more than 100 cities across the country.
Since our focus is on urban income inequality, we have excluded rural residents from our measurements of inequality. For the entirety of the paper, we are interested in residents older than 16 and younger than 65, who are employed at the time of the interview. To improve the precision of our inequality measurements, we have eliminated cities with a small sample size. This reduces the sample size to 101 cities; consequently, the ensuing findings are only applicable to these cities.
Our income measure is calculated by dividing monthly income by monthly working hours (i.e., hourly wage), a method adopted by the majority of the literature on inequality (Lemieux 2006; Card 2009). We use the Gini coefficient as the primary indicator of income inequality because it is widely used4 in the academic literature. Another common measurement is the Theil index. In this paper, we calculate both inequality measures. We use the Gini coefficient as the primary measure of overall inequality and the Theil index as a backup measure for robustness testing.
The expression for the Gini coefficient is given by
The individual existing income
The Theil index is given by
The value interval of the Theil index ranges from 0 to infinity, i.e., from an average distribution to a very uneven one. Both indicators respond sensitively to changes in the distribution of income in different bands, with the Gini coefficient being more sensitive to changes in the middle-income level and the Theil index being more sensitive to changes in the highest income level; therefore, using two measures of income inequality provides additional robustness to the analysis presented in this paper.
3.3 Data source
The China City Statistical Yearbook provides the majority of our data, including the population size, the percentage of workers in the manufacturing industry and the financial sector, the share of government expenditures in the gross domestic product, and the female labor force participation rate. In addition, the Wind Economic Database5 provides information regarding the unemployment rate, average wage, and minimum wage. It should be noted that average and minimum wage data are used at the provincial level; since city data are not published, it is most appropriate to use provincial data instead (Ma and Zeng 2016).
The number of patents granted, which is used as a measure of technological innovation, is collected from the patent search database of the China National Intellectual Property Administration (CNIPA). Moreover, the data on the old-age dependency ratio are obtained from the Easy Professional Superior (EPS) data platform6 (see Table 1).

TABLE 1. Variables and data source.
4 Findings
4.1 Descriptive statistics
The descriptive statistics of the mentioned variables is shown in Table 2.
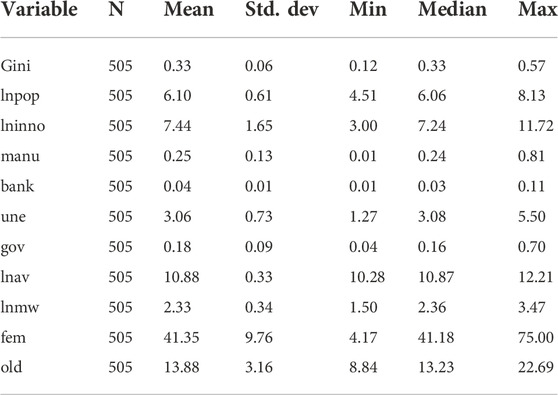
TABLE 2. Descriptive statistics (annual variables).
The relationship between urban income inequality and city size is depicted in Figure 1, which exhibits a positive correlation between the Gini coefficient and city size. In addition, Figure 2 reveals a positive correlation between urban income equality and technological innovation. These positive correlations are further supported by columns 1) and 2) in Table 3.
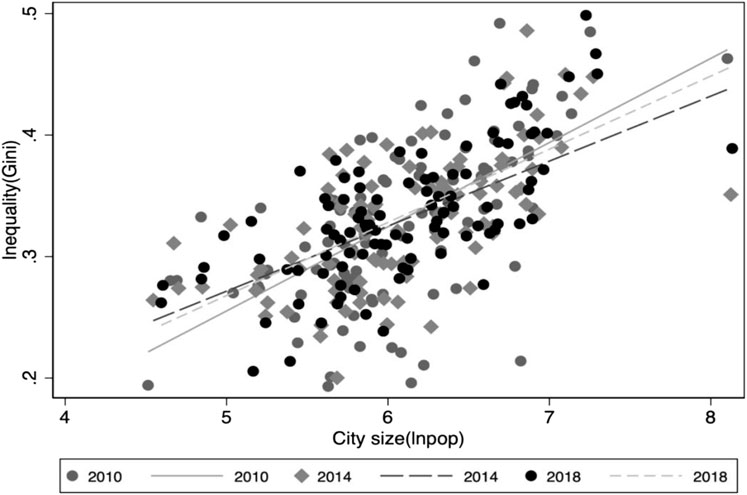
FIGURE 1. Gini coefficient and city size (2010, 2014, and 2018)1.
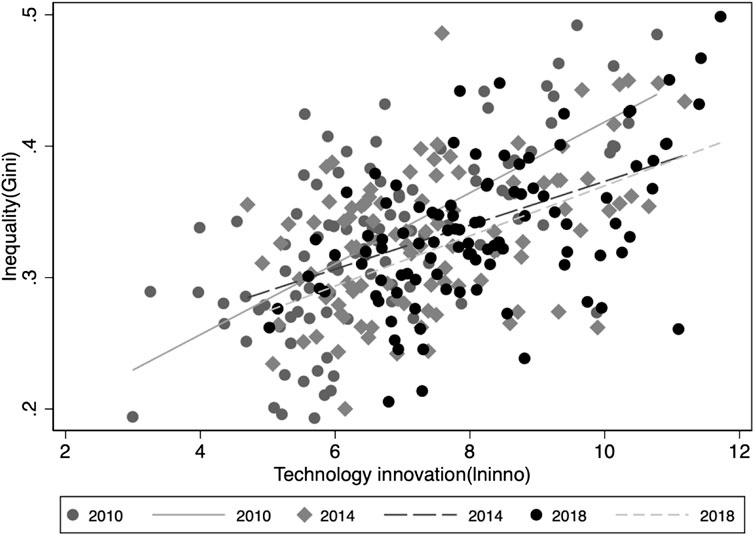
FIGURE 2. Gini coefficient and technological innovation (2010, 2014, and 2018)2.
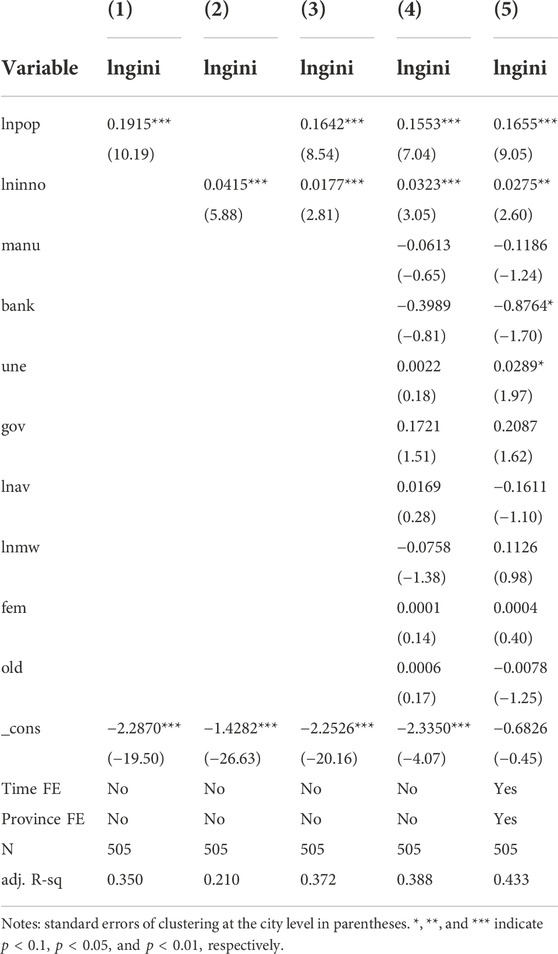
TABLE 3. Baseline regression results.
Evidently, China is a country undergoing both rapid urbanization and technological development, as its cities continue to grow in size and technological innovation intensifies. In the meantime, income inequality has increased over the past decades.
The relationship between city size, technological innovation, and urban income inequality in China in 2010 and 2018 is depicted in Figures 3, 4. The vertical axis represents income inequality, the horizontal axis represents technological innovation, and the circle’s radius represents city size. The horizontal dashed line represents the average Gini coefficient, whereas the vertical dashed line represents the average level of technological innovation. According to these two graphs, both the average Gini coefficient and the average level of technological innovation have increased. In contrast to the smaller cities in the lower left quadrant, the majority of the larger cities, such as Beijing, Shanghai, Chongqing, and Guangzhou, are located in the upper right quadrant. It indicates that the greater the size of the city, the greater the level of technological innovation and the greater the income disparity. Column 3) in Table 3 further corroborates the positive correlation.
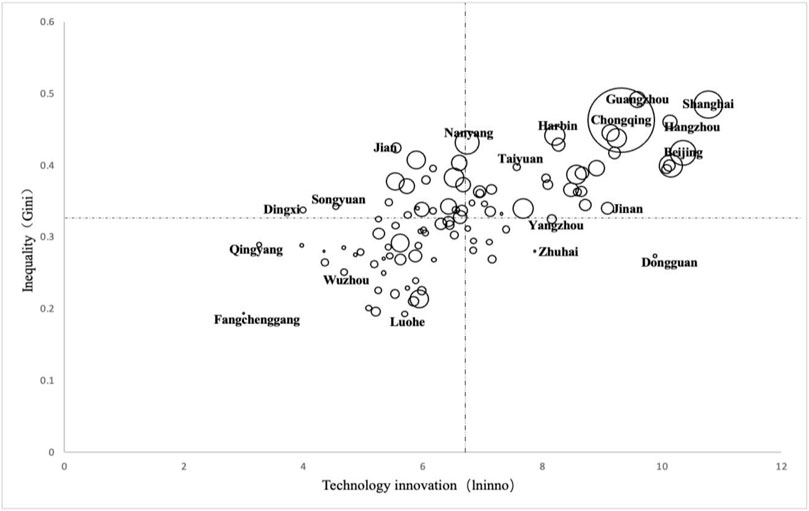
FIGURE 3. Gini coefficient, city size, and technological innovation (2010).
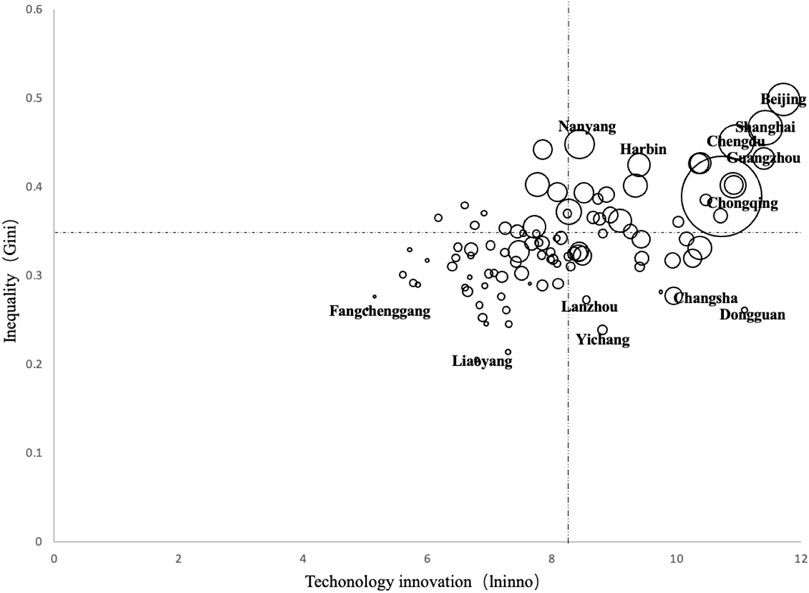
FIGURE 4. Gini coefficient, city size, and technological innovation (2018).
4.2 Empirical results
4.2.1 The baseline regression
According to the previous model, regression analysis is performed for Eqs 1,2. Models 1)–5) represent the regression results of all samples. The results without a control variable are represented by models (1), (2), and (3). Model 1) is the result of city size regression, model 2) is the result of technological innovation regression, and Model 3) is the result of both regressions. Model 5) is derived from Model 4) while controlling for provincial and time-fixed effects. All models have positive variation coefficients for city size and technological innovation, indicating that the greater the size of the city, the greater the urban income inequality, and the greater the level of technological innovation, the greater the urban income inequality.
Individual differences in urban labor markets, such as skill and education level, have increased as cities have grown in size, resulting in wage disparities and a consequent rise in income inequality. Similarly, cities with greater technological innovation have greater inequality. This is due to the fact that innovative initiatives necessitate higher levels of skill, but the increase in skill premiums could exacerbate inequality.
4.2.2 Regional heterogeneity regression
In order to investigate the spatial heterogeneity of city size, technological innovation construction, and income inequality, the paper divides China into east, middle, and west according to its geographic location. The model regression results are determined for the eastern, central, and western regions (see Table 4).
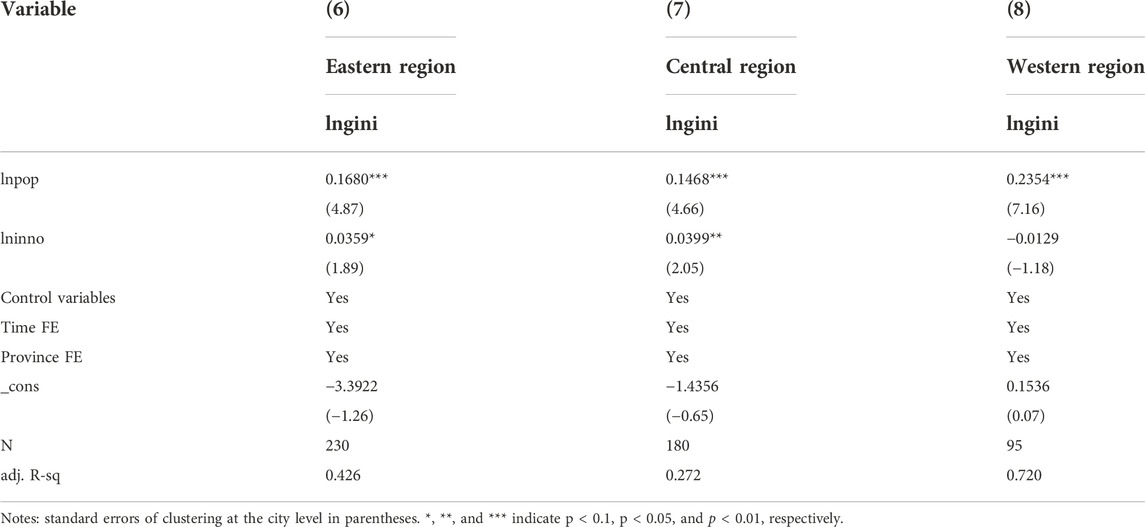
TABLE 4. Regression results at the regional level.
The city size coefficients of the models are positive and pass a 1% significance test. This demonstrates that the size of a city has a substantial positive effect on the urban income inequality in the eastern, central, and western regions. In the models, the regression coefficients of city size on regional inequality are roughly equivalent for the eastern and middle regions, but smaller for the western region. Similarly, the regression coefficients of technological innovation are approximative between eastern and middle regions; however, the coefficient of technological innovation in the western region reaches the opposite conclusion, and the conclusion is not robust. This is primarily due to the great innovation development heterogeneity in the western region.
The economies of the eastern and middle regions are more developed, as they possess a greater wealth of resources dedicated to innovation. Attractive incomes have also attracted highly skilled individuals from the western region to the eastern and middle regions. Following the implementation of the western development policy, the innovative and economic strength of the western region has increased significantly. Cities in the west, such as Xi’an, Chengdu, and Chongqing, have optimized industrial structures and enhanced business environments. A large number of skilled individuals have returned to western cities, resulting in their growth and innovation. However, the transformation of technological innovation lags behind. Moreover, agglomeration economies lead to a disproportional distribution of benefits and a higher skill premium, resulting in an increase in inequality.
4.2.3 Urban heterogeneity regression
On one hand, based on the 2020 classification standard of the New First Tier Cities Institute7, cities are divided into four grades (the first- and second-tier8, third-tier, fourth-tier, and fifth-tier) in order to investigate the impact of city size and technological innovation on regional income inequality at various scales. Table 5 displays the results of placing cities of varying grades into a model for regression.

TABLE 5. Regression results at the urban level (based on the New First Tier Cities Institute).
The coefficients of city size in the models are positive and statistically significant. This indicates that the size of a city has a substantial positive effect on the income inequality of all cities. However, the conclusions of technological innovation are somewhat convoluted. The first- and second-tier cities are ordinarily municipalities and provincial capitals with relatively more equitable tax systems for income distribution. Simultaneously, the size of first- and second-tier cities is the largest, resulting in the largest effect coefficient of city size on inequality. Since the implementation of the 13th Five-Year Plan, third-tier cities have offered a variety of preferential policies to attract high-skilled individuals in an effort to promote urbanization, which has incontestably elevated the skill premium and income inequality. In contrast, the fourth- and fifth-tier cities are typically developing cities with limited technological innovation capacity; therefore, the coefficients of innovation are not significant.
On the other hand, cities are separated into resource-based cities and non-resource-based cities, according to the classification standard of the Sustainable Development Plan for Resource-based Cities in China (2013–2020) published by the State Council of China (see Table 6). The coefficients of city size and technological innovation are positive and significant. This suggests that the size of the city and technological innovation have significant and positive effects on urban income equality, in both resource-based cities and non-resource-based cities. Resource-based cities are highly reliant on resource-based industries, which do not require as many individuals with advanced skills. In addition, these cities lack innovative new industries, and therefore a large number of skilled individuals relocate to non-resource-based cities. Those high-skilled individuals who remain in resource-based cities receive greater skill premiums. This is the reason why non-resource-based cities have a larger city size coefficient, but a lower technological innovation coefficient.
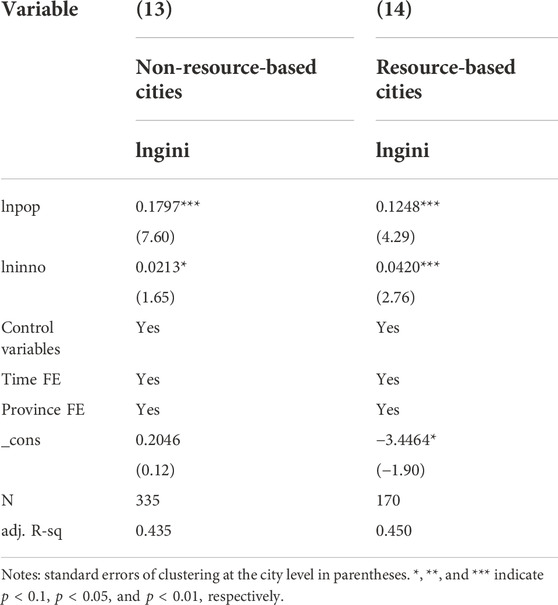
TABLE 6. Regression results at the urban level (based on Sustainable Development Plan for Resource-based Cities in China).
4.2.4 Decomposition of mechanisms
This paper uses a mediating model to examine the impact mechanism of city size on income inequality, as individuals are able to freely move between cities. The model of mediation includes references to Sobel (1982); Wen et al. (2004). First, this paper investigates whether the size of the city has a significant effect on urban income inequality. Second, this paper examines the effect of city size on technological innovation. The paper concludes by analyzing the effects of city size and technological innovation on urban income inequality, with technological innovation serving as the mediating variable (see Figure 5.).
In the aforementioned formula,
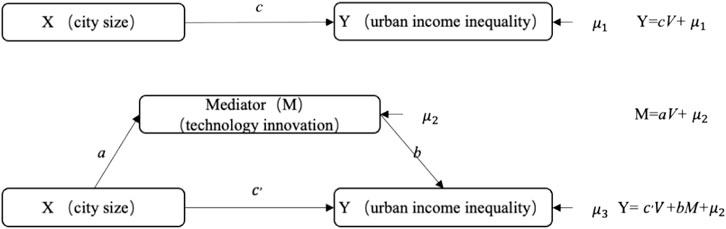
FIGURE 5. Mediating model.

TABLE 7. Results of mediating effects.
The coefficients of city size on urban income inequality and technological innovation are significantly positive, indicating that technological innovation promotes the agglomeration of production requirements, such as population, to a significant degree. Simultaneously, economic agglomeration generates agglomeration externalities through micro-mechanisms such as sharing, learning, and matching, which promote knowledge spillover and enhance urban attraction. Consequently, people are attracted to larger cities with significant employment opportunities and creativity. Accordingly, in order to improve the innovation level of cities, highly skilled individuals will receive a greater skill premium, resulting in a rise in income inequality.
In addition, the results of the Sobel test are presented in Table 7. The Sobel Z value is significant, indicating that technological innovation’s mediating effects are significant and account for 15.29%. In general, the size of a city not only has a positive direct effect on income inequality but also exacerbates income inequality through technological innovation.
5 Robustness tests
5.1 Alternative proxy variables
The paper conducts a series of robustness tests to ensure the validity of these findings. As stated previously, the Theil index is used as an alternative proxy measure of income inequality. Based on the previous (Eqs 1,2)9, Table 8 displays the regression results.
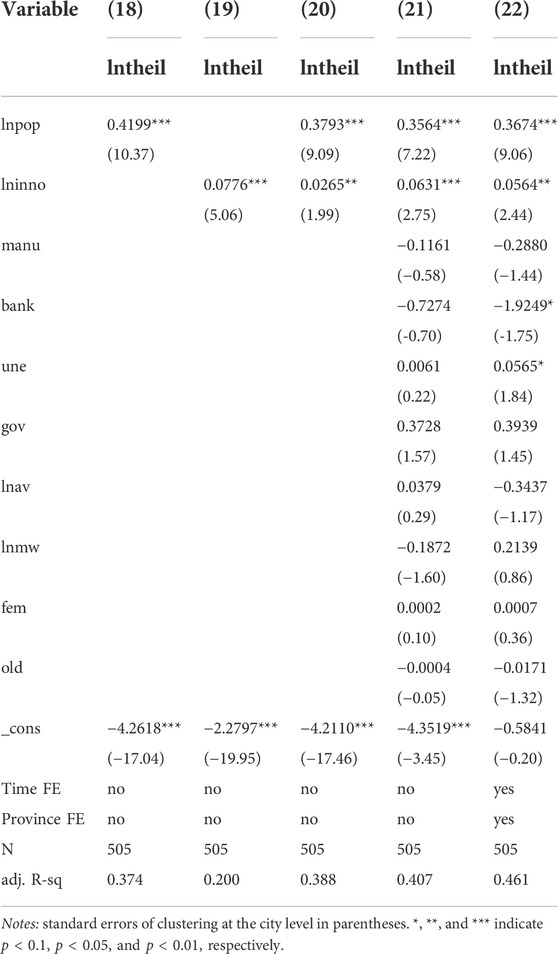
TABLE 8. Robustness tests: alternative proxy measure of income inequality.
Second, the paper uses a different proxy variable for technological innovation. There are currently three types of protected patents in China: inventions, utility models, and designs, with inventions accounting for a significant proportion of patent applications and containing the most technological innovation. Therefore, inventions (lnau) are used as an alternative proxy for technological innovation (Bian et al., 2019). Table 9 displays the primary test outcomes.
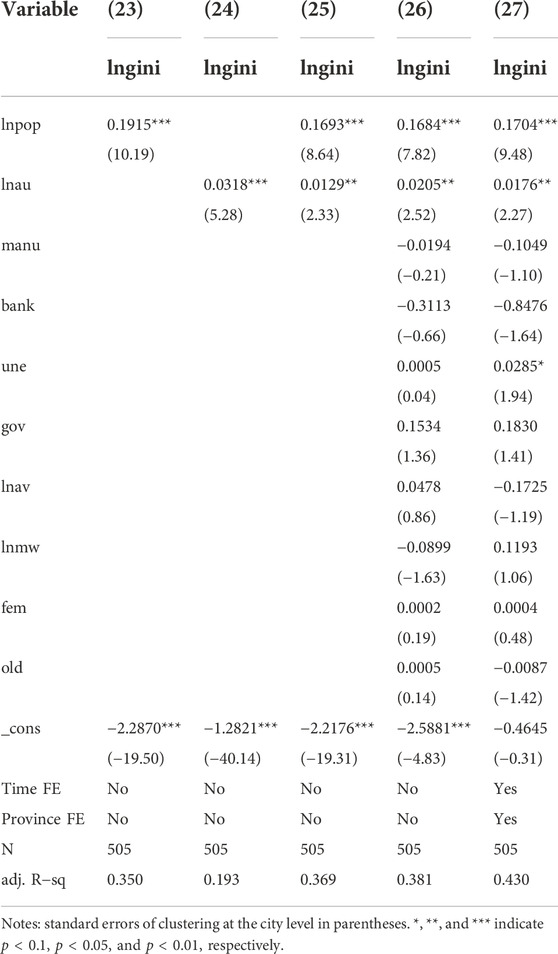
TABLE 9. Robustness tests: alternative proxy variable for technological innovation.
5.2 Changing the sample size
In order to avoid the influence of extreme values on our results, we must remove any extreme values that may exist in the sample and test the robustness of our conclusion. Therefore, several cities with annual populations exceeding 10 million, including Chengdu, Shanghai, Beijing, Chongqing, Nanyang, and Shijiazhuang, are excluded in order to eliminate their influence on the results, resulting in a subsample. Therefore, the subsample is used to reexamine the primary findings (see Table 10).
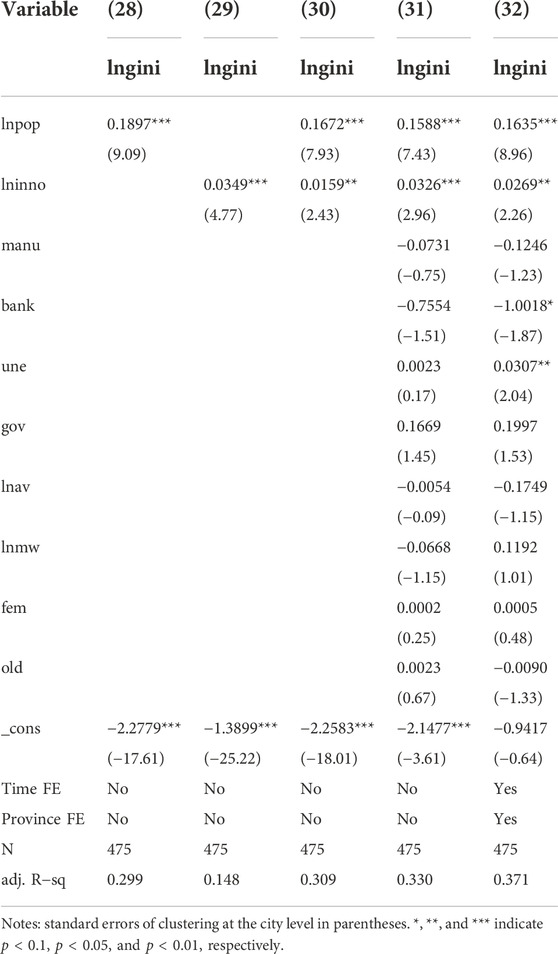
TABLE 10. Robustness tests: changing the sample size.
5.3 Endogeneity issues
In order to further address the possibility of endogeneity, the paper adopts an IV methodology by using population size as the instrument for contemporary city size. This strategy is based on the assumption that individuals with a high level of education migrate to large cities in search of more employment opportunities and a higher income. Fifty years ago, the historical population10 of each city in 1957, 1962, 1965, 1970, and 1975 is largely exogenous to current inequality. In addition, the paper applies a one-period lag of technological innovation to two-stage least squares (2SLS) regression models for estimation purposes (Wooldridge, 2005). The paper controls for all current variables, including current city size, in order to minimize the likelihood that historical city size influences inequality through other current variables. Table 11 summarizes the results.

TABLE 11. Endogeneity issues.
First, the paper examines whether the independent variables are affected by and associated with their respective instrumental variables. The results indicate that the coefficients of the instrumental variables are positively significant. Second, the paper investigates whether instrumental variables are exogenous and uncorrelated with residual terms. The results of the Kleibergen–Paaprk Wald F (KRF test) are both greater than 10, indicating that the chosen instrumental variables are robust IVs and exogenous variables (see the first stage results in Table 11). In conclusion, the results of the second stage of the 2SLS model demonstrate the reliability of our primary findings (see Table 11).
All of these tests for robustness indicate that the regression coefficients for city size and technological innovation are consistent with previous findings. These results indicate that the conclusions regarding the effects and interaction of city size and technological innovation on urban income inequality remain valid.
6 Conclusion and discussion
Using China Family Panel Studies data from 2010, 2012, 2014, 2016, and 2018 for 101 prefecture-level cities, we developed a two-way fixed-effect model to examine the effects of city size and technological innovation on urban income inequality. The impact of city size on urban income inequality through technological innovation is analyzed using a model of the mediating effect. The sample is then divided into three subsamples based on the geographic location, level of economic development, and resource situation of the city in order to examine the various effects of city size and technological innovation on income inequality. Finally, in order to create an instrumental variable, we used a regression-based strategy similar to Chen et al. (2018), given the potential endogeneity of city size (IV). The results of robustness tests validate these findings.
Three principle results are derived as follows: first, as the average Gini coefficient for cities increases, inequality increases proportionally, especially in mega-cities and super-cities.
The second result demonstrates that city size and urban innovation have significant positive effects on urban income inequality, i.e., cities with larger populations and greater innovation tend to have larger income inequality. Due to the recent return of talented individuals to western provincial capitals, we discover that urban income inequality in the western region has risen in recent years. Comparing various city classifications reveals that inequality is most pronounced in first- and second-tier cities. This is due to the fact that first- and second-tier cities are typically municipalities or provincial capitals, and they attract a greater number of highly qualified individuals. Greater agglomerations provide more opportunities for matching businesses with workers on the labor market, as well as for sharing resources such as suppliers, labor pools, and infrastructure. This causes significant increases in urban income inequality for groups with higher levels of education in larger cities than in smaller cities. Likewise, the size of non-resource-based cities has a greater impact on urban income inequality than that of resource-based cities.
Third, we used a mediating model to determine that the size of a city influences income inequality via urban innovation. The increase in city size not only highlights the importance of human capital but also increases the effects of agglomerative economies, thereby fostering urban innovation. As innovation dividends are primarily accrued by individuals with high levels of education, income inequality will increase proportionally.
This paper investigates the impact that the size of a city has on urban income inequality from the point of view of technological innovation at the city level, in contrast to previous research on income inequality, which focused either on the national level or the regional level. As cities continue to grow and become more innovative, it is worthwhile to investigate how the benefits of innovation should be distributed. Our research results also raise a number of critical questions regarding how to optimize city size and ensure that the advantages of innovation are reasonably distributed throughout society as China implements an innovative development strategy. These are the central concerns of the following studies, as they are necessary for sustainable long-term success in urban planning and development.
Data availability statement
Publicly available datasets were analyzed in this study. These data can be found here: http://www.isss.pku.edu.cn/cfps/.
Author contributions
XZ: conceptualization and writing—original draft; YF: provide data and methodology; HZ: manuscript writing. All authors—manuscript correction and final version preparation. All authors read and approved the final manuscript.
Acknowledgments
We would like to give our heartfelt thanks to all the people who have ever helped us in this manuscript and editors and reviewers for their helpful comments and suggestions. We thank the support by the Fundamental Research Funds for the Central Universities (CXJJ-2021-433, CXJJ-2021-444, CXJJ-2022-425, CXJJ-2022-424).
Conflict of interest
The authors declare that the research was conducted in the absence of any commercial or financial relationships that could be construed as a potential conflict of interest.
Publisher’s note
All claims expressed in this article are solely those of the authors and do not necessarily represent those of their affiliated organizations, or those of the publisher, the editors, and the reviewers. Any product that may be evaluated in this article, or claim that may be made by its manufacturer, is not guaranteed or endorsed by the publisher.
Footnotes
1Only scatter plots for 2010, 2014, and 2018 have been picked to highlight the relationship between the urban income inequality and city size more clearly. Using the data from 2012 to 2016, however, we observe the same relationship.
2Only scatter plots for 2010, 2014, and 2018 have been picked to highlight the relationship between the urban income inequality and technological innovation more clearly. Using the data from 2012 to 2016, however, we observe the same relationship.
3According to the Labor Law of the People’s Republic of China, the working age is between 16 and 65 years. These age cutoffs are chosen to be similar to those in Baum−Snow and Pavan (2013), which means that our results are not affected by these age cutoffs.
4After excluding those working in rural areas, not at working ages, without a job or missing income information, we have retained the cities, which have the number of observations with income information more than 30. Otherwise, there is no way to construct reasonable inequality measures such as the Gini coefficient, which is based on the distribution of income. We screened the sample with reference to Chen et al. (2018), but more rigorously.
5Wind is a leading provider of financial information services in China. Wind’s data cover stocks, bonds, funds, macroeconomics, etc. Wind’s data are also frequently cited by authoritative Chinese and English media, research reports, and academic papers.
6EPS Data is a leading China data provider since 2008: its EPS China Statistics presents the largest and most comprehensive collection of data on China.
7New First Tier Cities Institute is a city data research institute under China Business (CBN), which is China’s largest financial media group.
8The first- and second-tier cities are merged because of the limits of our sample size.
9Notes: the robustness tests below are all based on the models, i.e., Eqs 1,2.
10The data on historical population are obtained from the historical statistical yearbooks of each city
References
Acemoglu, D. (1999). Changes in unemployment and wage inequality: An alternative theory and some evidence. Am. Econ. Rev. 89, 1259–1278. doi:10.1257/aer.89.5.1259
Acemoglu, D. (2002). Technical change, inequality, and the labor market. J. Econ. Literature 40, 7–72. doi:10.1257/jel.40.1.7
Aghion, P., Bloom, N., Blundell, R., Griffith, R., and Howitt, P. (2005). Competition and innovation: An inverted-U relationship. Q. J. Econ. 120, 701–728. doi:10.1162/0033553053970214
Aghion, P., Akcigit, U., Bergeaud, A., Blundell, R., and Hémous, D. (2019). Innovation and top income inequality. Rev. Econ. Stud. 86 (1), 1–45. doi:10.1093/restud/rdy027
Anderson, J. E. (2011). The specific factors continuum model, with implications for globalization and income risk. J. Int. Econ. 85, 174–185. doi:10.1016/j.jinteco.2011.08.003
Baum-Snow, N., and Pavan, R. (2013). Inequality and city size. Rev. Econ. Stat. 95 (5), 1535–1548. doi:10.1162/rest_a_00328
Berkes, E., and Gaetani, R. (2021). The geography of unconventional innovation. Econ. J. 131 (636), 1466–1514. doi:10.1093/ej/ueaa111
Bettencourt, L. M. A., and Lobo, J. (2016). Urban scaling in Europe. J. R. Soc. Interface 13, 20160005. doi:10.1098/rsif.2016.0005
Bettencourt, L. M., Lobo, J., and Strumsky, D. (2007). Invention in the city: Increasing returns to patenting as a scaling function of metropolitan size. Res. policy 36 (1), 107–120. doi:10.1016/j.respol.2006.09.026
Bian, Y., Wu, L., and Bai, J. (2019). Does high-speed rail improve regional innovation in China? J. Financial Res. 6, 132–149.
Biggi, G., and Giuliani, E. (2021). The noxious consequences of innovation: What do we know? Industry innovation 28, 19–41. doi:10.1080/13662716.2020.1726729
Blejer, M. I., and Guerrero, I. (1990). The impact of macroeconomic policies on income distribution: An empirical study of the Philippines. Rev. Econ. Statistics 72, 414. doi:10.2307/2109349
Bourne, L. S., Hutton, T., Shearmur, R., and Simmons, J. (2011). Canadian urban regions: Trajectories of growth and change. Illustrated edition. Toronto: Oxford University Press.
Breau, S., Kogler, D. F., and Bolton, K. C. (2014). On the relationship between innovation and wage inequality: New evidence from Canadian cities. Econ. Geogr. 90 (4), 351–373. doi:10.1111/ecge.12056
Carlino, G., and Kerr, W. R. (2015). Agglomeration and innovation. Handb. regional urban Econ. 5, 349–404. doi:10.1016/b978-0-444-59517-1.00006-4
Castells-Quintana, D., Royuela, V., and Veneri, P. (2020). Inequality and city size: An analysis for OECD functional urban areas. Pap. Reg. Sci. 99 (4), 1045–1064. doi:10.1111/pirs.12520
Chaminade, C., Lundvall, B-Å., and Haneef, S. (2018). Advanced introduction to national innovation systems. Cheltenham: Edward Elgar Publishing.
Chen, B., Liu, D., and Lu, M. (2018). City size, migration and urban inequality in China. China Econ. Rev. 51, 42–58. doi:10.1016/j.chieco.2018.05.001
Combes, P. P., Démurger, S., Li, S., and Wang, J. (2020). Unequal migration and urbanisation gains in China. J. Dev. Econ. 142, 102328. doi:10.1016/j.jdeveco.2019.01.009
Cuaresma, J. C., Havettová, M., and Lábaj, M. (2013). Income convergence prospects in Europe: Assessing the role of human capital dynamics. Econ. Syst. 37 (4), 493–507. doi:10.1016/j.ecosys.2013.02.004
Dolton, P., Bondibene, C. R., and Wadsworth, J. (2012). Employment, inequality and the UK national minimum wage over the medium-term*: Employment, inequality and the UK NMW. Oxf. Bull. Econ. Statistics 74, 78–106. doi:10.1111/j.1468-0084.2011.00653.x
Duranton, G., and Puga, D. (2001). Nursery cities: Urban diversity, process innovation, and the life cycle of products. Am. Econ. Rev. 91, 1454–1477. doi:10.1257/aer.91.5.1454
Fan, F., Dai, S., Zhang, K., and Ke, H. (2021). Innovation agglomeration and urban hierarchy: Evidence from Chinese cities. Appl. Econ. 53, 6300–6318. doi:10.1080/00036846.2021.1937507
Feldman, M. P., and Kogler, D. F. (2010). Stylized facts in the geography of innovation. Handb. Econ. Innovation 1, 381–410.
Florida, R., Adler, P., and Mellander, C. (2017). The city as innovation machine. Reg. Stud. 51, 86–96. doi:10.1080/00343404.2016.1255324
Fukao, K., and Makino, T. (2015). Aging, interregional income inequality, and industrial structure: An empirical analysis based on the R-JIP database and the R-LTES database, discussion papers. Research Institute of Economy, Trade and Industry, 15022.
Gaubert, C. (2018). Firm sorting and agglomeration. Am. Econ. Rev. 108 (11), 3117–3153. doi:10.1257/aer.20150361
Glaeser, E. (2012). Triumph of the city: How our greatest invention makes us richer, smarter, greener, healthier, and happier. Reprint edition. New York, NY: Penguin Books.
Glaeser, E. L., and Hausman, N. (2020). The spatial mismatch between innovation and joblessness. Innovation Policy Econ. 20 (1), 233–299. doi:10.1086/705646
Glaeser, E. L., Resseger, M., and Tobio, K. (2009). Inequality in cities. J. Regional Sci. 49 (4), 617–646. doi:10.1111/j.1467-9787.2009.00627.x
Goldberg, P. K., and Pavcnik, N. (2007). Distributional effects of globalization in developing countries. J. Econ. Literature 45 (1), 39–82.
Griliches, Z. (1990). Patent statistics as economic indicators: A survey. J. Econ. Literature 28, 1661–1707.
Hagedoorn, J., and Cloodt, M. (2003). Measuring innovative performance: Is there an advantage in using multiple indicators? Res. Policy 32, 1365–1379. doi:10.1016/s0048-7333(02)00137-3
Heinrich Mora, E., Heine, C., Jackson, J. J., West, G. B., Yang, V. C., and Kempes, C. P. (2021). Scaling of urban income inequality in the USA. J. R. Soc. Interface 18 (181), 20210223. doi:10.1098/rsif.2021.0223
Hortas-Rico, M., and Rios, V. (2019). The drivers of local income inequality: A spatial bayesian model-averaging approach. Reg. Stud. 53 (8), 1207–1220. doi:10.1080/00343404.2019.1566698
Howitt, P., and Aghion, P. (1998). Capital accumulation and innovation as complementary factors in long-run growth. J. Econ. Growth 3, 111–130. doi:10.1023/a:1009769717601
Jovicic, S. (2016). Wage inequality, skill inequality, and employment: Evidence and policy lessons from PIAAC. IZA J. Labor Stud. 5 (1), 21–26. doi:10.1186/s40174-016-0071-4
Korpi, M. (2007). Does size of local labour markets affect wage inequality? A rank-size rule of income distribution. J. Econ. Geogr. 8, 211–237. doi:10.1093/jeg/lbm034
Krätke, S. (2011). The creative capital of cities: Interactive knowledge creation and the urbanization economies of innovation, 32. Chichester: John Wiley & Sons.
Krugman, P. R. (2008). Trade and wages, reconsidered. Brookings Pap. Econ. Activity 103–137, 103–154. doi:10.1353/eca.0.0006
Law, S. H., Naseem, N. A. M., Lau, W. T., and Trinugroho, I. (2020). Can innovation improve income inequality? Evidence from panel data. Econ. Syst. 44 (4), 100815. doi:10.1016/j.ecosys.2020.100815
Lee, N., Sissons, P., and Jones, K. (2016). The geography of wage inequality in British cities. Reg. Stud. 50 (10), 1714–1727. doi:10.1080/00343404.2015.1053859
Lemieux, T. (2006). Increasing residual wage inequality: Composition effects, noisy data, or rising demand for skill? Am. Econ. Rev. 96 (3), 461–498. doi:10.1257/aer.96.3.461
Li, P., Liu, R., and Li, J. (2016). Diagnostic value of MRI and computed tomography in anorectal malignant melanoma. Melanoma Res. 36, 46–50. doi:10.1097/CMR.0000000000000198
Long, J. E., Rasmussen, D. W., and Haworth, C. T. (1977). Income inequality and city size. Rev. Econ. Statistics 59, 244–246. doi:10.2307/1928824
Lu, L., and Huang, R. (2012). Urban hierarchy of innovation capability and inter-city linkages of knowledge in post-reform China. Chin. Geogr. Sci. 22, 602–616. doi:10.1007/s11769-012-0555-8
Ma, S., and Zeng, G. (2016). A study on the relationship between income inequality and urban innovation - a case study of 69 cities in China. Inq. into Econ. Issues 37, 92–99.
Mocan, H. N. (1999). Structural unemployment, cyclical unemployment, and income inequality. Rev. Econ. Stat. 81, 122–134. doi:10.1162/003465399767923872
Molero-Simarro, R. (2017). Inequality in China revisited. The effect of functional distribution of income on urban top incomes, the urban-rural gap and the Gini index, 1978–2015. China Econ. Rev. 42, 101–117. doi:10.1016/j.chieco.2016.11.006
Nord, S. (1980). An empirical analysis of income inequality and city size. South. Econ. J. 46, 863. doi:10.2307/1057154
Perera-Tallo, F. (2017). Growing income inequality due to biased technological change. J. Macroecon. 52, 23–38. doi:10.1016/j.jmacro.2017.02.002
Piketty, T., and Saez, E. (2014). Inequality in the long run. Science. (Cambridge: Cambridge University Press) 344, 838–843. doi:10.1126/science.1251936
Piketty, T. (2014). “Capital in the twenty-first century,” in Capital in the twenty-first century (Harvard University Press).
Sarkar, S., Phibbs, P., Simpson, R., and Wasnik, S. (2018). The scaling of income distribution in Australia: Possible relationships between urban allometry, city size, and economic inequality. Environ. Plan. B Urban Anal. City Sci. 45 (4), 603–622. doi:10.1177/0265813516676488
Scott, A. J. (2009). Social economy of the metropolis: Cognitive-cultural capitalism and the global resurgence of cities. Illustrated edition. Oxford; New York: Oxford University Press.
Shearmur, R. (2012). Are cities the font of innovation? A critical review of the literature on cities and innovation. Cities 29, S9–S18. doi:10.1016/j.cities.2012.06.008
Shukai, C., Haochen, W., and Xiaohong, Z. (2021). Do city size and population density influence regional innovation output evidence from China? Wirel. Commun. Mob. Comput. 2021, 1–10. doi:10.1155/2021/3582053
Sobel, M. E. (1982). Asymptotic confidence intervals for indirect effects in structural equation models. Sociol. Methodol. 13, 290–312. doi:10.2307/270723
Stiglitz, J. E. (2012). The price of inequality: How today's divided society endangers our future. New York: WW Norton & Company.
Tanninen, H. (1999). Income inequality, government expenditures and growth. Appl. Econ. 31, 1109–1117. doi:10.1080/000368499323599
Tridico, P. (2018). The determinants of income inequality in OECD countries. Camb. J. Econ. 42, 1009–1042. doi:10.1093/cje/bex069
Van Oort, F. G., and Bosma, N. S. (2013). Agglomeration economies, inventors and entrepreneurs as engines of European regional economic development. Ann. Reg. Sci. 51 (1), 213–244. doi:10.1007/s00168-012-0547-8
Wan, G., Ye, J., and Zhuang, J. (2012). “On regional and inter-household inequality in China,” in A new economic growth engine for China: Escaping the middle-income trap by not doing more of the same.(Singapore: World Scientific), 155–182.
Wen, Z., Chang, L., Hau, K. T., and Liu, H. (2004). Testing and application of the mediating effects. Acta Psychol. sin. 36 (05), 614.
Wooldridge, J. M. (2005). Instrumental variables estimation with panel data. Econ. Theory 21, 865–869. doi:10.1017/s0266466605050437
Keywords: city size, technological innovation, income inequality, mediating mechanism, China
Citation: Zhang X, Fu Y and Zhuang H (2022) City size, technological innovation, and urban income inequality: Empirical evidence from China family panel studies. Front. Environ. Sci. 10:1065941. doi: 10.3389/fenvs.2022.1065941
Received: 14 October 2022; Accepted: 14 November 2022;
Published: 01 December 2022.
Edited by:
Shigeyuki Hamori, Kobe University, JapanCopyright © 2022 Zhang, Fu and Zhuang. This is an open-access article distributed under the terms of the Creative Commons Attribution License (CC BY). The use, distribution or reproduction in other forums is permitted, provided the original author(s) and the copyright owner(s) are credited and that the original publication in this journal is cited, in accordance with accepted academic practice. No use, distribution or reproduction is permitted which does not comply with these terms.
*Correspondence: Yu Fu, ZnV5dV9xdWppbmdAMTYzLnN1ZmUuZWR1LmNu