
94% of researchers rate our articles as excellent or good
Learn more about the work of our research integrity team to safeguard the quality of each article we publish.
Find out more
ORIGINAL RESEARCH article
Front. Environ. Sci. , 13 December 2022
Sec. Land Use Dynamics
Volume 10 - 2022 | https://doi.org/10.3389/fenvs.2022.1062954
 Tao Yin1
 Yuqing Feng2,3,4*
 Sihai Liang1Guangjun Wang5*
 Ning Yuan1Dezhao Yan6Pan Wu7Xingxing Kuang4Li Wan1
Alpine wetlands are one of the most important ecosystems in the Three Rivers Source Area, China, which plays an important role in regulating the regional hydrological cycle and carbon cycle. Accordingly, Wetland area and its distribution are of great significance for wetland management and scientific research. In our study, a new wetland classification model which based on geomorphological types and combine object-oriented and decision tree classification model (ODTC), and used a new wetland classification system to accurately extract the wetland distributed in the Headwater Area of the Yellow River (HAYR) of the Qinghai-Tibet Plateau (QTP), China. The object-oriented method was first used to segment the image into several areas according to similarity in Pixels and Textures, and then the wetland was extracted through a decision tree constructed based on geomorphological types. The wetland extracted by the model was compared with that by other seven commonly methods, such as support vector machine (SVM) and random forest (RF), and it proved the accuracy was improved by 10%–20%. The overall classification accuracy rate was 98.9%. According to our results, the HAYR’s wetland area is 3142.3 km2, accounting for 16.1% of the study area. Marsh wetlands and flood wetlands accounted for 37.7% and 16.7% respectively. A three-dimensional map of the area showed that alpine wetlands in the research region are distributed around lakes, piedmont groundwater overflow belts, and inter-mountain catchment basin. This phenomenon demonstrates that hydrogeological circumstances influence alpine wetlands’ genesis and evolution. This work provides a new approach to investigating alpine wetlands.
Wetlands were first defined by the United States in 1956 as lowlands covered by shallow, temporary or intermittent bodies of water (Forsberg, 1992). The Ramsar definition of wetlands include areas of marshland, peatland and water, artificial or natural, including areas of sea water with a depth of less than 6 m at low tide (Finlayson and Moser, 1991; Gong et al., 2010). Wetland ecosystems, while accounting for 1.5% of the world land area, provide nearly half of the global ecosystem services. They are among the world’s most productive and valuable ecosystems (Costanza et al., 1997; Zedler, 2003). Wetlands play a key role in regulating runoff, mitigating flood disasters and improving water quality (Zhang et al., 2011). Wetlands also provide essential habitats for many plants and animals, maintain ecological stability and protect biodiversity (Guo et al., 2017; Mahdavi et al., 2018). Alpine wetlands were Located between the treeline and snowfields and glaciers, present throughout most of world’s mountains and are defined as small (1 m2 to a few square hectares) and shallow water bodies characterized by at least the seasonal presence of surface water, and global alpine wetlands often experience stronger climate changes compared with the low-altitude wetlands (Wissinger et al., 2016; Zhang et al., 2016; Carlson et al., 2020). As a special type of wetland, alpine wetlands play an important role in plant and animal protection, environmental climate regulation and material circulation in the Tibetan Plateau area (Zhao et al., 2014).
The wetland areas of China are mainly distributed in the Qinghai-Tibet Plateau (QTP) and northeast region and were estimated to cover 451084 ± 2014 km2 in 2015 (Mao et al., 2020). The wetland area in Tibet, Qinghai, Inner Mongolia, Heilongjiang and Xinjiang provinces accounted for 53.7% of the total wetland area in China (Mao et al., 2020). Alpine wetlands are widely developed on the QTP, accounting for 13.99% of the total wetland in China (Dong and Xu, 2018). In recent years, climate change is expected to lead to more severe warming at high elevations or latitudes because of inconsistent global warming patterns (Ellis and Rochefort, 2006). The QTP is one of the most sensitive and vulnerable regions under the effects of intense climate change (Xue et al., 2014). Studies have shown that climate change is one of the important reasons for the degradation of the QTP wetlands (Wu et al., 2017). Climate change mainly affects wetlands through variable temperature and precipitation (Wang R et al., 2020). In the past 40 years, about 10% of the alpine wetland area on the QTP has vanished (Zhang et al., 2020). According to the Intergovernmental Panel on Climate Change Fourth Assessment Report, a simulation by Xue et al. suggests that about 35.7% of wetlands could vanish by 2080 by severe warming, even in the most optimistic scenario (Xue et al., 2014). To protect alpine wetlands, accurate, reliable, and quick information about their distribution is an important prerequisite for alpine wetland protection.
Remote sensing technology has been widely used in wetland surveys and identification because of its advantages in wide coverage, real-time information acquisition and convenient collection (Zhang et al., 2021). Compared with low-altitude areas, wetland monitoring and identification on the QTP is difficult and collecting field observations is particularly time consuming. In most cases, remote sensing is the only feasible alpine wetland monitoring and research method. Previous studies have mainly relied on Landsat satellite sensors (MSS, TM, ETM+, and OLI) and SPOT images for wetland monitoring and land cover mapping (Sader et al., 1995; Li and Jia, 2008; Farda et al., 2016). Several global land cover products have mapped the distribution of wetlands using remote sensing images, including GlobalLand30 (Jun et al., 2014; Chen et al., 2015), FROM-GLC BUMODIS (Friedl et al., 2002), GLCNMO 2013 (Kobayashi et al., 2017) and DIS Cover (Loveland et al., 2000) and GLC2000 (Global Land Cover 2000) (Bartholome and Belward, 2005). Although such datasets have been widely used, their accuracy and quality are not satisfactory for many applications (Chen et al., 2015), including the extraction of alpine wetlands. Numerous researchers (Iwao et al., 2006; Gong, 2009; Fritz et al., 2010) have highlighted the inadequacies of these data, such as considerably low accuracies and low consistency amongst products (Chen et al., 2015). The definition of a wetland in many data products are uncertain; for example, there is not a uniform standard for the definitions of bogs, marshes and swamps, and wetland definitions are not scientific (Mitra et al., 2005; Yin et al., 2014). The diversity of wetland definitions will blur the wetland boundaries and then affect the classification of wetlands (Wang J et al., 2020).
The most widely used wetland classification algorithms include the traditional K-means, minimum distance and maximum likelihood (ML) methods (Aldrich, 1997). Advanced algorithms include support vector machine (SVM) (Cortes and Vapnik, 1995), decision tree (DT) (Breiman, 2001), and random forest (RF) (Breiman, 2001). However, mapping alpine wetlands presents challenges due to the particular topographic conditions, and common extraction methods tend to be inaccurate. Scholars extracted TM data of wetlands in the middle and lower reaches of the Ngu River from 1986 to 2000 (Huang et al., 2005), summarized the spectral characteristics of remote sensing data of wetlands in western Inner Mongolia, and established interpretation indicators (Meng et al., 2007). Li et al. used TM data to extract the Maqu wetland by principal component analysis and decision tree (Li et al., 2009). Li et al. used Landsat eight Operational Land Imager (OLI) data to extract the wetlands in Norgay area, and compared SVM, RF and DT methods, and concluded that RF and DT have better extraction effects for alpine wetlands (Li et al., 2020). Most of these studies were based on pixel-based classifications and relied on a large number of ground samples (Gallant, 2015; Mui et al., 2015; Mao et al., 2020). Moreover, most studies used landscape indices such as shape and texture indices for wetland identification (Dronova, 2015). More recently, wetland research has experimented with the object-oriented image segmentation method, which can depict an image as a homogeneous object, use different decision rules, and reasonably divide and extract the wetlands (Blaschke, 2010; Dronova et al., 2011; Dronova, 2015; Mao et al., 2018b; Campbell and Wang, 2019).
The main purpose of this study was to map the wetlands of the Headwater Area of the Yellow River (HAYR) with Landsat eight OLI data and develop an extraction method suitable for alpine wetlands, which is based on object-oriented and decision tree coupled analysis combined with topography and geomorphology. The specific objectives were to: a) improve the extraction precision of wetland areas in the HAYR, b) compare the existing wetland extraction methods and existing results, c) verify the relationship between wetland distribution and topography in the HAYR.
The study region (33°56′-35°25′N, 95°52′-98°22′E) is located in the northeastern QTP, Qinghai Province, Southwest China, at the northern foot of Bayan Har Mountain, spanning Maduo and Qumalai counties, with a total area of 2.1 × 10⁴ km2 (Figure 1). The average altitude of the plateau area is greater than 4,500 m.
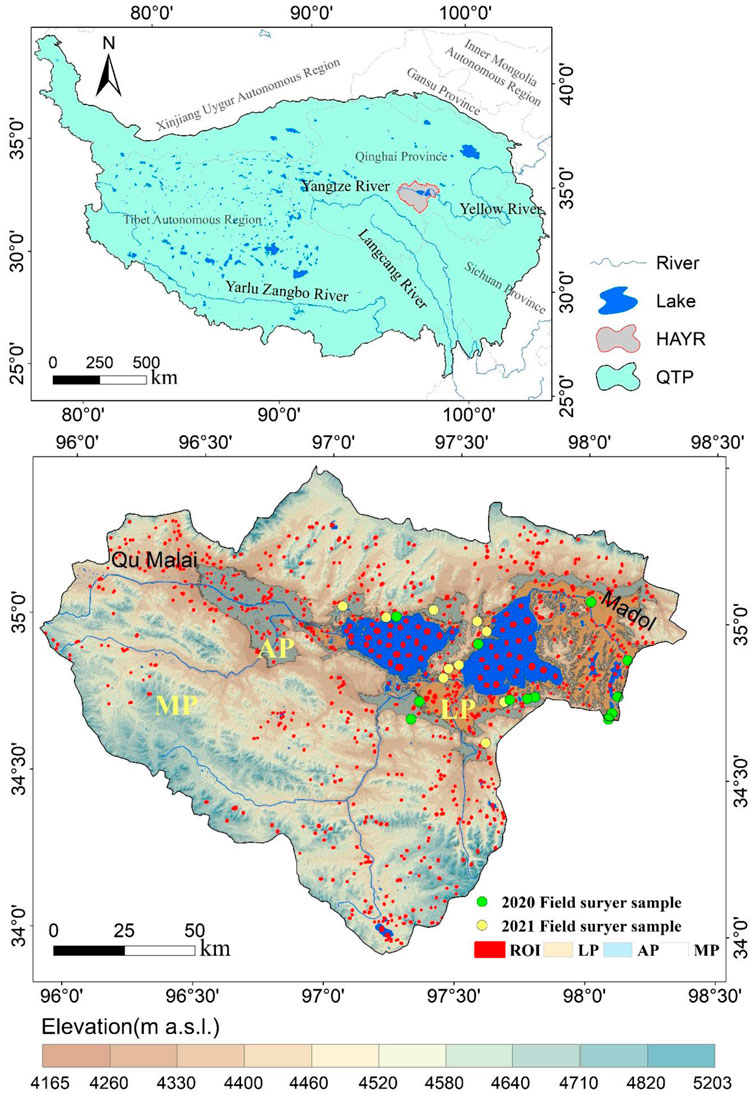
FIGURE 1. Location of the study area, Region of interests (ROI) and field verification points; LP: lacustrine plain; AP: alluvial-proluvial plain; MP: mountain plain.
It has a continental semi-arid alpine climate (Luo et al., 2018), with annual precipitation of 287.49–754.36 mm and annual temperature of −4°C (Tian et al., 2018; Zhang et al., 2020), annual evaporation amount of 700–900 mm (Duan et al., 2015). In this region, more than 80% of the area is permafrost, with some sporadic or isolated permafrost and seasonal frozen soil (Li et al., 2016; Luo et al., 2018). Altitude and topography largely determine the thickness and thermal state of the permafrost. The thickness and temperature of permafrost become thicker and lower with elevation (Luo et al., 2018). Due to the frozen layer acts as a semi-impermeable barrier that greatly limits the drainage of water from the upper soil layer, so that when the topsoil layer thaws seasonally, sudden heavy rainfall occurs and liquid water tends to be retained near the surface, Form seasonal wetlands (Avis et al., 2011). These wetlands are highly dependent on rainfall and have strong fluctuations, so they are not included in the classification this time. The vegetation primarily consists of alpine meadows in the southern HAYR and alpine steppes in the northern counterpart (Luo et al., 2020).
The study area is dominated by numerous small lakes and thermokarst ponds, which are largely developed in the valley or bottom of the main stream of the Yellow River, as well as in alpine plains and marsh meadows (Luo et al., 2020). The diversity of species in the alpine area is ensured by the presence of wetlands. Alpine wetland ecosystems are important water and biodiversity reservoirs and represent a key ecological type in the QTP nature reserve (Zhao and He, 2000; An, 2003).
For this analysis, we relied on multi-spectral images acquired by the Landsat eight OLI satellites, which were downloaded from United States Geological Survey (USGS, https://www.usgs.gov/) for satellite imagery analysis and the images resolution was 30 m. Altogether, three scenes of OLI images with paths from 134 to 135 and rows from 35 to 36 are needed to cover the entire land area of HAYR. QTP vegetation were grows from June to October (Duan et al., 2021), so images for the period from July to October would have been preferred, but cloud cover caused no suitable image to be found for July and August. The selected data are listed in Table 1.
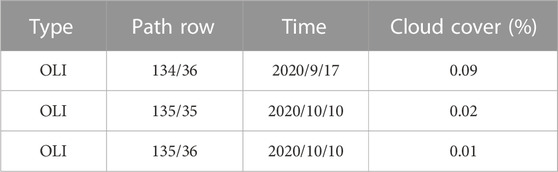
TABLE 1. Details of the Landsat eight OLI scenes used in the study.
Landsat eight OLI images possess nine spectral bands with a spatial resolution of 30 m (Band1: Coastal, Band2: Blue, Band3: Green, Band4: Red, Band5: NIR, Band6: SWIR1, Band7: SWIR2, Band9: Cirrus) except the panchromatic band (Band8: Pan) at a spatial resolution of 15 m. Before wetland information extraction, the remote sensing images were pre-processed through geometric correction, radiation calibration, atmospheric correction, etc., in order to reduce the error caused by topography, slope Angle and aspect, mountain shadow, etc. All processing was performed using the ENVI 5.3 software. In addition, ASTER GDEM digital elevation data with a spatial resolution of 30 m were downloaded and mosaicked to cover the entire study area. Slope layers were generated from the DEM using ArcGIS data software (version 10.8).
Object-oriented and decision tree classification methods were combined in this study to accurately extract alpine wetlands. Firstly, the pre-processed images of the study area were segmented to generate homogeneous landscape objects. Then, image spectral indices such as Normalized Difference Vegetation Index (NDVI), Normalized Difference Water Index (NDWI) were calculated. According to the geomorphic types, the study was divided into lacustrine plain, alluvial-proluvial plain and mountain plain (Figure 1). Wetland samples were extracted from the wetlands in the three regions, and the parameters of their spectral index were statistically analyzed to determine the threshold value. The detailed processing steps are described in the following sections.
The entire classification process was carried out with the feature extraction module in the ENVI5.3 software. The detailed process is shown in Figure 2.The first determined the regional wetland types using the Ramsar Convention and the local standard of Qinghai Province DB63T 1746-2019 Technical Guide for Remote Sensing Classification of Alpine Wetlands. The regional land cover types were divided into six categories: rivers and lakes, marsh wetlands, flood wetlands, high cover vegetation areas, low cover vegetation areas, and bare lands. Detailed information is shown in Table 2.
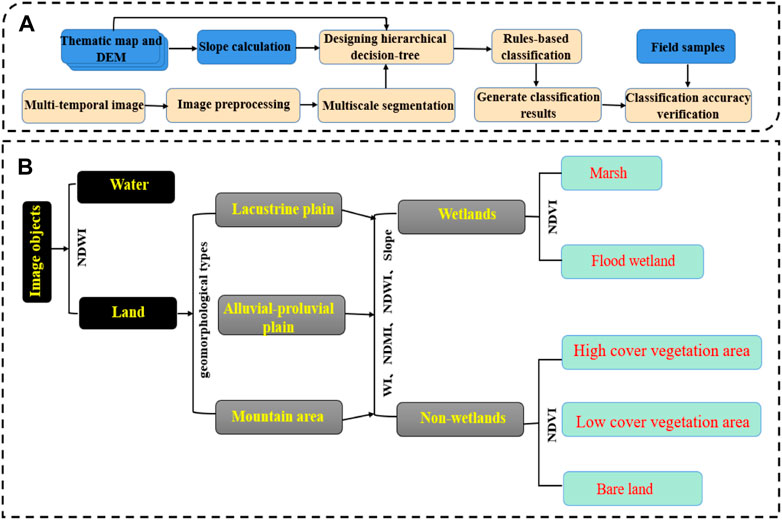
FIGURE 2. A general description of ODTC. (A) classification flow chart; (B) hierarchical decision-tree. NDVI: Normalized Difference Vegetation Index; NDWI: Normalized Difference Water Index; WI: Wetness Index; NDMI: Normalized Difference Moisture Index.
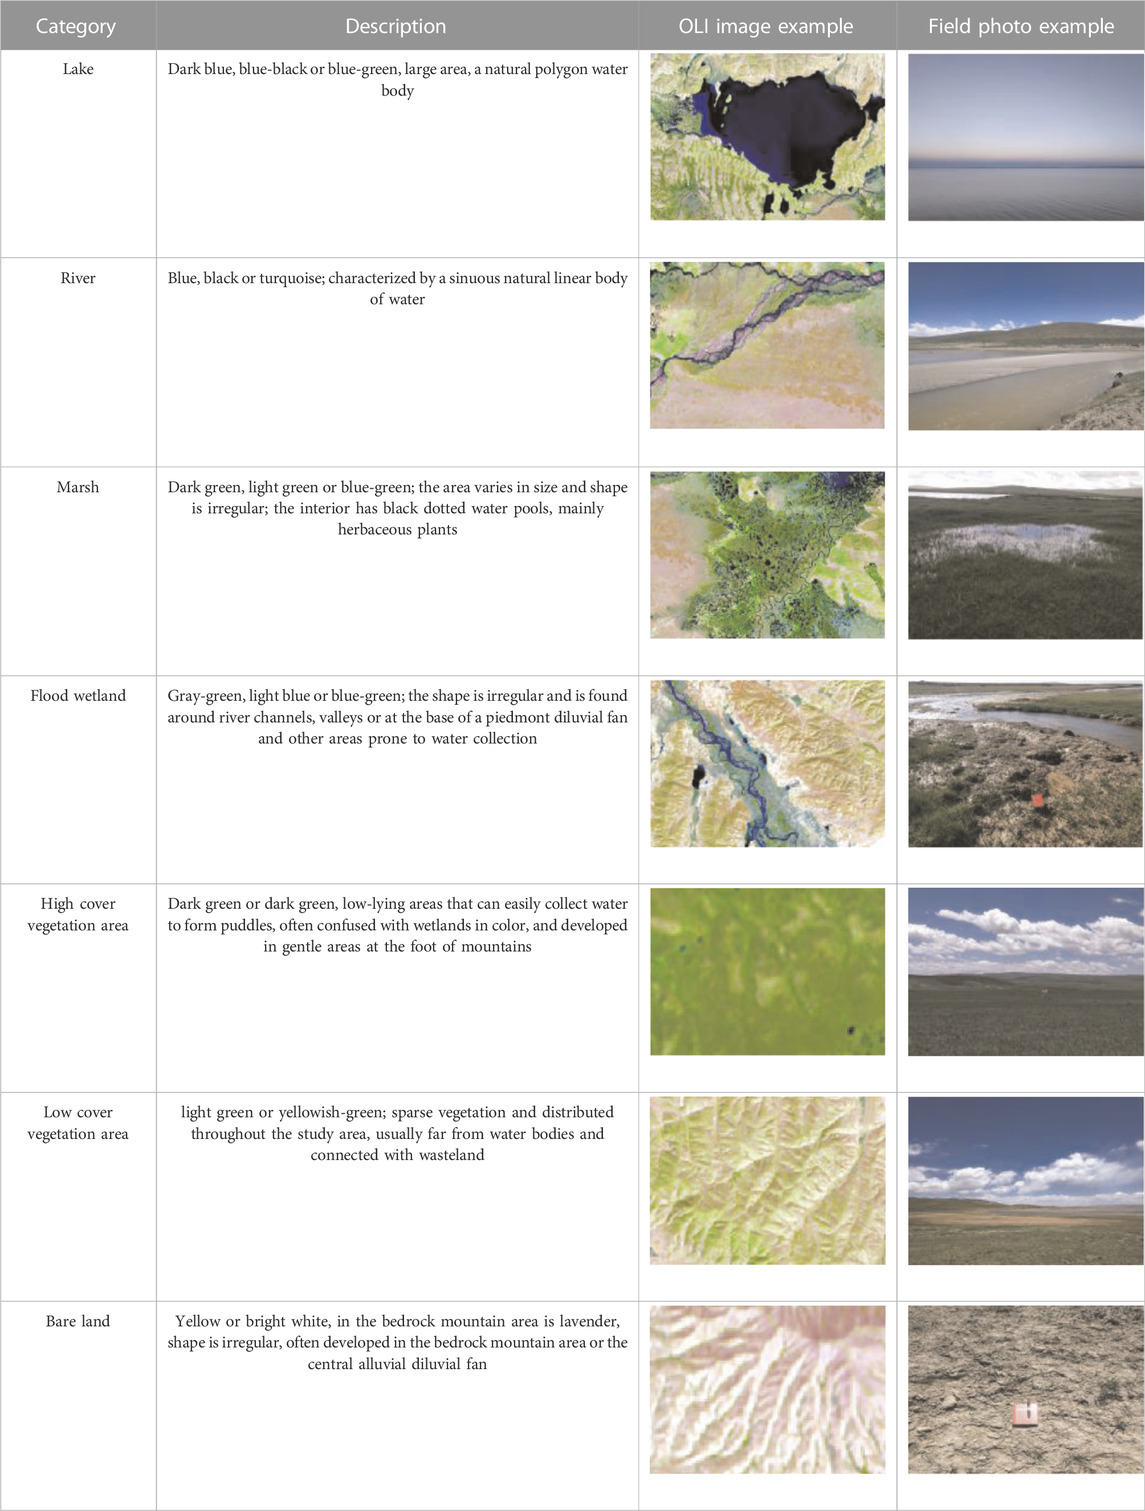
TABLE 2. Wetlands and land cover types categories as seen in a Landsat eight OLI color composite (bands 7, 5, 3) and field photos.
The second step was determining the most suitable combination of image segmentation scale and merging levels. Each image was segmented into several small block objects with similar properties. Each object represented a combination of pixels within a range that had the same or similar properties. High-scale segmentation produces fewer patches, but because it combines features of different types, it results in large errors. Low-scale segmentation produces more patches and also leads to a large error. It is particularly important to choose an appropriate segmentation scale as it directly affects the accuracy of the classification. The appropriate segmentation scale varies by region and image. In the feature extraction module, there are two segmentation algorithms (edge and intensity) and two merging algorithms (full Lambda scheduling and fast Lambda) that can be selected.
In this study, we chose the edge algorithm and all Lambda scheduling algorithm. We applied a trial-and-error approach, conducting many experiments on combining segmentation and merging levels to determine the optimal scale. Figure 3 shows six segmentation scales ranging from 30 to 80. The segmentation level of 30 results in over-segmentation (Figure 3B). The excessive segmentation of ground objects leads to low separability among different image objects, reducing classification accuracy. A segmentation scale of 80 groups different kinds of fragments/objects into one object (Figure 3G). This also means that the subsequent information extraction cannot be performed correctly. Figure 3D shows the results of the optimal segmentation scale (50) and merge level (20), with high internal uniformity, clear boundary contours and ground objects that are clearly distinguished.
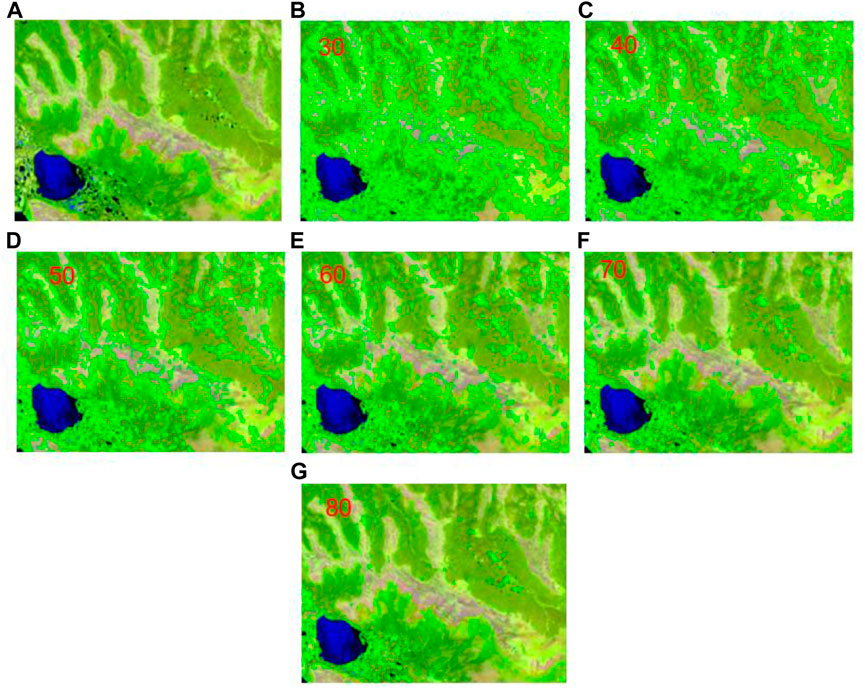
FIGURE 3. Comparison of segmentation results at different scales based on Landsat eight OLI; the background image is a Landsat eight OLI image composite from bands 7, 5, 3. (A) Original image. (B) Segmentation scale: 30. (C) Segmentation scale: 40. (D) Segmentation scale: 50. (E) Segmentation scale: 60. (F) Segmentation scale: 70. (G) Segmentation scale: 80.
In order to better reflect the effect of optimal segmentation scale segmentation, we selected segmented images representing regions for analysis (Figure 4). In Figure 4A, marsh, high coverage vegetation areas, low coverage vegetation areas, and lakes are clearly clustered in one object, with high internal homogeneity. Figure 4B shows flooded wetlands, bare land, and low coverage vegetation areas. Figure 4C shows high coverage vegetation areas, low coverage vegetation areas and marsh. Rivers, flooded wetlands, marsh, and low cover vegetation areas are mainly shown in Figure 4D. Overall, Landsat8 has a good segmentation effect, the optimal segmentation scale is 50, and the merge scale is 20.
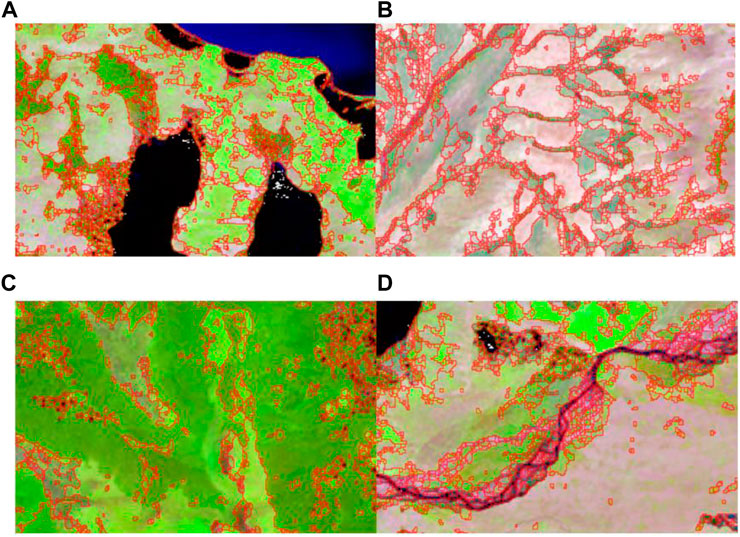
FIGURE 4. Image segmentation sketch diagrams of representative areas based on Landsat eight OLI. The red line represents the object border. (A) Marsh, high coverage vegetation areas, low coverage vegetation areas, and lakes; (B) flooded wetlands, bare land, and low coverage vegetation areas; (C) high coverage vegetation areas, low coverage vegetation areas and marsh; (D) Rivers, flooded wetlands, marsh, and low cover vegetation areas.
The third step was to calculate vegetation indices (Table 3). Then, the study area was divided into lacustrine plains, alluvial-proluvial plains and mountain plains based on the elevation and topographic characteristics. Based on the regional topography and geomorphology, we extracted sample points of multiple geomorphic units respectively. According to the statistical results, the altitudes of 4265 m and 4300 m were taken as the boundaries of three types of geomorphic units. The spectral characteristics and ground object characteristics of the three types of regional features were sampled, and the threshold was determined according to the extraction results. A decision tree was constructed to classify the images for example Figure 5 in conformity with the statistical results. The Figure 5 presents an example of classification rules for delineating wetlands in a block of AP.
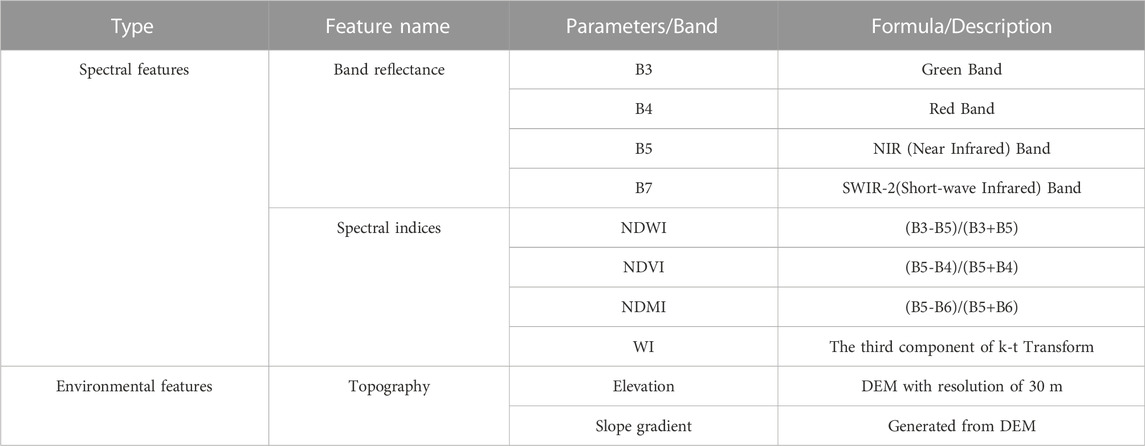
TABLE 3. Feature list of image object identification for wetland classification.
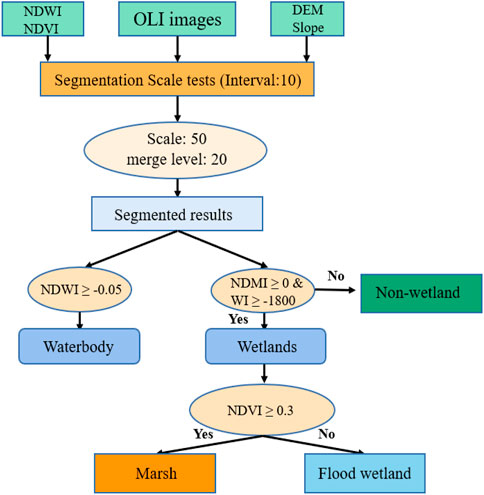
FIGURE 5. An example of classification rules for delineating wetlands in a block of lacustrine plain.
The fourth step was to use other classification methods such as support vector machine (SVM), decision tree method (DT) and random forest method (RF) to compare and verify the advantages of the proposed method. The classification methods were applied adopting their default parameter values in ENVI 5.3.
The classification results were evaluated using the confusion matrix method. Region of interests (ROIs) was identified on the image through visual interpretation and digitized, and used to calculate the classification accuracy. To further assess the reliability of the classification results, field investigation and field information collection were carried out in the study area in 2020 and 2021. The distribution of the samples is shown in Figure 1. In this study, a total of 848 surface interest area samples were selected to verify the accuracy of the classification.
In order to further verify the classification accuracy, we used a new comprehensive index Distance between Indices of Simulation and Observation (DISO) (Hu et al., 2019; Zhou et al., 2021) to compare the accuracy of each classification. For the real status of wetlands status [here we note A= (a1, a2, … , an)] and the model simulated wetland distribution results [here we note B= (b1, b2, … , bn)], we have:
R: Correlation coefficient of strength and direction of linear association between simulation and observation data; AE: Absolute error in measuring any persistent deviation (positive underestimation and negative overestimation) from observed data; RMSE: Quantifies the root mean square error of the mean deviation amplitude.
The best performance is obtained from the best statistical metrics, such as R = 1, AE = 0, NRMSE = 0 (Zhou et al., 2021). Then DISO has the form:
The HAYR wetland map was combined with ASTER GDEM data in ArcGIS10.8 software to analyze the distribution in relation to the local topography.
To further demonstrate the relationship between wetland development and topography and hydrogeological conditions, this study analyzed elevation, slope, lithology and wetland distribution data. Slope of the study area was divided into nine grades (Table 4), and along with lithology, was superimposed on wetland distribution.

TABLE 4. Slope grade division.
The overall accuracy of land cover classification was 98.9%, and the Kappa coefficient was 0.98 (Table 5), confirming that the method adopted in this study is suitable for the extraction of wetlands in the HAYR. The detailed results can be seen in the land cover classification map (Figure 6). In order to further highlight the distribution of wetlands, Figure 6 is simplified to show only marsh, flood wetland, lake and river, and the HAYR wetland distribution map is made (Figure 7).
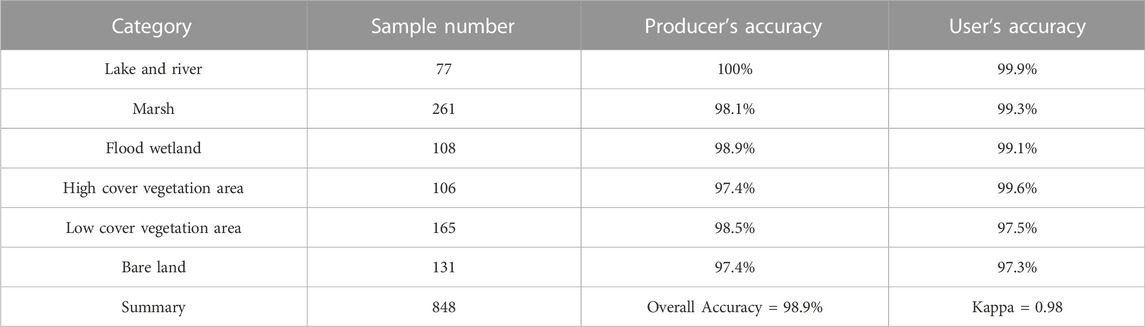
TABLE 5. Classification accuracy of land cover in the HAYR.
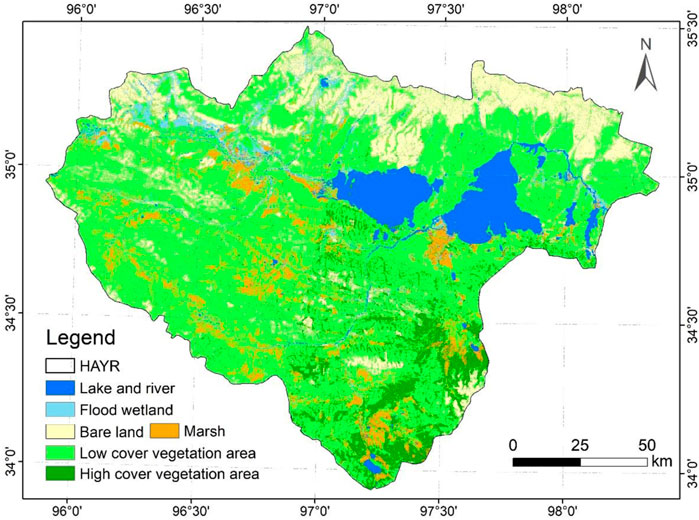
FIGURE 6. Classification of land cover in the HAYR.
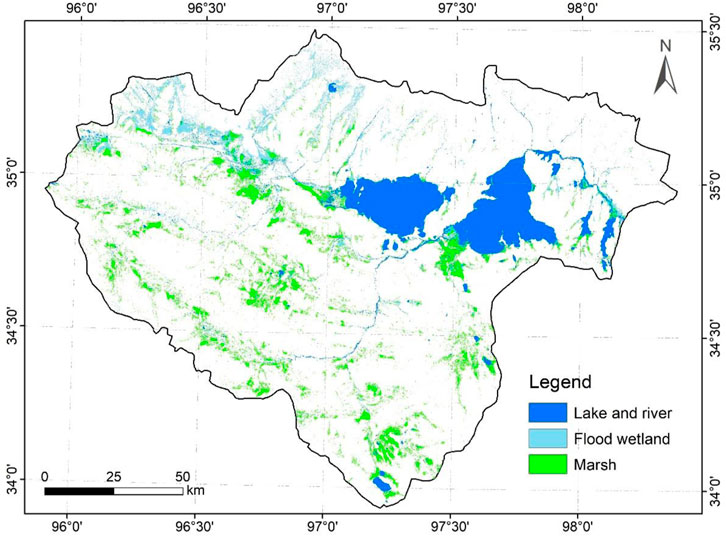
FIGURE 7. Spatial distribution of wetlands in the HAYR.
The wetland area of the HAYR was estimated to be 3412.3 km2 in 2020 and is summarized by type in Table 6. Wetlands were extensively distributed across the study area with notable spatial heterogeneity (Figure 7).
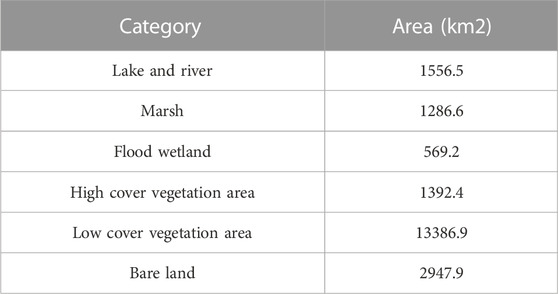
TABLE 6. Statistics of land cover type area at the HAYR.
The area of marsh wetlands accounted for 37.7% of the total wetland area in the HAYR. Marsh wetlands were generally distributed in the periphery of lake ponds and the groundwater overflow zone of piedmont alluvial fans. In mountainous areas, the groundwater overflow area and inter-mountain catchment basin are also prone to develop marsh wetlands. Flood wetland, having the smallest wetland area, was mostly present in the northeast and northwest, accounting for about 16.7% of the wetland area. Flood wetlands were formed in areas such as canyons and rivers that are prone to be inundated by floods caused by atmospheric precipitation. Rivers and lakes, as important water resources, are widely distributed in the HAYR, with a total area of about 1556.5 km2. The two largest lakes in the region, Gyaring lake Ngoring lake, are located in the northeast. The existence of the two lakes plays an important role in the formation and development of wetlands in the HAYR.
A total of 13 field validation sample points were collected in 2021 (Figure 1), and 12 were correctly classified with 92.3% accuracy in the results of the object-oriented decision tree classification method. 11 wetland samples were included in the 13 field samples, of which 10 were correctly classified with 90.9% accuracy. One field validation sample point was misclassified, which was verified as a wetland in the field, but the classification result showed that it was a high-cover vegetation area. Since it rained in the study area before the field investigation, and this point was located in a catchment basin among mountains, which was conducive to groundwater collection and easy to develop into a seasonal wetland, it was easy to produce errors, as can be seen in Figure 8.
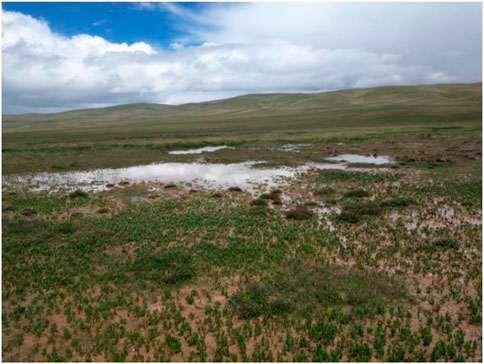
FIGURE 8. Seasonal wetlands formed by rainfall in catchment areas.
All the 14 field validation samples collected in July 2020 (Figure 1) were consistent with the classification results of this study. Since the selected remote sensing images were from September to October 2020, the accuracy of this method in alpine wetland extraction and the applicability of this method in alpine wetland extraction was further confirmed.
In order to better see the distribution characteristics of wetlands in the study area, the wetland map was three-dimensionalized (Figure 9). Flood wetlands were found to be widely distributed around rivers, the northern valley and the western part of the lake district. Marsh wetlands are distributed around the lake and in the southern alpine alpine area, and the alpine wetlands are mainly located in the piedmont area, the groundwater overflow zone of the piedmont alluvial fan and the alpine basin. The distribution and development of wetlands in the HAYR is strongly related to topography and hydrogeological conditions. The method of combining topography and geomorphology used to extract wetlands in this study has been further verified. The presented approach can play a crucial role in the study of alpine wetlands.
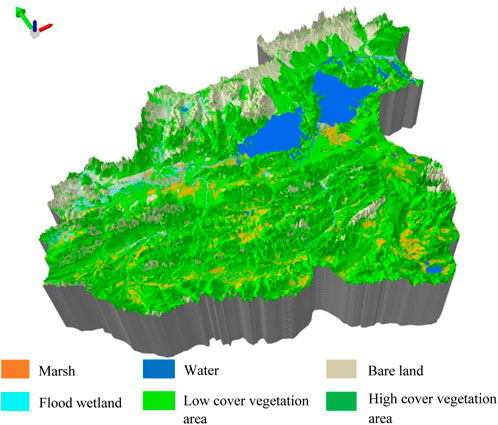
FIGURE 9. 3D wetland map of the Yellow River Source.
Regarding the distribution of wetlands, there are strong differences in elevation, slope and lithology. Water bodies were mainly present between 4156 m and 4,319 m asl. Marsh was mainly present between 4250 m and 4680 m, while the wetland area increases substantially around 4450 m. Flood wetlands were mainly concentrated between 4250 m and 4550 m (Figure 10). Wetlands are mainly distributed in areas with a slope of less than 8°. These areas are low-lying and have good catchment conditions. Among lakes and rivers, 85% are distributed in regions with a slope of less than 2°. More than 85% of flood wetlands and 83% of marsh wetlands are located in areas with slopes of less than 6° (Figure 11).
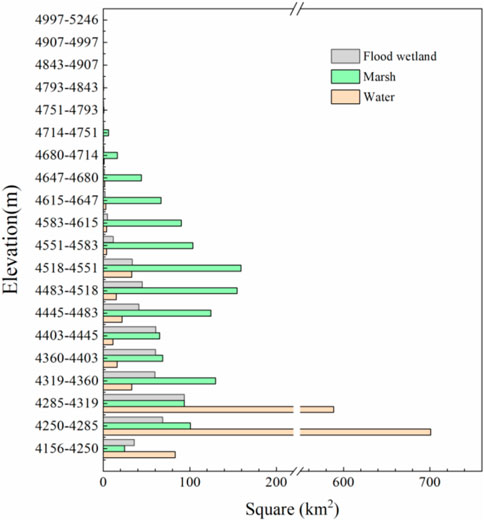
FIGURE 10. Elevation characteristics of wetlands in the source of the Yellow River.
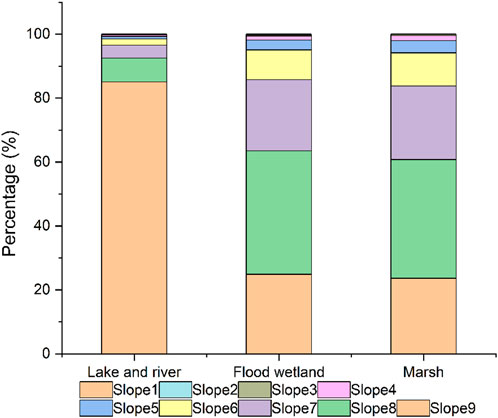
FIGURE 11. Slope characteristics of wetlands in the source of the Yellow River.
There are many lithologic types in the study area, which can be divided into sedimentary rocks, magmatic rocks and quaternary loose deposits (http://www.resdc.cn/). More than 95% of rivers and lakes, 81% of marsh wetlands and 89% of flood wetlands are distributed in quaternary loose deposits area (Figure 12).
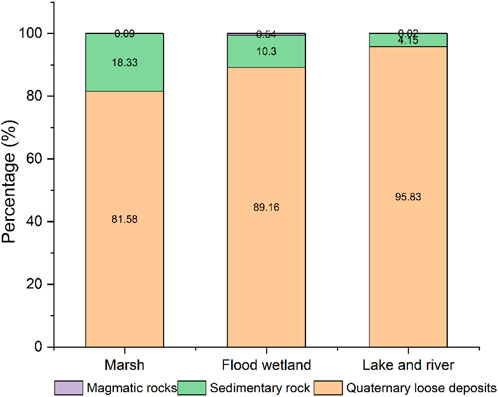
FIGURE 12. Lithological characteristics of wetlands in the HAYR.
This study used 30-m spatial resolution remote sensing data from Landsat eight to produce the most detailed wetland map of the HAYR. The mapping results were based on the Ramsar Convention and Qinghai Province wetland classification standard and 2 years of field sampling. The results can be used for alpine wetland ecological research and alpine wetland protection as the collected field samples include a complete range of species. Due to particularity of the studied location, there are relatively few studies on the wetlands of the HAYR. Additionally, most studies show some misunderstanding of alpine wetlands. Most of them misclassify alpine meadows into wetlands, or flood wetlands into low-cover vegetation areas, or even just divide wetlands into wetlands and water bodies. As a result, the extracted alpine wetland area is either overestimated or underestimated. Tong (Tong et al., 2014) divided the wetlands in the Three-River Headwaters Region of China into two categories: marsh and water body. Zhang (Jiping et al., 2011) divided the wetlands in Damqu Basin, the source region of the Yangtze River, into riverine, lacustrine and palustrine. Zhang (Zhang et al., 2021) divided the wetlands in Pumqu Basin in The Qomolangma region into rivers, lakes, swamps and flood wetlands. However, Zhang did not consider the catchment area between valleys, and only identified and extracted the flood wetlands around rivers. This study solves the problems of these studies to a certain extent.
The comparison of the classification accuracy of the eight classification methods tested in this study are shown in Table 7. We compared the classification accuracy of ODTC with seven commonly used machine learning algorithms, such as SVM, CNN and RF. The results show that the classification accuracy of ODTC is improved by 10%–20% compared with these seven methods, and ODTC has higher user accuracy, producer accuracy, overall accuracy and kappa coefficient. For wetland extraction effect in lake area, the accuracy of the seven classification methods is similar, but the accuracy is poor in alluvial-diluvial area and mountainous area. The wetland in lacustrine plain is typical and easy to be distinguished from the surrounding vegetation, but the wetland in mountainous area and the high-cover vegetation are interleaved with each other. SVM and RF are based on pixel classification, pixels contain multiple ground object information. The maximum likelihood method and minimum distance method can accurately classify these land covers purely based on Landsat spectral features. However, pixel classification using these traditional methods is not recommended because the classifiers lack complex spectral discrimination for very complex features (Lu et al., 2004). We used DISO to compare these eight methods, and the results showed that ODTC had the best accuracy, while CART had a low accuracy because it could not identify mountain wetlands well.
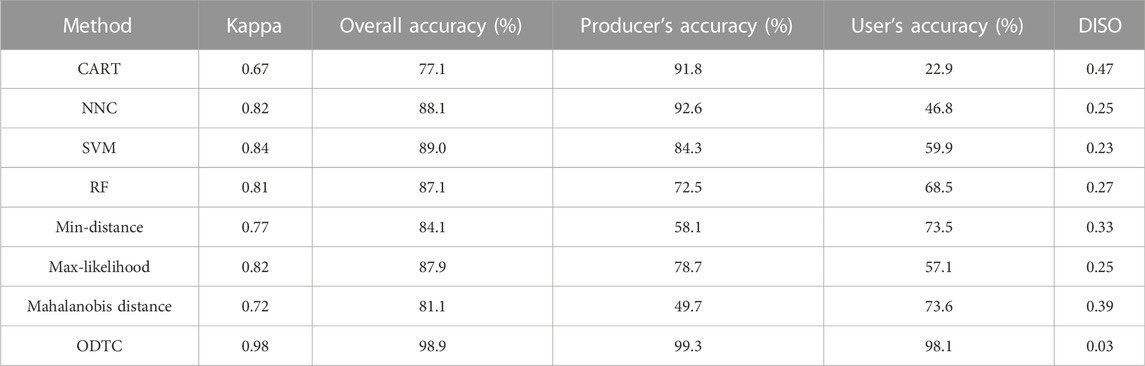
TABLE 7. Results of remote sensing classification of wetlands in the study area using eight methods.
As shown in Figure 13, CART is relatively accurate in the extraction of wetlands around the lake district and rivers, but performs poorly in the piedmont and alpine wetlands. RF has a good extraction effect for piedmont and alpine wetlands, but there is a large error in the extraction of river and lake wetlands, and the extraction range is too large. The minimum distance method, maximum likelihood method and Mahalanobis distance method all have large errors, and overestimate wetlands. The above methods wrongly identify alpine meadows as wetland, while the groundwater overflow zone of piedmont alluvial diluvial fan is identified as low vegetation cover area or bare land. Therefore, these five classification methods are not suitable for the plateau area. Compared with the first five methods, the accuracy of NCC and SVM methods is relatively high, with Kappa coefficient and OA reaching 0.82%, 88.1% and 0.84, 89.0%, respectively. However, there is still a certain amount of misclassification and omission in the identification of alpine wetlands, so they are also not suitable for extracting wetlands in the HAYR.
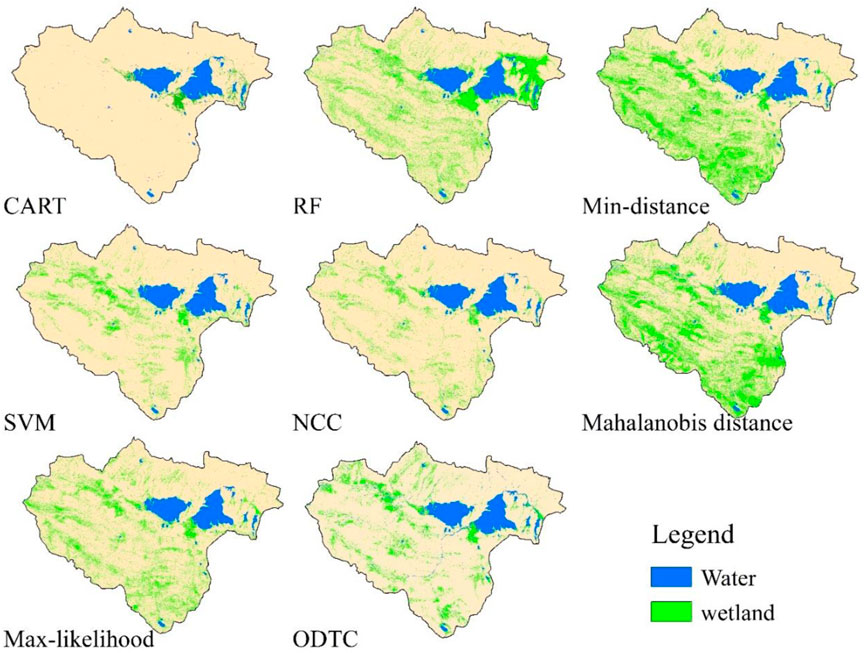
FIGURE 13. The comparison of the eight classification methods.
Land use data for China and other global land cover databases, such as ChinaCover (Mao et al., 2018a) and GLC (Chen et al., 2015), identify and extract wetlands by estimating land use area or use type. For example, in GLC all wetlands are classified into one class. Despite their differences, CAS_wetlands (Mao et al., 2020) does not separate wetlands into marsh and flood wetlands. The former is dominated by grasses and have high vegetation density, while the latter mainly develop in flood-prone areas around valleys or rivers and have low vegetation density. These issues have been addressed in this study.
The corresponding source regions of the Yellow River were extracted from GLC and CAS_wetlands, and we compared with the results of this study (Figure 14). The wetland area of GLC is too small and there is a certain degree of deficiency in the wetland in alpine alpine areas and the wetland around rivers (Figure 14B). The wetland area extracted from CAS_wetlands is exaggerated, and large areas of high vegetation cover are incorrectly identified as wetlands; while the wetlands on the groundwater overflow zone at the front of the alluvial fan are not clearly identified by the product (Figure 14C). The reason for the misclassification of wetlands is that the specificity of high elevation cold areas was not taken into account. In addition, CAS_wetlands did not consider topographic and geomorphic factors and hydrogeological conditions, and therefore wetlands were not identified in groundwater overflow zones such as the piedmont alluvial-proluvial fan and inter-mountain catchment basin. For this reason, CAS_wetlands was not suitable for high-altitude wetland mapping. In order to make a better comparison, four typical regions were selected for comparison based on Figure 14A, as shown in Table 8.
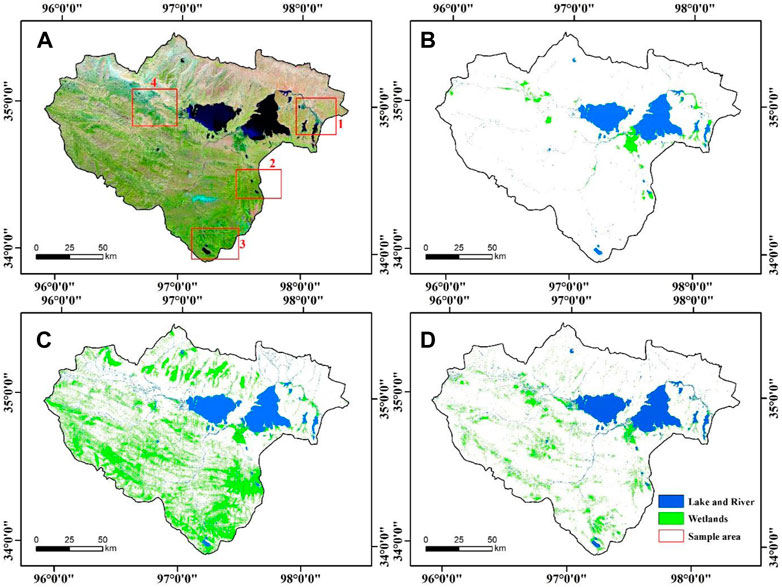
FIGURE 14. Wetland maps for the headwater area of the Yellow River from different datasets (A). Landsat OLI color composite (bands 7, 5, 3) (B) GLC wetlands. (C) CAS_wetlands. (D) Object-oriented combined with decision tree wetland extraction results (this study).
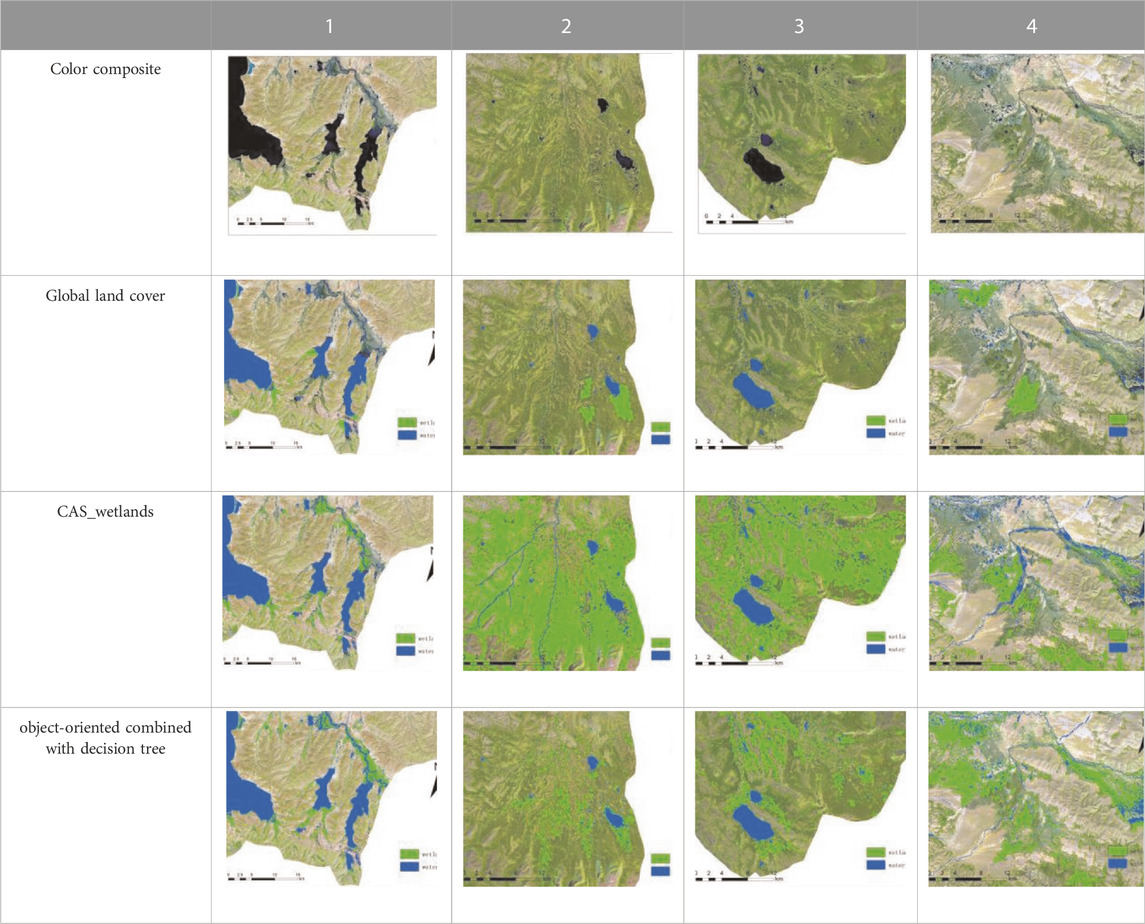
TABLE 8. Comparison of extraction results by different datasets in four regions of HAYR (Squares shown in Figure 8A).
As can be appreciated from Table 8, the approach used in this study can accurately extract both river and lake wetlands and piedmont wetlands. As a typical river source area, the wetlands in HAYR are also typical alpine wetlands. Therefore, the alpine wetland extraction method used in this study is applicable to the whole area of the three River sources region and even QTP. This new extraction method of alpine wetlands can improve monitoring of alpine wetlands nationwide and should be tested globally in future work.
In this study, a wetland classification system based on an object-oriented method combined with decision tree and topographic features was applied to Landsat eight OLI images for mapping wetlands of the HAYR. This study has achieved the most accurate and up-to-date estimation of all types of wetlands in the HAYR. In 2020, the area of the HAYR was estimated to be 3412.3 km2, of which 45.6% was occupied by lake and river wetlands. Among the three types of wetlands, marsh wetlands cover an area of 1286.6 km2, accounting for 37.7% of the total wetland area. They are distributed in the alpine catchment basin, piedmont alluvial-proluvial fan and around the lake, and are distributed roughly along the northwest to southeast direction, and can be considered to have a certain relationship with the geological structure. Despite the accurate extraction of permanent wetlands, the results for seasonal wetlands, rivers and lakes were not satisfactory. Due to the large uncertainty of changes in seasonal wetlands, the method used in this paper is not suitable for seasonal wetlands, and the model requires more professional knowledge, the threshold needs to be carefully determined. Considering the need for sustainable protection and management of wetlands in high latitude areas, future efforts will need to use higher resolution remote sensing data to improve the classification of seasonal wetlands.
The raw data supporting the conclusions of this article will be made available by the authors, without undue reservation.
YF and SL contributed to the conception of the study; TY and SL performed the experiment; TY and YF contributed significantly to analysis and manuscript preparation; TY, GW, LW, and DY performed the data analyses and wrote the manuscript; XK and PW helped perform the analysis with constructive discussions.
This research was supported by the National Natural Science Foundation of China (92047202, 41330634, 41072191, and 91125011), the Strategic Priority Research Program of the Chinese Academy of Sciences (Grant No. XDA2010010306), the China Geological Survey since 2000, and the Fundamental Research Funds for Central Universities are gratefully acknowledged.
The authors greatly appreciate the valuable comments and suggestions of the editors and reviewers using their time and effort to improve this manuscript.
The authors declare that the research was conducted in the absence of any commercial or financial relationships that could be construed as a potential conflict of interest.
The reviewer ZH declared a shared affiliation with the author DY to the handling editor at the time of review.
All claims expressed in this article are solely those of the authors and do not necessarily represent those of their affiliated organizations, or those of the publisher, the editors and the reviewers. Any product that may be evaluated in this article, or claim that may be made by its manufacturer, is not guaranteed or endorsed by the publisher.
Aldrich, J. (1997). RA Fisher and the making of maximum likelihood 1912-1922. Stat. Sci. 12 (3), 162–176.
An, S. (2003). Wetland ecosystem-utilization and protection of wetland resources optimization model. Beijing: Chemical Industry Press.
Avis, C. A., Weaver, A. J., and Meissner, K. J. (2011). Reduction in areal extent of high-latitude wetlands in response to permafrost thaw. Nat. Geosci. 4 (7), 444–448. doi:10.1038/ngeo1160
Bartholome, E., and Belward, A. S. (2005). GLC2000: a new approach to global land cover mapping from Earth observation data. Int. J. Remote Sens. 26 (9), 1959–1977. doi:10.1080/01431160412331291297
Blaschke, T. (2010). Object based image analysis for remote sensing. ISPRS J. photogrammetry remote Sens. 65 (1), 2–16. doi:10.1016/j.isprsjprs.2009.06.004
Campbell, A., and Wang, Y. (2019). High spatial resolution remote sensing for salt marsh mapping and change analysis at Fire Island National Seashore. Remote Sens. 11 (9), 1107. doi:10.3390/rs11091107
Carlson, B. Z., Hébert, M., Van Reeth, C., Bison, M., Laigle, I., and Delestrade, A. (2020). Monitoring the seasonal hydrology of alpine wetlands in response to snow cover dynamics and summer climate: a novel approach with sentinel-2. Remote Sens. 12 (12), 1959. doi:10.3390/rs12121959
Chen, J., Chen, J., Liao, A., Cao, X., Chen, L., Chen, X., et al. (2015). Global land cover mapping at 30 m resolution: A POK-based operational approach. ISPRS J. Photogrammetry Remote Sens. 103, 7–27. doi:10.1016/j.isprsjprs.2014.09.002
Cortes, C., and Vapnik, V. (1995). Support-vector networks. Mach. Learn. 20 (3), 273–297. doi:10.1007/bf00994018
Costanza, R., d'Arge, R., De Groot, R., Farber, S., Grasso, M., Hannon, B., et al. (1997). The value of the world's ecosystem services and natural capital. nature 387 (6630), 253–260. doi:10.1038/387253a0
Dong, L., and Xu, M. (2018). “Dynamic changes of the alpine wetlands in Tibet, China,” in GARSS 2018 - 2018 IEEE International Geoscience and Remote Sensing Symposium, Valencia, Spain, July 2018 (IEEE), 9229–9232.
Dronova, I., Gong, P., and Wang, L. (2011). Object-based analysis and change detection of major wetland cover types and their classification uncertainty during the low water period at Poyang Lake, China. Remote Sens. Environ. 115 (12), 3220–3236. doi:10.1016/j.rse.2011.07.006
Dronova, I. (2015). Object-based image analysis in wetland research: A review. Remote Sens. 7 (5), 6380–6413. doi:10.3390/rs70506380
Duan, H., Xue, X., Wang, T., Kang, W., Liao, J., and Liu, S. (2021). Spatial and temporal differences in alpine meadow, alpine steppe and all vegetation of the Qinghai-Tibetan plateau and their responses to climate change. Remote Sens. 13 (4), 669. doi:10.3390/rs13040669
Duan, S., Fan, S., Cao, G., Liu, X., and Sun, Y. (2015). The changing features and cause analysis of the lakes in the source regions of the Yellow River from 1976 to 2014. J. Glaciol. Geocryol. 37 (3), 745–756.
Ellis, C. J., and Rochefort, L. (2006). Long-term sensitivity of a High Arctic wetland to Holocene climate change. J. Ecol. 94 (2), 441–454. doi:10.1111/j.1365-2745.2005.01085.x
Farda, N., Danoedoro, P., and Harjoko, A. (2016). Image mining in remote sensing for coastal wetlands mapping: From pixel based to object based approach. IOP Publ. 47 (1), 012002.
Finlayson, M., and Moser, M. (1991). Wetlands. International Waterfowl and Wetlands research Bureau. Oxford: Facts on File Ltd.
Forsberg, D. C. (1992). The Minnesota wetland Conservation act of 1991: Balancing public and Private interests. Wm. Mitchell L. Rev. 18, 1021.
Friedl, M. A., McIver, D. K., Hodges, J. C. F., Zhang, X. Y., Muchoney, D., Strahler, A. H., et al. (2002). Global land cover mapping from MODIS: algorithms and early results. Remote Sens. Environ. 83 (1-2), 287–302. doi:10.1016/s0034-4257(02)00078-0
Fritz, S., See, L., and Rembold, F. (2010). Comparison of global and regional land cover maps with statistical information for the agricultural domain in Africa. Int. J. Remote Sens. 31 (9), 2237–2256. doi:10.1080/01431160902946598
Gallant, A. (2015). The challenges of remote monitoring of wetlands. Remote Sens. 7 (8), 10938–10950. doi:10.3390/rs70810938
Gong, P. (2009). Assessment of GLC map accuracies using flux net location data. Progr. Nat. Sci. 19, 754–759.
Gong, P., Niu, Z., Cheng, X., Zhao, K., Zhou, D., Guo, J., et al. (2010). China’s wetland change (1990–2000) determined by remote sensing. Sci. China Earth Sci. 53 (7), 1036–1042. doi:10.1007/s11430-010-4002-3
Guo, M., Li, J., Sheng, C., Xu, J., and Wu, L. (2017). A review of wetland remote sensing. Sensors 17 (4), 777. doi:10.3390/s17040777
Hu, Z., Chen, X., Zhou, Q., Chen, D., and Li, J. (2019). Diso: A rethink of Taylor diagram. Int. J. Climatol. 39 (5), 2825–2832. doi:10.1002/joc.5972
Huang, F., Liu, X., and Wang, P. (2005). Spatial pattern of marsh landscape in the middle and lower reaches of Nenjiang River. Resour. Sci. 27 (4), 140–146.
Iwao, K., Nishida, K., Kinoshita, T., and Yamagata, Y. (2006). Validating land cover maps with Degree Confluence Project information. Geophys. Res. Lett. 33 (23), L23404. doi:10.1029/2006gl027768
Jiping, Z., Yili, Z., Linshan, L., Mingjun, D., and Xueru, Z. (2011). Identifying alpine wetlands in the Damqu River Basin in the source area of the Yangtze River using object-based classification method. J. Resour. Ecol. 2 (2), 186–192.
Jun, C., Ban, Y., and Li, S. (2014). Open access to Earth land-cover map. Nature 514 (7523), 434. doi:10.1038/514434c
Kobayashi, T., Tateishi, R., Alsaaideh, B., Sharma, R. C., Wakaizumi, T., Miyamoto, D., et al. (2017). Production of global land cover data – GLCNMO2013. J. Geogr. Geol. 9 (3), 1–17. doi:10.5539/jgg.v9n3p1
Li, F., and Jia, Y. (2008). Study on method of extracting wetland and its changed area based on Landsat TM images. Sci. Surv. Mapp. 33 (2), 147–149.
Li, J., Sheng, Y., Wu, J., Feng, Z., Ning, Z., Hu, X., et al. (2016). Landform-related permafrost characteristics in the source area of the Yellow River, eastern Qinghai-Tibet Plateau. Geomorphology 269, 104–111. doi:10.1016/j.geomorph.2016.06.024
Li, W., Liang, T., and Wang, X. (2009). “Remote sensing image extraction and precision analysis for alpine wetland based on coupling analysis of multispectral factor PCA and decision tree,” in 2009 2nd International Congress on Image and Signal Processing, Tianjin, China, October 2009 (IEEE), 1–6.
Li, W., Xue, P., Liu, C., Yan, H., Zhu, G., and Cao, Y. (2020). Monitoring and landscape dynamic analysis of alpine wetland area based on multiple algorithms: A case study of Zoige plateau. Sensors 20 (24), 7315. doi:10.3390/s20247315
Loveland, T. R., Reed, B. C., Brown, J. F., Ohlen, D. O., Zhu, Z., Yang, L., et al. (2000). Development of a global land cover characteristics database and IGBP DISCover from 1 km AVHRR data. Int. J. remote Sens. 21 (6-7), 1303–1330. doi:10.1080/014311600210191
Lu, D., Mausel, P., Batistella, M., and Moran, E. (2004). Comparison of land-cover classification methods in the Brazilian Amazon Basin. Photogramm. Eng. remote Sens. 70 (6), 723–731. doi:10.14358/pers.70.6.723
Luo, D.-L., Jin, H.-J., Du, H.-Q., Li, C., Ma, Q., Duan, S.-Q., et al. (2020). Variation of alpine lakes from 1986 to 2019 in the headwater area of the Yellow River, Tibetan plateau using Google Earth Engine. Adv. Clim. Change Res. 11 (1), 11–21. doi:10.1016/j.accre.2020.05.007
Luo, D., Jin, H., Jin, X., He, R., Li, X., Muskett, R. R., et al. (2018). Elevation-dependent thermal regime and dynamics of frozen ground in the Bayan Har Mountains, northeastern Qinghai-Tibet Plateau, southwest China. Permafr. Periglac. Process. 29 (4), 257–270. doi:10.1002/ppp.1988
Mahdavi, S., Salehi, B., Granger, J., Amani, M., Brisco, B., and Huang, W. (2018). Remote sensing for wetland classification: A comprehensive review. GIScience Remote Sens. 55 (5), 623–658. doi:10.1080/15481603.2017.1419602
Mao, D., Wang, Z., Du, B., Li, L., Tian, Y., Jia, M., et al. (2020). National wetland mapping in China: A new product resulting from object-based and hierarchical classification of Landsat 8 OLI images. ISPRS J. Photogrammetry Remote Sens. 164, 11–25. doi:10.1016/j.isprsjprs.2020.03.020
Mao, D., Wang, Z., Wu, J., Wu, B., Zeng, Y., Song, K., et al. (2018a). China's wetlands loss to urban expansion. Land Degrad. Dev. 29 (8), 2644–2657. doi:10.1002/ldr.2939
Mao, D., Wang, Z., Yang, H., Li, H., Thompson, J. R., Li, L., et al. (2018b). Impacts of climate change on Tibetan lakes: Patterns and processes. Remote Sens. 10 (3), 358. doi:10.3390/rs10030358
Meng, Q. W., Zhang, T., Liu, J. H., Hui-Jun, A. N., Hao, F., and Zou, W. T. (2007). Establishing interpretation marks of TM mage for wetland type of Western inner Mongolia. J. Inn. Mong. Agric. Univ. Sci. Ed. 28 (2), 35–40.
Mitra, S., Wassmann, R., and Vlek, P. L. (2005). An appraisal of global wetland area and its organic carbon stock. Curr. Sci. 88 (1), 25–35.
Mui, A., He, Y., and Weng, Q. (2015). An object-based approach to delineate wetlands across landscapes of varied disturbance with high spatial resolution satellite imagery. ISPRS J. Photogrammetry Remote Sens. 109, 30–46. doi:10.1016/j.isprsjprs.2015.08.005
Sader, S. A., Ahl, D., and Liou, W.-S. (1995). Accuracy of Landsat-TM and GIS rule-based methods for forest wetland classification in Maine. Remote Sens. Environ. 53 (3), 133–144. doi:10.1016/0034-4257(95)00085-f
Tian, J., Zhu, D., Wang, J., Wu, B., Hussain, M., and Liu, X. (2018). Environmental factors driving fungal distribution in freshwater lake sediments across the Headwater Region of the Yellow River, China. Sci. Rep. 8 (1), 3768. doi:10.1038/s41598-018-21995-6
Tong, L., Xu, X., Fu, Y., and Li, S. (2014). Wetland changes and their responses to climate change in the “three-river headwaters” region of China since the 1990s. Energies 7 (4), 2515–2534. doi:10.3390/en7042515
Wang, J., Zhu, Q., Yang, Y., Zhang, X., Zhang, J., Yuan, M., et al. (2020). High uncertainties detected in the wetlands distribution of the Qinghai–Tibet Plateau based on multisource data. Landsc. Ecol. Eng. 16 (1), 47–61. doi:10.1007/s11355-019-00402-w
Wang, R., He, M., and Niu, Z. (2020). Responses of alpine wetlands to climate changes on the Qinghai-Tibetan plateau based on remote sensing. Chin. Geogr. Sci. 30 (2), 189–201. doi:10.1007/s11769-020-1107-2
Wissinger, S. A., Oertli, B., and Rosset, V. (2016). Invertebrates in freshwater wetlands. Cham: Springer, 55–103.
Wu, P., Zhang, H., Cui, L., Wickings, K., Fu, S., and Wang, C. (2017). Impacts of alpine wetland degradation on the composition, diversity and trophic structure of soil nematodes on the Qinghai-Tibetan Plateau. Sci. Rep. 7 (1), 837. doi:10.1038/s41598-017-00805-5
Xue, Z., Zhang, Z., Lu, X., Zou, Y., Lu, Y., Jiang, M., et al. (2014). Predicted areas of potential distributions of alpine wetlands under different scenarios in the Qinghai-Tibetan Plateau, China. Glob. Planet. Change 123, 77–85. doi:10.1016/j.gloplacha.2014.10.012
Yin, S. B., Li, B., and Shen, F. (2014). Review on studies of wetland definition. Wetl. Sci. 12 (4), 504–514.
Zedler, J. B. (2003). Wetlands at your service: Reducing impacts of agriculture at the watershed scale. Front. Ecol. Environ. 1 (2), 65–72. doi:10.1890/1540-9295(2003)001[0065:waysri]2.0.co;2
Zhang, S., Zhou, B., Shi, F., Chen, Q., and Su, S. (2020). Study on information extraction method of alpine wetland in Qinghai-Xizang plateau based on remote sensing data of GF-1 satellite. Plateau Meteorol. 36 (6), 1309–1317.
Zhang, W., Yi, Y., Song, K., Kimball, J. S., and Lu, Q. (2016). Hydrological response of alpine wetlands to climate warming in the eastern Tibetan Plateau. Remote Sens. 8 (4), 336. doi:10.3390/rs8040336
Zhang, Y., Wang, G., and Wang, Y. (2011). Changes in alpine wetland ecosystems of the Qinghai-Tibetan plateau from 1967 to 2004. Environ. Monit. Assess. 180 (1-4), 189–199. doi:10.1007/s10661-010-1781-0
Zhang, Y., Yan, J., Cheng, X., and He, X. (2021). Wetland changes and their relation to climate change in the Pumqu Basin, Tibetan plateau. Int. J. Environ. Res. Public Health 18 (5), 2682. doi:10.3390/ijerph18052682
Zhao, K., and He, C. (2000). Influence of human activities on the mire in Zoige Plateau and countermeasure. Sci. Geogr. Sin. 20 (5), 444–449.
Zhao, Z., Zhang, Y., Liu, L., Liu, F., and Zhang, H. (2014). Advances in research on wetlands of the Tibetan Plateau. Prog. Geogr. 33 (9), 1218–1230.
Keywords: landsat 8 OLI, headwater area of the yellow river, object-oriented and decision tree, wetland extraction, alpine areas
Citation: Yin T, Feng Y, Liang S, Wang G, Yuan N, Yan D, Wu P, Kuang X and Wan L (2022) A suitable method for alpine wetland delineation: An example for the headwater area of the yellow river, Tibetan Plateau. Front. Environ. Sci. 10:1062954. doi: 10.3389/fenvs.2022.1062954
Received: 06 October 2022; Accepted: 30 November 2022;
Published: 13 December 2022.
Edited by:
Junxiang Li, Shanghai Jiao Tong University, ChinaReviewed by:
Zhiyong Liu, Sun Yat-sen University, ChinaCopyright © 2022 Yin, Feng, Liang, Wang, Yuan, Yan, Wu, Kuang and Wan. This is an open-access article distributed under the terms of the Creative Commons Attribution License (CC BY). The use, distribution or reproduction in other forums is permitted, provided the original author(s) and the copyright owner(s) are credited and that the original publication in this journal is cited, in accordance with accepted academic practice. No use, distribution or reproduction is permitted which does not comply with these terms.
*Correspondence: Yuqing Feng, ZmVuZ3lxQGVtYWlsLmN1Z2IuZWR1LmNu; Guangjun Wang, d2dqQGN1Z2IuZWR1LmNu
Disclaimer: All claims expressed in this article are solely those of the authors and do not necessarily represent those of their affiliated organizations, or those of the publisher, the editors and the reviewers. Any product that may be evaluated in this article or claim that may be made by its manufacturer is not guaranteed or endorsed by the publisher.
Research integrity at Frontiers
Learn more about the work of our research integrity team to safeguard the quality of each article we publish.