 Jianrong Cai1,2
 Zhijie Yang
 Xiuyang Jiang
95% of researchers rate our articles as excellent or good
Learn more about the work of our research integrity team to safeguard the quality of each article we publish.
Find out more
ORIGINAL RESEARCH article
Front. Environ. Sci. , 12 December 2022
Sec. Atmosphere and Climate
Volume 10 - 2022 | https://doi.org/10.3389/fenvs.2022.1061882
This article is part of the Research Topic Climate Change and Adaptive Capacity Building View all 15 articles
Introduction: Many studies in southeastern China (SEC) have used stable isotope (δD and δ18O) records from natural archives (e.g., stalagmites, tree-ring cellulose, sediments) to reconstruct past East Asian Summer Monsoon (EASM) climate. However, the interpretation of the meanings of isotope variation in these records has not been fully resolved, and the key to solve this problem is to clarify the referential meaning of modern precipitation isotopes.
Methods: In this study, we collected daily precipitation from January 2019 to December 2020 in Sanming to clarify the characteristics of isotope variations and their controlling factors during different seasonal periods [e.g., non-summer monsoon (NSM) and summer monsoon (SM)] in SEC.
Results and Discussion: Our results show that the precipitation δ18O (δ18Op) and d-excess values in the SM season (−12.94‰–0.15‰, −4.05‰–21.01‰) were more light than those in the NSM season (−6.91‰–4.37‰, 0.85‰–30.38‰). Combining the findings of backward trajectory and averaged outgoing longwave radiation analyses, the seasonal variation of precipitation isotopes is believed to be determined by a shift in water vapor sources and the intensity of upstream atmospheric convection during water vapor transportation. The consistent variation between the isotope values and convective intensity over the South China Sea in the dragon boat rainy period highlights that δ18Op has the potential to respond rapidly to the upstream convective intensity and can serve as a substitute method for investigating the complicated East Asian summer monsoon system. Therefore, the results of this study imply that the stable isotopes in precipitation and related paleoclimate proxies may not reflect the signal of temperature or precipitation alone but rather reflect changes in moisture sources and upstream convective intensity.
Stable isotope signals in modern precipitation are valuable for interpreting paleo-isotope records preserved in natural archives, such as stalagmites (Wang et al., 2001; Cheng et al., 2016; Zhang et al., 2021), tree-ring cellulose (Xu et al., 2016; Liu et al., 2017), and plant cellulose in peat bogs (Xu et al., 2002; Hong et al., 2009), which are essential for the reconstruction of past climate and hydrological cycles (Yao et al., 2013). In southeastern China (SEC), stalagmite oxygen isotope (δ18Oc) records from the E’mei and Shennong caves suggest that the regional δ18Oc record is mainly regulated by precipitation seasonality (the mean percentage of summer monsoon precipitation to non-summer precipitation) (Zhang et al., 2018a; Zhang et al., 2018b). This is mainly controlled by the El Niño–Southern Oscillation (Zhang et al., 2020). Shi et al. (2020) suggest that tree-ring cellulose δ18O records in the southeastern region can be referred to as monsoon precipitation. However, owing to the shortage of long-term observation records of modern precipitation isotopes in this region, these studies can only use monthly precipitation isotope observations from Changsha (Central China) or Hong Kong (Southern China) for comparison. Therefore, to determine stable isotope records derived from natural archives and to complement previous studies, it is necessary to study regional atmospheric precipitation isotopes and clarify the control factors.
Sanming lies in SEC and experiences first-hand the monsoon onset signal, being in the frontal region of the East Asian summer monsoon (EASM). The beginning of the EASM season is marked by the outbreak and evolution of the South China Sea summer monsoon (SCSSM), which also represents the beginning of the rainy season (Tao and Chen, 1987; Wang et al., 2004). Bounded by the onset of SCSSM, Sanming has two rainy seasons: spring persistent rain (SPR) and the dragon boat rainy (DBR) season (Liang and Wang, 1997). In spring, owing to the mechanical forcing and thermal effects of the plateau, there is a continuous precipitation period in this area (Wan et al., 2008a; Wan and Wu, 2008b). SPR amounts in this region can reach 348 mm, accounting for 21% of the total annual precipitation (Li, 2006). Zhang et al. (2020) proposed that SPR has an important effect on annual precipitation δ18O (δ18Op). However, due to the absence of long-term precipitation isotope observation records in SEC, the data are based on the monthly scale of the Changsha Global Network of Isotopes in Precipitation (GNIP) site data in central China with low resolution (Zhang et al., 2020). The use of such data to study the isotope characteristics and influencing factors during the SPR period in SEC is limited. Thus, improved knowledge of the daily δ18Op in this region is vital for a thorough interpretation of the δ18Oc record of stalagmites from SEC. With the onset of the SCSSM, this region enters a period of the SM rainy season called DBR, where rainfall can reach 527 mm, accounting for 31.8% of the total annual precipitation (Li, 2006). A better comprehension of the isotope composition of these periods of high precipitation ratios will help interpret the long-term records in this region. Therefore, standardized continuous multi-year monitoring on a daily scale is essential to gain a comprehensive understanding of the interannual and seasonal changes in precipitation stabilization isotopes in this region.
Here, we present a daily scale record of the precipitation isotope composition from 2019 to 2020 from Sanming, SEC. The purposes of this study were 1) to clarify the characteristics and seasonal changes of precipitation isotopes in Sanming, and 2) to identify the controlling factors in different periods (such as SM, NSM, SPR, and DBR) for the year. The isotope variation characteristics of precipitation, monitored here for 2 years, can aid in a better understanding of the importance of the oxygen isotope record in the paleoclimate reconstruction in SEC.
Sanming (25°30′–27°07′N, 116°22′–118°39′E) is located in the mid-west of Fujian Province in coastal SEC in the frontal area of the EASM region (Figure 1). The study area has a typically humid subtropical monsoon climate. According to historical meteorological data from 1980 to 2000, the mean annual air temperature and precipitation in Sanming are 19.5°C and 1,560 mm, respectively. As shown in Figure 1, the uneven precipitation in this area is mainly concentrated from March to June, accounting for more than 57% of the annual precipitation. Due to the absence of long-term precipitation observations in Sanming, monthly precipitation data from 1951 to 2012 at the nearest meteorological station at Yong’an, 27 km from Sanming, were used to study the regional representativeness of the annual variation characteristics of precipitation at the sampling sites. We analyzed the correlation between the monthly precipitation data in Yong’an and in other regions, which suggests that precipitation over Sanming is highly representative of the southeastern region in China (Figure 1).
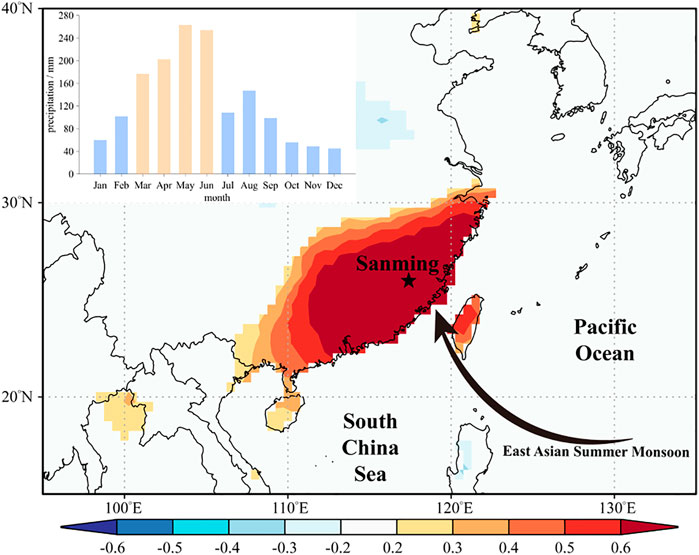
FIGURE 1. Study area and sampling stations in the SEC region. The upper left is the average monthly precipitation at Yong’an station from 1951 to 2012; the black star represents the sampling site in Sanming; background colors represent the whole year spatial correlations between the precipitation in Yong’an station and CRU TS4.05 precipitation (from 1951 to 2012, p < 0.1).
Precipitation samples were collected from a bare area in the Sanming Forest Ecosystem and Global Change Observation and Research Station (26°9′N, 117°28′E, altitude: 134 m a.s.l), from January 2019 to December 2020. Each precipitation event was sampled for isotope analysis using a ZJC-V Intelligent rainfall sampler (Supplementary Figure S1) which senses rainfall and opens a lid for collection. Rainwater flows directly into a refrigerated bottle through a water pipe, effectively preventing the evaporation of samples. After collection, each sample was poured into 20 ml and 2 ml polypropylene colorless plastic bottles with no space. These bottles were sealed with Parafilm sealing film to prevent evaporation and chilled at 4°C to prevent isotope fractionation. A total of 209 samples were collected on rainy days from 2019 to 2020.
Stable isotope composition (δ2H and δ18O) analyses were performed at the Stable Isotope Laboratory, School of Geographical Sciences, Fujian Normal University. The samples were analyzed using Picarro-L2140i cavity ring-down spectroscopy (CRDS). Three isotope standards and seven samples were examined as a group in this study. Seven samples were measured after the three standards, and each of the samples or standards was measured separately with seven injections. Taking into account the memory effect and stability of the instrument, only the final three injections were averaged and calibrated. The test findings were based on the samples’ calibrated values. Measurement calibration utilized three internal standards (δ18O: 19.13‰, −8.61‰, and −0.15‰; δ2H: 144‰, −63.4‰, and −1.7‰). The results were presented as δ-values relative to the standard Vienna Standard Mean Ocean Water (V-SMOW). The measurement accuracies were typically better than ±0.1‰ for δ18O and ±0.5‰ for δ2H.
IsoGSM is a general circulation model based on water isotope (Yoshimura et al., 2008), which is used to fill in missing data (June to July 2020) and explore the control of atmospheric processes on δ18O variability (Supplementary Table S1). IsoGSM has a time resolution of 6 h, and a horizontal resolution of 200 km, 28 vertical levels. Detailed descriptions of the model setup are available in previous studies (Yoshimura et al., 2008; Yoshimura et al., 2014; Yang et al., 2016). The monthly variations in precipitation and water vapor isotope compositions linked to synoptic weather cycles may be reasonably replicated by the IsoGSM. We first cross-compared the data from IsoGSM with observed data from Sanming station from 2019 to 2020 to confirm the reliability of the data from IsoGSM (Supplementary Figure S2). Result showed that the observed δ18Op data are consistent with the simulated δ18Op data from IsoGSM, which is a sign of good replication.
HYSPLIT was applied to locate and distinguish potential air mass source regions during the sampled rain episodes (Draxler and Hess, 1998). The model is obtained from the National Oceanic and Atmospheric Administration (NOAA) at the Air Resources Laboratory (https://ready.arl.noaa.gov/HYSPLIT.php). We set the end height for the backward trajectory model at 1500 m a.g.l. At the sampling site. The height is generally considered to be the largest water vapor transport volume and the precipitation is most likely to start (Aggarwal et al., 2004; Breitenbach et al., 2010; Wei et al., 2018). In addition, we computed the trajectories for 120 h back in time to reconstruct the original transport trajectory because it is sufficient to identify the air mass backward trajectories at the regional scale (Tao et al., 2021).
The associated meteorological data (precipitation amount, air temperature, and relative humidity) were monitored using an automatic HOBO rain gauge and a wireless temperature and humidity data logger next to the rainfall sampler, from January 2019 to December 2020. The National Climate Center provided monthly instrumental data for the Yong’an meteorological station from 1951 to 2010 (https://ncc-cma.net/cn/). To calculate the water vapor flux and analyze the relationships between regional integrated convective activity and daily precipitation stable isotope composition during the observation period, we obtained 850 hPa zonal and meridional wind components, specific humidity, and outgoing longwave radiation (OLR) data from the NOAA Physical Sciences Laboratory (https://psl.noaa.gov). KNMI Climate Explorer (https://www.knmi.nl), a web-based tool for high-resolution paleoclimatology, was used to conduct a spatial correlation test for the regional representation of the Sanming area (Trouet and Oldenborgh, 2013).
Craig (1961) first reported the regression line δ2H = 8 * δ18O + 10 as the global meteoric water line (GMWL) based on the positive connection between δ2H and δ18O found in natural meteoric waters throughout the world. With the increased establishment of GNIP program stations, numerous LMWLs have been built (Merlivat and Jouzel, 1979; Araguás-Araguás et al., 1998; Zhang et al., 2016; Wu et al., 2022). Although there are considerable geographical differences in climatic characteristics and sources of water vapor, the slope of the LMWL and GMWL are still in agreement. The correlation between daily stable precipitation isotope data at the Sanming station is defined here as the LMWL: δ2H = 8.29 * δ18O + 13.93 (R2 = 0.95, p < 0.0001, n = 209). Compared to the GMWL and the meteoric water line of China (CMWL) (δ2H = 7.9 * δ18O + 8.2, R2 = 0.98) (Zheng et al., 1983), the slope and intercept of Sanming LMWL were both higher. This is because GMWL and CMWL combine data from global or national studies that include several places with radically differing climates. The Sanming station, on the other hand, is located in a monsoon region and has a humid environment that results in a large slope and intercept. The correlation for the yearly precipitation isotopes in 2019 and 2020 was defined as δ2H = 8.44 * δ18O + 13.93 (R2 = 0.95, p < 0.0001, n = 117) and δ2H = 8.14 * δ18O + 13.94 (R2 = 0.95, p < 0.0001, n = 92), respectively (Figure 2A). The intercepts of the LMWL in 2019 and 2020 were almost consistent; however, the slope in 2020 was lower than that in 2019 which may have been due to the relative dryness and high evaporation in 2019.
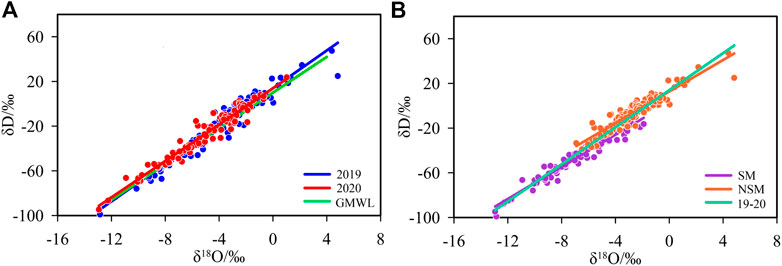
FIGURE 2. δ2H and δ18Op relationships during the daily precipitation from 2019 to 2020, (A) in different years, (B) in different seasons.
The δ18Op and δ2H data for the SM and NSM periods are shown in Figure 2B to demonstrate how the EASM affected the LMWL. The scatters are located above or near the GMWL in the SM (May-September). The NSM (October to April of the following year) scatters distribute below the GMWL. The slopes in both periods were smaller than those of the GMWL and LMWL. The slope of the LMWL in the NSM period was lower than the slope of 7.70 in the SM period, but its intercept of 14.98 was considerably higher than the intercept of 7.53 in the SM period, showing seasonal differences in the precipitation water vapor sources in this regional. Typically, the intercept and slope of the meteoric water line are positively related (Yao et al., 2018). However, in the monsoon region, because the average stable isotope value of the NSM period is more positive than that of the SM period, the scatter in the NSM waterline chart deviates from the upper right relative to the SM, resulting in a larger intercept of the LMWL during the NSM period than that during the SM period.
Figure 3 shows the temporal characteristics of daily δ18Op and d-excess (d = δ2H − 8 × δ18O, a parameter associated with the meteorological conditions of the source region (Dansgaard, 1964; Breitenbach et al., 2010) and corresponding meteorological factors, i.e., surface air temperature, relative humidity, local precipitation amount) in Sanming from 2019 to 2020. As shown in Figure 3, the daily mean temperature exhibited cyclical variations ranging from 1.3°C to 29.4°C, with an average air temperature of 19.5°C and the maximum temperature occurring in July. Relative humidity in Sanming ranged from 52.6% to 94.5%, with an average relative humidity of 75%. The daily precipitation in Sanming ranged from 0 to 157.4 mm, with the maximum and minimum monthly precipitation occurring in May or June, and November, respectively. Notably, the region receives the most abundant precipitation from March to May, accounting for 25%–50% of the annual precipitation. During the observation period, δ2H, δ18Op, and d-excess values ranged from −99.07‰ to 47.39‰, −12.94‰–4.37‰, and −4.05‰–30.38‰, with quantity-weighted means of −33.96‰, −5.72‰ (δ18Ow), and 11.77‰ (dw), respectively. We performed a correlation analysis between environmental parameters and δ18Op to explore the impact of environmental factors on precipitation isotopes. Poor correlations were found between the daily scale precipitation δ18Op and precipitation (R2 = 0.085, p < 0.0001, n = 209), temperature (R2 = 0.09, p < 0.0001, n = 209), and relative humidity (R2 = 0.02, p = 0.07, n = 209) (Supplementary Figure S3). The findings showed that on a daily scale, local environmental parameters had less impact on the seasonal variations in precipitation isotopes.
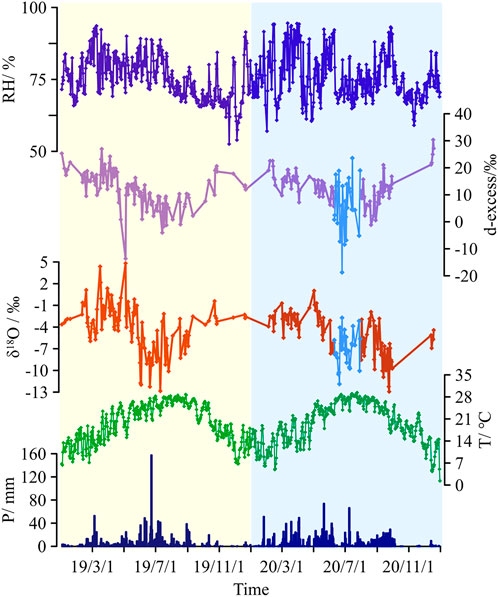
FIGURE 3. Seasonal variations of the precipitation amount, air temperature, relative humidity, δ18O, and d-excess from January 2019 to December 2020. The data for Jun-July 2020 are from IsoGSM simulations data.
The Sanming stable precipitation isotope data showed a clear seasonal variation (Figure 4A), similar to other reports globally (e.g., Xie et al., 2011; Zhou et al., 2019; Bedaso and Wu, 2020). To determine the seasonal variations in δ18Op, the year was subdivided into SM and NSM periods. The SPR period was also included in the comparison owing to its high precipitation. Specifically, the δ18Op values ranged from −12.94‰ to −0.15‰ with an average value of −7.41‰ in the SM period. In the NSM period, δ18Op values ranged from −6.91‰ to 4.37‰ with an average value of −3.50‰. In the SPR period, δ18Op values ranged from −5.72‰ to 4.37‰ with an average value of −2.08‰. In general, the δ18Op values in the SM period were lower than those in the NSM period and fluctuated widely. For both the SM and NSM periods, the δ18Op values in 2020 were lower than those in 2019, and the degree of fluctuation was relatively consistent (Figure 4A). The data distribution for the SPR period was similar to that of the NSM period, but the average value was slightly higher. Although the SPR period had higher precipitation, its δ18Op average value was still higher than that of the SM and NSM periods, which is different from the “amount effect” (Dansgaard, 1964).
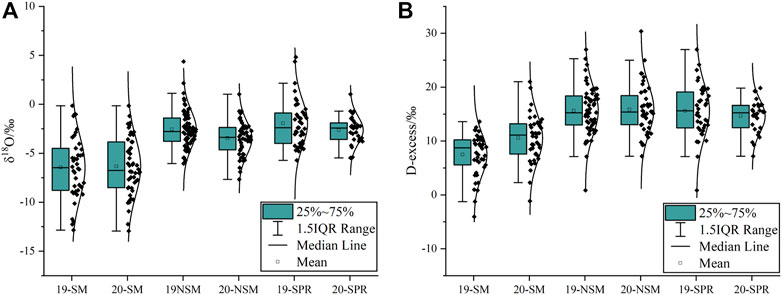
FIGURE 4. Seasonal variations of precipitation (A) δ18O, and (B) d-excess in different periods. Boxes represent the 25%–75% percentiles, and whiskers indicate the 10th and 90th percentiles. The squares stand in to represent the arithmetic mean, while the line through the box reflects the median. The distribution curves and individual data points are plotted as well.
The d-excess of precipitation had also been used to explore the seasonal variations in precipitation caused by the shift of water vapor sources in different seasons. For the d-excess value, the variation ranged from −4.05‰ to 21.01‰ with a dw value of 9.70‰ in the SM and from 0.85‰ to 30.38‰ with a dw value of 14.47‰ in the NSM. The d-excess values in the SM season were more negative than those in the NSM season, which can be attributed to the regional climatic feature. During the SM period, it is dominated by the EASM, resulting in light precipitation and negative d-excess values. While in NSM, the regional climate is controlled by westerlies and inshore air mass, the d-excess values are more positive. This finding is consistent with the results of Zhang et al. (2009), who observed that in southwest China, the water vapor generating precipitation from low-latitude oceans with high humidity has small d-excess values, whereas that from westerly or inland recirculation with low humidity has large d-values. During the SPR period, the d-excess values varied from 0.85‰ to 26.99‰ with a dw value of 8.41‰ (Figure 4B), similar to the NSM period. This similarity suggests that the source of water vapor that caused more precipitation during the SPR period was similar to the source of water vapor during the NSM period.
Sanming has a typical subtropical monsoon climate, with obvious seasonal variation in precipitation. The precipitation isotope results also showed marked seasonal variation (Figure 4). We calculated the d-excess values based on isotope data which reflected meteorological indicators in the moisture source area are less influenced by the local environment and can be used to identify the precipitation moisture sources (Dansgaard, 1964; Breitenbach et al., 2010). The consistent interannual fluctuation of the δ18Op and d-excess values during the 2-year monitoring period reveals that they are likely to be governed by transitions in water vapor sources and atmospheric circulation (Figure 3). Therefore, we used the HYSPLIT backward trajectory model to track water vapor during the SM and NSM periods. To exclude the possible influence of moisture transport on the results obtained on non-precipitation days, we excluded the trajectory and only selected water vapor on precipitation days during the study period for the simulation analysis. In addition, we calculated the water vapor flux during the observation period to compensate for the fact that HYSPLIT can only reflect the frequency of water vapor sources.
The cluster analysis results based on all backward trajectories for the SM/NSM seasons and the vertically integrated mean water vapor transport during the observation period are presented in Figures 5, 6. On a seasonal scale, water vapor flux dispersion was generally low and precipitation amounts were small during the NSM season. Moisture is usually transported by westerly winds and most of it is inland water vapor, with positive δ18Op and d-excess values. During the SM season, the amount of water vapor transported from the ocean increased, and the overall water vapor flux dispersion was more marked than that during the NSM season. The SM brings a large amount of low-latitude tropical oceanic water vapor (73.38% in total) to the Sanming region, mainly transported by the southwest water vapor channel, the SCS channel, and the northwest Pacific channel (Figure 5B). Consistent with the results in Figure 3, moisture derived from oceanic sources is relatively depleted, while the moisture associated with continental or local sources is more enriched. The δ18Ow (−3.50‰) and dw (14.47‰) values for NSM were positive, reflecting relatively short transport pathways and possible sub-cloud evaporation effects during the precipitation process (local sources) or long-distance transport associated with less pronounced rainout process (continental sources) (Figures 5A, 6A). SM has negative δ18Ow (−7.41‰) and dw (14.47‰) values, indicating that progressive rainout along long-distance transport pathways of air masses should be considered (Figures 5B, 6B). Previous studies have also found that the negative d-excess values during the summer season are associated with weak kinetic isotope fractionation over the oceanic source with warm and humid conditions, whereas the cold and dry air masses from both continental and local sources cause high d-excess values in autumn and winter (Liu et al., 2008; Li et al., 2020). Our results (Figures 3, 5, 6) are consistent with these findings and suggest that moisture sources play a significant role in explaining the observed seasonal variation in δ18Op. Notably, there is no single source of water vapor on a seasonal scale, with various water vapor mixing and dominating by turns occurring at different periods (Li et al., 2020; Guo et al., 2021). Therefore, due to the seasonal variation in precipitation isotopes in the region, the paleoclimate δ18O records of this region may be able to reflect the strength of EASM in the region.
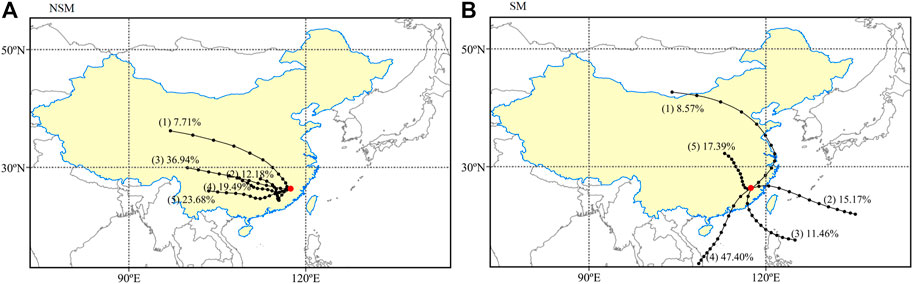
FIGURE 5. HYSPLIT4 moisture back-trajectory at Sanming from 2019 to 2020, (A) in NSM and (B) in SM. The number in parentheses represents the cluster number and the percentage of this trajectory. The red dots represent the sampling points.
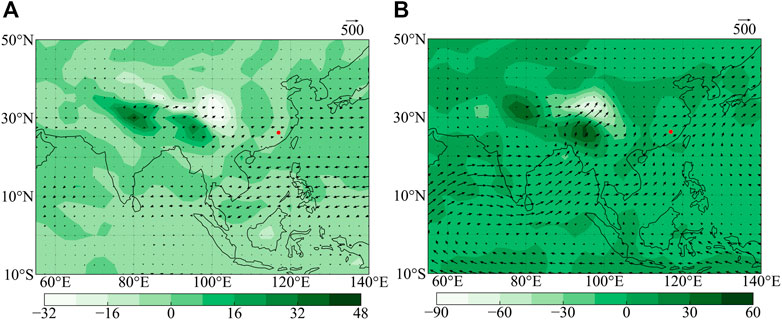
FIGURE 6. Vertically integrated mean water vapor transport from 2019 to 2020, (A) in NSM and (B) in SM. The red dots represent the sampling points.
SPR is the “early summer rainy season” that occurs from SEC (south of 30 N and east of 110 E) to southern Japan from 13 to 27 pentad (early March to mid-May) (Ding, 1992; Tian and Yasunari, 1998; Wan and Wu, 2008b). To further investigate the main controlling factors of precipitation stable isotopes during the SPR period, we show the backward trajectory analysis, water vapor flux field, and average OLR during the SPR period in Figure 7. In terms of backward trajectory analysis, water vapor sources are mainly divided into two categories: inland and offshore water vapor (Figures 7A, B). Although the precipitation amount was large during the SPR period, the δ18Op value was still relatively positive and different from that in the SM season (Figure 4). Evidently, the shift in moisture sources is not the dominant factor in the precipitation isotope composition change during the SPR period. As shown in Figure 7C, the relatively high average OLR values in the surrounding ocean indicate weaker convection activity and shorter water vapor transport pathways during this period. Suppressed convective activity at the water vapor source and transport trajectory weaken the rain rainout effect of water vapor (Cai and Tian, 2016), which leads to positive δ18Op values at the sampling site. Whether the SPR period represents the onset of the EASM has long been debated. Previous studies have found that SPR is a portion of the summer monsoon rainfall, which is a signal of the establishment of the East Asian subtropical monsoon (i.e., a part of the EASM) (Ding et al., 1994; He et al., 2008). Other studies have argued that SPR is an extension of winter atmospheric circulation caused by increased southwest wind speed on the southern side of the Tibetan Plateau (Tian and Yasunari, 1998; Wan et al., 2008a). Combined with the previous results, we suggest that SPR should be considered as part of the NSM season based on the positive value of δ18Op.
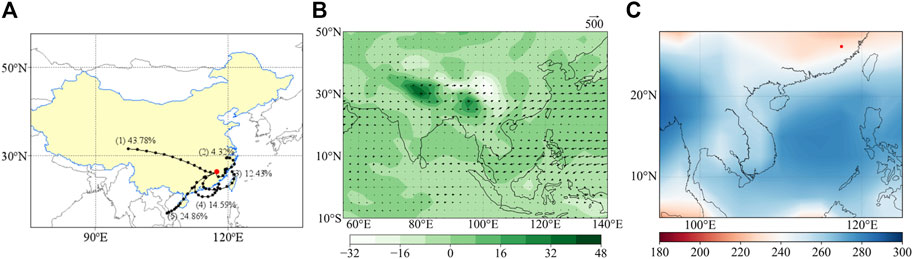
FIGURE 7. HYSPLIT4 moisture back-trajectory (A), vertically integrated mean water vapor transport (B), and averaged OLR (C) in SPR during 2019-2020. The red dots represent the sampling points.
As shown in Figure 3, there is a dramatic and sustained depletion of δ18Op from May to June, which coincides with the dates of DBR precipitation (i.e., a time that occurs during the dragon boat race from late May to mid-June). DBR is associated with the alternation of winter and summer monsoons (Wu et al., 2017) and is usually considered the beginning of the SCSSM, which always accompanies the end of the SPR period. Therefore, to explore the possible relationship between the SCSSM and δ18Op in DBR precipitation in Sanming, a comparative analysis of the OLR [suggestive of strong convection (Yang et al., 2017)] was conducted in the SCS from mid-April to early June (Figure 8).
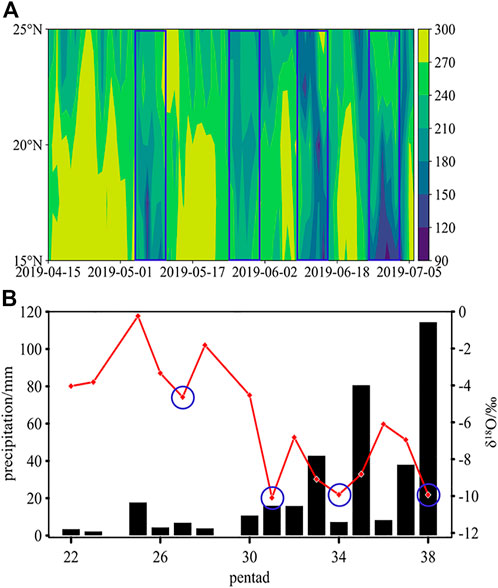
FIGURE 8. (A) Latitude-time cross-section of OLR along 115°E. The vertically blue rectangles indicate the relatively low OLR value. (B) Time series of pentad averaged δ18Op of precipitation events. The blue circles represent the relative negative δ18Op value.
As shown in Figure 8, the bias of δ18Op was not steep and had many fluctuations, and the OLR had multiple variations during the DBR period. According to Yang et al. (2017) observed that the summer monsoon is featured by intermittent activity on the synoptic scale. In addition, previous studies have reported a negative correlation between δ18Op and monsoon intensity (Tian et al., 2001; Vuille et al., 2005). It is worth noting that the small decreases in each fluctuation correspond roughly to the occurrence of low OLR values, whereas the timing of the slight decrease does not coincide with the timing of the OLR lows (Figure 8). More specifically, there are four decreases in δ18Op in the 26th, 30th, 33rd, and 38th pentads, while the OLR lows occurred on May 7 (26th pentad), 26 (30th pentad), June 8 (32nd pentad), and June 29 (36th pentad). This consistent lag further indicated that the δ18Op values in the Sanming region reflect the convection situation in the SCS promptly and can provide a good indication of the timing and process of SM onset. This result also highlights the potential of the precipitation isotope composition to capture atmospheric circulation signals.
With the gradual onset of the SCSSM, the isotope values gradually become negative and maintain this level with an average δ18Ow value of −7.41‰ (Figure 3). During the SM period, water vapor from the ocean is the primary source of SM precipitation in the Sanming area, which causes negative precipitation δ18Op values. Recently, many studies have emphasized the critical role of large-scale deep convective activity in the upstream regions. More specifically, the upstream rainout and convection activities along air mass trajectories can deplete the heavy isotopes in water vapor, which explains the isotope seasonal variability at downstream sites (Risi et al., 2008; Crawford et al., 2013; Aggarwal et al., 2016; Zwart et al., 2016; Ansari et al., 2020). Therefore, we analyzed the large-scale atmospheric convection intensity, as measured by the average OLR in the SM (Figure 9). The relatively low average OLR values around the water vapor source during the SM period indicated that the atmospheric convective intensity along the water vapor transport path was frequent and intense (Figure 9). Therefore, the strong convective activity of water vapor increases the depleting effect in the moisture source and along the transport pathway, resulting in negative δ18Op values in the Sanming area (Lee and Fung, 2008; Risi et al., 2008; Cai et al., 2017; Ruan et al., 2019; Zhou et al., 2019), which is similar to the results shown in Figure 3. These observations further verify that, although the transfer of moisture sources has a non-negligible effect on the precipitation isotope composition in the SM and NSM seasons, the convective processes on the water vapor sources and transport pathways also play an essential role in the changes in precipitation isotope composition.
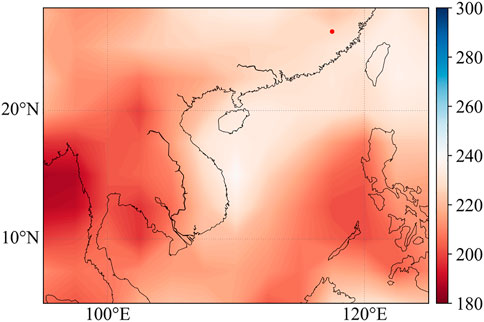
FIGURE 9. Regional averaged OLR in SM during 2019-2020. Red dots donate the location of Sanming.
In this study, we exhibit a 2-year detailed description of the precipitation isotope characteristics from 2019 to 2020 in Sanming, SEC. The HYSPLIT backward trajectory model and OLR analysis were used to clarify the basic features and seasonal variability in precipitation isotopes in Sanming. The LMWL was developed as δ2H = 8.29 * δ18O + 13.93 (R2 = 0.95, p < 0.0001, n = 209), and seasonal changes in δ18Op and d-excess in this study area were observed. The δ18Op and d-excess values in the SM season (−12.94‰–0.15‰, −4.05‰–21.01‰) were more negative than those in the NSM season (−6.91‰–4.37‰, 0.85‰–30.38‰). The backward trajectory and OLR analyses also show seasonal variations, with moisture during the SM period mainly coming from remote seas with high convective activity, while westerly and inland local water vapor with weak convective activity contributes to the NSM period. The above results suggest that the seasonal variation in precipitation isotopes is related to the conversion of water vapor sources and the intensity of convective activity in the process of water vapor transportation. SPR is a particular period of the NSM season with higher precipitation, and the primary water vapor sources are the western and offshore oceans. More importantly, owing to the high percentage of precipitation throughout the year, the SPR influence should be considered more in the annual isotope composition. The isotope values showed a sharp decreasing pattern during the DBR period and corresponded well to the convective intensity over the SCS, highlighting the potential of δ18Op as a substitute method for investigating the complicated Asian monsoon system. Our results highlight that the stable isotopes in precipitation and related paleoclimate proxies are primarily influenced by moisture sources and large-scale upstream convective activities, rather than local environmental factors.
The original contributions presented in the study are included in the article/Supplementary Material, further inquiries can be directed to the corresponding author.
All authors listed have made a substantial, direct, and intellectual contribution to the work and approved it for publication.
This study was jointly supported by grants of the National Natural Science Foundation of China (42071106).
The authors declare that the research was conducted in the absence of any commercial or financial relationships that could be construed as a potential conflict of interest.
All claims expressed in this article are solely those of the authors and do not necessarily represent those of their affiliated organizations, or those of the publisher, the editors and the reviewers. Any product that may be evaluated in this article, or claim that may be made by its manufacturer, is not guaranteed or endorsed by the publisher.
The Supplementary Material for this article can be found online at: https://www.frontiersin.org/articles/10.3389/fenvs.2022.1061882/full#supplementary-material
Aggarwal, P. K., Fröhlich, K., Kulkarni, K. M., and Gourcy, L. L. (2004). Stable isotope evidence for moisture sources in the Asian summer monsoon under present and past climate regimes. Geophys. Res. Lett. 31 (8), L08203. doi:10.1029/2004GL019911
Aggarwal, P. K., Romatschke, U., Araguas-Araguas, L., Belachew, D., Longstaffe, F. J., Berg, P., et al. (2016). Proportions of convective and stratiform precipitation revealed in water isotope ratios. Nat. Geosci. 9 (8), 624–629. doi:10.1038/ngeo2739
Ansari, M. A., Noble, J., Deodhar, A., and Saravana Kumar, U. (2020). Atmospheric factors controlling the stable isotopes (δ18O and δ2H) of the Indian summer monsoon precipitation in a drying region of Eastern India. J. Hydrol. X. 584, 124636. doi:10.1016/j.jhydrol.2020.124636
Araguás-Araguás, L., Froehlich, K., and Rozanski, K. (1998). Stable isotope composition of precipitation over southeast Asia. J. Geophys. Res. 103 (D22), 28721–28742. doi:10.1029/98jd02582
Bedaso, Z., and Wu, S. (2020). Daily precipitation isotope variation in Midwestern United States: Implication for hydroclimate and moisture source. Sci. Total Environ. 713, 136631. doi:10.1016/j.scitotenv.2020.136631
Breitenbach, S. F. M., Adkins, J. F., Meyer, H., Marwan, N., Kumar, K. K., and Haug, G. H. (2010). Strong influence of water vapor source dynamics on stable isotopes in precipitation observed in Southern Meghalaya, NE India. Earth Planet. Sci. Lett. 292 (1), 212–220. doi:10.1016/j.epsl.2010.01.038
Cai, Z., and Tian, L. (2016). Atmospheric controls on seasonal and interannual variations in the precipitation isotope in the East Asian monsoon region. J. Clim. 29 (4), 1339–1352. doi:10.1175/jcli-d-15-0363.1
Cai, Z., Tian, L., and Bowen, G. J. (2017). ENSO variability reflected in precipitation oxygen isotopes across the Asian Summer Monsoon region. Earth Planet. Sci. Lett. 475, 25–33. doi:10.1016/j.epsl.2017.06.035
Cheng, H., Edwards, R. L., Sinha, A., Spötl, C., Yi, L., Chen, S., et al. (2016). The Asian monsoon over the past 640, 000 years and ice age terminations. Nature 534 (7609), 640–646. doi:10.1038/nature18591
Craig, H. (1961). Isotopic variations in meteoric waters. Science 133 (3465), 1702–1703. doi:10.1126/science.133.3465.1702
Crawford, J., Hughes, C. E., and Parkes, S. D. (2013). Is the isotopic composition of event based precipitation driven by moisture source or synoptic scale weather in the Sydney Basin, Australia? J. Hydrol. X. 507, 213–226. doi:10.1016/j.jhydrol.2013.10.031
Dansgaard, W. (1964). Stable isotopes in precipitation. Tellus 16 (4), 436–468. doi:10.3402/tellusa.v16i4.8993
Ding, Y., Chen, L., and Murakami, M. (1994). The East asian monsoon. Beijing: China Meteorological Press.
Ding, Y. (1992). Summer monsoon rainfalls in China. J. Meteorological Soc. Jpn. 70 (1B), 373–396. doi:10.2151/jmsj1965.70.1B_373
Draxler, R., and Hess, G. (1998). An overview of the HYSPLIT_4 modeling system for trajectories, dispersion, and deposition. Aust. Meteorol. Mag. 47, 295–308.
Guo, X., Gong, X., Shi, J., Guo, J., Domínguez-Villar, D., Lin, Y., et al. (2021). Temporal variations and evaporation control effect of the stable isotope composition of precipitation in the subtropical monsoon climate region, Southwest China. J. Hydrol. X. 599, 126278. doi:10.1016/j.jhydrol.2021.126278
He, J., Zhao, P., Zhu, C., Zhang, R., Tang, X., Chen, L., et al. (2008). Discussion of some problems as to the East Asian subtropical monsoon. J. Meteorol. Res.-PRC. 22, 419–434.
Hong, B., Liu, C., Lin, Q., Yasuyuki, S., Leng, X., Wang, Y., et al. (2009). Temperature evolution from the δ18O record of Hani peat, Northeast China, in the last 14000 years. Sci. China Ser. D-Earth. Sci. 52 (7), 952–964. doi:10.1007/s11430-009-0086-z
Lee, J.-E., and Fung, I. (2008). Amount effect” of water isotopes and quantitative analysis of post-condensation processes. Hydrol. Process. 22 (1), 1–8. doi:10.1002/hyp.6637
Li, L. (2006). Preliminary analysis on the regularity and cause of precipitation anomaly in rainy season in Fujian province (in Chinese). Nanjing, China: Nanjing University of Information Science and Technology. doi:10.7666/d.y868475
Li, Y., An, W., Pang, H., Wu, S., Tang, Y., Zhang, W., et al. (2020). Variations of stable isotopic composition in atmospheric water vapor and their controlling factors—a 6-year continuous sampling study in nanjing, eastern China. J. Geophys. Res. Atmos. 125 (22). doi:10.1029/2019jd031697
Liang, J., and Wang, Y. (1997). Characters of precipitation change in rainy seasons (May∼June) in the last hundred years in coastal Fujian (in Chinese). J. Oceanocraphy Taiwan Strait 16 (04), 415–419.
Liu, Y., Cobb, K. M., Song, H., Li, Q., Li, C., Nakatsuka, T., et al. (2017). Recent enhancement of central Pacific El Niño variability relative to last eight centuries. Nat. Commun. 8, 15386. doi:10.1038/ncomms15386
Liu, Z., Tian, L., Yao, T., and Yu, W. (2008). Seasonal deuterium excess in nagqu precipitation: Influence of moisture transport and recycling in the middle of Tibetan plateau. Environ. Geol. 55 (7), 1501–1506. doi:10.1007/s00254-007-1100-4
Merlivat, L., and Jouzel, J. (1979). Global climatic interpretation of the deuterium-oxygen 18 relationship for precipitation. J. Geophys. Res. 84 (C8), 5029–5033. doi:10.1029/JC084iC08p05029
Risi, C., Bony, S., and Vimeux, F. (2008). Influence of convective processes on the isotopic composition (δ18O and δD) of precipitation and water vapor in the tropics: 2. Physical interpretation of the amount effect. J. Geophys. Res. 113 (D19), D19306. doi:10.1029/2008jd009943
Ruan, J., Zhang, H., Cai, Z., Yang, X., and Yin, J. (2019). Regional controls on daily to interannual variations of precipitation isotope ratios in Southeast China: Implications for paleomonsoon reconstruction. Earth Planet. Sci. Lett. 527, 115794. doi:10.1016/j.epsl.2019.115794
Shi, S., Shi, J., Xu, C., Leavitt, S. W., Wright, W. E., Cai, Z., et al. (2020). Tree-ring δ18O from Southeast China reveals monsoon precipitation and ENSO variability. Palaeogeogr. Palaeoclimatol. Palaeoecol. 558, 109954. doi:10.1016/j.palaeo.2020.109954
Tao, S., and Chen, L. (1987). “A review of recent research on the East Asian summer monsoon in China,” in Monsoon Meteorology. Editors C.-P. Chang, and T. N. Krishnamurti (Oxford University Press), 60–92.
Tao, S., Zhang, X., Pan, G., Xu, J., and Zeng, Z. (2021). Moisture source identification based on the seasonal isotope variation of precipitation in the Poyang Lake Wetland, China. J. Hydrology Regional Stud. 37, 100892. doi:10.1016/j.ejrh.2021.100892
Tian, L., Masson-Delmotte, V., Stievenard, M., Yao, T., and Jouzel, J. (2001). Tibetan Plateau summer monsoon northward extent revealed by measurements of water stable isotopes. J. Geophys. Res. 106 (D22), 28081–28088. doi:10.1029/2001JD900186
Tian, S.-F., and Yasunari, T. (1998). Climatological aspects and mechanism of spring persistent rains over central China. J. Meteorological Soc. Jpn. 76 (1), 57–71. doi:10.2151/jmsj1965.76.1_57
Trouet, V., and Oldenborgh, G. J. (2013). KNMI climate explorer: A web-based research tool for high-resolution paleoclimatology. Tree. Ring. Res. 69 (1), 3–13. doi:10.3959/1536-1098-69.1.3
Vuille, M., Werner, M., Bradley, R. S., and Keimig, F. (2005). Stable isotopes in precipitation in the Asian monsoon region. J. Geophys. Res. 110 (D23), D23108. doi:10.1029/2005JD006022
Wan, R., Wang, T., and Wu, G. (2008a). Temporal variations of the spring persistent rains and SCS subtropical high and their correlations to the circulation and precipitation of the East Asia summer monsoon (in Chinese). Acta. Meteorol. Sin. 66 (05), 800–807. doi:10.11676/qxxb2008.073
Wan, R., and Wu, G. (2008b). Temporal and spatial distribution of the spring persistent rains over southeastern China (in Chinese). Acta. Meteorol. Sin. 66 (03), 310–319. doi:10.11676/qxxb2008.029
Wang, B., LinHoZhang, Y., and Lu, M. (2004). Definition of south China Sea Monsoon onset and commencement of the East asia summer monsoon. J. Clim. 17 (4), 699–710. doi:10.1175/2932.1
Wang, Y., Cheng, H., Edwards, R. L., An, Z., Wu, J., Shen, C. C., et al. (2001). A high-resolution absolute-dated late pleistocene monsoon record from hulu cave, China. Science 294 (5550), 2345–2348. doi:10.1126/science.1064618
Wei, Z., Lee, X., Liu, Z., Seeboonruang, U., Koike, M., and Yoshimura, K. (2018). Influences of large-scale convection and moisture source on monthly precipitation isotope ratios observed in Thailand, Southeast Asia. Earth Planet. Sci. Lett. 488, 181–192. doi:10.1016/j.epsl.2018.02.015
Wu, H., Fu, C., Zhang, C., Zhang, J., Wei, Z., and Zhang, X. (2022). Temporal variations of stable isotopes in precipitation from Yungui Plateau: Insights from moisture source and rainout effect. J. Hydrometeorol. 23 (1), 39–51. doi:10.1175/JHM-D-21-0098.1
Wu, H., Li, C., and Wang, D. (2017). Analysis on characteristics and abnormal causes of Dragon-Boat precipitation in Guangdong in the past 55 years (in Chinese). J. Trop. Meteorology 33 (5), 608–616. doi:10.16032/j.issn.1004-4965.2017.05.004
Xie, L., Wei, G., Deng, W., and Zhao, X. (2011). Daily δ18O and δD of precipitations from 2007 to 2009 in Guangzhou, South China: Implications for changes of moisture sources. J. Hydrol. X. 400 (3-4), 477–489. doi:10.1016/j.jhydrol.2011.02.002
Xu, C., Ge, J., Nakatsuka, T., Yi, L., Zheng, H., and Sano, M. (2016). Potential utility of tree ring δ18O series for reconstructing precipitation records from the lower reaches of the Yangtze River, southeast China. J. Geophys. Res. Atmos. 121 (8), 3954–3968. doi:10.1002/2015JD023610
Xu, H., Hong, Y., Lin, Q., Hong, B., Jiang, H., and Zhu, Y. (2002). Temperature variations in the past 6000 years inferred from δ18O of peat cellulose from Hongyuan, China. Chin. Sci. Bull. 47 (15), 1578–1584. doi:10.1360/02tb9347
Yang, H., Johnson, K. R., Griffiths, M. L., and Yoshimura, K. (2016). Interannual controls on oxygen isotope variability in Asian monsoon precipitation and implications for paleoclimate reconstructions. J. Geophys. Res. Atmos. 121 (14), 8410–8428. doi:10.1002/2015JD024683
Yang, X., Davis, M. E., Acharya, S., and Yao, T. (2017). Asian monsoon variations revealed from stable isotopes in precipitation. Clim. Dyn. 51 (5-6), 2267–2283. doi:10.1007/s00382-017-4011-4
Yao, T., Masson-Delmotte, V., Gao, J., Yu, W., Yang, X., Risi, C., et al. (2013). A review of climatic controls on δ18O in precipitation over the Tibetan Plateau: Observations and simulations. Rev. Geophys. 51 (4), 525–548. doi:10.1002/rog.20023
Yao, T., Zhang, X., Guan, H., Zhou, H., Hua, M., and Wang, X. (2018). Climatic and environmental controls on stable isotopes in atmospheric water vapor near the surface observed in Changsha, China. Atmos. Environ. X. 189, 252–263. doi:10.1016/j.atmosenv.2018.07.008
Yoshimura, K., Kanamitsu, M., Noone, D., and Oki, T. (2008). Historical isotope simulation using Reanalysis atmospheric data. J. Geophys. Res. 113 (D19), D19108. doi:10.1029/2008JD010074
Yoshimura, K., Miyoshi, T., and Kanamitsu, M. (2014). Observation system simulation experiments using water vapor isotope information. J. Geophys. Res. Atmos. 119 (13), 7842–7862. doi:10.1002/2014JD021662
Zhang, H., Cheng, H., Cai, Y., Spötl, C., Kathayat, G., Sinha, A., et al. (2018a). Hydroclimatic variations in southeastern China during the 4.2 ka event reflected by stalagmite records. Clim. Past. 14 (11), 1805–1817. doi:10.5194/cp-14-1805-2018
Zhang, H., Cheng, H., Cai, Y., Spötl, C., Sinha, A., Kathayat, G., et al. (2020). Effect of precipitation seasonality on annual oxygen isotopic composition in the area of spring persistent rain in southeastern China and its paleoclimatic implication. Clim. Past. 16 (1), 211–225. doi:10.5194/cp-16-211-2020
Zhang, H., Cheng, H., Spotl, C., Cai, Y., Sinha, A., Tan, L., et al. (2018b). A 200-year annually laminated stalagmite record of precipitation seasonality in southeastern China and its linkages to ENSO and PDO. Sci. Rep. 8 (1), 12344. doi:10.1038/s41598-018-30112-6
Zhang, X., Guan, H., Zhang, X., Zhang, W., and Yao, T. (2016). Numerical experiments on the impacts of surface evaporation and fractionation factors on stable isotopes in precipitation. Asia. Pac. J. Atmos. Sci. 52 (3), 327–339. doi:10.1007/s13143-016-0008-x
Zhang, X., Liu, J., Kazuki, M., Xie, Z., Chen, S., Song, Z., et al. (2009). Ras dependent paracrine secretion of osteopontin by Nf1+/- osteoblasts promote osteoclast activation in a neurofibromatosis type I murine model. Pediatr. Res. 31 (04), 613–618. doi:10.1203/PDR.0b013e3181a1c607
Zhang, X., Qiu, W., Jiang, X., Hu, H.-M., Xiao, H., Cai, B., et al. (2021). Three-phase structure of the East asia summer monsoon during heinrich stadial 4 recorded in xianyun cave, southeastern China. Quat. Sci. Rev. 274, 107267. doi:10.1016/j.quascirev.2021.107267
Zheng, S., Hou, F., and Ni, B. (1983). The investigation of hydrogen and oxygen isotopes of precipitation in China (in Chinese). Chin. Sci. Bull. 28 (3), 801–806. doi:10.1360/csb1983-28-13-801
Zhou, H., Zhang, X., Yao, T., Hua, M., Wang, X., Rao, Z., et al. (2019). Variation of δ18O in precipitation and its response to upstream atmospheric convection and rainout: A case study of Changsha station, south-central China. Sci. Total Environ. 659, 1199–1208. doi:10.1016/j.scitotenv.2018.12.396
Keywords: precipitation, stable isotopes, seasonal variation, upstream convective intensity, southeastern China
Citation: Cai J, Yang Y, Yang Z, Qiu W and Jiang X (2022) Isotope composition of daily precipitation from 2019 to 2020 in Sanming, southeastern China. Front. Environ. Sci. 10:1061882. doi: 10.3389/fenvs.2022.1061882
Received: 05 October 2022; Accepted: 30 November 2022;
Published: 12 December 2022.
Edited by:
Junyu Qi, University of Maryland, College Park, United StatesReviewed by:
T. P. Sabin, Indian Institute of Tropical Meteorology (IITM), IndiaCopyright © 2022 Cai, Yang, Yang, Qiu and Jiang. This is an open-access article distributed under the terms of the Creative Commons Attribution License (CC BY). The use, distribution or reproduction in other forums is permitted, provided the original author(s) and the copyright owner(s) are credited and that the original publication in this journal is cited, in accordance with accepted academic practice. No use, distribution or reproduction is permitted which does not comply with these terms.
*Correspondence: Xiuyang Jiang, eHlqaWFuZ0Bmam51LmVkdS5jbg==
Disclaimer: All claims expressed in this article are solely those of the authors and do not necessarily represent those of their affiliated organizations, or those of the publisher, the editors and the reviewers. Any product that may be evaluated in this article or claim that may be made by its manufacturer is not guaranteed or endorsed by the publisher.
Research integrity at Frontiers
Learn more about the work of our research integrity team to safeguard the quality of each article we publish.