 Hui Zhang
 Dao-Lin Zhu1,2*
 Yuanjie Zhang
- 1College of Land Science and Technology, China Agricultural University, Beijing, China
- 2Center for Land Policy and Law, Beijing, China
The fairness of the utilization of cultivated land resources is essential for the balanced development of the region, but there are few researches to analyze it. Against the background of the urgent need for farmland protection and ecological compensation, this paper takes cultivated land as the research object and uses a three-dimensional ecological footprint model to account for and analyze the utilization of natural capital stock and flow of cultivated land in Beijing-Tianjin-Hebei region from 2009 to 2016 in terms of footprint breadth and depth, so as to provide reference for cultivated land protection, ecological compensation and even coordinated regional ecological-economic development. The results show that from 2009 to 2016, the ecological footprint breadth of cultivated land in Beijing-Tianjin-Hebei region was generally low and the footprint depth was generally high, and the ecological footprint depth of cultivated land in the region as a whole tended to increase, except for Zhangjiakou and Chengde, which were able to achieve self-sufficiency in flow capital, 85% of the cities showed the phenomenon of depletion of cultivated land flow capital and intensification of stock capital depletion. After 2010, the overall Gini coefficient of the ecological footprint of cultivated land in the Beijing-Tianjin-Hebei area was less than 0.4, and the use of natural capital from cultivated land was relatively balanced. The study concludes that under the strategic role of Beijing-Tianjin-Hebei integration and collaborative development, the equity of natural capital utilization of cultivated land in each city in the Beijing-Tianjin-Hebei region has been improved, but the level of creating and utilizing natural capital flows of cultivated land still needs to be improved, and ecological protection of cultivated land needs to be further strengthened; the excessive depletion of natural capital of cultivated land caused by agricultural production can be used as a reference basis for cross-regional ecological compensation of cultivated land, thus supporting the ecological value of cultivated land. Over-consumption of natural capital from agricultural land caused by agricultural production can be used as a baseline for interregional ecological compensation of agricultural land, thus supporting the realization of the ecological value of agricultural land.
1 Introduction
With the increasing development of social economy and rapid urban expansion, the problems of resource consumption, environmental pollution and ecological damage have become more and more prominent, and how to establish a sustainable human-land relationship and green economic development model has become a common concern of academia and society. (Chiritescu et al., 2013; Yang J. et al., 2019; Ouyang et al., 2020; Wang et al., 2020; Shmelev and Brook, 2021; Yang et al., 2021; Wang S. et al., 2022; Wang S. H. et al., 2022). As a key concept to measure sustainable development, natural capital has gradually attracted the attention of scholars (Fang, 2015; Yang and Hu, 2018; Fisher et al., 2021; Wu et al., 2021). Natural capital, refers to the stock of natural resources and environmental assets that can provide useful products or services in the present or the future, including cultivated land, forest, water, wetland and other ecosystems, ecological diversity and ecosystem services (Daly Herman, 1996; Costanza et al., 1997). The stability of regional natural capital stock is an important criterion for evaluating the sustainable development of a region, and the stock of natural capital in a region plays a fundamental role in supporting the life of the people and economic development of that place.
As an important component of natural capital, cultivated land is closely related to food security, social stability and ecosystem balance. Its utilization level is an important basis for formulating regional development strategy and planning. In December 2020, President Xi Jinping emphasized at the Central Rural Work Conference that “we should strictly guard the red line of 1.8 billion mu of cultivated land, take long and hard measures to implement the strictest cultivated land protection system”, which has put forward higher requirements for the protection of cultivated land in China and also reflects the urgent need to carry out cultivated land resource accounting. In recent years, studies on the use of cultivated land have been quite rich and mostly focused on the utilization efficiency and carrying capacity of cultivated land (He et al., 2011; Wang and Li, 2014; Chen et al., 2019; Han and Zhang, 2020). And ecological footprint model is more and more used to analyze the utilization of natural capital of cultivated land because of its intuitive and concise characteristics (Shi et al., 2013; Qian et al., 2018; Wang et al., 2018).
The ecological footprint is a method of accounting for the physical amount of natural capital, which converts the natural capital provided by ecosystems into the geographical space with ecological functions and biological productivity, also called “ecological occupation” (Wackernagel and Rees, 1998; Rees, 2018). This method can achieve an unified description of all kinds of natural capital, and with the introducing of equilibrium factors and yield factors, the accumulation and comparative analysis of all kinds of natural capital in each region can be carried out (Fang and Heijungs, 2012; Shi D, 2016; Jin and Liu, 2017; Hong et al., 2020). However, as the research progresses, the traditional two-dimensional ecological footprint cannot meet the needs of structural analysis of natural capital stock and flow, and cannot reflect intergenerational human consumption of arable land, so the ecological footprint model begins to move from two-dimensional to three-dimensional. The three-dimensional ecological footprint model is based on the two-dimensional ecological footprint model, which introduces the footprint depth and footprint breadth to measure the total ecological footprint (Niccolucci et al., 2009; Fang and Heijungs, 2012; Fang, 2013). The introduction of these two indicators not only overcomes the shortcomings of the traditional model that pays insufficient attention to the natural capital stock, but also enhances the comparability of ecological carrying capacity between different periods and regions. Moreover, although the three-dimensional ecological footprint model does not account for the physical quantity and value of natural capital directly, it can reflect the utilization and structural characteristics of natural capital stock and flow from the side, which meet the needs of natural capital analysis. In addition, compared with the absolute value analysis of the two-dimensional model, the relative and comprehensive values derived from the three-dimensional ecological footprint model, such as stock-flow utilization ratio, flow occupancy rate, “scissors differential”, Gini coefficient of ecological footprint, etc., are more advantageous for in-depth analysis of the dynamics of ecology-economy relationship. Therefore, the three-dimensional ecological footprint model has been highly concerned and widely used in domestic and international academic circles (Fang and Li, 2012; Fang, 2013; Fang, 2015; Du et al., 2016; Ma et al., 2017; Yang and Hu, 2018; Wu et al., 2021). For natural capital accounting of cultivated land, it is necessary to pay attention to both the annual renewable resource and service flows, for example, the main agricultural products supply and ecological functions of cultivated land; and the stock consumption status, such as the area and capability of cultivated land. Thus, three-dimensional ecological footprint model has also been applied to the research of cultivated land use nowadays. For example, Jin et al. analyzed the utilization and ecological carrying capacity of cultivated land natural capital in Jiangsu Province by comparing the closed environment and the open environment, and found that the occupation of cultivated land natural capital in Jiangsu Province changed from the consumption stock to the consumption flow, and the sustainable utilization level of cultivated land was improved (Jin et al., 2020). Some research combine the improved ecological footprint model with the multi-objective programming model to analyze the sustainability of cultivated land under different use scenarios (Li et al., 2020). However, these studies mainly focus on the description of the ecological carrying capacity of cultivated land, which is weakly related to policy making. In addition, some scholars have introduced three-dimensional ecological footprint model into ecological compensation of cultivated land (Su et al., 2014; Yang X. et al., 2019; Qian et al., 2022), but most of the research focuses on the amount of cultivated land ecological compensation, and there are few analyses from the perspective of fairness.
The Beijing-Tianjin-Hebei region is one of the three major urban agglomerations in China and an important carrier of the national regional coordinated development strategy. The Beijing-Tianjin-Hebei region has a dense population and is faced with serious resource shortage, ecological environment deterioration and unbalanced development, the gap between the economic and social development of Hebei and Beijing and Tianjin is known as a phenomenon called “black under the lamp”. In terms of cultivated land, Beijing-Tianjin-Hebei region land use type is given priority to with farmland, but cultivated land for the middle-and-low-yielding fields, and the Beijing and Tianjin per capita cultivated land resources is far below the national average, and its huge economic size and population scale of agricultural products demand will lead to the cultivated land demand spillover, then need to depend on the vast fields of Hebei province. The environmental inequality in Beijing, Tianjin and Hebei has been verified (Ding and Wang, 2020). The results show that the environmental inequality between the Beijing-Tianjin-Hebei region has become more serious in recent years, with Beijing reaping more environmental benefits and Hebei bearing more pollution. Then how about the utilization of cultivated land natural capital in this region? Is it the same inequality occurred in utilization of cultivated land? This problem remains to be revealed, which is not only the purpose but also the originality of this research.
Therefore, the focus of this study is to conduct an accounting of the natural capital of cultivated land in the Beijing-Tianjin-Hebei region, analyzes the balance of natural resource utilization from the perspective of cultivated land, and complements the dimension of imbalanced development in this region from the perspective of natural capital utilization of cultivated land. Therefore, this study uses a three-dimensional ecological footprint model to account for and analyze the utilization of natural capital stocks and flows of cultivated land in the Beijing -Tianjin-Hebei region from 2009 to 2016 based on the breadth and depth of the footprint at the prefecture-level city scale, thereby providing evidence for cultivated land conservation, arable land ecological compensation, and coordinated and balanced regional development.
2 Study area and methods
2.1 Study area
Beijing, Tianjin and Hebei are located in the North China Plain, as “Capital Economic Circle” and one of the three major urban agglomerations in China (Figure 1). With unique location advantages, Beijing- Tianjin- Hebei region is not only the economic engine in northern China, but also undertakes the national major development strategy. In terms of geography conditions, the Beijing-Tianjin-Hebei region covers an area of about 216,600 square kilometers, and the terrain in the region transitioning from west to east, north to south and mountains to plains, with the Bohai Sea in the east and the “North China Ecological Barrier” in the west. The natural resources in the whole region are abundant and widely distributed. The land cover types in the region are diverse, with wetlands, cultivated lands, construction lands, forest lands, and grasslands alternating from southeast to northwest (Liu et al., 2013), and the utilization of agricultural land shows a transition trend from plantation land in the southeast to forestry and grazing land in the northwest. Socioeconomically, the Beijing-Tianjin-Hebei region includes 2 municipalities, Beijing and Tianjin, and 11 prefecture-level cities in Hebei province, including Shijiazhuang, Tangshan, Baoding, Qinhuangdao, Langfang, Cangzhou, Chengde, Zhangjiakou, Handan, Hengshui, and Xingtai. The Beijing-Tianjin-Hebei region is a densely populated area in China, with a total population of 113.074 million in 2019, accounting for 8.1% of the national share, and the total population is expected to reach 120 million in 2020. The urbanization rate of the Beijing-Tianjin-Hebei region was 65.8% in 2018, 4.7 percentage points higher than in 2014. While the rapid economic development and urbanization, water resources depletion, air pollution, cultivated land degradation and ecological deterioration not only constrain the coordinated development strategy of Beijing-Tianjin-Hebei, but also limit the sustainable development of the region.
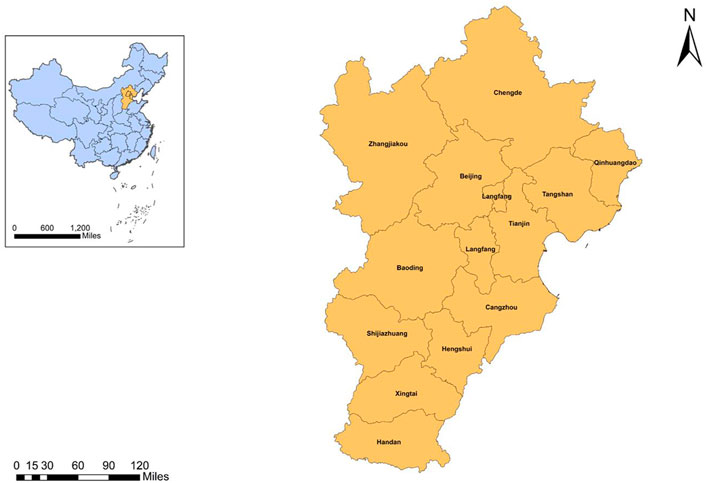
FIGURE 1. The study area.
2.2 Data sources
This study takes cultivated land as object, and mainly accounts for the consumption ecological footprint of cultivated land. Consumer goods, i.e., the main types of agricultural products, are selected as grain, cotton, oilseeds, vegetables and fruits. The agricultural output data and population data of Beijing-Tianjin-Hebei region were obtained from China Agricultural Statistical Yearbook, Hebei Rural Statistical Yearbook, China Urban Statistical Yearbook, Hebei Economic Yearbook, and statistical bulletins of 13 prefecture-level cities; the global average agricultural production data were obtained from the Food and Agriculture Organization of the United Nations (FAO, http://www.fao.org); land use data were obtained from the Second National Land Survey and the annual National Land Change Survey. Since the localized parameters are more consistent with China’s resource endowment and agricultural production, the equilibrium factors and yield factors used in the calculation of this paper refer to the results of Liu’s study (Liu et al., 2010; Liu et al., 2013). In addition, due to the difficulty of obtaining agricultural consumption data, agricultural production data was used instead, and this may result in the calculation of the ecological footprint of cultivated land slightly higher than the actual value. For ecological conservation reasons, this paper refers to the recommendation of the United Nations World Commission on Environment and Development (WCED) and deducts 12% of the biodiversity conservation area in the calculation (Barnaby, 1987).
2.3 Research methods
In this study, a modified three-dimensional ecological footprint model is mainly used to portray the stock and flow utilization of natural capital of cultivated land (Fang, 2013). The calculation formula is as follows.
In which,
Where
In addition, this research further introduces the flow occupancy rate and stock-flow utilization ratio to analyze the level of flow utilization in case of ecological surplus and the degree of stock capital depletion in case of ecological deficit, two indicators can be calculated as follows.
When the natural capital flows are exhausted, the region is in an ecological deficit and starts to deplete the capital stock. Therefore, when the flow occupancy rate exceeds 100%, the larger the value, the higher the degree of stock capital depletion.
Since the Beijing-Tianjin-Hebei region has long been in a state of unbalanced economic and social development, the distribution of resource supply and consumption between regions also has a certain degree of unevenness. Therefore, in the context of the synergistic development of Beijing-Tianjin-Hebei, this research further introduces the Gini coefficient of ecological footprint (Fang and Heijungs, 2012) to evaluate the equity of natural capital utilization of cultivated land in the Beijing-Tianjin-Hebei region. The calculation formula is as follows.
Where
3 Results
3.1 Overall analysis of the three-dimensional ecological footprint of cultivated land
Since the breadth of ecological footprint characterizes the degree of utilization of natural capital flow and the depth of ecological footprint characterizes the degree of consumption of natural capital stock, the three-dimensional ecological footprint can form a “cylinder” if the breadth of footprint is regarded as the bottom and the depth of footprint as the length of a column. Ideally, if the flow of natural resources is sufficient to support economic and social development, the footprint depth is 0 and the cylinder does not exist, but in today’s economic and social development transition period, the level of ecological governance and the efficiency of resource utilization are not yet able to reach this state. When the depth is greater than the breadth, the slender column is presented and the development is unsustainable; when the breadth is greater than the depth, the flat column is presented and the development is sustainable. Hence, during the transition period, the three-dimensional ecological footprint column should show a gradual flattening trend (Figure 2), i.e., the occupancy rate of natural capital flow increases and the consumption rate of natural capital stock decreases, so that the natural resources and ecological environment can be renewed, thus achieving sustainable regional development.
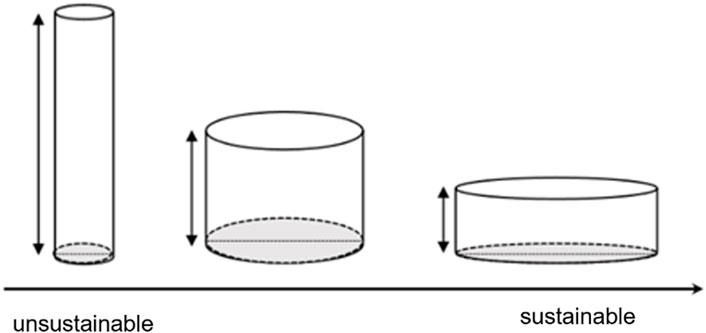
FIGURE 2. The relationship between three-dimensional ecological footprint and sustainable development.
As shown in Figure 3, the depth and breadth of the cultivated land footprint in Beijing-Tianjin-Hebei region from 2009 to 2016 showed a cross fluctuating downward trend, and the depth curve was higher than the breadth curve most of the time. This implies that ecological management has played a positive role, but the overall natural capital use of cultivated land in the region is still in an unsustainable state.
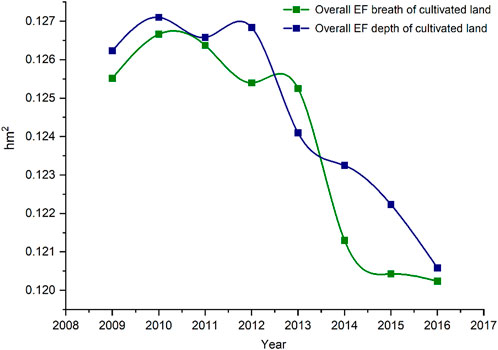
FIGURE 3. The overall trend of three-dimensional ecological footprint of cultivated land in Beijing-Tianjin-Hebei region.
Specifically, from 2009 to 2016, the ecological footprint breadth of each city in the Beijing-Tianjin-Hebei region, except Beijing and Tianjin, has slightly increased, and the ecological footprint depth has significantly increased and far exceeded the footprint breadth (Figure 4). This implies that the degree of depletion of natural capital stock of cultivated land in cities in the Beijing-Tianjin-Hebei region is increasing, but the level of flow utilization is still very low. While Beijing and Tianjin belong to “high ecological footprint depth-low ecological footprint breadth” cities, with the progress of natural resource utilization and governance level, as well as the transformation and development of the cities, Beijing has achieved a decrease in ecological footprint depth while keeping the ecological footprint breadth largely unchanged.
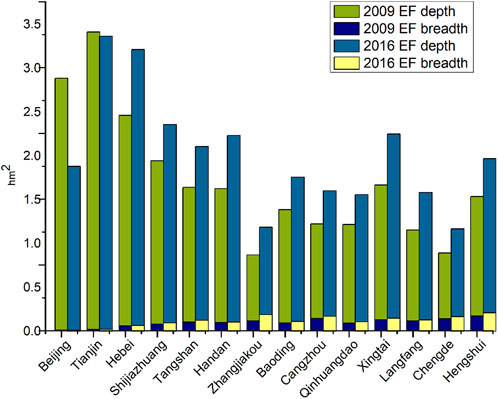
FIGURE 4. Comparison of ecological footprint depth in Beijing-Tianjin-Hebei region from 2009 to 2016.
3.2 Decomposition analysis of the three-dimensional ecological footprint of cultivated land
3.2.1 Footprint breadth
Ecological footprint breadth portrays the strength of mobility of natural capital and the extent to which human activities use the flow capital (Du et al., 2016). Therefore, the higher the footprint breadth, the more sufficient the utilization of natural capital flows by humans, and the consumption of capital stock will be reduced accordingly, and the lower the footprint depth should be. As can be seen from Figure 5, except for Zhangjiakou, the ecological footprint breadth of the provinces and cities in the Beijing-Tianjin-Hebei region are in a decreasing trend. That is, since the rate of ecological resource renewal is lower than the rate of human exploitation, their resource endowments cannot sustainably support economic activities, which in turn leads to a decrease in the available natural capital flows.
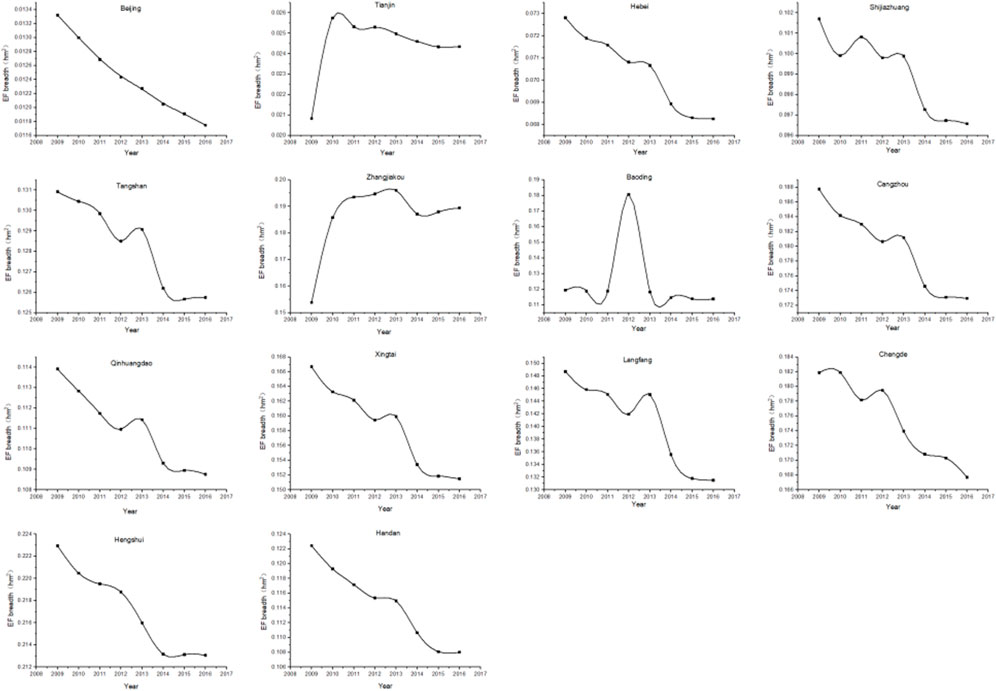
FIGURE 5. The trend of ecological footprint breadth of cultivated land in Beijing-Tianjin-Hebei region.
3.2.2 Footprint depth
Some cities have a high ecological footprint depth because their own natural resources are relatively scarce and their resources are renewed slowly, so economic activities will inevitably lead to the depletion of stock capital. However, some cities have high ecological footprint depths due to insufficient ecological protection and declining ecological carrying capacity of the region. For cultivated land resources, Hebei Province is a large agricultural and population province, and the per capita cultivated land resources have long been lower than the national average, and people lack the awareness of ecological protection of cultivated land, agricultural pollution is always been neglected, and the use of pesticides, chemical fertilizers and mulch is increasing by year. The massive and unreasonable use of agricultural inputs such as pesticides, fertilizers and mulch, coupled with unreasonable irrigation methods, has led to serious degradation of soil quality, prominent agricultural environmental pollution problems in some areas, and a decline in the ecological carrying capacity of cultivated land, thus leading to the phenomenon of high ecological footprint depth of cultivated land in most cities in Hebei Province. However, after years of cultivated land protection and ecological management, the ecological footprint depth of cultivated land has significantly decreased in many places in Beijing, Tianjin, Shijiazhuang, Tangshan, Qinhuangdao, Chengde, Hengshui, etc. (Figure 6).
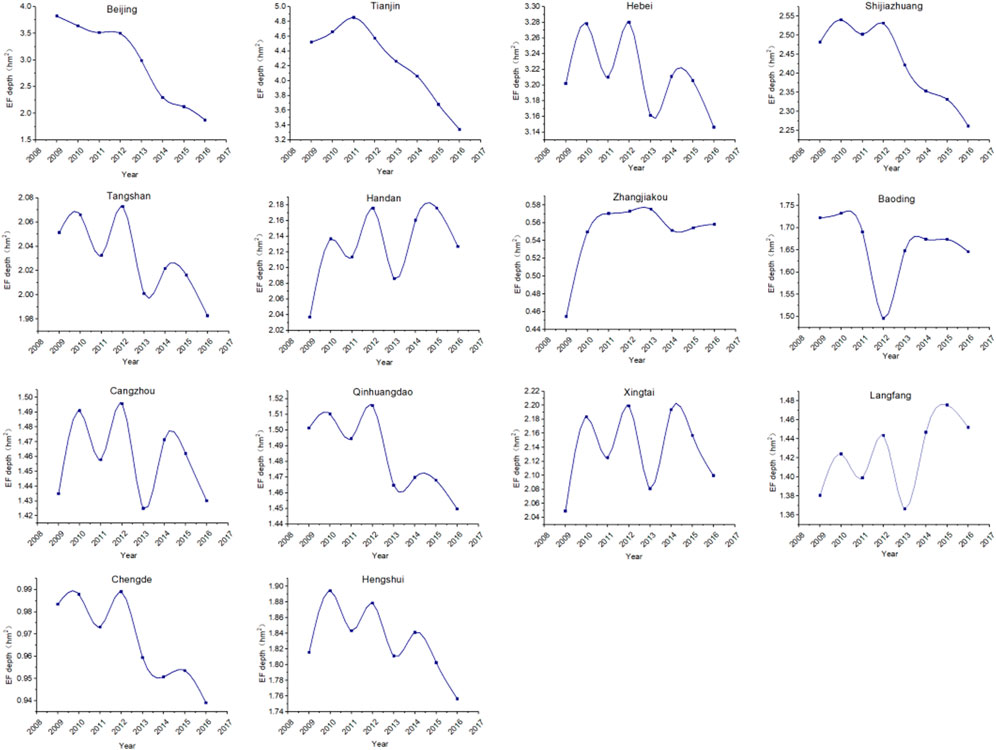
FIGURE 6. The trend of ecological footprint depth of cities in Beijing-Tianjin-Hebei region.
3.3 Analysis of the three-dimensional ecological footprint structure of cultivated land
3.3.1 Flow occupancy rate
Capital flows do not reduce the total amount of wealth, which means sustainability for the ecosystem (Hicks, 1946). The occupancy rate of natural capital flows reflects the use of natural capital flows in a city or region. Under the ideal level of resource utilization technology and management, natural capital flows should be able to meet the natural material needs of economic activities, i.e., the flow occupancy rate is less than 100%. However, the results show that only Zhangjiakou and Chengde in the Beijing-Tianjin-Hebei region have controlled the flow occupancy rate to under 100% and achieved self-sufficiency in natural capital flow supply (Table 1). The remaining 85% of the cities, however, have reached 100% flow occupancy, indicating that the annual flow of products and services generated by the cultivated land in the region can no longer meet the needs of economic development for resources and environment, which needs to be compensated by flows from other cities or regions. It should be noted that natural capital flows of cultivated land are somewhat different from the general natural capital flows. Natural capital flow is the difference between the beginning and the end of the natural capital accounting period, and its source is natural capital, mainly the change of renewable natural capital. In contrast, cultivated land, as a non-renewable resource, is difficult to increase in quantity. Therefore, in addition to the increase or decrease of the quantity, the natural capital flow of cultivated land can also be understood as a qualitative change, which alter accordingly with the transformation of cultivated land use and changes in plantation technology and land reclamation technology.
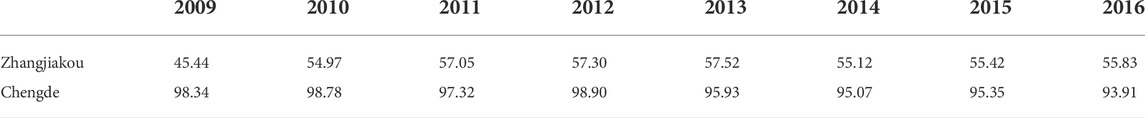
TABLE 1. The occupancy rate of natural capital flow of cultivated land in Zhangjiakou and Chengde.
3.3.2 Stock-flow utilization ratio
Natural capital consists of two components: flows and stocks. The flow represents the annual renewable resource flow and its ecological service supply, and the stock capital is consumed as a supplement when the flow is exhausted. The inability of the flow to meet the needs of economic activities implies the depletion of the natural capital stock. Since most cities in the Beijing-Tianjin-Hebei region have a flow utilization ratio of 100%, it cannot reflect the stock depletion status. Therefore, this study further introduces the stock-flow utilization ratio for in-depth analysis.
Figure 7 shows the stock-flow utilization ratio of cultivated land natural capital in the Beijing-Tianjin-Hebei region in 2009 (part A) and 2016 (part B). From 2009 to 2016, the consumption of natural capital stock of cultivated land in Beijing, Tianjin and Hebei basically maintained the spatial distribution pattern of “high in the south and low in the north” and “high in Beijing, Tianjin and low in Hebei”. In terms of time, the consumption of natural capital stock of cultivated land in Beijing decreased significantly, while Langfang and Tangshan decreased slightly and Handan increased slightly. In the whole Beijing-Tianjin-Hebei region, except Zhangjiakou and Chengde, most of them are in a state of deep stock depletion. But, given the city’s own resource endowment and stage of economic development, not all the natural capital stock depletion is to be criticized. For example, municipalities like Beijing and Tianjin have large economies with a low share of primary industries. In Beijing, for example, the northwestern, northern, and northeastern parts of the city are mostly mountainous and supply Beijing’s water sources, with low agricultural occupancy, mostly orchards in the mountains and crops on the plains. Agriculture is located in the southwest, south, southeast and east of Beijing, but with the development of the economy, most farmers no longer rely solely on agriculture. And with the expansion of the city, the amount of cultivated land in Beijing will gradually decrease. Therefore, after the ecological footprint model converts the main crop yield into ecologically productive land, the occupancy rate of its arable natural capital is necessarily high, which is in line with the characteristics of urban positioning and development stages. Hebei Province is a large agricultural province, and the production of major agricultural products such as grain, vegetables, meat, eggs and milk are among the highest in China, and its cultivated land utilization intensity is relatively higher than that of Beijing and Tianjin, especially in the southern cities such as Shijiazhuang, Xingtai and Handan, where the proportion of cultivation is much higher than that in the developed forestry and pastoral areas in the north. In the process of agricultural production, the reduction of cultivated land quantity, quality and ecological damage may lead to the increase of natural capital stock consumption of cultivated land. Zhangjiakou and Chengde formed an ecological conservation area in the Beijing-Tianjin-Hebei region, which has superior ecological resource endowment. Also, in this area, there is a great effort to return farmland ecologically. Converting cropland to forest or grassland allows production factors other than land to flow to more arable land, which can save investment, improve the food production conditions and improve the efficiency of input and output, so as to the region can always keep the cultivated land natural capital stock unchanged, and the flow is efficiently used. In addition, the increasingly serious phenomenon of “non-agricultural” of cultivated land in North China may also indirectly lead to the depletion of the natural capital stock of cultivated land. Due to the declining income from grain cultivation and frequent natural disasters, the proportion of grain cultivation in North China is decreasing and the proportion of cash crop cultivation is gradually increasing. Take vegetables as an example, the socio-economic development and the improvement of the living standard of residents lead to high demand for vegetables and good profitability. However, the cultivation of vegetables will lead to an increase in carbon emissions, use of fertilizer and mulch, as well as a decrease in land fertility and agricultural surface pollution, which will in turn reduce the ecological carrying capacity of cultivated land and cause the depletion of its natural capital stock.
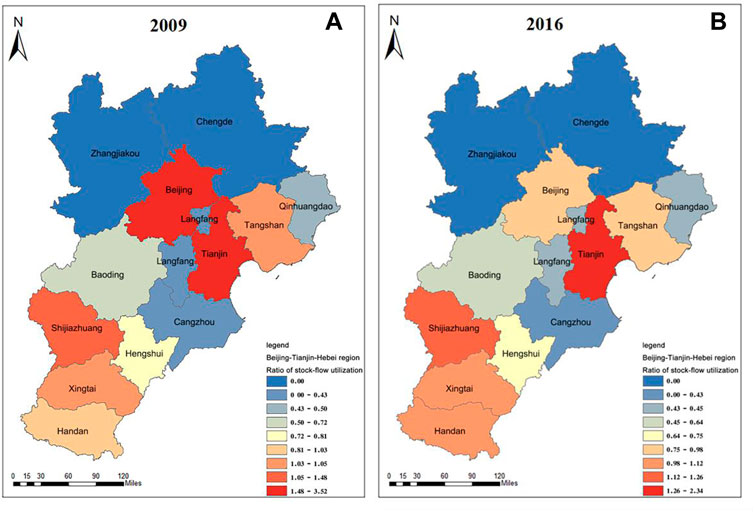
FIGURE 7. Stock-flow utilization ratio of cultivated land natural capital in the Beijing-Tianjin-Hebei region.
3.3.3 Ecological footprint gini coefficient
In addition, this study analyzes the equity of natural capital flow appropriation of cultivated land in Beijing-Tianjin-Hebei regions by calculating the ecological footprint Gini coefficient of cultivated land and referring to a Gini coefficient evaluation criterion. The Gini coefficient of ecological footprint of cultivated land in Beijing-Tianjin-Hebei region was calculated (Table 2). According to the theory of regional unbalanced development, labor, technology and capital from various cities in Hebei Province tend to flow easily to Beijing and Tianjin, leading to the widening of regional development gap. Coupled with the inadequate regional agricultural market integration and factor flow mechanisms, the equity of the utilization of arable natural capital as a basic element supporting agricultural development is also skewed under the influence of the unbalanced development pattern of Beijing-Tianjin-Hebei. As the production base of grain, cotton, oil, vegetables and fruits in Beijing-Tianjin-Hebei region and the supply place to meet the demand of agricultural products from Beijing and Tianjin, Hebei Province has realized the transformation of economic value in the use of cultivated land, but also paid a certain price, i.e., the depletion of cultivated land, especially ecological depletion, caused by agricultural production is not compensated accordingly, which is the reason for the high Gini coefficient of ecological footprint of cultivated land in the region.

TABLE 2. Gini coefficient of cultivated land ecological footprint in Beijing-Tianjin-Hebei region.
According to Table 3, the Gini coefficient of cultivated land ecological footprint in Beijing-Tianjin-Hebei region was 0.419 in 2009, which was in a relatively uneven state, but gradually improved after 2010. Although the Beijing-Tianjin-Hebei synergistic development strategy was not formally proposed in 2009, the concept of synergistic development of the region has been formed since “Langfang Consensus” (Wei Jinping and Wei, 2014). Under the guidance of the concept of balanced development and policy interventions in the region, the balance of natural capital utilization of cultivated land in Beijing-Tianjin-Hebei region shifted from more uneven to relatively even from 2010 to 2016, indicating a significant positive effect of regional ecological governance and cultivated land conservation.

TABLE 3. Comparison table of ecological footprint Gini coefficient and flow occupancy equity.
4 Discussion
4.1 Comparison with previous studies
This study analyzed the utilization of cultivated land natural capital in Beijing-Tianjin-Hebei region based on three-dimensional ecological footprint model from the perspective of equity. There is a long history of inequality in this region, not only in terms of economic development and per capita income, but also in terms of resources and the environment, which has been noted in many studies (Hou, 2019; Li, 2021; Wang and Zhang, 2022). To some extent, the unbalanced economic development will lead to the uneven quota of resources and environment, which will cause serious ecological and environmental problems and hinder the sustainable and balanced development of the region. Urban development and expansion also tend to crowd out cultivated land and primary industries, and it is the surrounding areas that bear the brunt of these pressures. Thus, what makes this study unique is that we analyze the utilization of natural capital in this region from the perspective of cultivated land, a key type of natural capital, which can combine the results with the cultivated land protection and utilization, coordinated development, equitable development and ecological compensation of cultivated land in this region, so as to provide a basis for policy making.
This study analyzed the direct utilization of cultivated land natural capital, and found that the utilization level of cultivated land natural capital flow in the Beijing-Tianjin-Hebei region was generally low, and most cities had serious consumption of cultivated land natural capital stock. From the perspective of the whole region, the ecological use of cultivated land is in a relatively unbalanced state. Other studies evaluated the equity of cultivated land natural capital utilization in the Beijing-Tianjin-Hebei region from the perspective of virtual land, and reached similar conclusions as this paper. The cross-regional consumption of natural capital exists between regions, which is usually implied in the trade of products, which is not easy to be detected. Hebei is responsible for more natural capital consumption of cultivated land for the development of Beijing and Tianjin, especially Beijing. Pei et al. used ecological footprint model and regional input-output table in 2002 and 2007, and found that the social and economic development of Beijing has caused ecological pressure on the land resources in the Tianjin and Hebei, and its development cannot be separated from the support of ecological productive land resources in the surrounding areas, such as agricultural land resources (Pei et al., 2016). Guo et al., using the regional input-output data of 2012, found that the utilization of cultivated land natural capital in Beijing, Tianjin and Hebei was unfair, and the development of Beijing and Tianjin made great use of virtual land in other cities in Hebei (Guo et al., 2020). Unfortunately, most of the data in these studies are cross-section data sets, which make it difficult to analyze the utilization trend of cultivated land natural capital through time series. This study makes up for this shortcoming.
This study also reveals the relationship between the use of natural capital and ecological compensation of cultivated land, which provides ideas for ecological compensation of cultivated land. This study suggests that the excessive depletion of natural capital of cultivated land caused by the production of agricultural products can be used as a reference basis for ecological compensation of cultivated land across regions, thus supporting the realization of ecological value of cultivated land. When an ecological deficit occurs in a region, it indicates that human activities in the region have imposed a heavy burden on the ecological environment and the ecological condition is not optimistic. When a region produces ecological surplus, it means that the consumption of ecological resources in the region is reduced and the ecological condition is guaranteed. Therefore, through this study, the supply of regional resources and environment as well as the difference of regional resource supply and demand can be understood. In addition, by calculating the three-dimensional ecological footprint of natural capital of cultivated land, it is also possible to identify the ecological surplus and ecological deficit areas of cultivated land spatially and estimate the utilization status of cultivated land resources, thus providing a basis for optimizing the utilization pattern of cultivated land resources and the formulation of cultivated land protection policies. Many studies have shown that this idea is feasible (Su et al., 2014; Zhao et al., 2017; Qian et al., 2022). However, after identifying the ecological supply and ecological benefit areas, these studies used the value of ecosystem services to calculate the amount of ecological compensation for cultivated land, which is still open to question in future research. Because most of the total ecosystem service value of cultivated land used in these studies often includes non-market value such as cultural value, the amount of which differs greatly from the economic value of cultivated land due to the calculation method, so it is not suitable to be used as the calculation basis for the amount of ecological compensation of cultivated land at this stage. Due to the limitation of space, the mechanism and calculation of ecological compensation for cultivated land will be discussed in another paper.
4.2 Limitation and future topics
The three-dimensional ecological footprint portrays the extent to which agricultural production uses the natural capital flows and stocks of cultivated land. When agricultural production in a region causes overuse of cultivated land, the flow is depleted and the stock declines. Since the flow of products provided by natural capital of cultivated land is dominated by primary agricultural products such as grain, cotton, oilseeds, vegetables and fruits, these agricultural products will be traded across regions in addition to supplying local residents for consumption. For example, the delivery of agricultural products from Zhangjiakou, Chengde and Handan to Beijing actually consumes the natural capital of the cultivated land in the place of origin. The price of agricultural products in the trading process often only includes planting costs, transportation costs, technique, labor, etc., without ever considering ecological costs. And this part of the ecological cost gap should be compensated accordingly. However, due to the difficulty of obtaining agricultural products trading data, the flow of natural capital of cultivated land between cities along with product trade is not considered. The latest interregional input-output table combined with ecological footprint model can be considered in further study.
The yield factors used in the calculation of the three-dimensional ecological footprint in this paper are at the provincial scale, which may not be accurate enough when calculating the ecological footprint of prefecture-level cities. The results will be closer to the actual situation if we re-calculate the yield factors in prefecture-level based on net primary productivity, etc., which is also a topic that we will further study in the future.
5 Conclusion
This paper presents a systematic analysis of the natural capital of cultivated land in Beijing-Tianjin-Hebei region from 2009 to 2016 based on a three-dimensional ecological footprint model from ecological footprint theory. It is found that from 2009 to 2016, the ecological footprint breadth of cultivated land in Beijing-Tianjin-Hebei region is generally low and the footprint depth is generally high, and the ecological footprint depth of cultivated land in the region as a whole tends to increase, except for some cities with outstanding resource endowments (e.g., Zhangjiakou and Chengde) which can achieve self-sufficiency in natural capital flow, 85% of cities have experienced depletion of natural capital flow of cultivated land and increased depletion of natural capital stock. From the overall and long-term perspective, the creation and utilization level of natural capital flow of cultivated land in the Beijing-Tianjin-Hebei region needs to be improved, and the ecological protection of cultivated land needs to be further strengthened. In addition, in terms of equity, the ecological balance of cultivated land in the Beijing-Tianjin-Hebei region shifted from relatively uneven to relatively even from 2009 to 2016, indicating that the collaborative management of cultivated land protection and ecology in Beijing-Tianjin-Hebei achieved initial results. Therefore, in the future collaborative development of Beijing-Tianjin-Hebei, it is more important to focus on ecological protection and collaborative function of regional cultivated land, and to promote the sustainable use of natural capital and coordinated regional development according to the local conditions and policies.
Data availability statement
The raw data supporting the conclusions of this article will be made available by the authors, without undue reservation.
Author contributions
HZ was responsible for conceptualization, methodology, investigation, formal analysis, original draft writing, review, editing and visualization. YZ was responsible for methodology, formal analysis and original draft writing. D-LZ was responsible for review and editing, project administration and funding acquisition.
Funding
This work is part of the project “Research on The Theory and Method of Natural Resource Assets Accounting in China” (No.19JZD013), which was supported by the Key Project of Philosophy and Social Science of Ministry of Education of China.
Acknowledgments
The authors would like to express their sincere gratitude to the editors and reviewers for their contributions to the publication of this article.
Conflict of interest
The authors declare that the research was conducted in the absence of any commercial or financial relationships that could be construed as a potential conflict of interest.
Publisher’s note
All claims expressed in this article are solely those of the authors and do not necessarily represent those of their affiliated organizations, or those of the publisher, the editors and the reviewers. Any product that may be evaluated in this article, or claim that may be made by its manufacturer, is not guaranteed or endorsed by the publisher.
References
Chen, X., Fang, K., Wu, C., Wang, T., and Long, Y. (2019). A study on spatio-temporal changes in patterns of chinas cultivated land use from 2009 to 2015-insights from food safety and ecological security. Bull. Soil Water Conservation 39, 291306–292296. doi:10.13961/j.cnki.stbctb.2019.03.047
Chiritescu, V., Gogonea, M. R., Andrei, R. D., Kruzslicika, M., and Gavrila, V. (2013). Sustainable development through eco-economic development. Sci. Pap. Ser. - Manag. Econ. Eng. Agric. Rural Dev. 13, 73–76.
Costanza, R., D'Arge, R., De Groot, R., Farber, S., Grasso, M., Hannon, B., et al. (1997). The value of the world's ecosystem services and natural capital. nature 387, 253–260. doi:10.1038/387253a0
Daly Herman, E. (1996). Beyond growth: The economics of sustainable development. Boston: Beacon Press.
Ding, G., and Wang, B. (2020). Causes of environmental inequality in Beijing-Tianjin-Hebei region: An analysis based on Shapley value decomposition method. J. Arid Land Resour. Environ. 34, 44–50. doi:10.13448/j.cnki.jalre.2020.296
Du, Y., Peng, J., Gao, Y., and Zhao, H. (2016). Sustainability evaluation of natural capital utilization based on a three-dimensional ecological footprint model: A case study of the beijing-tianjin-hebei metropolitan region. Prog. Geogr. 35, 1186–1196. doi:10.18306/DLKXJZ.2016.10.002
Fang, K. (2015). Assessing the natural capital use of eleven nations: An application of a revised three-dimensional model of ecological footprint. Acta Ecol. Sin. 35, 3766–3777. doi:10.5846/stxb201308022011
Fang, K. (2013). Ecological footprint depth and size: New indicators for a 3D model. Acta eco. Sin. 33, 267–274. doi:10.5846/stxb201111051670
Fang, K., and Heijungs, R. (2012). A review on three-dimensional ecological footprint model for natural capital accounting. Prog. Geogr. 31, 1700–1707. doi:10.11820/dlkxjz.2012.12.016
Fang, K., and Li, H. (2012). Provincial pattern of China's natural capital use: A modification and application of ecological footprint depth and size. J. Nat. Resour. 27, 1995–2005. doi:10.11849/zrzyxb.2012.12.001
Fisher, B., De Wit, L. A., and Ricketts, T. H. (2021). Integrating economics into research on natural capital and human health. Rev. Environ. Econ. Policy 15, 95–114. doi:10.1086/713024
Guo, S., Wang, Y., Wang, Y., Wang, M., He, P., and Feng, L. (2020). Inequality and collaboration in north China urban agglomeration: Evidence from embodied cultivated land in Jing-Jin-Ji's interregional trade. J. Environ. Manag. 275, 111050. doi:10.1016/j.jenvman.2020.111050
Han, H., and Zhang, X. (2020). Static and dynamic cultivated land use efficiency in China: A minimum distance to strong efficient frontier approach. J. Clean. Prod. 246, 119002. doi:10.1016/j.jclepro.2019.119002
He, R., Liu, S., and Liu, Y. (2011). Application of sd model in analyzing the cultivated land carrying capacity: A case study in bijie prefecture, guizho province, China. Procedia Environ. Sci. 10, 1985–1991. doi:10.1016/j.proenv.2011.09.311
Hong, S., Guo, Q., and Li, D. (2020). Spatiotemporal dynamics of ecological supply and demand based on ecological footprint theory. Resour. Sci. 42, 980–990. doi:10.18402/resci.2020.05.15
Hou, W. (2019). Evaluation of sustainable development and scenario analysis based on the three-dimensional ecological footprint model in jing-jin-ji urban agglomeration. China: Geophysical Research Abstracts.
Jin, X., and Liu, Q. (2017). Evolution of ecological footprint models for natural resources accounting. J. Nat. Resour. 32, 163–176. doi:10.11849/zrzyxb.20160125
Jin, Y., Liu, Q., and Li, C. (2020). Evaluation of cultivated land carrying capacity based on an improved three-dimension ecological footprint model:A case study of Jiangsu province. China Land Sci. 34, 96–104. doi:10.11994/zgtdkx.20200803.145222
Li, C. (2021). Study on environmental equity in beijing-tianjin-hebei region. IOP Conf. Ser. Earth Environ. Sci. 621, 012142. doi:10.1088/1755-1315/621/1/012142
Li, M., Zhou, Y., Wang, Y., Singh, V. P., Li, Z., and Li, Y. (2020). An ecological footprint approach for cropland use sustainability based on multi-objective optimization modelling. J. Environ. Manag. 273, 111147. doi:10.1016/j.jenvman.2020.111147
Liu, J., Ma, C., Wang, Y., Feng, Z., and Li, S. (2013). Assessing the vulnerability of ecosystem services of beijing tianjin-hebei area based on radial basis function network. Acta Sci. Nat. Univ. Pekin. 49, 1040–1046. doi:10.13209/j.0479-8023.2013.138
Liu, M., Li, W., and Xie, G. (2010). Estimation of China ecological footprint production coefficient based on net primary productivity. Chin. J. Ecol. 29, 592–597. doi:10.13292/j.1000-4890.2010.0097
Ma, W., Liu, B., Yang, D., and Guo, Q. (2017). Dynamic evaluation of natural capital using the three-dimension ecological footprint model: The jiulong river basin in southeast China. Resour. Sci. 39, 871–880. doi:10.18402/resci.2017.05.07
Niccolucci, V., Bastianoni, S., Tiezzi, E., Wackernagel, M., and Marchettini, N. (2009). How deep is the footprint? A 3D representation. Ecol. Model. 220, 2819–2823. doi:10.1016/j.ecolmodel.2009.07.018
Ouyang, Z., Song, C., Zheng, H., Polasky, S., Xiao, Y., Bateman, I. J., et al. (2020). Using gross ecosystem product (GEP) to value nature in decision making. Proc. Natl. Acad. Sci. U. S. A. 117, 14593–14601. doi:10.1073/pnas.1911439117
Pei, X., Liu, C., Xie, G., Li, Z., Wang, H., and Chen, L. (2016). Study on inter-regional transfer of embodied land resource between beijing and tianjin-hebi. CHINA Popul. Resour. Environ. 26, 97–104. doi:10.3969/j.issn.1002-2104.2016.01.014
Qian, F., Xu, H., Pang, R., Wang, D., Jia, Y., and Gu, H. (2022). Estimation and analysis of cultivated land ecological compensation in liaoning province based on three-dimensional ecological footprint model. Chin. J. Agric. Resour. Regional Plan. 1, 15.
Qian, Q. H., Zhou, D. Q., Bai, X. Y., Xiao, J. Y., Chen, F., and Zeng, C. (2018). Ecological balance between supply and demand based on cultivated land ecological footprint method in Guizhou Province. IOP Conf. Ser. Earth Environ. Sci. 108, 032063. doi:10.1088/1755-1315/108/3/032063
Rees, W. E. (2018). “Ecological footprints and appropriated carrying capacity: What urban economics leaves out,” in The earthscan reader in rural–urban linkages (London, England: Routledge).
Shi, K., Diao, C., Sun, X., and Zuo, T. (2013). Ecological balance between supply and demand in Chongqing City based on cultivated land ecological footprint method. Acta eco. Sin. 33, 1872–1880. doi:10.5846/stxb201211231662
Shi, W. J. (2016). Measurement and evaluation of ecological pressure and eco-efficiency in China based on ecological footprint. China Ind. Econ. 5, 21. doi:10.19581/j.cnki.ciejournal.2016.05.001
Shmelev, S., and Brook, H. R. (2021). Macro sustainability across countries: Key sector environmentally extended input-output analysis. Sustainability 13, 11657. doi:10.3390/su132111657
Su, H., Lei, G., and Li, R. (2014). Research on ecological compensation of plowland of Henan Province based on the value of ecosystem services and emergetic ecological footprint model. J. Henan Agric. Univ. 48, 765–769. doi:10.16445/j.cnki.1000-2340.2014.06.009
Wackernagel, M., and Rees, W. (1998). Our ecological footprint: Reducing human impact on the earth. Gabriola Island, BC: New society publishers.
Wang, F., Wang, R., and Wang, J. (2020). Measurement of China’s green GDP and its dynamic variation based on industrial perspective. Environ. Sci. Pollut. Res. 27, 43813–43828. doi:10.1007/s11356-020-10236-x
Wang, L., and Li, H. (2014). Cultivated land use efficiency and the regional characteristics of its influencing factors in China:By using a panel data of 281 prefectural cities and the stochastic frontier production function. Geogr. Res. 33, 1995–2004. doi:10.11821/dlyj201411001
Wang, L., and Zhang, F. (2022). Does integration make an urban agglomeration intensify the internal imbalance? A contrastive study in north and southwest China. Urban Stud. 29, 41–47. doi:10.3969/j.issn.1006-3862.2022.02.007
Wang, Q., Yi, G., Zhang, T., Bie, X., Liu, D., He, D., et al. (2018). Evaluation of cultivated land resource in sichuan province based on ecological footprint model. Resour. Environ. Yangtze Basin 27, 80–87. doi:10.11870/cjlyzyyhj201801010
Wang, S. H., Chen, H. X., and Yin, K. D. (2022b). The employment effect of Chinese industrial enterprises embedded in environmental cost-adjusted global value chains. Environ. Sci. Pollut. Res. 29, 18160–18176. doi:10.1007/s11356-021-17118-w
Wang, S., Wang, X., and Lu, B. (2022a). Is resource abundance a curse for green economic growth? Evidence from developing countries. Resour. Policy 75, 102533. doi:10.1016/j.resourpol.2021.102533
Wei Jinping, L. X., and Wei, N. A. (2014). The history review, realistic dilemma and breakthrough path of Beijing-Tianjin-Hebei cooperative development. J. Hebei Univ. Technol. Soc. Sci. Ed. 6, 1–6+12. doi:10.3969/j.issn.1674-7356.2014.02.001
Wu, F., Yang, X., Shen, Z., Bian, D., and Babuna, P. (2021). Exploring sustainability and decoupling effects of natural capital utilization in China: Evidence from a provincial three-dimensional ecological footprint. J. Clean. Prod. 295, 126486. doi:10.1016/j.jclepro.2021.126486
Yang, J., Guo, A., Li, Y., Zhang, Y., and Li, X. (2019a). Simulation of landscape spatial layout evolution in rural-urban fringe areas: A case study of ganjingzi district. Giscience Remote Sens. 56, 388–405. doi:10.1080/15481603.2018.1533680
Yang, J., Yang, R., Chen, M.-H., Su, C.-H., Zhi, Y., and XI, J. (2021). Effects of rural revitalization on rural tourism. J. Hosp. Tour. Manag. 47, 35–45. doi:10.1016/j.jhtm.2021.02.008
Yang, X., Zhang, F., Luo, C., and Zhang, A. (2019b). Farmland ecological compensation zoning and horizontal fiscal payment mechanism in Wuhan agglomeration, China, from the perspective of ecological footprint. Sustainability 11, 2326. doi:10.3390/su11082326
Yang, Y., and Hu, D. (2018). Natural capital utilization based on a three-dimensional ecological footprint model: A case study in northern shaanxi, China. Ecol. Indic. 87, 178–188. doi:10.1016/j.ecolind.2017.12.010
Keywords: cultivated land resources, natural capital accounting, three-dimensional ecological footprint, ecological compensation, Beijing-Tianjin-Hebei region
Citation: Zhang H, Zhu D-L and Zhang Y (2022) Natural capital accounting of cultivated land based on three-dimensional ecological footprint model-- A case study of the Beijing-Tianjin-Hebei region. Front. Environ. Sci. 10:1060527. doi: 10.3389/fenvs.2022.1060527
Received: 03 October 2022; Accepted: 01 November 2022;
Published: 14 November 2022.
Edited by:
Shuhong Wang, Shandong University of Finance and Economics, ChinaReviewed by:
Chong Huang, Shandong University of Finance and Economics, ChinaChenxi Li, Xi’an University of Architecture and Technology, China
Copyright © 2022 Zhang, Zhu and Zhang. This is an open-access article distributed under the terms of the Creative Commons Attribution License (CC BY). The use, distribution or reproduction in other forums is permitted, provided the original author(s) and the copyright owner(s) are credited and that the original publication in this journal is cited, in accordance with accepted academic practice. No use, distribution or reproduction is permitted which does not comply with these terms.
*Correspondence: Dao-Lin Zhu, ZGx6aHVAY2F1LmVkdS5jbg==