 Chuanru Zhou1†
 Zexia Duan
 Yuanjian Yang
94% of researchers rate our articles as excellent or good
Learn more about the work of our research integrity team to safeguard the quality of each article we publish.
Find out more
ORIGINAL RESEARCH article
Front. Environ. Sci., 10 January 2023
Sec. Atmosphere and Climate
Volume 10 - 2022 | https://doi.org/10.3389/fenvs.2022.1059292
This article is part of the Research TopicDust and Polluted Aerosols: Sources, Transport and Radiative EffectsView all 13 articles
Compared with the urban boundary layer, air pollution–surface energy budget interactions in farmland areas are relatively sparse. To investigate the roles of local aerosol and transported dust pollution on the surface energy balance over farmland, a field experiment was conducted during spring 2016 in eastern China. The heavy pollution episodes during the measurement period were typically accompanied by easterly winds, low wind speeds, and high relative humidity. On polluted days, relative to clean days, both downward and upward shortwave radiation decreased by 46%, while downward and upward longwave radiation increased by 4% and 1%. The combined effects of the four radiation components resulted in a 33% reduction in net radiation on polluted days, and thus, the surface energy budget changed. Polluted days had 15% (58%) less sensible (latent) heat flux than clean days. This resulted in a higher daytime Bowen ratio on polluted days (0.83) compared to clean days (0.44). In a case analysis of dust pollution, high wind speeds and continuous high pressure induced the outbreak of the dust pollution episodes. Compared to local pollution events, the latent (sensible) heat flux was reduced more (less) than that in transported dust pollution events. Generally, this work has important implications for understanding the surface energy balance across land–atmosphere interactions over farmland regions, which are experiencing frequent aerosol pollution from local emissions and transboundary dust events.
Particulate matter (PM) air pollution poses a great threat to the environment, global climate change, and human health (Gu et al., 2018; Hamanaka and Mutlu, 2018; Yang et al., 2019; Wang et al., 2020a). Meanwhile, the process of heat exchange is one of the most important factors in the surface energy budget for understanding the formation, maintenance, and dissipation of PM pollutants (Guo et al., 2016; Wang et al., 2020b). Radiative transfer processes can be modulated by aerosols through the scattering, reflection, and absorption of shortwave radiation and through the reflection, absorption, and emission of longwave radiation, which further alter the surface energy balance (Jacobson et al., 2007; Brown et al., 2018). For example, Ding et al. (2013) pointed out that mixed agricultural burning plumes with fossil fuel combustion pollution in eastern China could result in the solar radiation intensity reducing by more than 70%. In a winter wheat field on the North China Plain, the daily mean shortwave (longwave) radiation on polluted days reduced (increased) by about 50% (20%) when compared to clean days, due to the radiative forcing of aerosols. Although the radiative forcing of aerosols has been intensively investigated, a thorough understanding of the surface energy budget under different pollution levels has yet to be realized, especially in the Huaihe River Basin (HRB) of eastern China. In addition, most observation stations are located in urban or suburban areas, with relatively little observational data available for the pure farmland background area, meaning there is a lack of knowledge on the effects of aerosols on surface energy budgets over farmland. In China, there is a large amount of farmland (accounting for 12.5%), which plays a key role in weather forecasting across the range of land–atmosphere interaction. At present, weather forecasting models rarely account adequately for the energy balance in cases of aerosol pollution, and thus studying the effects of aerosols on surface energy budgets over farmland can help to improve weather forecasting models. Also, more broadly, such work has important implications for understanding the surface energy balance across the land–atmosphere interactions that take place over farmland regions, which themselves are experiencing frequent aerosol pollution episodes, owing to local emissions and transboundary dust events.
The HRB (30°–36°N, 112°–122°E), a transitional belt between the subtropical and temperate climate regions in eastern China, is an area known to be sensitive to climate change (Jin et al., 2022). It belongs to the warm temperate semi-humid monsoon climate zone, with the mean annual precipitation varying between 600 and 1400 mm, and the average air temperature (Ta) ranging from 11°C to 16°C (Xu et al., 2021). Owing to the sufficient precipitation and suitable temperature, the HRB has become one of China’s major grain-producing areas (Yang et al., 2020a). Recently, PM pollution episodes have started to occur frequently and intensively over the farmland area of the HRB. The aerosol composition and sources in the HRB are complex, including not only local anthropogenic pollutants (e.g., from crop straw burning, transportation, and industrial emissions) but also natural aerosols from regional dust storms in spring (Jin and Shepherd, 2008; Fan et al., 2010). In addition to the issue of air pollutant emissions, the formulation of PM pollution episodes is also closely related to the prevailing meteorological conditions [e.g., winds, temperature inversion, relative humidity (RH), and boundary layer height], and synoptic-scale circulation (Zhang et al., 2014; Li et al., 2018; Fan et al., 2019; Wang et al., 2019; Yin et al., 2019). To explore the air pollution–boundary layer dynamics, many atmospheric field experiments have been conducted in the HRB over the past few years (Gao et al., 2003; Tanaka et al., 2007; Chen et al., 2015; Duan et al., 2021). For example, Kang et al. (2013) analyzed a long-lasting haze episode in Nanjing and found that the formation of haze pollution was often accompanied by lower wind speeds, a stably stratified atmosphere and a lower planetary boundary layer depth. Moreover, dust pollution in Asia generally originates from remote areas, such as northern China or Inner Mongolia (Liu et al., 2009; Liu et al., 2011). Also, for eastern China specifically, Han et al. (2022) reported that the storms in spring transporting dust to the region mainly derive from the deserts of Northwest China, Central Asia, South Asia, and East Asia, based on spaceborne lidar measurements.
Previous studies have shown that aerosols can discernably decrease the surface net shortwave radiation in the HRB (Xiong et al., 2022), and this in turn can result in rice yields in East China reducing by around 6.74% on average (Wang et al., 2020c). In addition, air pollution caused by the combination of local sources and long-distance transport is prominent in the HRB (Hu et al., 2018; Shao et al., 2006; Zhu et al., 2011; Shen et al., 2015), where PM concentrations from regional transport are higher than the average typically observed for concentrations from local sources (Ding et al., 2017; Hu et al., 2018). However, few studies have focused on the effects of local aerosol and transported dust pollution on the surface energy balance over farmland in the HRB. Thus, this study seeks to quantify the differences in the meteorological conditions, radiation, and turbulent flux on days categorized according to three different pollution levels (background, clean, and polluted) at a farmland site in spring in eastern China. Following this introduction, Section 2 introduces the site, instruments, and data processing methods; Section 3 reports and discusses the results; and Section 4 provides conclusions.
The data used in this study were obtained from the National Climatology Observatory (32.44°N, 116.79°E; 26.8 m above sea level) in Shouxian County, Anhui Province, China. The site is located on the south bank of the Huaihe River and is influenced by the subtropical monsoon climate (Figure 1). The annual mean Ta in 2015–2018 was 16.4°C and the annual precipitation was 1116 mm (Duan et al., 2021). During the measurement period (March–May 2016), winter wheat was grown around the site. A 2.5 m eddy covariance flux tower, equipped with a three-dimensional sonic anemometer (CSAT3A, Campbell Scientific Incorporation, United States) and a CO2/H2O open-path gas analyzer (EC150, Campbell Scientific Incorporation, United States), was installed at the center of the wheat field to continuously monitor the surface turbulent flux. In addition, a net all-wave radiometer (CNR4, Kipp & Zonen Inc., Netherlands) was installed at 1.5 m a.g.l. (meters above ground level). The raw 10-Hz EC eddy covariance data were averaged over 60-min periods following the methods described in Duan et al. (2022). Additional sensors measuring coarse PM (PM10) and fine PM (PM2.5) (GRIMM180) were installed on top of a 3 m-high building, 100 m northwest of the flux tower. The PM concentration, radiation, and meteorological data were excluded according to the criterion of
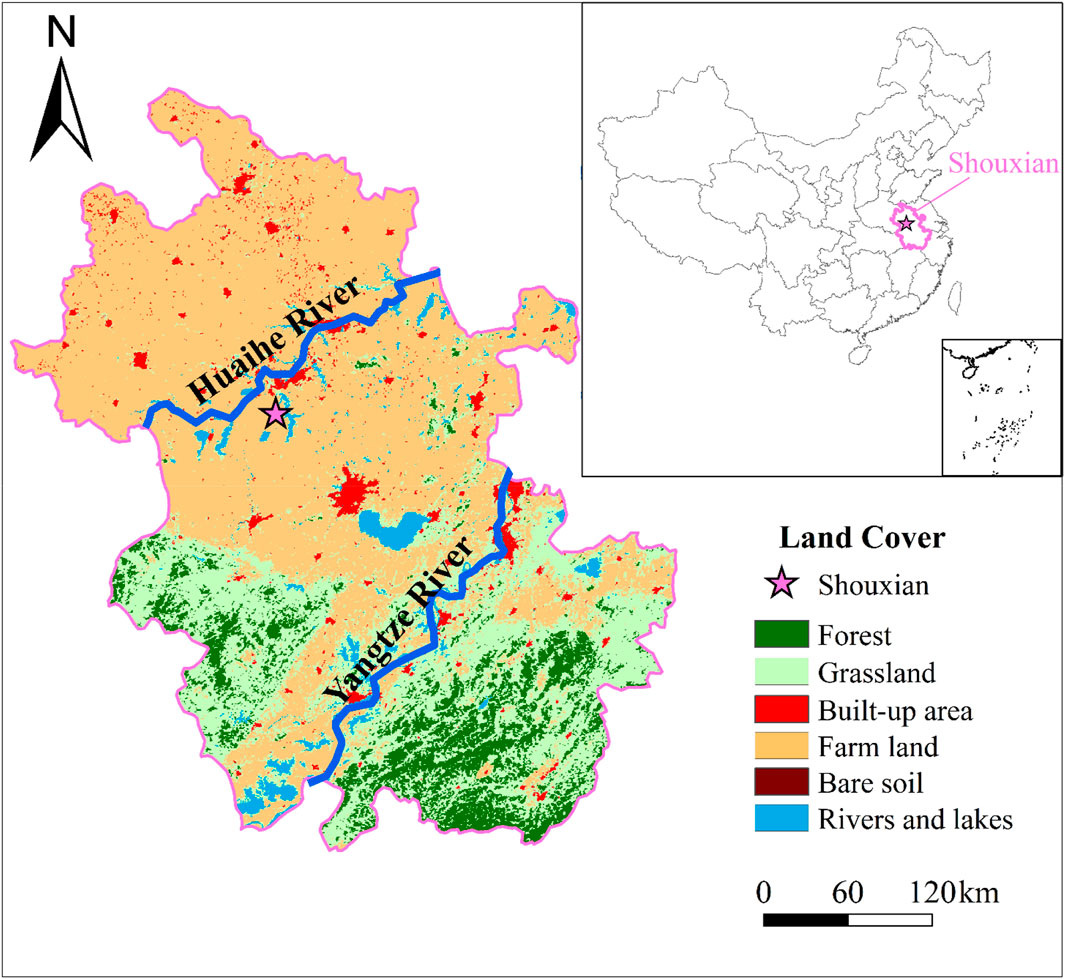
FIGURE 1. MODIS land use/land cover (resolution: 500 m) in eastern China in 2016.
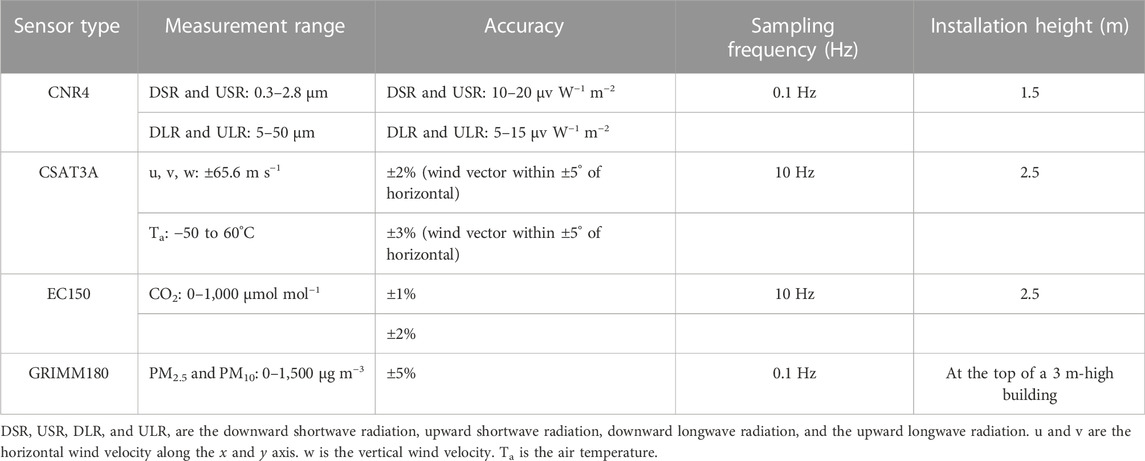
TABLE 1. Type key technical specifications of sensors.
Based on the environmental air quality criteria proposed by the Ministry of Environmental Protection of China, the days on which pollution events occurred during the measurement period were categorized into three levels: 1) background days, 2) clean days, and 3) polluted days. The selected period covered 1 March–31 May, during which, as illustrated in Figure 2, pollution episodes occurred frequently, with some episodes (e.g., on 2 March) having daily maximum values of PM10 and PM2.5 that reached as much as 414 and 320 μg m−3. Background days represented the arithmetic means of variables during the measurement period apart from on days when precipitation events occurred and the 2 days for either side of those events. Daily mean PM10 concentrations higher than 150 μg m−3 for more than 48 consecutive hours and hourly PM2.5 concentrations higher than 100 μg m−3 were regarded as polluted episodes. To reduce the impacts of solar altitude and seasonal changes, four polluted cases (i.e., 2–8 March, 13–15 March, 17–20 March, and 26–27 March) in the same month were selected. In addition, clean days were defined as when the daily mean PM10 was lower than 150 μg m−3 within 5 days before and after each polluted episode. Ultimately, 20 background days (background episodes, BEs), 6 clean days (clean episodes, CEs), and 6 polluted days (polluted episodes, PEs) were obtained during 3 months (Table 2). The daily mean PM10 (PM2.5) concentrations for CEs, BEs, and PEs were 104, 124, and 234 μg m−3 (68, 91. and 184 μg m−3), respectively. Moreover, four dust cases (i.e., 8–14 March, 18–23 March, 5–11 May, and 10–15 May) were identified in the study period from the dust records of weather phenomena at the weather station, in which the ratios of PM10 and PM2.5 are combined and precipitation events are excluded.
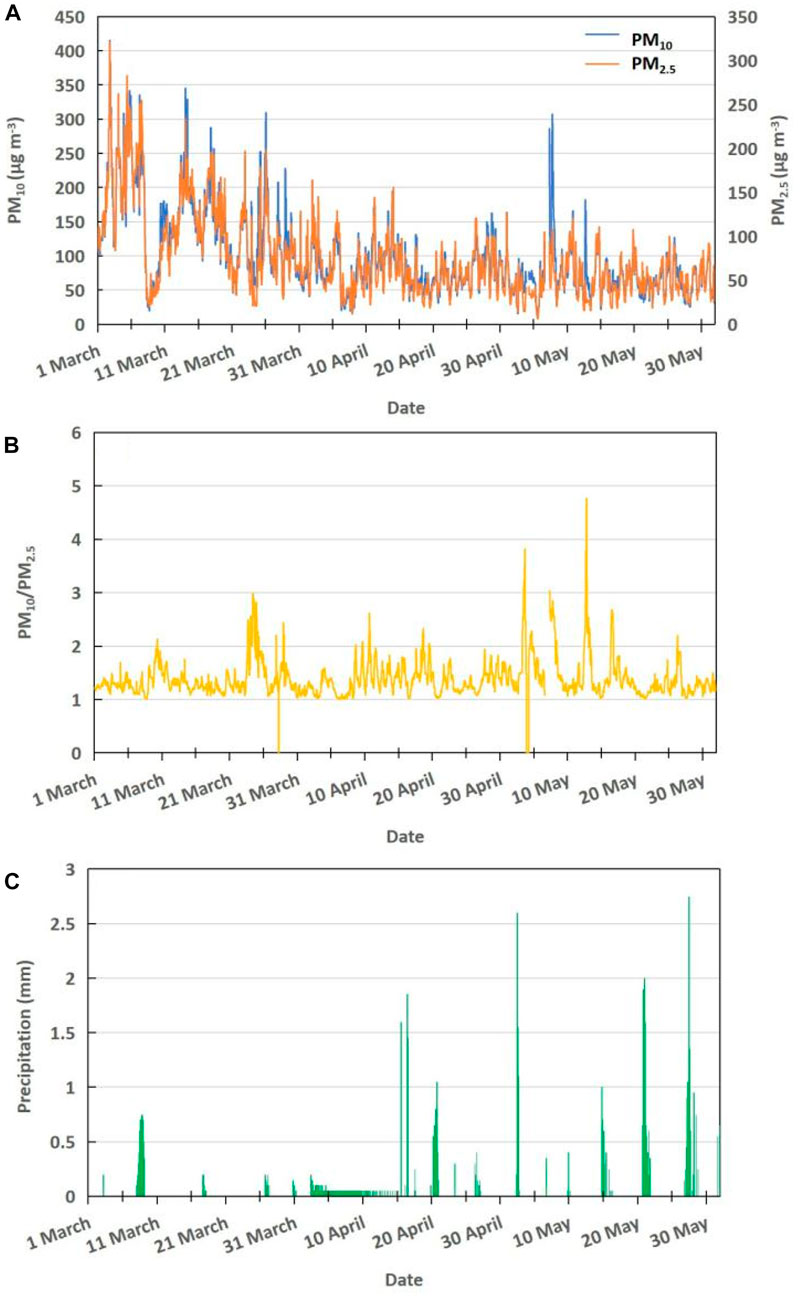
FIGURE 2. Hourly (A) mass concentrations of PM10 and PM2.5, (B) ratio of PM10 to PM2.5, and (C) precipitation during 1 March–31 May 2016.
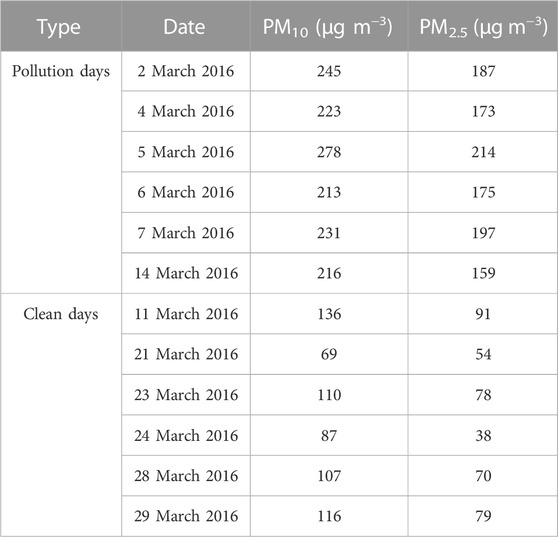
TABLE 2. Typical pollution and clean days.
As shown in Figure 3A, the wind speed and variance of vertical wind speed (σw2) had consistent diurnal variations under different pollution conditions. The wind speed fluctuated between 1.5 m s−1 during 00:00–08:00 LST (local standard time), and then increased sharply to a relatively high value (about 2.5–3.5 m s−1) at noon. After that, the wind speed began to decrease and kept at a stable value of about 1.5 m s−1 during 18:00–24:00 LST. The wind speed and σw2 were markedly different on background, clean, and polluted days. For example, the wind speed on clean days was broadly higher than that on polluted days, especially in the middle part of the day (13:00 LST; difference could be up to 1 m s−1), which was favorable for atmospheric diffusion. High-PM concentrations were mostly found under low wind speeds (about 1.7 m s−1) from the east or southeast—around 20% lower than during CEs—indicating that local sources contribute to elevated loadings of PM10 at the observatory (Figures 3B, C).
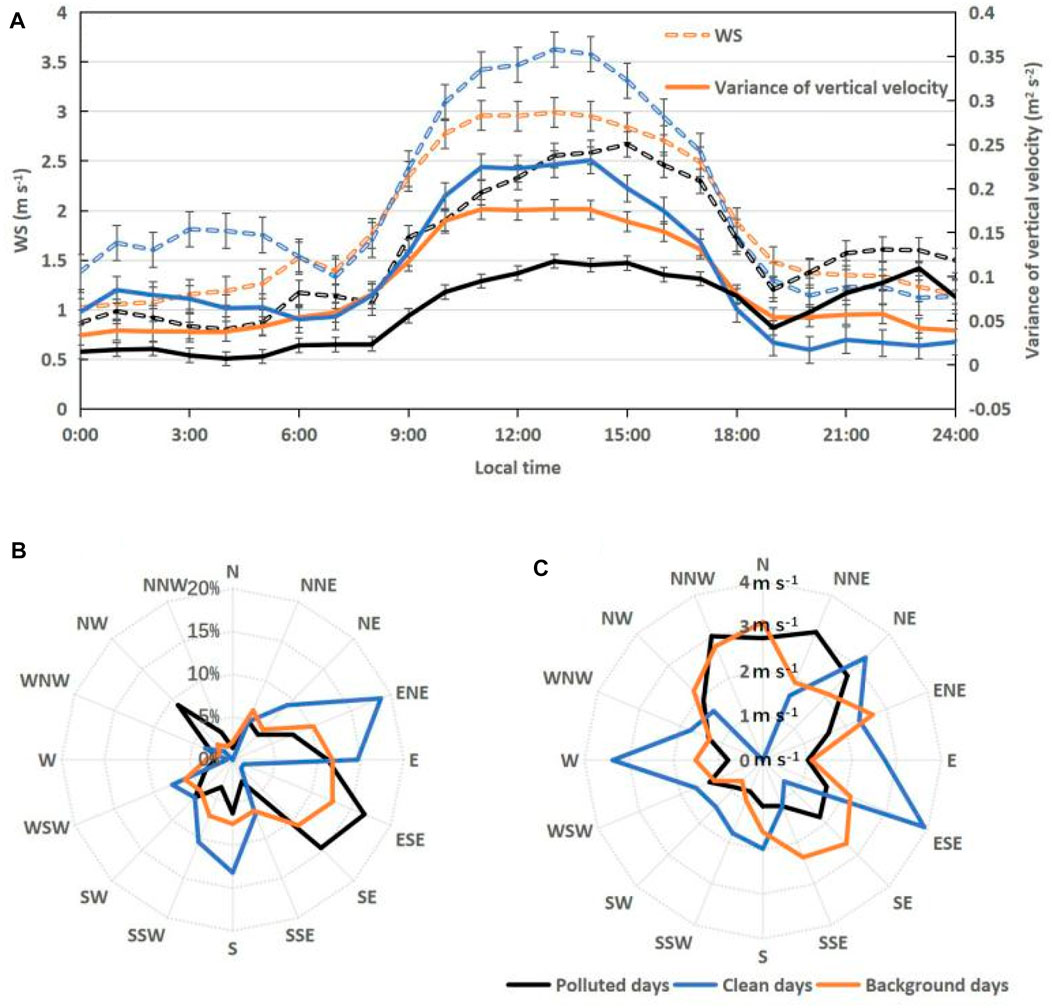
FIGURE 3. Diurnal variations of winds under three pollution levels (background, clean, and polluted days): (A) wind speed (WS) and variance of vertical velocity, (B) radar chart for wind direction, and (C) radar chart for wind speed.
The PM concentration increased with increasing of Ta (Figure 4). High Ta was induced by southeasterly winds during PEs, which would bring warm and moist air to Shouxian. In addition, the radiative warming effect due to the absorption/reflection of longwave radiation by air pollutants can lead to a high Ta (Cao et al., 2016). The daily mean RH during PEs (40%) and BEs (23%) was much higher than during CEs, indicating that high RH was conducive to the growth of aerosol hygrosorption (Peter, 1988; Hara et al., 2018).
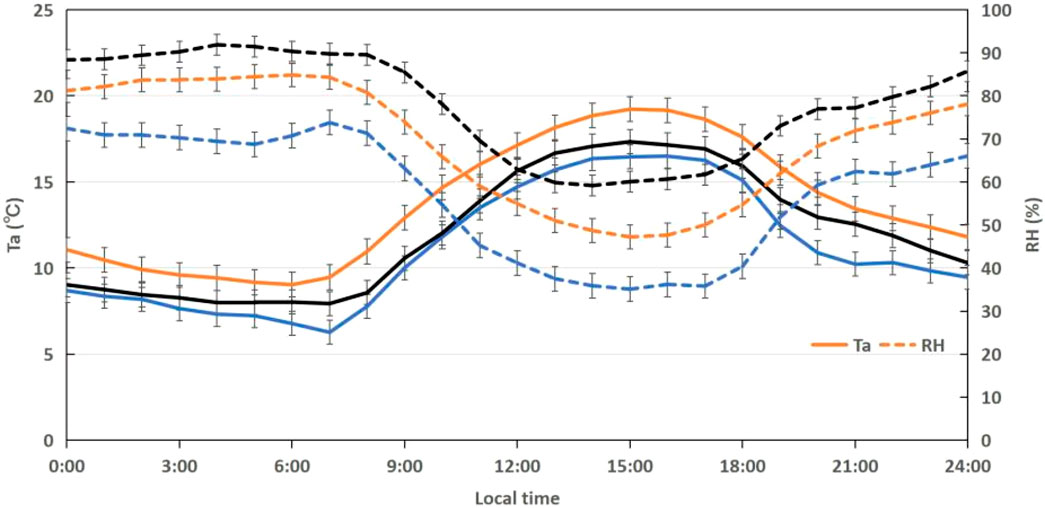
FIGURE 4. Diurnal variations of air temperature (Ta, solid lines) and relative humidity (RH, dashed lines) on heavily polluted days (black), clean days (blue), and background days (yellow).
Aerosols modulate the climate by absorbing and scattering solar radiation to alter the energy budget of the earth–atmosphere system (Wang et al., 2019). Figure 5 shows the diurnal variations in surface radiation (Rn), sensible heat flux (Hs), and latent heat flux (LE) under the PEs, CEs, and BEs in Shouxian from March to May 2016. The downward shortwave radiation (DSR) and upward shortwave radiation (USR) during PEs were much lower than during CEs (Figure 5A). The DSR on PEs decreased by 15–287 W m−2 during the daytime (07:00–18:00 LST); the attenuation rate was 28%–84% and the daily average value was 123 W m−2. Meanwhile, the USR during PEs decreased by 4–52 W m−2, with an attenuation rate of 27%–80% during the daytime. In order to eliminate the interference of cloud cover, some typical polluted days with few or no clouds were selected (Tables 3, 4). The DSR and USR during PEs with few or no clouds were also lower than those during CEs; the DSR decreased by 6–75 W m−2 during the daytime (07:00–18:00 LST), with an attenuation rate of 1%–11% (Figure 6A). The downward longwave radiation (DLR) and upward longwave radiation (ULR) showed unimodal diurnal variation. The peak of ULR was delayed by 30 min–1 h compared with the peak of DLR, reflecting the response time of the underlying surface of farmland in Shouxian County to solar radiation heating during the diurnal cycle (Figures 5B, 6B). The DLR and ULR during PEs were higher than those during CEs, with daily average differences of 13 and 4 W m−2 between PEs and CEs, respectively (Figure 5B).
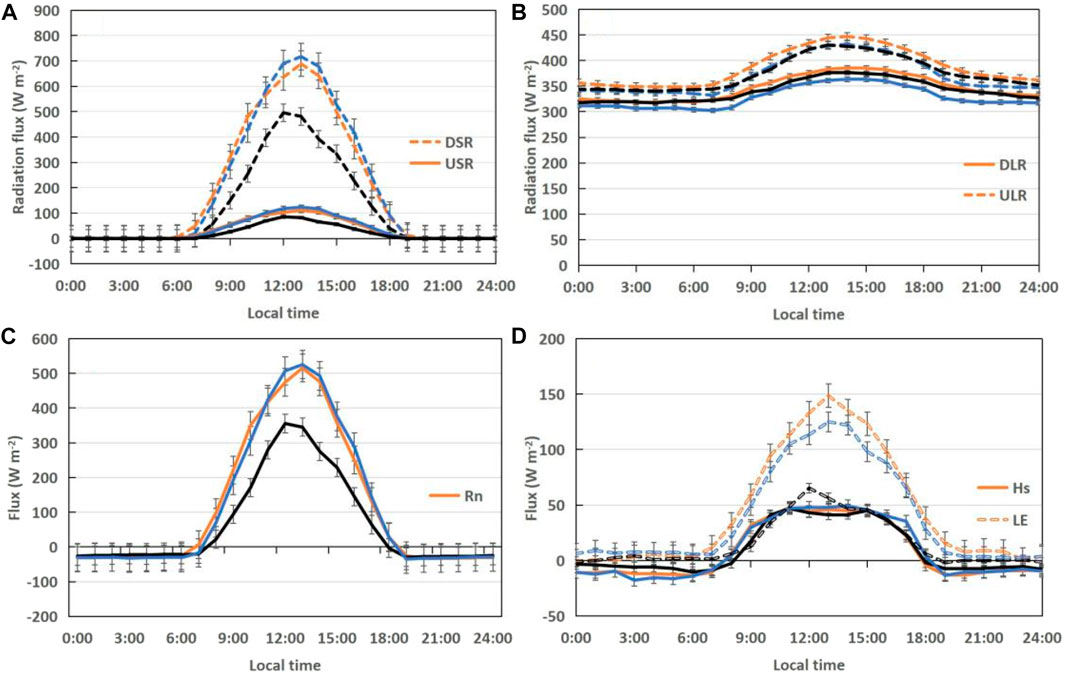
FIGURE 5. Diurnal variations in the four components of the surface energy balance under three pollution levels (background days: yellow, clean days: blue, and polluted days: black): (A) downward shortwave radiation (DSR) and upward shortwave radiation (USR), (B) downward longwave radiation (DLR) and upward longwave radiation (ULR), (C) net radiation (Rn), and (D) sensible heat flux (Hs) and latent heat flux (LE).
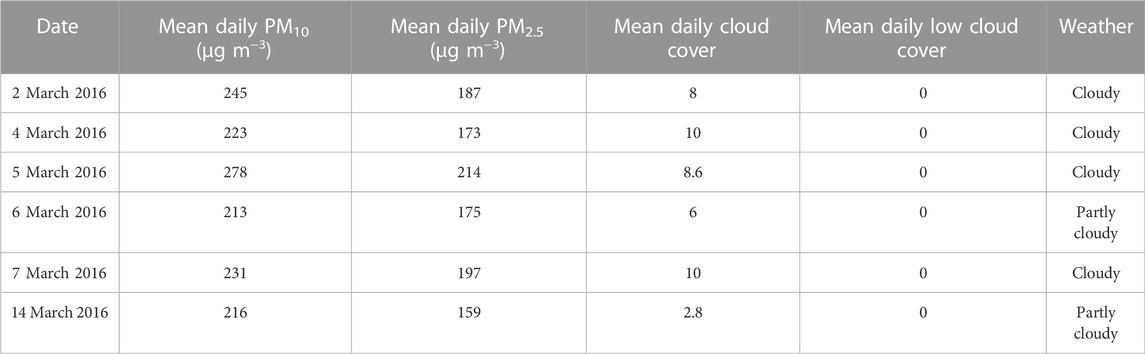
TABLE 3. Typical polluted days with clouds.
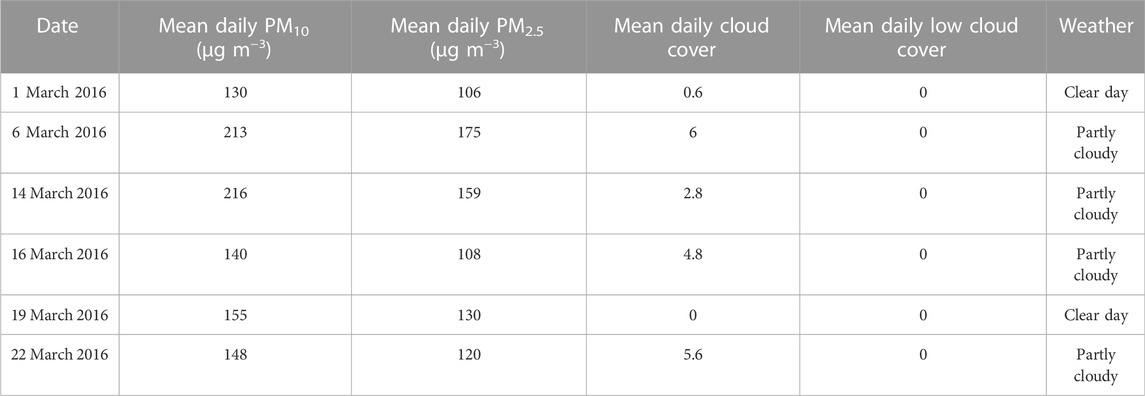
TABLE 4. Typical polluted days with few clouds or clear sky.
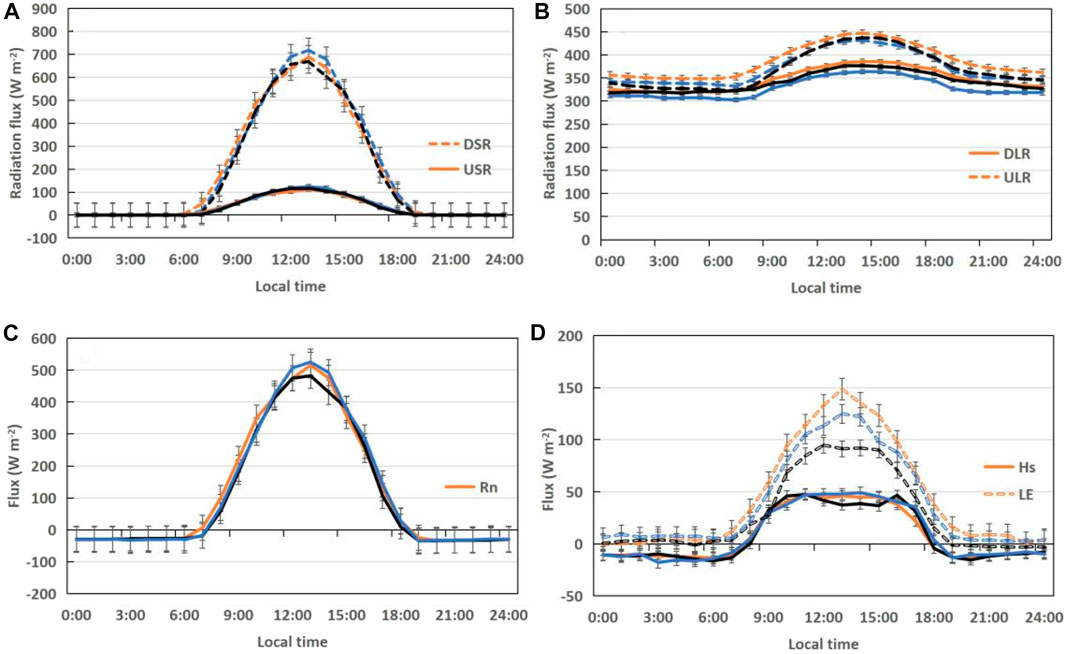
FIGURE 6. Diurnal variations in the four components of the surface energy balance under three weather conditions with less cloud or clear days (background weather—yellow, clean sky—blue, and polluted sky—black): (A) downward shortwave radiation (DSR) and upward shortwave radiation (USR), (B) downward longwave radiation (DLR) and upward longwave radiation (ULR), (C) net radiation (Rn), and (D) sensible heat flux (Hs) and latent heat flux (LE).
Under the three types of weather conditions, the trend of Rn was consistent with that of shortwave radiation (both DSR and USR), indicating that shortwave radiation was the main factor affecting Rn (Figures 5C, 6C). The Rn during the day was significantly lower during PEs than CEs with clouds (few clouds or clear days), with a peak difference of more than 100 W m−2 (61 W m−2), approaching 32% (12.5%) and a mean daily difference of 115 W m−2 (20 W m−2) (Figures 5C, 6C). In contrast, the difference in Rn between different weather conditions at night was very small, and the Rn during PEs was slightly higher than during CEs (Figures 5C, 6C). In the daytime, aerosols weakened the solar radiation reaching the ground and reduced the effective radiation at the surface. Under the combined effect of the two, the Rn was reduced, thus weakening the energy of the earth–atmosphere system and causing the ground to cool. Longwave radiation played a dominant role at night, and the existence of aerosols reflected the longwave radiation emitted by the ground and the lower atmosphere back to the surface, increasing the DLR and playing a role in thermal insulation (Figures 5B, 6B).
The diurnal variations of Hs and LE were similar to that of Rn, showing a consistent unimodal pattern (Figures 5D, 6D). The diurnal variation of Hs was comparable during BEs, PEs, and CEs with clouds (few clouds or clear days), with daytime mean values of 36, 33, and 39 W m−2 (36, 36, and 39 W m−2), respectively. LE dominated the Rn during all three types of weather conditions with clouds (few clouds or clear days), with the daytime mean LE/Rn being 32%, 21%, and 28% (32%, 24%, and 28%) for BEs, PEs, and CEs, respectively. The LE during PEs with few clouds also increased by 13 W m−2 (Figures 5D, 6D). In the daytime, the mean Bowen ratio (β = Hs/LE) was about 0.36, 0.83, and 0.44 (0.36, 0.55, and 0.44) for BEs, PEs, and CEs with much cloud (few clouds or clear days) (Figures 5D, 6D). Therefore, through comparative analysis, the reduction in aerosols changed the distribution of Rn in Hs and LE, and the effect of aerosols on LE was greater than that of Hs. However, in the urban areas of the Yangtze River Delta, the situation is on the contrary. Hs dominates Rn and aerosols had deeper influence on Hs than that on LE (Ling and Han, 2019).
The diurnal variation of LE was more obvious than that of Hs (Figures 5D, 6D). Since the underlying surface of this area is farmland, crops transpire and vegetation interacts with the atmosphere, so there is a high rate of water vapor exchange. The LE was obviously larger than the Hs (Figures 5D, 6D), which indicated that the heat exchange in this area was mainly in the form of LE, and the heat exchange by moisture was stronger than the heat exchange caused by the change in surface temperature between land and atmosphere. This was because aerosols during PEs in Shouxian reduced the transpiration rate of crops, so the LE during PEs was much less than that during CEs (Wang et al., 2021). Meanwhile, the Hs had a similar range of variation and the same trend under the three types of weather conditions, so the influence of aerosols on LE during PEs was greater than on Hs (Figures 5D, 6D).
In order to deepen the level of understanding regarding the impact of transported dust pollution on the surface energy balance over farmland in eastern China, four cases (i.e., 7–8 May, 10–11 March, 20–21 March, and 12–13 March) were selected. Here, we focus on the evolution of the atmospheric boundary layer structure during a dust pollution period (7–8 May 2016).
On 5 May, the surface PM10 concentration began to increase steadily. Starting from 13:00 LST 7 May, the PM10 concentration increased dramatically and reached up to 307 μg m−3 by 19:00 LST 7 May. The site was controlled by low pressure (∼1,001 hPa) before the occurrence of the dusty pollution (5–6 May). However, the surface air pressure increased rapidly from 12:00 LST 6 May, and then remained at a high level of 1010 hPa during 7–8 May. Thereafter, the pressure oscillated and dropped, and the concentration also gradually fell back (Figure 7A1). Similar phenomena also occurred in other dusty pollution events (Figures 7A2–A4). In addition, high wind speeds transported a lot of regional aerosol, which caused the outbreak of the dust pollution (Figures 7B1–B4). The Ta was relatively low between 16:00 LST 7 May and 02:00 LST 8 May, when PM10 concentrations remained high (Figure 7C1). After that, the PM10 concentration gradually decreased as the Ta increased. High temperatures accelerate evaporation from rivers, resulting in high RH, which inhibits the occurrence of dust pollution. High RH can increase the viscosity of the near-surface air and sand, which further inhibits the occurrence of dust pollution (Chang et al., 2012). As shown in Figures 7D1–D4, RH at about 50% was able to inhibit the occurrence of dust pollution. Meanwhile, the RH was relatively low (daily mean: 69%) during the dust events (Figure 7C1). Therefore, high air pressure, low Ta, and low RH co-induced the formation, maintenance, and dissipation of dust pollutants.
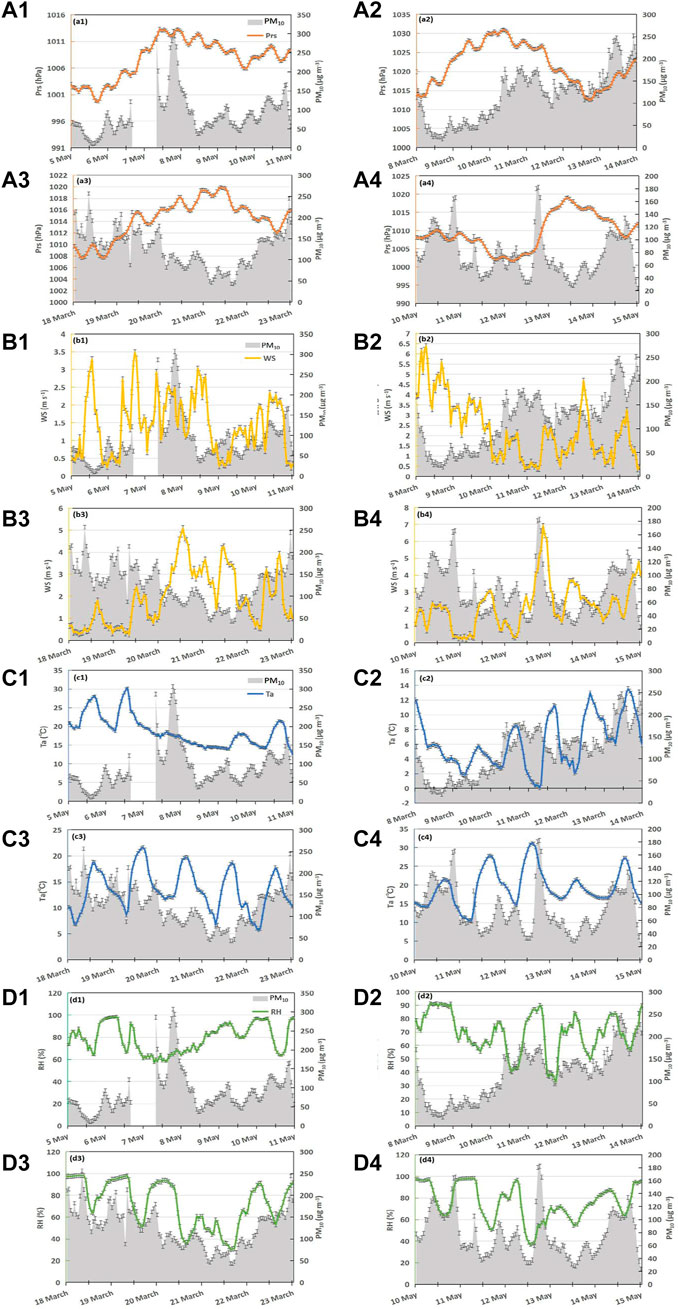
FIGURE 7. Daily variations in surface micrometeorological conditions during dust pollution periods: (A1–A4) air pressure (Prs), (B1–B4) wind speed (WS), (C1−C4) air temperature (Ta), and (D1−D4) relative humidity (RH). The gray-shaded region in each panel is the PM10 concentration.
As can be seen in Figure 8A1–A4, the shortwave radiation during the dust pollution periods was significantly lower than on clean days. For example, the downward radiation at noon on 7 May was approximately 481 W m−2, lower than the value of 657 W m−2 on 6 May. During the process of dust pollution, the surface effective radiation decreased obviously under the effect of aerosol. The Rn at noon on 7 May had decreased by 385 W m−2 compared with the previous day. As can be seen from Figures 8B1–B4,C1–C4, the Hs and LE also weakened as the Rn decreased. Compared to the clean days beforehand, the Hs and LE decreased by 3 and 35 W m−2, respectively, during dust pollution days. In addition, the proportion of Hs and LE in Rn also reduced, by 43% and 49%, respectively. Hence, an outbreak of dust pollution has a greater impact on LE. Dust pollution weakens crop photosynthesis and transpiration, which further reduces the surface–atmosphere exchanges of water, energy, and carbon dioxide.
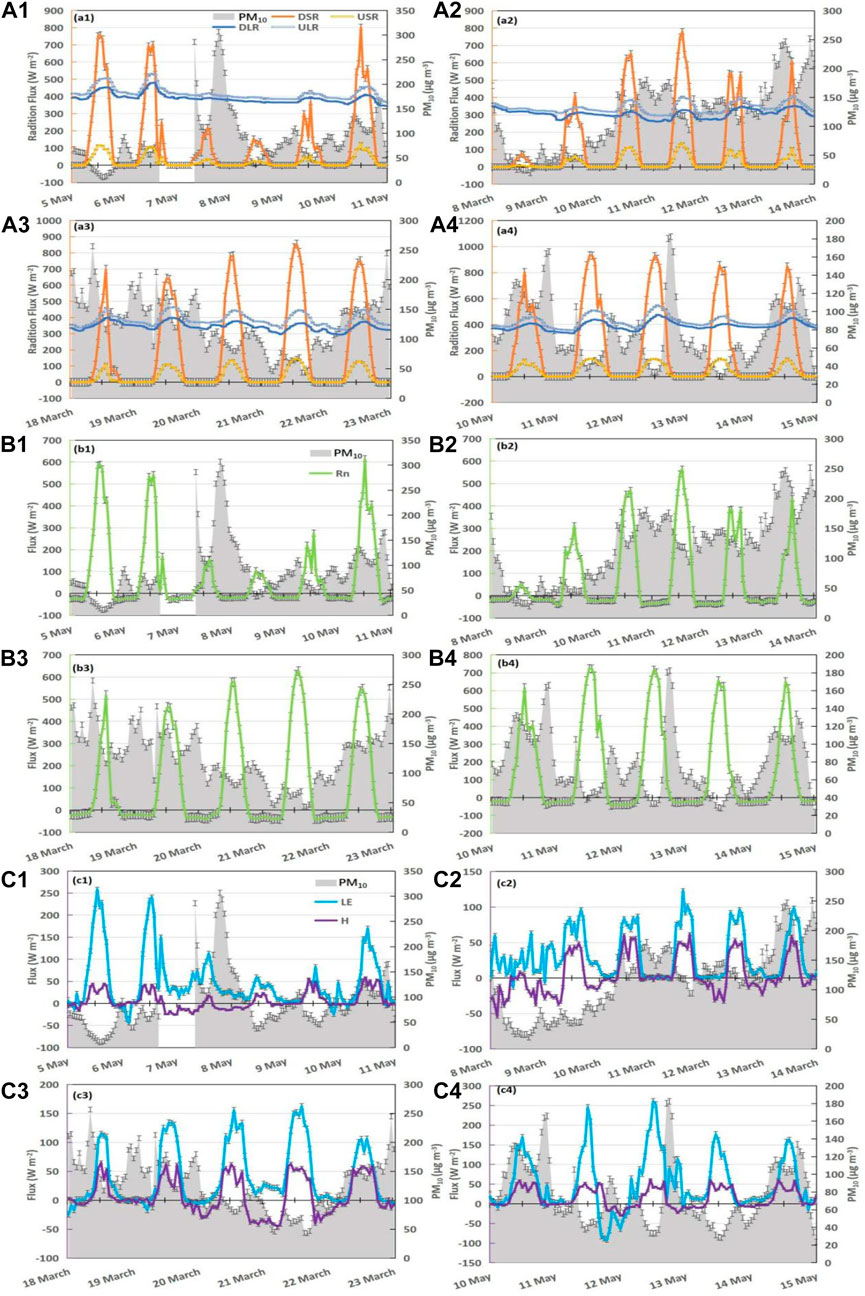
FIGURE 8. Daily variation in the surface energy budget during dust pollution periods: (A1–A4) the four radiation components (DSR, downward shortwave radiation; USR, upward shortwave radiation; DLR, downward longwave radiation; and ULR, upward longwave radiation), (B1–B4) net radiation flux (Rn), and (C1–C4) sensible heat flux (Hs) and latent heat flux (LE). The gray-shaded region in each panel is the PM10 concentration.
Previous studies have reported that PM concentrations are closely related to dynamic factors in the near-surface layer (Zhang et al., 2015; Miao et al., 2018). Figure 9 shows the response of surface dynamic factors (vertical velocity and covariance of vertical velocity and horizontal wind components) during the dust pollution episodes. The variance of vertical velocity (σw2) showed an obvious unimodal pattern of diurnal variation, and the diurnal maximum appeared at noon. The highest σw2 (0.27 m2 s−2) occurred at 18:00 LST 6 May. Then, σw2 declined slowly until 8 May, with the maximum daytime value of 0.16 m2 s−2 occurring at 19:00 LST (PM10 larger than 300 μg m−3 during this period). This turbulence transported the PM accumulated in the residual layer downwards to the lower levels, resulting in the later cumulative stage of PM (Halios and Barlow, 2018).
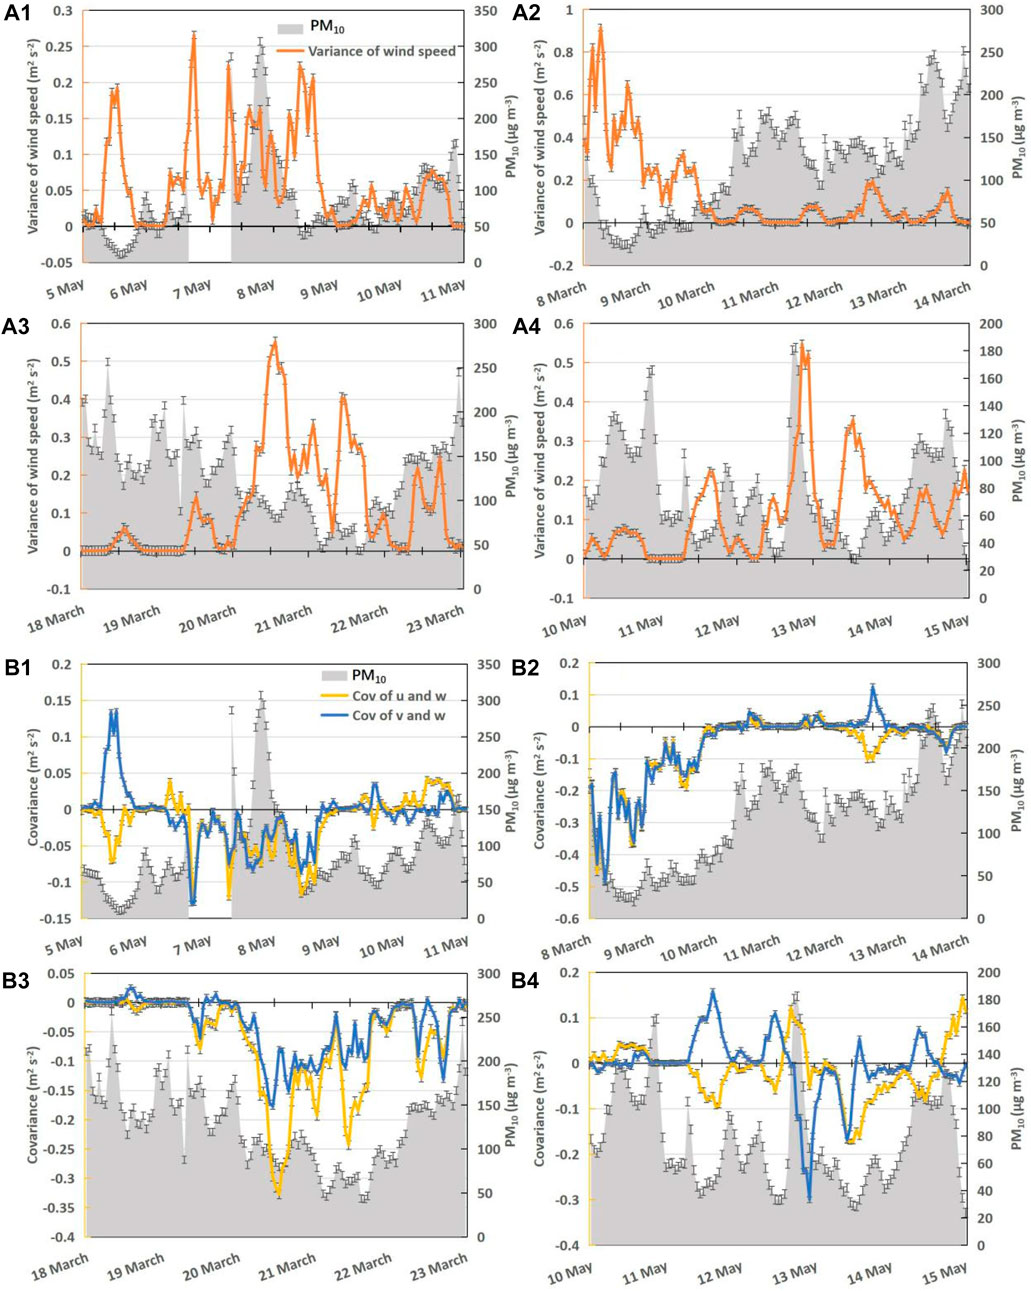
FIGURE 9. Daily variations in surface dynamic factors during dust pollution periods: (A1–A4) vertical velocity variance and (B1−B4) covariance of vertical velocity (w) and horizontal wind components (u, v). The gray-shaded region in each panel is the PM10 concentration.
Figure 9B shows the covariance of the vertical velocity and the horizontal wind component. There was a clear positive correlation between the southeasterly wind component and the vertical velocity before the outbreak of the pollution process. Southeasterly winds promoted the transport of pollutants to Shouxian. The enhanced downdraft and the increased vertical momentum flux caused the downward transport of pollutants over Shouxian, leading to rapid accumulation and mixing of pollutants in the area (Figure 9B). The horizontal winds and vertical velocity jointly changed the aerosol concentration. From 7 to 8 May, the covariance of the vertical velocity and the horizontal wind component was negative (around −0.05 m2 s−2), indicating that the vertical velocity and horizontal wind component changed in the opposite direction. The horizontal wind component became larger and the vertical velocity became smaller. Eventually, these factors led to the occurrence of dust pollution in this area. The decrease in air pressure and wind speed led to a rapid decrease in the PM10 concentration on 8 May, which also resulted in a continuous decrease in the covariance between the horizontal wind component and the vertical velocity. At this moment, the degree of reversal in the vertical velocity and horizontal wind component became more pronounced. The rapid increase in vertical velocity and decrease in the horizontal component prompted dust floating in the air to be deposited downwards, and thus, the pollution process was weakened.
There are differences in composition and size among different aerosol types. In terms of composition, absorptive and scattering aerosols differ in their effects on radiation and energy balance. For example, absorbing aerosol dominated by black carbon has strong absorbing properties, which induce both prominent surface cooling and near-surface warming. Scattering aerosols are dominated by sulfate, which has a strong scattering capacity and cools the surface to result in a weaker near-surface warming (Gu et al., 2006; Ding et al., 2016; Huang et al., 2018; Zhu et al., 2018; Yang et al., 2020b).
In addition, the size of aerosol particles also affects the radiation budget (Tegen and Lacis, 1996; Murphy et al., 2021), but there is no way to quantitatively distinguish the corresponding relationship between radiation and particle size when measuring radiation. Therefore, mainly, the differences in radiation and energy balance are compared by taking the PM2.5 as the primary pollutant under the eastern region’s background and the PM10 transported from a distance. However, the meteorological factors under the two different backgrounds also bear some differences, so they too will bring some errors to the contributions of different aerosol species to the effect on the surface energy balance over farmland. Sensitivity tests with more precise observations and numerical simulations will be conducted in the future.
Based on the meteorological observations, and measurements of radiation and turbulent flux in Shouxian between 1 March and 31 May 2016, meteorological factors and the surface energy balance were analyzed under different air pollution levels. The main conclusions can be summarized as follows:
1) Compared to clean days, polluted days had high RH, low wind speeds, and low air pressure. Weak wind speed had an inhibitory effect on the diffusion of pollutants. The high RH was conducive to the growth of aerosol hygroscopicity.
2) Compared with the DSR, USR, DLR, and ULR in the daytime during CEs, the attenuation ratios during PEs were about 46%, 46%, 4%, and 1%, respectively, which mainly caused a 33% reduction in Rn.
3) During the whole observation period, the range of diurnal variation of Hs and LE was diminished on highly polluted days. PEs had 15% (58%) less sensible (latent) heat flux than CEs. This resulted in a higher daytime Bowen ratio during PEs (0.83) than CEs (0.44).
4) In Shouxian, sandstorms occur frequently in spring. A sharp increase from low pressure to high pressure (1005–1010 hPa) and the continuation of high pressure cause outbreaks of dust pollution. On dust polluted days, Hs was reduced by 43% and LE by 49%. The influence of aerosol on LE was greater than that on Hs during both typical PEs and dust PEs.
The present study demonstrates that the aerodynamic and thermodynamic conditions in the atmospheric boundary layer are mainly modulated by local aerosol and transported dust pollution. This has important implications for the surface energy balance across the land–atmosphere interactions over farmland regions, which are experiencing frequent aerosol pollution from local emissions and transboundary dust events.
The raw data supporting the conclusion of this article will be made available by the authors, without undue reservation.
Conceptualization: YY; methodology and software: CZ; formal analysis: CZ, ZD, XL, and YY; data curation: CZ, ZD, and XL; writing—original draft preparation: CZ; writing—review and editing: CZ, ZD, XL, and YY; supervision: YY; and funding acquisition: YY. All authors have read and agreed to the submitted version of the manuscript.
This study was supported by the National Natural Science Foundation of China (42222503).
The authors thank all the scientists, engineers, and students who participated in the field experiments, maintained the instruments, and processed the measurements. They acknowledge the High Performance Computing Center of Nanjing University of Information Science and Technology for their support in this work.
The authors declare that the research was conducted in the absence of any commercial or financial relationships that could be construed as a potential conflict of interest.
All claims expressed in this article are solely those of the authors and do not necessarily represent those of their affiliated organizations, or those of the publisher, the editors, and the reviewers. Any product that may be evaluated in this article, or claim that may be made by its manufacturer, is not guaranteed or endorsed by the publisher.
Brown, H., Liu, X., Feng, Y., Jiang, Y., Wu, M., Lu, Z., et al. (2018). Radiative effect and climate impacts of Brown carbon with the Community Atmosphere Model (CAM5). Atmos. Chem. Phys. 18 (24), 17745–17768. doi:10.5194/acp-18-17745-2018
Cao, C., Lee, X., Liu, S., Schultz, N., Xiao, W., Zhang, M., et al. (2016). Urban heat islands in China enhanced by haze pollution. Nat. Commun. 7 (1), 12509. doi:10.1038/ncomms12509
Chang, Z., Wang, Y., Han, F., and Zhong, S. (2012). Relationship between frequency of sandstorms and air humidity as well as plant phenology: A case study from the minqin desert area. Acta eco. Sin. 32, 1378–1386. doi:10.5846/stxb201101100041
Chen, C., Li, D., Gao, Z., Tang, J., Guo, X., Wang, L., et al. (2015). Seasonal and interannual variations of carbon exchange over a rice-wheat rotation system on the North China Plain. Adv. Atmos. Sci. 32 (10), 1365–1380. doi:10.1007/s00376-015-4253-1
Ding, A. J., Fu, C. B., Yang, X. Q., Sun, J. N., Petäjä, T., Kerminen, V. M., et al. (2013). Intense atmospheric pollution modifies weather: A case of mixed biomass burning with fossil fuel combustion pollution in eastern China. Atmos. Chem. Phys. 13 (20), 10545–10554. doi:10.5194/acp-13-10545-2013
Ding, A. J., Huang, X., Nie, W., Sun, J. N., Kerminen, V. M., Petäjä, T., et al. (2016). Enhanced haze pollution by black carbon in megacities in China. Geophys. Res. Lett. 43 (6), 2873–2879. doi:10.1002/2016GL067745
Ding, X., Kong, L., Du, C., Zhanzakova, A., Wang, L., Fu, H., et al. (2017). Long-range and regional transported size-resolved atmospheric aerosols during summertime in urban Shanghai. Sci. Total Environ. 583, 334–343. doi:10.1016/j.scitotenv.2017.01.073
Duan, Z., Gao, Z., Xu, Q., Zhou, S., Qin, K., and Yang, Y. (2022). A benchmark dataset of diurnal- and seasonal-scale radiation, heat, and CO2 fluxes in a typical East Asian monsoon region. Earth Syst. Sci. Data 14 (9), 4153–4169. doi:10.5194/essd-14-4153-2022
Duan, Z., Yang, Y., Wang, L., Liu, C., Fan, S., Chen, C., et al. (2021). Temporal characteristics of carbon dioxide and ozone over a rural-cropland area in the Yangtze River Delta of eastern China. Sci. Total Environ. 757, 143750. doi:10.1016/j.scitotenv.2020.143750
Fan, S., Gao, Z., Kalogiros, J., Li, Y., Yin, J., and Li, X. (2019). Estimate of boundary-layer depth in Nanjing city using aerosol lidar data during 2016-2017 winter. Atmos. Environ. 205, 67–77. doi:10.1016/j.atmosenv.2019.02.022
Fan, X., Chen, H., Xia, X., Li, Z., and Cribb, M. (2010). Aerosol optical properties from the atmospheric radiation measurement mobile facility at shouxian, China. J. Geophys. Res. 115 (D7), D00K33. doi:10.1029/2010JD014650
Gao, Z., Bian, L., and Zhou, X. (2003). Measurements of turbulent transfer in the near-surface layer over a rice paddy in China. J. Geophys. Res. 108 (D13), 2779. doi:10.1029/2002JD002779
Gao, Z., Lenschow, D. H., He, Z., and Zhou, M. (2009). Seasonal and diurnal variations in moisture, heat and CO2 fluxes over a typical steppe prairie in Inner Mongolia, China. Hydrol. Earth Sys. Sci. 13 (7), 987–998. doi:10.5194/hess-13-987-2009
Gu, Y., Liou, K. N., Xue, Y., Mechoso, C. R., Li, W., and Luo, Y. (2006). Climatic effects of different aerosol types in China simulated by the UCLA general circulation model. J. Geophys. Res. 111 (D15), D15201. doi:10.1029/2005jd006312
Gu, Y., Wong, T. W., Law, C. K., Dong, G. H., Ho, K. F., Yang, Y., et al. (2018). Impacts of sectoral emissions in China and the implications: Air quality, public health, crop production, and economic costs. Environ. Res. Lett. 13 (8), 084008. doi:10.1088/1748-9326/aad138
Guo, J., Miao, Y., Zhang, Y., Liu, H., Li, Z., Zhang, W., et al. (2016). The climatology of planetary boundary layer height in China derived from radiosonde and reanalysis data. Atmos. Chem. Phys. 16 (20), 13309–13319. doi:10.5194/acp-16-13309-2016
Halios, C. H., and Barlow, J. F. (2018). Observations of the morning development of the urban boundary layer over london, UK, taken during the ACTUAL project. Boundary-Layer Meteorol. 166 (3), 395–422. doi:10.1007/s10546-017-0300-z
Hamanaka, R. B., and Mutlu, G. M. (2018). Particulate matter air pollution: Effects on the cardiovascular system. Front. Endocrinol. 9, 680. doi:10.3389/fendo.2018.00680
Han, Y., Wang, T., Tang, J., Wang, C., Jian, B., Huang, Z., et al. (2022). New insights into the Asian dust cycle derived from CALIPSO lidar measurements. Remote Sens. Environ. 272, 112906. doi:10.1016/j.rse.2022.112906
Hara, Y., Nishizawa, T., Sugimoto, N., Osada, K., Yumimoto, K., Uno, I., et al. (2018). Retrieval of aerosol components using multi-wavelength mie-Raman lidar and comparison with ground aerosol sampling. Remote Sens. 10 (6), 937. doi:10.3390/rs10060937
Hu, R., Wang, H., Yin, Y., Chen, K., Zhu, B., Zhang, Z., et al. (2018). Mixing state of ambient aerosols during different fog-haze pollution episodes in the Yangtze River Delta, China. Atmos. Environ. 178, 1–10. doi:10.1016/j.atmosenv.2018.01.032
Huang, X., Wang, Z., and Ding, A. (2018). Impact of aerosol-PBL interaction on haze pollution: Multiyear observational evidences in North China. Geophys. Res. Lett. 45 (16), 8596–8603. doi:10.1029/2018gl079239
Jacobson, M. Z., Kaufman, Y. J., and Rudich, Y. (2007). Examining feedbacks of aerosols to urban climate with a model that treats 3-D clouds with aerosol inclusions. J. Geophys. Res. 112 (D24), D24205. doi:10.1029/2007JD008922
Jin, H., Chen, X., Zhong, R., and Duan, K. (2022). Frequency analysis of extreme precipitation in different regions of the Huaihe River Basin. Intl. J. Climatol. 42 (6), 3517–3536. doi:10.1002/joc.7430
Jin, M., and Shepherd, J. M. (2008). Aerosol relationships to warm season clouds and rainfall at monthly scales over east China: Urban land versus ocean. J. Geophys. Res. 113 (D24), D24S90. doi:10.1029/2008JD010276
Kang, H., Zhu, B., Su, J., Wang, H., Zhang, Q., and Wang, F. (2013). Analysis of a long-lasting haze episode in Nanjing, China. Atmos. Res. 120-121, 78–87. doi:10.1016/j.atmosres.2012.08.004
Li, J., Sun, J., Zhou, M., Cheng, Z., Li, Q., Cao, X., et al. (2018). Observational analyses of dramatic developments of a severe air pollution event in the Beijing area. Atmos. Chem. Phys. 18 (6), 3919–3935. doi:10.5194/acp-18-3919-2018
Ling, X., and Han, X. (2019). Aerosol impacts on meteorological elements and surface energy budget over an urban cluster region in the Yangtze River delta. Aerosol and Air Qual. Res. 19 (5), 1040–1055. doi:10.4209/aaqr.2017.12.0602
Liu, J., Zheng, Y., Li, Z., Flynn, C., Welton, E. J., and Cribb, M. (2011). Transport, vertical structure and radiative properties of dust events in southeast China determined from ground and space sensors. Atmos. Environ. 45 (35), 6469–6480. doi:10.1016/j.atmosenv.2011.04.031
Liu, T. H., Tsai, F., Hsu, S. C., Hsu, C. W., Shiu, C. J., Chen, W. N., et al. (2009). Southeastward transport of Asian dust: Source, transport and its contributions to Taiwan. Atmos. Environ. 43 (2), 458–467. doi:10.1016/j.atmosenv.2008.07.066
Miao, Y., Guo, J., Liu, S., Zhao, C., Li, X., Zhang, G., et al. (2018). Impacts of synoptic condition and planetary boundary layer structure on the trans-boundary aerosol transport from Beijing-Tianjin-Hebei region to northeast China. Atmos. Environ. 181, 1–11. doi:10.1016/j.atmosenv.2018.03.005
Murphy, D. M., Froyd, K. D., Bourgeois, I., Brock, C. A., Kupc, A., Peischl, J., et al. (2021). Radiative and chemical implications of the size and composition of aerosol particles in the existing or modified global stratosphere. Atmos. Chem. Phys. 21 (11), 8915–8932. doi:10.5194/acp-21-8915-2021
Peter, W. (1988). The growth of atmospheric aerosol particles with relative humidity. Phys. Scr. 37 (2), 223–230. doi:10.1088/0031-8949/37/2/008
Shao, M., Tang, X., Zhang, Y., and Li, W. (2006). City clusters in China: Air and surface water pollution. Front. Ecol. Environ. 4 (7), 353–361. doi:10.1890/1540-9295(2006)004[0353:ccicaa]2.0.co;2:ccicaa]2.0.co;2
Shen, X. J., Sun, J. Y., Zhang, X. Y., Zhang, Y. M., Zhang, L., Che, H. C., et al. (2015). Characterization of submicron aerosols and effect on visibility during a severe haze-fog episode in Yangtze River Delta, China. Atmos. Environ. 120, 307–316. doi:10.1016/j.atmosenv.2015.09.011
Tanaka, H., Hiyama, T., Yamamoto, K., Fujinami, H., Shinoda, T., Higuchi, A., et al. (2007). Surface flux and atmospheric boundary layer observations from the LAPS project over the middle stream of the Huaihe River basin in China. Hydrol. Process. 21 (15), 1997–2008. doi:10.1002/hyp.6706
Tegen, I., and Lacis, A. A. (1996). Modeling of particle size distribution and its influence on the radiative properties of mineral dust aerosol. J. Geophys. Res. 101 (D14), 19237–19244. doi:10.1029/95JD03610
Wang, B., Wang, Z., Wang, C., Wang, X., Li, J., Jia, Z., et al. (2021). Field evidence reveals conservative water use of poplar saplings under high aerosol conditions. J. Ecol. 109 (5), 2190–2202. doi:10.1111/1365-2745.13633
Wang, H., Li, J., Gao, M., Chan, T.-C., Gao, Z., Zhang, M., et al. (2020a). Spatiotemporal variability in long-term population exposure to PM2.5 and lung cancer mortality attributable to PM2.5 across the yangtze river delta (yrd) region over 2010–2016: A multistage approach. Chemosphere 257, 127153. doi:10.1016/j.chemosphere.2020.127153
Wang, L., Fan, S., Hu, F., Miao, S., Yang, A., Li, Y., et al. (2020b). Vertical gradient variations in radiation budget and heat fluxes in the urban boundary layer: A comparison study between polluted and clean air episodes in beijing during winter. JGR. Atmos. 125 (14), e2020JD032478. doi:10.1029/2020JD032478
Wang, L., Liu, J., Gao, Z., Li, Y., Huang, M., Fan, S., et al. (2019). Vertical observations of the atmospheric boundary layer structure over Beijing urban area during air pollution episodes. Atmos. Chem. Phys. 19 (10), 6949–6967. doi:10.5194/acp-19-6949-2019
Wang, Y., Meng, Z., Lyu, R., Huang, G., He, Q., and Cheng, T. (2020c). Spatiotemporal changes of surface solar radiation: Implication for air pollution and rice yield in East China. Sci. Total Environ. 739, 140361. doi:10.1016/j.scitotenv.2020.140361
Xiong, C., Li, J., Liu, Z., and Zhang, Z. (2022). The dominant role of aerosol-cloud interactions in aerosol-boundary layer feedback: Case studies in three megacities in China. Front. Environ. Sci. 10, 2412. doi:10.3389/fenvs.2022.1002412
Xu, Y., Sun, H., and Ji, X. (2021). Spatial-temporal evolution and driving forces of rainfall erosivity in a climatic transitional zone: A case in Huaihe River Basin, eastern China. CATENA 198, 104993. doi:10.1016/j.catena.2020.104993
Yang, Y., Yim, S. H. L., Haywood, J., Osborne, M., Chan, J. C. S., Zeng, Z., et al. (2019). Characteristics of heavy particulate matter pollution events over Hong Kong and their relationships with vertical wind profiles using high-time-resolution Doppler lidar measurements. J. Geophys. Res. Atmos. 124 (16), 9609–9623. doi:10.1029/2019JD031140
Yang, Y., Zhang, M., Li, Q., Chen, B., Gao, Z., Ning, G., et al. (2020a). Modulations of surface thermal environment and agricultural activity on intraseasonal variations of summer diurnal temperature range in the Yangtze River Delta of China. Sci. Total Environ. 736, 139445. doi:10.1016/j.scitotenv.2020.139445
Yang, Y., Zheng, Z., Yim, S. Y. L., Roth, M., Ren, G., Gao, Z., et al. (2020b). PM2.5 pollution modulates wintertime urban heat island intensity in the beijing-tianjin-hebei megalopolis, China. Geophys. Res. Lett. 47 (1), e2019GL084288. doi:10.1029/2019GL084288
Yin, J., Gao, C. Y., Hong, J., Gao, Z., Li, Y., Li, X., et al. (2019). Surface meteorological conditions and boundary layer height variations during an air pollution episode in nanjing, China. J. Geophys. Res. Atmos. 124 (6), 3350–3364. doi:10.1029/2018JD029848
Zhang, H., Wang, Y., Hu, J., Ying, Q., and Hu, X. M. (2015). Relationships between meteorological parameters and criteria air pollutants in three megacities in China. Environ. Res. 140, 242–254. doi:10.1016/j.envres.2015.04.004
Zhang, R., Li, Q., and Zhang, R. (2014). Meteorological conditions for the persistent severe fog and haze event over eastern China in January 2013. Sci. China Earth Sci. 57 (1), 26–35. doi:10.1007/s11430-013-4774-3
Zhu, S., Zhang, H., Wei, X., and Yang, D. (2018). Simulation of aerosol influences on shortwave radiative flux under different pollution conditions (in Chinese). Acta Meteorol. Sin. 76 (5), 790–802. doi:10.11676/qxxb2018.031
Keywords: dust pollution, aerosol, meteorological factors, surface energy balance, farmland
Citation: Zhou C, Duan Z, Ling X and Yang Y (2023) Effects of local aerosol and transported dust pollution on the surface energy balance over farmland in eastern China during spring. Front. Environ. Sci. 10:1059292. doi: 10.3389/fenvs.2022.1059292
Received: 01 October 2022; Accepted: 06 December 2022;
Published: 10 January 2023.
Edited by:
Zhiyuan Hu, School of Atmospheric Sciences, Sun Yat-sen University, ChinaReviewed by:
Ming Chang, Jinan University, ChinaCopyright © 2023 Zhou, Duan, Ling and Yang. This is an open-access article distributed under the terms of the Creative Commons Attribution License (CC BY). The use, distribution or reproduction in other forums is permitted, provided the original author(s) and the copyright owner(s) are credited and that the original publication in this journal is cited, in accordance with accepted academic practice. No use, distribution or reproduction is permitted which does not comply with these terms.
*Correspondence: Yuanjian Yang, eXlqMTk4NUBudWlzdC5lZHUuY24=
†These authors have contributed equally to this work and share first authorship
Disclaimer: All claims expressed in this article are solely those of the authors and do not necessarily represent those of their affiliated organizations, or those of the publisher, the editors and the reviewers. Any product that may be evaluated in this article or claim that may be made by its manufacturer is not guaranteed or endorsed by the publisher.
Research integrity at Frontiers
Learn more about the work of our research integrity team to safeguard the quality of each article we publish.