 Xu Xuexian
 Peng Yuling
 Qin Wenjie2
94% of researchers rate our articles as excellent or good
Learn more about the work of our research integrity team to safeguard the quality of each article we publish.
Find out more
ORIGINAL RESEARCH article
Front. Environ. Sci., 10 January 2023
Sec. Land Use Dynamics
Volume 10 - 2022 | https://doi.org/10.3389/fenvs.2022.1058792
Introduction: In recent years, Laos, with its unique geographical advantages, has vigorously developed overseas trade and cultural tourism industry, which has promoted local economic development and introduced numerous ecological and environmental problems.
Method: Therefore, this research took Savan District as the research area, built the landscape ecological risk assessment model to reveal the spatiotemporal evolution characteristics of Savan District’s ecological risk from 2000 to 2020. Then, the Geodetector model was utilized to explain the driving forces behind changes in the landscape’s ecological risk. Finally, the Markov-PLUS coupling model was used to simulate and predict the changes in the land use pattern and ecological risk in the Savan District in 2030.
Results: The following results are presented. 1) The landscape types in Savan District are mainly cultivated land and forest land, with the lowest degree of landscape fragmentation and loss, and the highest degree of landscape loss in unused land. 2) From 2000 to 2020, the average ecological risk index of the whole study area was low and showed a decreasing trend yearly, with the area of low-risk areas accounting for more than 90%. 3) In 2030, the average ecological risk index of the entire Savan District and the two provinces will rise, meanwhile the low-risk areas in the midwest regions and high-risk areas in the northwest will increase.
Discussion: This study can guide the future coordinated development of the social economy and ecological environment in Savan District, Laos, and has good reference significance for ecological construction in similar areas in Southeast Asia.
The ecological environment is the basic space for human survival and the prerequisite for social and economic development, which relates to the health and sustainable development of the entire society. Since the 21st century, with the deepening development of urbanisation, human beings vigorously developed the economy and exploited the Earth’s resources, which inevitably caused a series of ecological and environmental problems, such as the destruction of forest resources, soil erosion, desertification, urban smog, drought, flooding, water pollution, imbalance of soil acidity and alkalinity and exhaustion of natural resources (Gao et al., 2011; Mondal et al., 2021). Therefore, judging and simulating the ecological risk level scientifically and accurately is highly valued in the research of global ecological environment protection and is important reference for formulating ecological environment protection and prevention policies.
Ecological risk is used to measure the adverse effects and losses of ecosystems in the face of external environmental changes and human activities (Peng et al., 2015). Strengthening the assessment of landscape ecological risks, preventing and defusing major risks in the ecological environment and improving the early warning capability of potential ecological risks are currently the urgent tasks of human ecological civilisation construction. In 1994, the Committee on Risk Assessment Methods defined a comprehensive framework for ecological risk assessment, which comprises four parts: hazard identification, exposure assessment, exposure–response assessment and risk characterisation; the committee also introduced remarkably detailed guiding suggestions on the problems to be solved, research needs and research mechanisms in ecological risk assessment (Barnthouse, 1994). In 2001, Kapustka et al. (2016) found that land use change could have considerable adverse effects on the ecological risk assessment of wildlife habitats and proposed to bring landscape ecology into the ecological risk assessment process, which was expected to improve the ecological risk assessment and provide valuable information. In 2004, Ferrarini published the Ecological Risk Assessment Through Landscape Science Approaches, indicating that the impact of land use policy on the risk of biological integrity should be studied in accordance with the “natural value” and “vulnerability” by constructing the risk assessment of landscape biological integrity and combining the indicators related to human disturbance (Ferrarini, 2004).
Global academic research on ecological risk is mainly divided into environmental science (Min et al., 2013; Xu Q. et al., 2021), Ecology (Wenning, 2011), Public Environmental Health (Charabi et al., 2018), Zoology (Flores-Serrano et al., 2014), Toxicology (Fural et al., 2021) and Biodiversity Conservation (Nawrocki et al., 2019) and other directions. As far as the study area is concerned, it is mainly the river basin (Zhu et al., 2022), wetlands (Malekmohammadi and Blouchi, 2014; Li et al., 2020), desert oasis (Han et al., 2022) and other key ecological protection areas and heavy metal industrial areas such as industrial and mining wasteland (Peng et al., 2016). At present, the evaluation methods of ecological risk in academic circles can be generally divided into the evaluation based on risk source-risk receptor (Forbes and Calow, 2013) and the evaluation based on landscape pattern (Cui et al., 2018), the latter has become a common paradigm of ecological risk research. In actual planning decision-making, decision makers’ preference for different goals will often affect the development trend of future ecological risks. Therefore, many scholars try to explore the ecological environmental effects brought by future scenario development by combining multi-scenario simulation with ecological risk assessment model, so as to provide scientific basis for urban ecological environmental protection and land space planning. The existing ecological risk simulation and prediction studies mostly use CA–Markov (Tian et al., 2021), FLUS (Xu W. X. et al., 2021), CLUE-S (Zhang et al., 2021) and other models. Patch-gene rating land use simulation (PLUS) model applies random forest classification algorithm to better mine the potential driving factors of landscape types, simulate the evolution of landscape types from patch level, and is suitable for other areas and processes where large-scale processes interact with local dynamics (Gao et al., 2022). In addition, the discussion of the driving factors of ecological risk is also a hot research topic at present. Its main purpose is to reveal the internal reasons that affect the spatio-temporal changes of ecological risk, and provide the basis for the scientificity and accuracy of spatio-temporal simulation of ecological risk in the future. The research methods mainly include logistic regression (Tian et al., 2022), Geographic detector (Karimian et al., 2022), principal component analysis (Kumar et al., 2020) and geographically weighted regression model (Yu et al., 2020), etc. Compared with other methods, geographic detector can better detect the influencing factors and explain their interaction, so it is widely used in the research of driving factors.
Laos is not only a friendly neighbour connected with mountains and rivers in southeast China but is also an active participant in the strategy of building “Belt and Road Initiative” (Duan and Liu, 2020). Promoting the economic and ecological development of Laos is also an important prerequisite for enhancing the level of bilateral trade between China and Laos (Renkeyao and Gul, 2018; Liang et al., 2019). In recent years, with the continuous improvement of the economic level of Laos, problems, such as increasing urban population pressure, land use degradation and depletion of natural resources, have subsequently emerged. The wanton exploitation of land and forest resources has caused grave water pollution and soil destruction, which has seriously restricted the development of agriculture (Jiang et al., 2021). Cities are also faced with a large amount of domestic garbage and other environmental problems due to population growth. Therefore, in the process of pursuing economic development, Laos must fully coordinate economic growth with ecological protection to realise the sustainable development of the city.
Overall, studies on Southeast Asia in the world were few and those on ecological risks in Laos were substantially limited. Therefore, taking the Savan District of Laos as the research object, this paper conducted a quantitative study on the landscape ecological risk index of the study area in 2000, 2010 and 2020 by referring to the related methods of landscape ecology. The driving factors that affect the spatial and temporal differentiations of ecological risks were identified using the Geodetector model. Building the Markov–PLUS coupling model to simulate and predict the change trend of ecological risks in Savan District in 2030 aimed to provide a scientific basis for ecological protection strategies and land management policies in Savan District.
Savan District is located in the north of Indo-China Peninsula, south-central Laos, at 104°16′N–106°47′E and 15°52′–18°15′N, with Vietnam in the east and Mekong River in the west. The total area accounts for 16% of the country’s land area and the population accounts for 20% of the entire country. This district is the geographical and economic centres of Laos. In addition, according to the project and research findings of our team in this area, the main economic industry in this area is agriculture, which is the core area of agriculture in Laos, and its industrial base is relatively weak (Huang et al., 2018). Savan District comprises Khammouan Plateau and Savannakhét Plain, with high and low terrain in the east and west, respectively. The land use type is mainly forest land, accounting for approximately 80% of the total area (Peng et al., 2021). This area has a tropical monsoon climate, with an average annual temperature of around 25°C. Savan District includes 25 counties in two provinces: 10 counties in Khammouan Province and 15 counties in Savannakhét Province. Khammouan province covers an area of 16,315 km2 and its capital is Thakhek city. In 2020, the population of this province was approximately 433,600. Meanwhile, Savannakhét province covers an area of 21,774 km2, with a population of approximately 1070,000 in 2020. Therefore, it is the largest and most populous in Laos.
Savan District has a remarkably advantageous geographical position, occupying the dual economic development advantages of ASEAN Economic Circle and Greater Mekong Subregion Cooperation Economic Circle. This district is also one of the key node cities in the development strategy of “Belt and Road Initiative”. With its unique geographical location, Savan District has become an important geographical transportation hub in Indochina Peninsula and Laos. Figure 1 is location and land use in 2020 of Savan District.
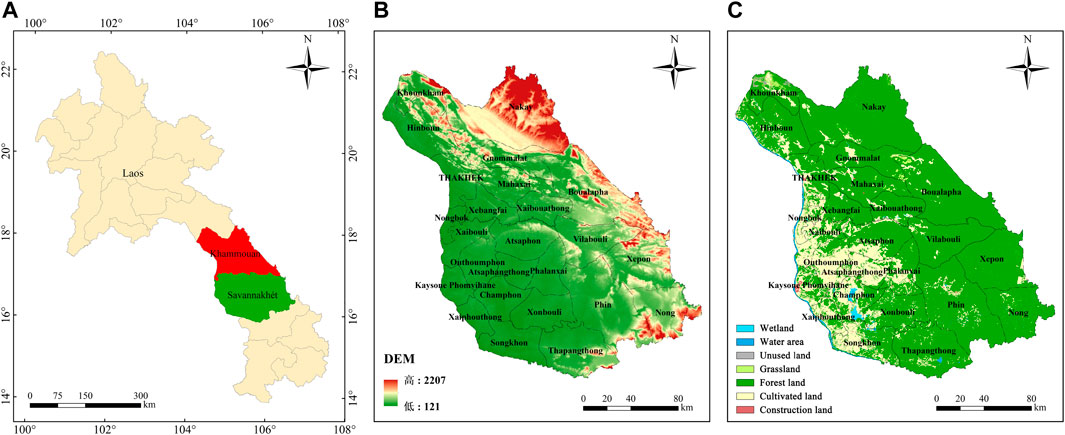
FIGURE 1. Study area: (A) Location; (B) DEM; (C) land use in 2020.
First-class classified land use type data, which were obtained from the grid data of land use of Savan District, Laos, in 2000, 2010 and 2020, were downloaded from Globe Land 30 m global land cover data website (http://www.globeland30.org). According to the classification method of landscape ecology, the landscape types of the study area were divided into seven types (Peng et al., 2017; Luo et al., 2019): cultivated land, forest land, grassland, wetland, water area, construction land and unused land.
Based on the present situation of the ecological environment in the study area and the availability of data, 10 types of driving factor data were selected from four dimensions—terrain conditions, soil conditions, location conditions and land use conditions—to explore the influencing factors of the spatial and temporal distributions of ecological risks in Savan District. In Table 1, the specific factor indicators were displayed. The National Aeronautics and Space Administration (NASA) EARTHDATA platform (https://www.earthdata.nasa.gov) provided the elevation data, and the slope data were translated from elevation data. The soil factor data were came from the Harmonised World Soil Database (http://webarchive.iiasa.ac.at/Research/LUC/External-World-soil-database/HTML/HWSD_Data.html?sb=4); The population density data were found from the 100 m resolution population data in 2020, were downloaded from the Worldpop platform (https://hub.worldpop.org/project/categories?id=3); The data of distance to water source were obtained by performing Euclidean distance analysis in ArcGIS; Road vector data were downloaded from the Open Street Map website (https://www.openstreetmap.org/), then road network density data were generated in ArcGIS; The normalized differential vegetation index (NDVI) data were from the NASA MODIS platform (https://modis.gsfc.nasa.gov/data/dataprod/mod13.php).
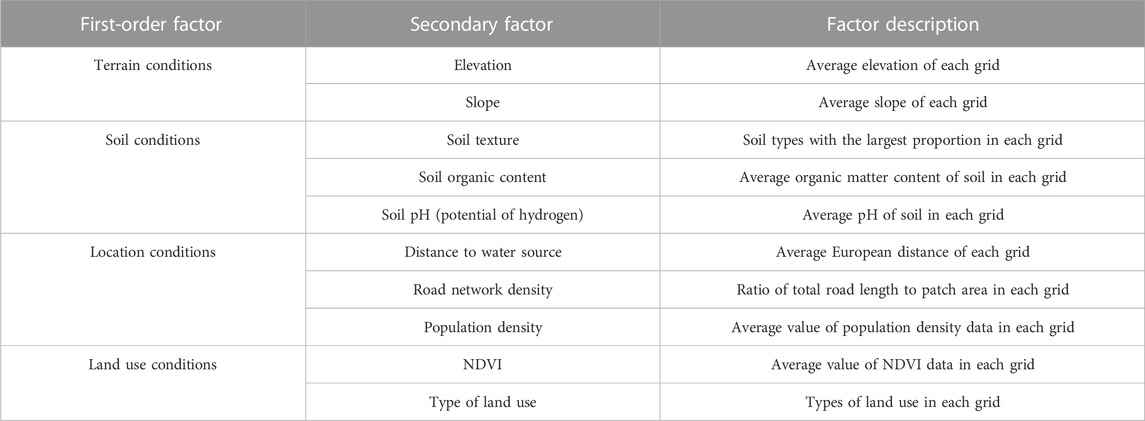
TABLE 1. Classification of ecological risk drivers in Savan District.
The landscape pattern index commonly used in ecology reflects landscape pattern information and quantifies the structural characteristics and evolution process of ecological landscape (Fu et al., 2020). According to the research purpose and the ecological significance of landscape index, the patch data of seven kinds of landscape types were calculated in this paper using FRAGSTATS software. The landscape disturbance degree (Sun et al., 2014) was then calculated by landscape fragmentation (Wang et al., 2008), landscape separation (Gao et al., 2011) and landscape dominance degrees (Li and Li, 2008); combined with landscape vulnerability degree (Wang et al., 2005), an ecological risk assessment model can be constructed (Zhao et al., 2022). Referring to the research of Chen et al. (2021), Tian et al. (2018) and other scholars, the evaluation unit should be two to five times the average patch area of the landscape in the study area. Therefore, this paper selected grids of 5 km × 5 km as the evaluation unit to divide the research area. The landscape loss index of each land use type was calculated by Excel software, then the ecological risk value of each grid was calculated in ArcGIS.
The calculation formula of the ecological risk index is:
In Eq. 1, ERIxi represents the ecological risk index of the x evaluation unit; n is the number of landscape types, and the value in this paper is 6; Sxi represents the area of Class i landscape of the x evaluation unit; Sx is the total landscape area of the x evaluation unit; Ri is the landscape loss index, and its calculation method is shown in Table 2.
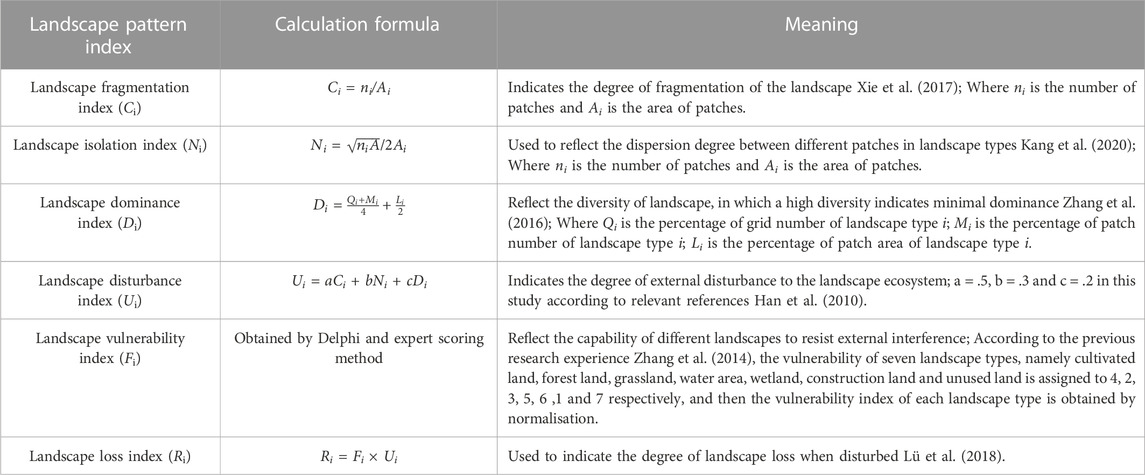
TABLE 2. Interpretation and calculation of landscape pattern index.
The Markov model is widely used in the related research of land use and is a stable random model with no aftereffect (Luo et al., 2020). The quantitative change in land use in the future can be predicted through the transformation probability matrix between land use types in a certain period, and its expression is as follows:
In Eq. 2, St is the current state of land use type; St+1 indicates the state of land use types in the future; Pij represents the probability matrix of land use type state transition.
The Patch-generating land-use simulation (PLUS) model is a land use change simulation model developed by HPSCIL@CUS Laboratory of China University of Geosciences (Hu et al., 2022). Land expansion analysis strategy (LEAS) and the CA model of many kinds of random patch seeds (CARS) predicted and simulated the land use, which has superior explanation (high simulation accuracy). The PLUS model primarily consists of two parts:
(1) Land expansion analysis strategy (LEAS)
Through the LEAS module, the model extracts all types of land use expansion parts during the course of two periods of land use change and draws samples from the increasing parts. The development likelihood of every type of land use and the contribution of driving factors to every type of land use growth in this era are calculated using the random forest algorithm, which mines each type of land use expansion and driving factor individually.
(2) CA model of many kinds of random patch seeds (CARS)
The PLUS model may dynamically simulate the automated synthesis of patches in time and space under the constraint of development probability by combining the mechanisms of random seed generation and threshold decrease. Although the computation is complex, software may directly access the findings. To ultimately achieve the spatio-temporal dynamic simulation of patches, all that is required is to establish the land demand data and land use transfer probability, wait for the program to take its course, and then review the findings.
The Markov–PLUS coupling model can not only predict the number of land use types but also simulate the change in land use in space. This model can accurately simulate the evolution of land use types in Savan District in 2030 and then predict the landscape ecological risk index in 2030.
The unique advantage of Geodetector lies in their capability to analyse the influence of a single factor and detect causal relationships between two variables (Wang and Xu, 2017; Sun et al., 2021). This study mainly used factor and interaction detection to test the natural environmental and socio-economic factors that affect the spatial differentiation of ecological risk in the research area and detected the driving factors of landscape ecological risk in the study area. The formula is as follows:
In Eq. 3, q is the detection index of the influence of driving factors on ecological risks and 0 ≤ q ≤ 1; h = 1, , L is the total number of partitions; Nh and N are the number of units in each partition and the entire study area, respectively;
Using FRAGSTATS landscape index calculation software and the statistical function of Excel, the change table of landscape pattern index of seven land use types in Savan District from 2000 to 2020 was obtained (Table 3).
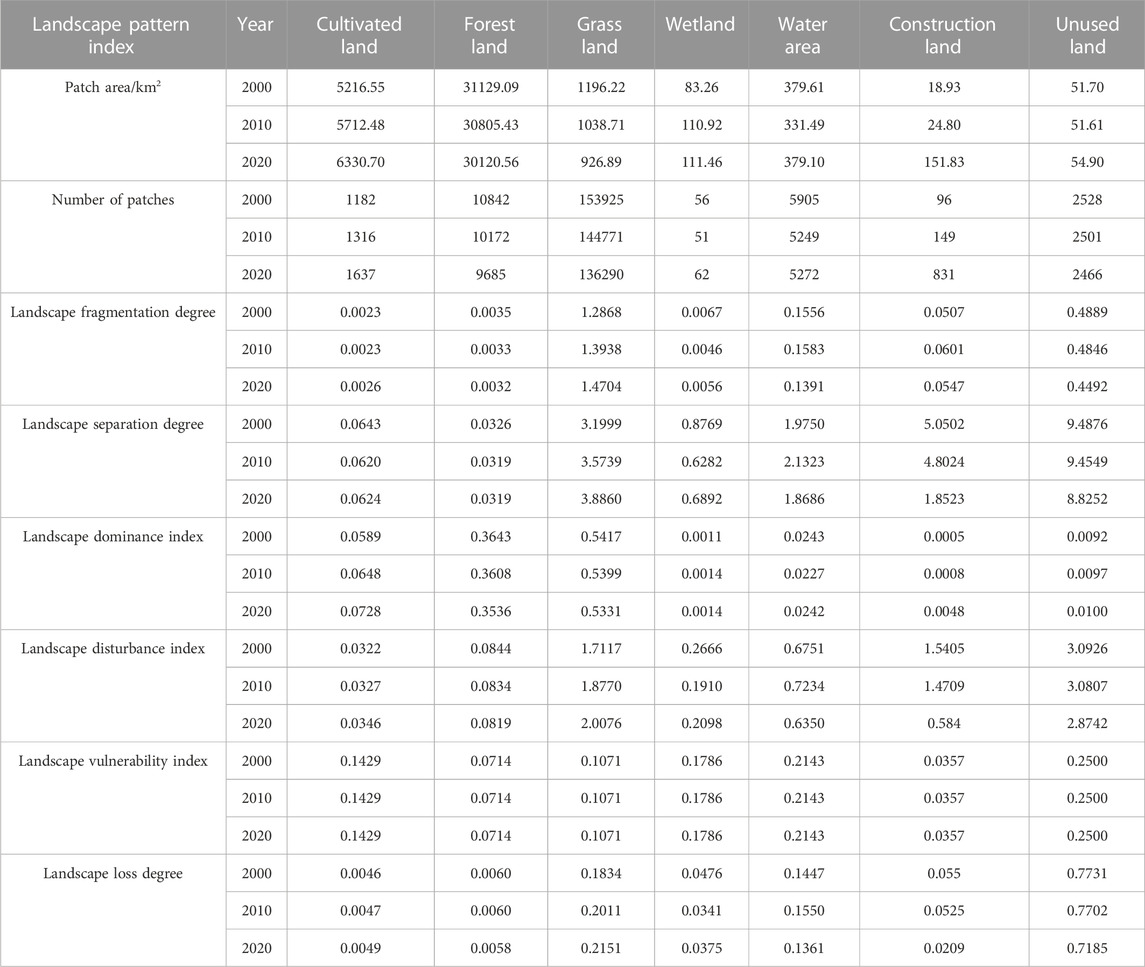
TABLE 3. Changes in landscape pattern index in Savan District from 2000 to 2020.
(1) Considering quantity, amongst the seven landscape types, the number of wetland patches was the least and the landscape fragmentation and dominance were the lowest. The patch area of forest land and cultivated land was the largest, but the number of patches was small. Therefore, the landscape fragmentation, separation and loss were small, the landscape stability was the highest and the anti-interference capability was strong. The number of grassland patches was the largest, indicating that their spatial distribution was scattered; thus, the calculated landscape fragmentation, separation and disturbance were the highest. In 2000 and 2010, the patch number and area of construction land were small, the dominance index was the lowest and the landscape separation and disturbance degree indices were high, which reflected the scattered spatial distribution of construction land. The degree of separation, disturbance, fragility and loss of unused land was the highest and the ecosystem was in the primary evolution mode, demonstrating the highest biodiversity and the worst stability.
(2) From the perspective of time change, the landscape index of cultivated and forest lands slightly changed from 2000 to 2020, indicating minimal disturbance by the outside world and a relatively stable ecosystem. The landscape fragmentation, separation, disturbance and loss degrees of grassland were increasing yearly. This finding indicates that the grassland landscape types were gradually dispersed in the geographical distribution and the ecological loss of the landscape was remarkably serious after external disturbance, which should be paid emphasised in the future ecological environment protection strategy. The indices of landscape fragmentation, separation, disturbance and loss of wetland and water area firstly increased and then decreased, indicating that the landscape fragmentation of wetlands and water area increased due to the changes in natural conditions and the blind and disorderly construction behaviour of human beings from 2000 to 2010. However, after 2010, the landscape patches gradually tended to be continuous and the ecosystem gradually returned to the normal level.
According to the formula, the ecological risk value of each grid unit was calculated, and the ecological risk value was then assigned to the centre point of each grid through the operation of element turning point. Finally, relying on the spatial analysis method of geostatistics, the spatial distribution map of ecological risk in the three phase of the study area was obtained by Kriging interpolation method. The conversion of ecological risk levels during the study period was analysed by ecological risk dynamic attitude and transfer matrix as respectively shown in Table 4 and Figure 2 to reflect the changes amongst different ecological risk levels intuitively.
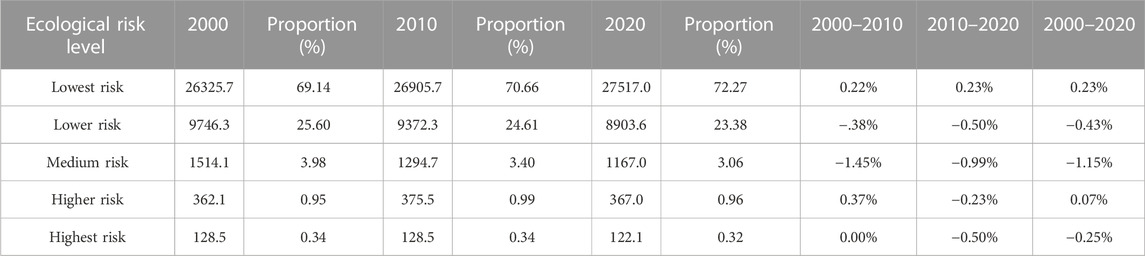
TABLE 4. Ecological risk grade area and dynamic attitude from 2000 to 2020 (km2).
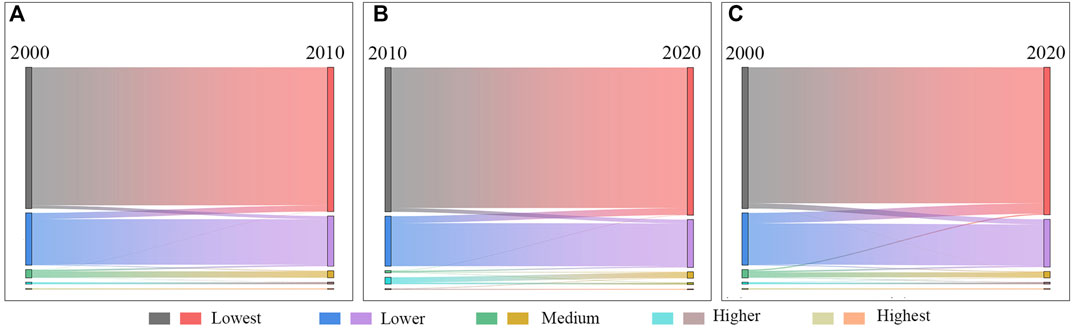
FIGURE 2. Ecological risk transfer at different levels: (A) 2000–2010; (B) 2010–2020; (C) 2000–2020.
In 2000, 2010 and 2020, the average ecological risk index of Savan District ware .01404, .01370 and .01335, respectively, showing a gradual downward trend. This trend indicated that the level of ecological security was steadily improved, and the contradiction between urban economic development and the ecological environment was alleviated and changed.
From the perspective of area ratio and dynamic attitude change, the landscape ecological risks in the Savan District in the past 20 years from 2000 to 2020 were mainly low-risk areas, which accounted for more than 90%, thus confirming that the overall landscape ecological risks in Savan District were low. The table of dynamic attitude change indicates minimal variation in the ecological risk area of different grades, except for the dynamic attitude of medium risk exceeding 1% and the change in the ecological risk area of four other grades of less than .5%, which indicates the remarkable stability of the ecological environment of the Savan District. From the perspective of the change trend, the ecological risk area slightly changed during the 20 years from 2000 to 2020, the lowest-risk area continued to increase, the lower- and medium-risk areas decreased yearly and the higher-risk area increased firstly and then decreased around 2010. This highest-risk area was the most stable but began to decrease after 2010.
The diagram of ecological risk transfer revealed that the shift to lower ecological risk level in 2000-2020 was the key feature of the ecological risk level change. In 2020, the increase in lowest-risk area mainly came from 1934.32 to 231.58 km2 of lower- and medium-risk areas, respectively, and 284.42 km2 of medium-risk area was reduced to lower-risk area. In addition, the areas with elevated ecological risk mainly included the following: 955.35 km2 for the conversion of lowest to lower risk, 145.52 km2 from the conversion of lower to medium-risk areas and 76.63 km2 for the conversion of medium to higher risk areas.
According to the natural breakpoint method of ArcGIS software and the characteristics of ecological risk data in the three phase, the landscape ecological risk of Savan District was divided into five grades: lowest-risk area (<.01283), lower-risk areas (.01283–.03367), medium-risk area (.03367–.07430) and higher-risk areas (.07430–.15035) and highest-risk area (>.15035), and the results were shown in Figure 3.
(1) From the perspective of spatial distribution, the ecological risk in Savan District presented a distribution pattern of high and low in the east and west, respectively, which was consistent with the land use pattern. The eastern low-risk area was dominated by forest land landscape mainly because of the high stability of forest land ecosystems and the low vulnerability of landscapes. Low- and medium-risk areas were mainly distributed in scattered patches in the west, central and southern areas, and cultivated land was the main landscape type. High-risk areas were concentrated in Khammouan City in the northwest corner. A large number of unused land types were found in the territory, and their landscape loss and vulnerability were the largest, which was the area with large ecological security problems in the Savan District.
(2) From the perspective of temporal and spatial evolution, the spatial distribution of the five types of risk areas slightly changed during the study period and only the middle-western area changed obviously, gradually decreasing from lower- and medium-risk areas to lowest-risk areas. The landscape type in this area changed from forest land to cultivated land, which merged with surrounding patches, and the landscape fragmentation and separation decreased, thus reducing the ecological risk.
(3) According to the division of provincial administrative regions, the average ecological risks of Khammouan Province in Savan District in 2000, 2010 and 2020 were .01531, .01530 and .01524, respectively. This finding indicated that the landscape ecological environment of Khammouan Province was relatively stable and the ecological risks decreased from 2010 to 2020. The average ecological risks of Savannakhét Province in 2000, 2010 and 2020 were .01305, .01244 and .01187, respectively, showing a decreasing trend yearly, reflecting the improvement of the ecological quality of Savannakhét Province yearly. The average ecological risk of Khammouan province was generally higher than that of Savannakhét province.
(4) Divided by urban areas, Figure 4 shows that Khammouan had the highest ecological risk index (above .06) and Atsaphangthong had the lowest, with the average ecological risk below .01. The ecological risks of the 24 other urban areas were distributed between .01 and .03, and the ecological risk index of most urban areas in 2000, 2010 and 2020 steadily changed. Amongst them, the change in Outhoumphon was evident and the average ecological risks in 2000, 2010 and 2020 were .0226, .0145 and .009, respectively, showing a linear decreasing trend.
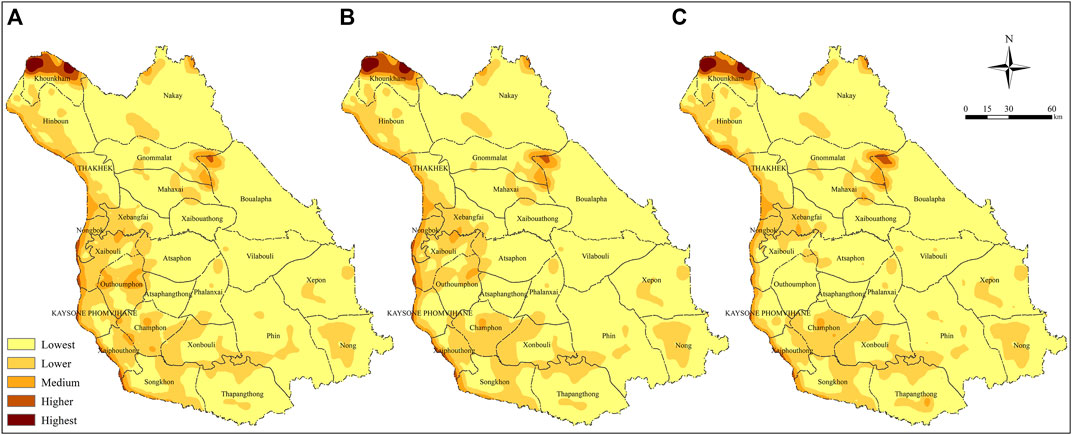
FIGURE 3. Distribution of ecological risk levels from 2000 to 2020: (A) 2000, (B) 2010; (C) 2020.
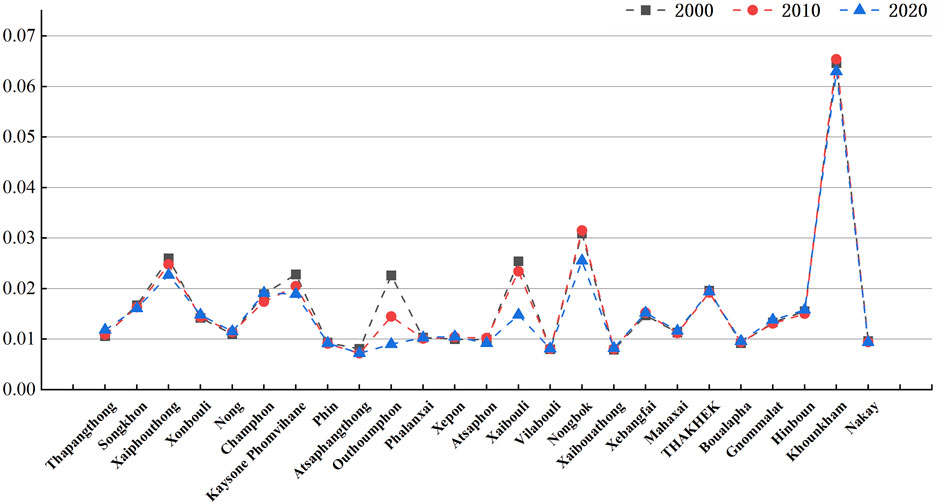
FIGURE 4. Landscape ecological risk index of 25 cities in Savan District from 2000 to 2020.
The ecological risk of Savan District was generally low and the change was small. This finding indicated that the natural environment and forest resources in the area had not suffered serious damage at present, and the quality of human settlements was remarkably superior.
Based on the obtained data, 10 factors, including elevation (X1), slope (X2), soil organic content (X3), soil texture (X4), soil PH (X5), population density (X6), distance to water source (X7), road network density (X8), NDVI (X9) and type of land use (X10), were selected in this study to identify the factors that affect the spatial and temporal distribution of ecological risks in Savaan District. With the help of ArcGIS platform, ecological risk and influencing factor data were sampled by 2 km × 2 km grid, and the data with the value of −9999 were eliminated in Excel. Through origin plug-in, the linear correlation degree between variables was studied by Spearman correlation coefficient, and the result was shown in Figure 5A. Taking the ecological risk index as an independent variable and 10 kinds of influencing factors as dependent variables, the driving factors of ecological risks in the Savan District were then quantitatively studied on the basis of the geographic probe model. Table 5 showed the factor detection results of ecological risk in the Savan District.
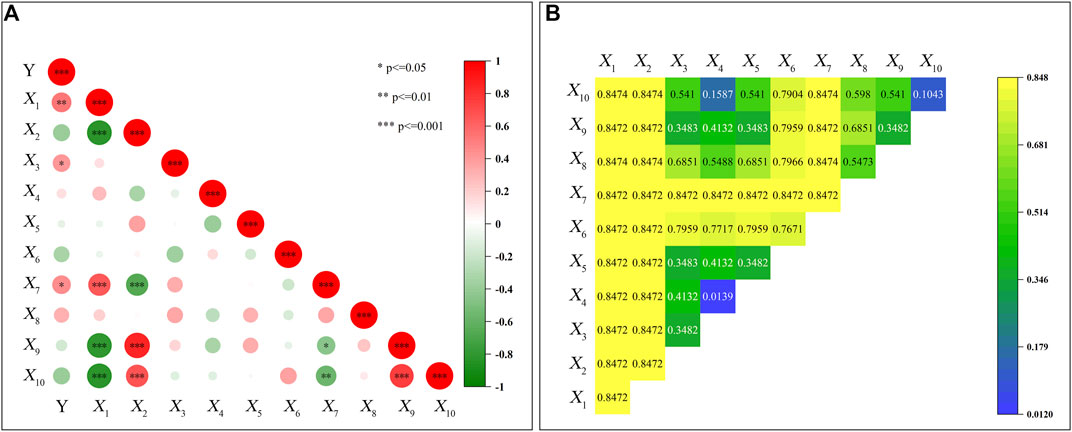
FIGURE 5. Driving factors of ecological risk in the Savan District: (A) factor correlation; (B) interactive detection results.
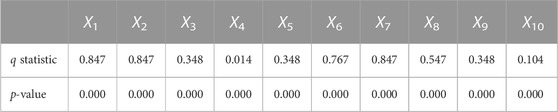
TABLE 5. Detection results of ecological risk factors in Savan District.
Figure 5A showed a significant positive correlation between ecological risk and elevation, soil organic matter content and distance from water source, with significant distributions of 99%, 95% and 95%, respectively. The correlation between dependent variables was as follows. The elevation factor was negatively correlated with slope, vegetation coverage and land use types, with a significant degree of 99.9%. Meanwhile, the elevation factor was positively correlated with the distance from water source, slope and vegetation coverage, slope and land use types and vegetation coverage and land use types with a significant degree of 99.9%.
The p values of all factors in Table 5 are less than .01, which indicates that all 10 kinds of driving factors have impacts on ecological risks. From the explanatory power of factors to the spatial distribution of ecological risks, elevation (X1), slope (X2) and distance to water source (X7) have the highest influence, reaching 84.7%. This finding indicates that the three factors are dominant in the spatial distribution of ecological risks. Secondly, the explanatory power of population density (X6) factor is 76.7%. However, the q statistic of soil texture (X4) factor is .014, which indicates that it has little influence on the spatial differentiation of ecological risk.
The interactive detection results are shown in Figure 5B, which reveals that the spatio-temporal evolution of ecological risk in the Savan District is due to multiple factors. From the perspective of interaction influence, the interaction between other factors and elevation (X1) and slope (X1) is a single factor non-linear weakening, whilst elevation (X1) and slope (X2) are unaffected by other factors. The elevation (X1) and slope (X2) are non-linearly weakened, and their combined influence is weakened instead of enhanced. Amongst them, the factors with high enhancement degrees are q(X3∩X10), q(X5∩X10), q(X9∩X10), q(X3∩X4), q(X4∩X5) and q(X4∩X10). This finding shows that factors, such as soil organic content, soil texture and type of land use, have a significant increase in the influence of interaction with the combination of other factors, which can significantly contribute to the influence of other factors on ecological risk.
With the help of ArcGIS platform, the three-phase land use data and 10 types of driving factor data were reclassified, and the coordinate system and scope were unified and then imported into the PLUS model for simulation and prediction. Testing the model accuracy is necessary before simulating and predicting the ecological risk in 2030. Firstly, the land use data in 2000 and 2010 are loaded into the model, and the model parameters are then set to obtain the land use simulation results in 2020. The consistency test is conducted by Kappa coefficient according to the actual land use data in 2020 to determine the reliability of simulation prediction results. The next operation is then performed. The calculated Kappa coefficient is .892, which indicates that the Markov–PLUS model has high accuracy and can be used to predict the land use data of the study area in 2030 and calculate the ecological risk.
The main driving factors for the expansion of cultivated land are type of land use, soil organic matter content, and population density, while the main influencing factors for the expansion of forest land are elevation DEM, soil PH value, and population density, according to the distribution map of contribution rates of driving factors (Figure 6). Type of land use, elevation, and the density of the road network are the key forces behind the increase of construction land.
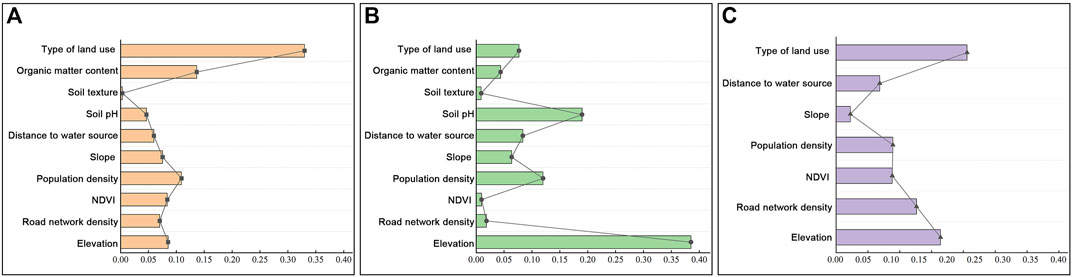
FIGURE 6. Contribution of driving factors of cultivated, forest and construction land expansion in Savan District: (A) cultivate land; (B) forest land, (C) construction land.
In the CAES module, the principles of forest land protection, ecological protection and the trend of urban development indicated that the water body in 2020 will be restricted from conversion as protected areas. Moreover, the water body, forest land and construction land will not be converted into other land use types in the land use transfer matrix, and unused land will all be convertible. The distribution map of Savan District landscape types in 2030 is shown in Figure 7A by simulation and prediction, and the landscape pattern index is then calculated in ArcGIS and FRAGSTATS software. The results are shown in Table 6.
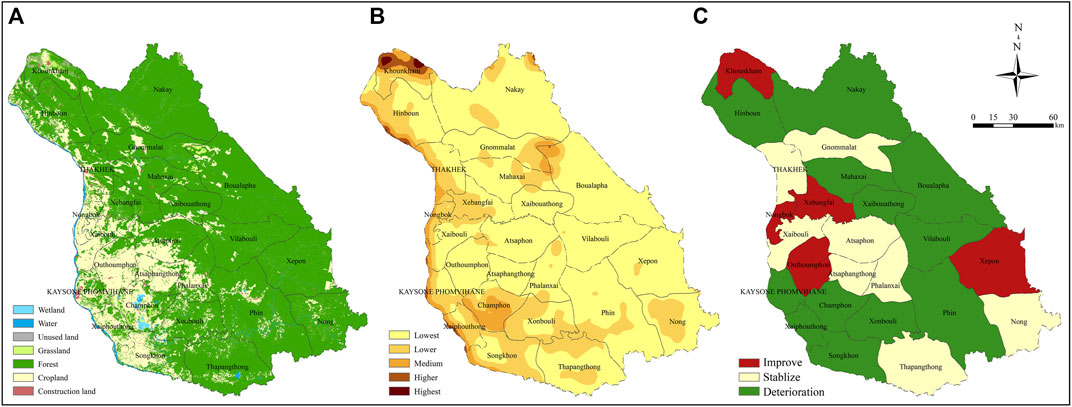
FIGURE 7. Land use and ecological risks in Savan District in 2030: (A) land use; (B) ecological risks, (C) changes in ecological risks in 25 cities.
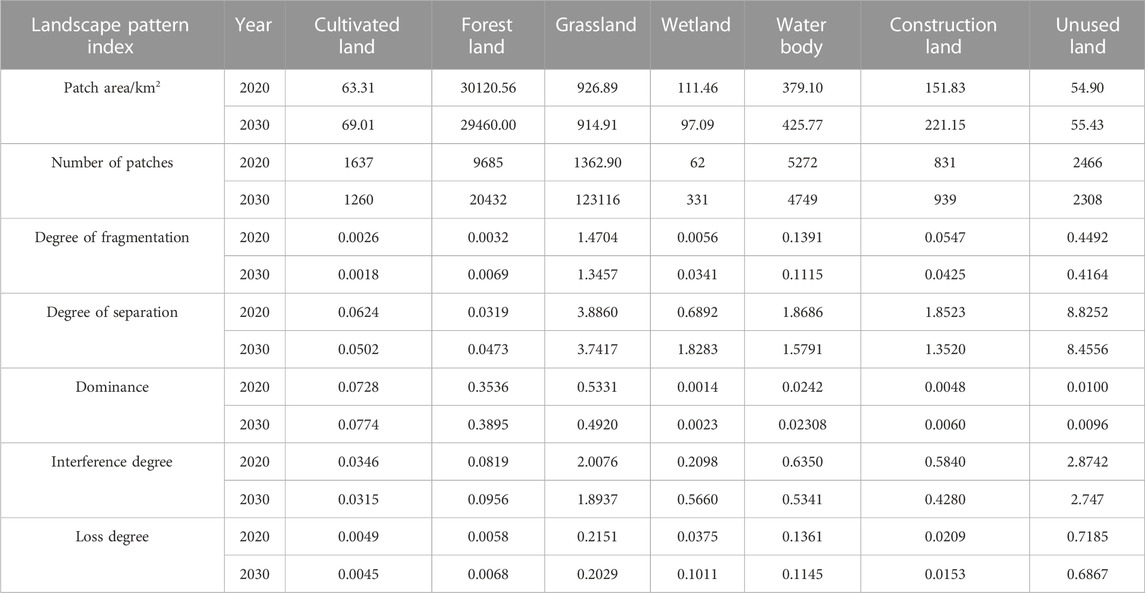
TABLE 6. Comparison of landscape pattern index of Sawan District in 2020 and 2030.
The landscape ecological risk in Savan District in 2030 was reclassified in accordance with the 3.2 grade classification method, and the landscape ecological risk grade distribution map in 2030 was obtained (Figure 7B). Overall, the spatial distribution pattern of landscape ecological risk is similar to that of 2020, which still shows a low and high trend in the east and west, respectively, with lowest- and lower-risk areas as the main ones. High-risk areas are still distributed in the northwest corner, and highest- and higher-risk areas are decreasing. Particularly, the high-risk areas in the northwest corner of Boualapha City are reduced to medium-risk areas. From the average ecological risk of the whole region, the average ecological risk of Savan District in 2030 is .01415, exceeding the maximum ecological risk from 2000 to 2020, which indicates that the Savan District will usher in the peak ecological risk in 2030. According to the division of provincial administrative regions, the average ecological risks of Khammouan and Savannakhét Province in Savan District in 2030 will be .01557 and .01305, respectively; amongst which, the ecological risks of Khammouan exceeded the highest value since 2000.
The average ecological risk of each city is calculated in accordance with the regional statistics of ArcGIS platform, and the ecological risk in 2030 is then compared with that in 2020 by using grid calculator. The area with −.0005 < change value < .0005 is classified as a stable ecological risk area, the area with change value > .005 is defined as a worsening ecological risk area and the area with change value <− .005 is defined as an improving ecological risk area, thus obtaining the figure of landscape ecological risk change of 25 cities in the Savan District from 2020 to 2030 (Figure 7C).
The schematic of ecological risk change shows that amongst the 25 urban areas in Savan District, 12 are ecological risk deterioration areas, 5 are improvement areas and 8 are stable areas. Ecological stability areas include two southeast cities and six central and western cities. The three most stable cities are Atsaphon, Thakhek and Phalanxai. The landscape types of these three cities are basically divided into forest land and cultivated land, and the two landscape patches are concentrated; thus, the ecological risk is the most stable. Amongst the ecological risk improvement areas, the average ecological risk of Khoukham city decreased most, followed by the cities of Xepon, Outhoumphon, Xebang fai and Nongbok. The ecological risk deterioration areas are widely distributed, and the ecological risks in the southwestern and eastern urban areas increased. Amongst which, the cities of Champhon, Kaysone Phomvihane and Xaiphouthong have the worst deterioration degree. The spatial distribution map shows that Champhon City has a large part of medium-risk gathering areas. Therefore, focusing on these cities with deteriorating ecological risks is necessary in the future strategies of urban economy, ecological construction and land development.
Ecological environment has always been a key issue that affects the social and economic development and the sustainable development of human beings all over the world. In recent years, there have been more and more researches on landscape ecology in academic circles. From the perspective of countries and regions, scholars from the United States, China, Canada, Australia, Britain, Germany, France and other European countries are the majority, while researches on landscape ecology in Southeast Asian countries and regions, especially developing countries and regions in Southeast Asia, are scarce. Southeast Asia, surrounded by the sea on three sides, is a traffic fortress between Asia and Oceania, the Pacific Ocean and the Indian Ocean (Bai Y. et al., 2021). Although Southeast Asia’s geographical position in the region is crucial, it also needs to be considered for its ecological sustainability (Sharma et al., 2020). With the rapid development of society, environmental problems have become increasingly prominent, seriously affected the harmonious relationship between man and nature, but also caused many social problems, which have become major economic and social problems that restrict the long-term development of East Asia. Laos is a landlocked country in Indochina Peninsula (Zaehringer et al., 2018), surrounded by mountains in the north and neighboring countries on all sides. The only feasible way for overseas trade is land trade, which completely limits its development space. In the process of urban expansion, economic growth accelerates industrialization and promotes the exploitation of natural resources such as agriculture and forestry, which may lead to ecological distortion (Danish et al., 2019). The contradiction between ecological environment and economic development has become an important issue for Laos’ development (Vilaysouk et al., 2019; Castella and Lestrelin, 2021). The combination of landscape ecology and land use, as a breakthrough of ecological risk assessment theory and method, can provide reference for urban planning and design (Izakovicova et al., 2019). In the past, landscape ecological risk assessment mostly focused on the ecological risk assessment caused during the research period (Li et al., 2019; Sun et al., 2022; Yu et al., 2022), less simulation and prediction of future ecological risks. Therefore, this study takes Savan District, Laos as the research object, discusses the temporal and spatial evolution of sand ecological risk combined with landscape ecology, and makes simulation and prediction, so as to take corresponding policies to prevent the ecological risk caused by improper urban expansion.
The research methods and models of spatial-temporal differentiation of ecological risks in this study are consistent with many studies. It is found that the ecological risk level in Savan District of Laos is low, which is consistent with the higher ecological security level in Laos in the research conclusions of Nathaniel (Nathaniel, 2021) and Zhao et al. (2021). Our analysis confirms the feasibility of this research in two provinces and cities in Laos, which is of reference value to other similar cities in Laos and even Southeast Asia. Savan area is dominated by forest land and cultivated land, and is rich in natural resources. Forest land covers the largest area, and because agriculture is the main economic industry, the occupation of cultivated land and forest land by urban expansion has been curbed. Except for the construction land and unused land, the ecological land such as grassland, wetland and water body in Savan District is small, which is usually ignored by managers in the process of urban development, so it is damaged greatly and its ecological risk index is high. However, cultivated land and forest land have the most stable landscape pattern and the lowest ecological risk index during the study period. As an important renewable natural resource, forestry is of great significance to ecological environment and sustainable development. If the practice of sustainable development is adopted in production and living activities, the ecological space will be stable and the natural resources will be regenerated.
It is discovered that the urban development in Savan District has obvious imbalance and spatial disorder. Urban areas are mainly concentrated in the west. While the central and eastern areas are limited by topographic factors, have limited construction land, and have insufficient development bearing capacity. Therefore, the development of these areas is relatively slow, the development degree is low, and the development motivation is weak. Moreover, due to the low level of economic development and poor traffic conditions, it is difficult to play a strong role in promoting the development of surrounding cities. However, there is a lot of possibility for development in the comparatively underdeveloped districts in the east. The economic might of the east can be strengthened by creating a new uplift belt in these areas. In the future, the urban development in the Savan District should shift from a singular focus on the centre of the city to a coordinated development of the core and the suburbs. Additionally, the temporal and spatial changes of land use and ecological risks in the study area in 2030 are examined. These findings will inform the policies for protecting the environment and natural resources in the Savan District over the following 10 years. The Savan District’s overall landscape pattern is relatively stable in the natural development mode, and in the following 10 years, the land area of each landscape type will only slightly vary. However, the ecological risk index of certain counties has risen, calling for greater consideration in the region’s future regional governance. The ecological risk of the landscape can be greatly reduced by managing the expansion of urban construction land and safeguarding ecologically sensitive areas, at the same time of developing cities and towns in a sensible manner.
According to the research results and the ecological environment problems in Savan District, this paper proposes the following suggestions. 1) In order to lessen the landscape separation and fragmentation degree of construction land, land resources should be distributed fairly during the process of future urban expansion in the Savan District. The problem of unused land allocation should be resolved, and it should be encouraged to be converted to other landscape. 2) The pattern of urban ecological security should be established, and the red lines of urban ecological protection should be scientifically and logically demarcated to guarantee the protection of ecological resources such as water bodies and wetlands. 3) The boundaries of urban development should be established as soon as possible. At the same time, in order to lessen the disorderly spatial distribution of land resources, long-term thought should be given to the development of cultivated land and forest land. 4) In urban planning, the site choice of construction land should properly and thoroughly take into account aspects such population density, distance to roads, elevation, and slope. Through improving urbanization, the degree of industry in impoverished areas will increase. 5) As scale agriculture develops in conjunction with actual agricultural development in each urban area, support and promote automated scale and efficient production, realize scale benefits, and free farmers from strenuous physical work. 6) The relevant department need to develop forest land resources effectively, coordinate the relationship between forest land resource development and local economic growth, improve the industry’s organizational structure, encourage forestry tourism, and expand the product market.
Laos is sparsely populated, and is an agricultural country, with the sizeable area ratio of forest land and cultivated land. Each province and city have the similar geographical layout and land structure. As a result, the research results of Savan District can be used to inform future land spatial planning in Laos various provinces in the future. The government can take into account the integrity of the construction land of the expansion process, reduce the landscape loss index of construction land, and lower the ecological risk through initiatives like reclaiming forest land for cultivated land. While, due to the high level of fragmentation and separation of these landscape features, there is a significant landscape loss of grassland, water area, and unused land, making it important to merge these three landscape types in the future.
This study still has some shortcomings, and future research can be improved from the following aspects. Firstly, considering the limitations of data collection, rather than a continuous time series, the current research is only based on three periods of land use data; therefore, obtaining additional comprehensive data is necessary in future research. Many kinds of driver data are available, and update them is difficult, which cannot guarantee the timeliness and integrity of the data. Therefore, the data quality must be further improved in the future research. Secondly, in the analysis of driving factors, the number of samples will have a certain impact on the results of geographic detectors. Therefore, the sample size and sampling range should be expanded in the future research or prospective research methods should be conducted to obtain reliable research results. Finally, although the Markov–PLUS model is widely used in the current land use research field and its simulation accuracy is high, each prediction model has its characteristics and application limitations. Therefore, certain differences are found in the prediction data. The loss of some data information if a single model is used for prediction is inevitable. Sampling several prediction models for combination forecasting, such as introducing the improving grey model (Liu et al., 2021; Yang et al., 2022) and BP neural network model (Bai Y. L. et al., 2021; Hu, 2022; Liu and Zhou, 2022), which can improve the accuracy of the forecasting model, can also be considered.
Taking Savan District, Laos, as the research object, based on the basic data of land use in 2000, 2010 and 2020 and those of 10 kinds of driving factors, the ecological risk assessment model was constructed by using landscape pattern index, and the influencing factors of spatial differentiation of ecological risks were identified by geographical detectors. The landscape ecological risk pattern of the Savan District in 2030 was simulated and predicted, and the following results were obtained.
(1) From 2000 to 2020, the landscape types in the Savan District were mainly cultivated land and forest land, with an area accounting for 95%. Landscape pattern index analysis showed that during the study period, the landscape loss index of cultivated and forest lands was the smallest, whilst the unused land was the largest. Grassland, wetland and water are small in area, but the landscape fragmentation, separation and loss index are all large. Protecting these landscape types and controlling their loss when external conditions change is necessary in the future development and management of land resources.
(2) Overall, the average value of ecological risks in Savan was low and showed a downward trend during the study period. The ecological risk index was the highest in 2000, with an average value of .01404. The spatial distribution shows the characteristics of low in the east and high in the west, with loewest- and lower-risk areas accounting for more than 90% whilst highest- and higher-risk areas are distributed in the northwest corner. The transformation relationship between ecological risk levels is not observed, and the overall trend is the transformation to lower-risk areas, mainly between loewest- and lower-risk areas. Highest- and higher-risk areas are relatively stable and have no transformation.
(3) According to the forecast result of the Markov–PLUS model, the average ecological risk index of the Savan area and two provinces will increase in 2030 and reach the maximum value since 2000. The landscape pattern index revealed that the landscape loss of forest land and wetland increased whilst that of five other landscape types decreased. The division of urban areas revealed 5 ecological risk improvement areas, 12 deterioration areas and 8 stable areas; amongst these areas, Champhon has the highest ecological risk deterioration degree.
Therefore, in the future land planning and management of Savan District, Laos, strengthening the protection of ecological lands, such as forest land, wetland and water body, adjusting the spatial layout of land use and promoting the coordinated development of urban economy and sustainable ecological environment is necessary. No significant positive relationship exists between the urbanisation degree of the Savan District and the level of regional economic development. Thus, strengthening the regional coordinated development as a whole and the geographical advantages of the unbalanced development areas in the central and eastern regions is crucial to promote economic development. In addition, for a specific region, a high land use efficiency increases the attractiveness of a region and its convenience to the traffic, thus becoming increasingly conducive to urban development. In the process of urbanisation, the concept of eco-city should be followed, the red line of ecological protection should be scientifically demarcated, the urban ecological space should be broadened and green ecological corridors should be rationally built. To realise green development, the regional coordinated development strategy should be actively implemented, a coordinated development mechanism should be established and the spatial layout of land should be actively optimised to improve the utilisation rate of land resources and achieve environmental and social benefits.
The original contributions presented in the study are included in the article/Supplementary Material, further inquiries can be directed to the corresponding author.
XX: conceptualization and writing, methodology and software, data acquisition and analysis and interpretation of data. PY: reviewing the manuscript. QW: Providing a part of research data.
This research was funded by the Science and Technology Plan Project of the Ministry of Housing and Urban-Rural Development of the People’s Republic of China (2019-R-020).
QW was employed by Guangdong Panyu Survey and Design Co., Ltd.
The remaining authors declare that the research was conducted in the absence of any commercial or financial relationships that could be construed as a potential conflict of interest.
All claims expressed in this article are solely those of the authors and do not necessarily represent those of their affiliated organizations, or those of the publisher, the editors and the reviewers. Any product that may be evaluated in this article, or claim that may be made by its manufacturer, is not guaranteed or endorsed by the publisher.
Bai, Y, L., Rong, Y, L., Sun, J, H., Chen, L, M., Zhang, D, Y., and Yin, Z, T. (2021). Seamount age prediction machine learning model based on multiple geophysical observables: Methods and applications in the Pacific ocean. Mar. Geophys. Res. 42 (3), 31–11. doi:10.1007/s11001-021-09451-z
Bai, Y., Fang, Z., and Hughes, A. C. (2021). Ecological redlines provide a mechanism to maximize conservation gains in Mainland Southeast Asia. One Earth 4 (10), 1491–1504. doi:10.1016/j.oneear.2021.09.010
Barnthouse, L. W. (1994). Issues in ecological risk assessment: The CRAM perspective. Risk analysis official Publ. Soc. Risk Analysis 14 (3), 251–256. doi:10.1111/j.1539-6924.1994.tb00239.x
Castella, J, C., and Lestrelin, G. (2021). Explorer l’impact environnemental des transformations agraires en Asie du Sud-Est grâce à l’évaluation participative des services écosystémiques. Cah. Agric. 30, 3. doi:10.1051/cagri/2020042
Charabi, Y., Choudri, B. S., and Ahmed, M. (2018). Ecological and human health risk assessment. Water Environ. Res. a Res. Publ. Water Environ. Fed. 90 (10), 1777–1791. doi:10.2175/106143018x15289915807434
Chen, X, Y., Xie, G, Z., and Zhang, J, P. (2021). Landscape ecological risk assessment of land use changes in the coastal area of Haikou City in the past 30 years. Acta Ecol. Sin. 41 (3), 975–986. doi:10.5846/stxb201909211974
Cui, L., Zhao, Y., Liu, J., Han, L., Ao, Y., and Yin, S. (2018). Landscape ecological risk assessment in Qinling Mountain. Geol. J. 53, 342–351. doi:10.1002/gj.3115
Danish, , Baloch, M. A., Mahmood, N., and Zhang, J. W. (2019). Effect of natural resources, renewable energy and economic development on CO2 emissions in BRICS countries. Sci. Total Environ. 678, 632–638. doi:10.1016/j.scitotenv.2019.05.028
Duan, X. P., and Liu, J. (2020). Progress and challenges in the construction of the China-Laos economic corridor under the “belt and road” initiative. J. Yunnan Adm. Coll. 22 (4), 164–169. doi:10.16273/j.cnki.53-1134/d.2020.04.025
Ferrarini, A. (2004). Ecological risk assessment through landscape science approaches: Risk assessment as a tool for environmental decision making in central Asia (155-176). Dordrecht: Kluwer Academic Press.
Flores-Serrano, R. M., Iturbe-Arguelles, R., Perez-Casimiro, G., Ramirez-Gonzalez, A., Flores-Guido, J. S., and Kantun-Balam, J. M. (2014). Ecological risk assessment for small omnivorous mammals exposed to polycyclic aromatic hydrocarbons: A case study in northeastern Mexico. Sci. Total Environ. 476 (477), 218–227. doi:10.1016/j.scitotenv.2013.12.092
Forbes, V. E., and Calow, P. (2013). Developing predictive systems models to address complexity and relevance for ecological risk assessment. Integr. Environ. Assess. Manag. 9 (3), e75–e80. doi:10.1002/ieam.1425
Fu, Y, J., Shi, X, Y., and He, J. (2020). Characteristics of spatial and temporal differentiation of landscape pattern vulnerability in Fenhe River Basin. Res. Soil Water Conservation 27 (3), 197–202. doi:10.13869/j.cnki.rswc.2020.03.029
Fural, S., Kukrer, S., Curebal, I., and Aykir, D. (2021). Spatial distribution, environmental risk assessment, and source identification of potentially toxic metals in Atikhisar dam, Turkey. Environ. Monit. Assess. 193 (5), 268. doi:10.1007/s10661-021-09062-6
Gao, B., Li, X., Li, Z., Chen, W., and Qi, S. (2011). Assessment of ecological risk of coastal economic developing zone in Jinzhou Bay based on landscape pattern. Acta Ecol. Sin. 31 (12), 3441–3450. doi:10.3724/SP.J.1011.2011.00468
Gao, L., Tao, F., Liu, R., Wang, Z., Leng, H., and Zhou, T. (2022). Multi-scenario simulation and ecological risk analysis of land use based on the PLUS model: A case study of nanjing. Sustain. Cities Soc. 85, 104055. doi:10.1016/j.scs.2022.104055
Han, F., Liu, Z., Li, L., Yin, W., and Wu, J. (2022). Study on ecological risk evaluation and optimum selection of desert expressway schemes based on the two-dimensional cloud model. Math. Problems Eng. 2022, 1–13. doi:10.1155/2022/1361861
Han, Z., Li, J., Yin, H., Shen, T. Y., and Xu, C. (2010). Analysis of ecological security of wetland in Liaohe River delta based on the landscape pattern. Ecol. Environ. Sci. 19 (3), 701–705. doi:10.16258/j.cnki.1674-5906.2010.03.027
Hu, F., Zhang, Y., Guo, Y., Zhang, P. P., Lv, S., and Zhang, C. C. (2022). Spatial and temporal changes in land use and habitat quality in the Weihe River Basin based on the PLUS and InVEST models and predictions. Arid. Reg. Geogr. 45 (4), 1125–1136. doi:10.12118/j.issn.1000-6060.2021.510
Hu, P. (2022). Evaluation algorithm of coastal city ecological civilization development level based on improved BP neural network. J. Environ. Manag. 321, 116039. doi:10.1016/j.jenvman.2022.116039
Huang, Q., Peng, Y. L., and Qin, W. J. (2018). Research on land use suitability evaluation: A case study of savan water economic zone in Laos. Remote Sens. Land & Resour. 30 (4), 156–162. doi:10.6046/gtzyyg.2018.04.23
Izakovicova, Z., Miklos, L., Miklosova, V., and Petrovic, F. (2019). The integrated approach to landscape management-experience from Slovakia. Sustainability 11 (17), 4554. doi:10.3390/su11174554
Jiang, L. G., Yang, C., and Liu, Y. (2021). Spatiotemporal changes of economic and social development in Laos based on nighttime light data, 1992-2020. Resour. Sci. 43 (12), 2381–2392. doi:10.18402/resci.2021.12.02
Kang, Z, W., Zhang, Z, Y., Wei, H., Liu, L., Ning, S., Zhao, G, N., et al. (2020). Landscape ecological risk assessment in Manas River Basin based on land use change. Acta Ecol. Sin. 40 (18), 6472–6485. doi:10.5846/stxb201908191731
Kapustka, L. A., Bowers, K., Isanhart, J., Martinez-Garza, C., Finger, S., Stahl, R. G., et al. (2016). Coordinating ecological restoration options analysis and risk assessment to improve environmental outcomes. Integr. Environ. Assess. Manag. 12 (2), 253–263. doi:10.1002/ieam.1673
Karimian, H., Zou, W., Chen, Y., Xia, J., and Wang, Z. (2022). Landscape ecological risk assessment and driving factor analysis in Dongjiang river watershed. Chemosphere 307 (3), 135835. doi:10.1016/j.chemosphere.2022.135835
Kumar, V., Sharma, A., Pandita, S., Bhardwaj, R., Thukral, A. K., and Cerda, A. (2020). A review of ecological risk assessment and associated health risks with heavy metals in sediment from India. Int. J. Sediment Res. 35 (5), 516–526. doi:10.1016/j.ijsrc.2020.03.012
Liang, Y. H., Zhen, L., Jia, M. M., Hu, Y. F., Zhang, C. S., and Luo, Q. (2019). Consumption of ecosystem services in Laos. Journal of Resources and Ecology 10 (6), 641–648. doi:10.5814/j.issn.1674-764x.2019.06.009
Li, Q. P., Zhang, Z. D., Wan, L. W., Yang, C. X., Zhang, J., Ye, C., et al. (2019). Landscape pattern optimization in Ningjiang River Basin based on landscape ecological risk assessment. Acta Geogr. Sin. 74 (7), 1420–1437. doi:10.5846/stxb202012313341
Li, X, H., and Li, J, Y. (2008). Analysis on regional landscape ecological risk based on gis: A case study along the lower reaches of the weihe river. Arid Zone Res. 25 (6), 899–903. doi:10.13866/j.azr.2008.06.001
Li, Z., Jiang, W., Wang, W., Chen, Z., Ling, Z., and Lv, J. (2020). Ecological risk assessment of the wetlands in Beijing-Tianjin-Hebei urban agglomeration. Ecol. Indic. 117, 106677. doi:10.1016/j.ecolind.2020.106677
Liu, C., Xie, W. L., Lao, T. F., Yao, Y. T., and Zhang, J. (2021). Application of a novel grey forecasting model with time power term to predict China’s GDP. Grey Systems-Theory Appl. 11 (3), 343–357. doi:10.1108/gs-05-2020-0065
Liu, J., and Zhou, X. (2022). Neural network model design for landscape ecological planning assessment based on hierarchical analysis. Comput. Intell. Neurosci. 2022, 1–11. doi:10.1155/2022/1926227
Lü, L, T., Zhang, J., Sun, C, Z., Wang, X, R., and Zheng, D, F. (2018). Landscape ecological risk assessment of Xi river Basin based on land-use change. Acta Ecol. Sin. 38 (16), 5952–5960. doi:10.5846/stxb201708111440
Luo, T., Tan, R., Kong, X., and Zhou, J. (2019). Analysis of the driving forces of urban expansion based on a Modified logistic regression model: A case study of wuhan city, central China. Sustainability 11, 2207. doi:10.3390/su11082207
Luo, Z. W., Hu, X, J., Wei, B. J., Cao, P., Cao, S. Y., and Du, X. Y. (2020). Urban landscape pattern evolution and prediction based on multi-criteria CA-Markov model: Take shanghang county as an example. Econ. Geogr. 40 (10), 58–66. doi:10.15957/j.cnki.jjdl.2020.10.007
Malekmohammadi, B., and Blouchi, L. R. (2014). Ecological risk assessment of wetland ecosystems using multi criteria decision making and geographic information system. Ecol. Indic. 41, 133–144. doi:10.1016/j.ecolind.2014.01.038
Min, X. B., Xie, X. D., Chai, L. Y., Liang, Y. J., Li, M., and Ke, Y. (2013). Environmental availability and ecological risk assessment of heavy metals in zinc leaching residue. Trans. Nonferrous Metals Soc. China 23 (1), 208–218. doi:10.1016/s1003-6326(13)62448-6
Mondal, B., Sharma, P., Kundu, D., and Bansal, S. (2021). Spatio-temporal assessment of landscape ecological risk and associated drivers: A case study of Delhi. Environ. urbanization Asia 12 (1S), 85–106. doi:10.1177/09754253211007830
Nathaniel, S. P. (2021). Environmental degradation in ASEAN: Assessing the criticality of natural resources abundance, economic growth and human capital. Environ. Sci. Pollut. Res. 28 (17), 21766–21778. doi:10.1007/s11356-020-12034-x
Nawrocki, J. A., Schooley, R. L., and Ward, M. P. (2019). When good animals love restored habitat in bad neighborhoods: Ecological traps for eastern cottontails in agricultural landscapes. Biodivers. Conservation 28 (4), 953–973. doi:10.1007/s10531-019-01704-z
Peng, J., Dang, W. X., Liu, Y. X., Zong, M. L., and Hu, X, X. (2015). Research progress and prospect of landscape ecological risk assessment. Acta Geogr. Sin. 70 (4), 664–677. doi:10.11821/dlxb201504013
Peng, Y. L., Ke, W., Peng, Z., and Qin, W. J. (2017). Multi-scale suitability assessment of agricultural land in Savan District, Laos, 2017 6th International Conference on Agro-Geoinformatics.
Peng, Y. L., Xu, X. X., Kui, J. Q., Liu, Fei. Y., Qin, W. J., and Xia, Y. (2021). Spatially optimum allocation of land resource in Kaysone Phomvihane city, Laos. Bull. Soil Water Conservation 41 (5), 160–165+373. doi:10.13961/j.cnki.stbctb.2021.05.022
Peng, Y., Mi, K., Qing, F., Liu, X., Liu, L., and Chen, Q. (2016). Ecological risk assessment for key industrial development zones in the areas surrounding the Bo Sea in China. Hum. Ecol. Risk Assess. 22 (2), 475–488. doi:10.1080/10807039.2015.1080592
Renkeyao, A., R., and Gul, A. (2018). China-Laos economic corridor: Challenges for regional and policy countermeasures. Glob. Econ. Rev. 3 (2), 67–75. doi:10.31703/ger.2018(III-II).07
Sharma, R., Sinha, A., and Kautish, P. (2020). Examining the impacts of economic and demographic aspects on the ecological footprint in South and Southeast Asian countries. Environ. Sci. Pollut. Res. 27 (29), 36970–36982. doi:10.1007/s11356-020-09659-3
Sun, C, Z., Yan, X, L., and Zhong, J, Q. (2014). Evaluation of the landscape patterns vulnerability and analysis of spatial correlation patterns in the lower reaches of Liaohe River Plain. Acta Ecol. Sin. 34 (2), 247–257. doi:10.5846/stxb201303200465
Sun, L. R., Ma, J., Zhou, D. M., and Zhang, J. (2022). Temporal and spatial distribution characteristics of landscape ecological risk in the Shiyang River basin. Ecol. Sci. 41 (2), 194–203. doi:10.14108/j.cnki.1008-8873.2022.02.023
Sun, L. R., Zhou, D. M., Cen, G. Z., Ma, J., Dang, R., Ni, F., et al. (2021). Landscape ecological risk assessment and driving factors of the Shule River Basin based on the geographic detector model. Arid. Reg. Geogr. 44 (5), 12. doi:10.12118/j.issn.1000-6060.2021.05.19
Tian, C., Cheng, L, L., and Yin, T, T. (2022). Impacts of anthropogenic and biophysical factors on ecological land using logistic regression and random forest: A case study in Mentougou district, beijing, China. J. Mt. Sci. 19 (2), 433–445. doi:10.1007/s11629-021-7022-x
Tian, P., Cao, L. D., Li, J. L., Pu, R. L., Gong, H. B., and Li, C. D. (2021). Landscape characteristics and ecological risk assessment based on multi-scenario simulations: A case study of yancheng coastal wetland, China. Sustainability 13 (1), 149. doi:10.3390/su13010149
Tian, P., Shi, X. L., Li, J. L., Wang, L. J., and Liu, R. Q. (2018). Land use change and ecological risk assessment in Hangzhou. Bull. Soil Water Conservation 38 (4), 274–281. doi:10.13961/j.cnki.stbctb.2018.04.044
Vilaysouk, X., Schandl, H., and Murakami, S. (2019). A comprehensive material flow account for Lao PDR to inform environmental and sustainability policy. J. Industrial Ecol. 23 (3), 649–662. doi:10.1111/jiec.12764
Wang, J, Y., Zhao, G, X., and Du, C, W. (2005). Analysis on the regional ecological environment vulnerability based on the information of spatial structure of landscapes——a case study in kenli country located in the yellow river delta. Arid Zone Res. 22 (3), 317–321. doi:10.13866/j.azr.2005.03.008
Wang, J., Cui, B., Liu, J., and Yao, H. (2008). The effect of land use and its change on ecological risk in the lancang river watershed of yunnan province at the landscape scale. Acta Sci. Circumstantiae 28 (2), 0269–0277. doi:10.13671/j.hjkxxb.2008.02.007
Wang, J. F., and Xu, C. D. (2017). Geographical probe: Principle and prospect. J. Geogr. 72 (1), 116–134. doi:10.11821/dlxb201701010
Wenning, R. J. (2011). Broadening the ecology in ecological risk assessment. Integr. Environ. Assess. Manag. 7 (2), 155. doi:10.1002/ieam.184
Xie, X, P., Chen, Z, C., Wang, F., Bai, M, W., and Xu, W. Y. (2017). Ecological risk assessment of Taihu Lake basin based on landscape pattern. Chin. J. Appl. Ecol. 28 (10), 3369–3377. doi:10.13287/j.1001-9332.201710.016
Xu, Q., Guo, P., Jin, M., and Qi, J. (2021). Multi-scenario landscape ecological risk assessment based on Markov-FLUS composite model. Geomatics Nat. Hazards Risk 12 (1), 1449–1466. doi:10.1080/19475705.2021.1931478
Xu, W. X., Wang, J. M., Zhang, M., and Li, S. J. (2021). Construction of landscape ecological network based on landscape ecological risk assessment in a large-scale opencast coal mine area. J. Clean. Prod. 286, 125523. doi:10.1016/j.jclepro.2020.125523
Yang, Y., Wang, W., Qiao, J., and Zhang, E. (2022). An improved gray neural network method to optimize spatial and temporal characteristics analysis of land-use change. Comput. Intell. Neurosci. 2022, 2699031–2699111. doi:10.1155/2022/2699031
Yu, J., Tang, B., Chen, Y. H., Zhang, L., Nie, Y., and Deng, W. S. (2022). Landscape ecological risk assessment and ecological security pattern construction in landscape resource-based city: A case study of zhangjiajie city. Acta Ecol. Sin. 42 (4), 1290–1299. doi:10.5846/stxb202012313341
Yu, T., Bao, A., Xu, W., Guo, H., Jiang, L., Zheng, G., et al. (2020). Exploring variability in landscape ecological risk and quantifying its driving factors in the amu darya delta. Int. J. Environ. Res. Public Health 17 (1), 79. doi:10.3390/ijerph17010079
Zaehringer, J. G., Llopis, J. C., Latthachack, P., Thein, T. T., and Heinimann, A. (2018). A novel participatory and remote-sensing-based approach to mapping annual land use change on forest frontiers in Laos, Myanmar, and Madagascar. J. Land Use Sci. 13 (1-2), 16–31. doi:10.1080/1747423x.2018.1447033
Zhang, X, B., Shi, P, J., Luo, J., LiuHai, L., and Wei, W. (2014). The ecological risk assessment of arid inland river basin at the landscape scale: A case study on shiyang river basin. J. Nat. Resour. 29 (3), 410–419. doi:10.11849/zrzyxb.2014.03.005
Zhang, Y., Li, Y., Lv, J., Wang, J., and Wu, Y. (2021). Scenario simulation of ecological risk based on land use/cover change- A case study of the Jinghe county, China. Ecol. Indic. 131, 108176. doi:10.1016/j.ecolind.2021.108176
Zhang, Y., Zhang, F., Zhou, M., Ren, Y., and Wang, J. (2016). Landscape ecological risk assessment and its spatio-temporal variations in Ebinur Lake region of inland arid area. Chin. J. Appl. Ecol. 27 (1), 233–242. doi:10.13287/j.1001-9332.201601.001
Zhao, Y., Kasimu, A., Liang, H., and Reheman, R. (2022). Construction and restoration of landscape ecological network in urumqi city based on landscape ecological risk assessment. Sustainability 14 (13), 8154. doi:10.3390/su14138154
Zhao, Y., Wu, F, P., Li, F., Chen, X, N., Xu, X., and Shao, Z, Y. (2021). Ecological compensation standard of trans-boundary river basin based on ecological spillover value: A case study for the lancang-Mekong river basin. Int. J. Environ. Res. Public Health 18 (3), 1251. doi:10.3390/ijerph18031251
Keywords: landscape ecological risk, influencing factors, Geodetector, Markov-PLUS model, Savan District, Laos
Citation: Xuexian X, Yuling P and Wenjie Q (2023) Simulation, prediction and driving factor analysis of ecological risk in Savan District, Laos. Front. Environ. Sci. 10:1058792. doi: 10.3389/fenvs.2022.1058792
Received: 03 October 2022; Accepted: 16 December 2022;
Published: 10 January 2023.
Edited by:
Deng Xiangzheng, Institute of Geographic Sciences and Natural Resources Research (CAS), ChinaReviewed by:
Piling Sun, Qufu Normal University, ChinaCopyright © 2023 Xuexian, Yuling and Wenjie. This is an open-access article distributed under the terms of the Creative Commons Attribution License (CC BY). The use, distribution or reproduction in other forums is permitted, provided the original author(s) and the copyright owner(s) are credited and that the original publication in this journal is cited, in accordance with accepted academic practice. No use, distribution or reproduction is permitted which does not comply with these terms.
*Correspondence: Peng Yuling, eXVsaW5ncGVuZ3dpdEAxNjMuY29t
Disclaimer: All claims expressed in this article are solely those of the authors and do not necessarily represent those of their affiliated organizations, or those of the publisher, the editors and the reviewers. Any product that may be evaluated in this article or claim that may be made by its manufacturer is not guaranteed or endorsed by the publisher.
Research integrity at Frontiers
Learn more about the work of our research integrity team to safeguard the quality of each article we publish.