 Peiyang Zhao1,2
 Jiali Kou
94% of researchers rate our articles as excellent or good
Learn more about the work of our research integrity team to safeguard the quality of each article we publish.
Find out more
ORIGINAL RESEARCH article
Front. Environ. Sci. , 01 December 2022
Sec. Environmental Economics and Management
Volume 10 - 2022 | https://doi.org/10.3389/fenvs.2022.1058612
Green total factor productivity (GTFP) is a major driver of environmental governance, climate change mitigation, and green transformation in China. This study aims to improve GTFP, reduce regional differences, and promote sustainable development. Herein, the slacks-based measure-global Malmquist–Luenberger index was used for the scientifically rigorous measurement of China’s GTFP from 2000 to 2019. Dagum’s Gini coefficient decomposition and kernel density estimation methods were used to explore GTFP regional differences and distributional dynamics. Finally, spatial GTFP heterogeneity driving factors were analyzed using a geodetector tool. We found that China’s GTFP is on an overall upward trend, driven mainly by technological progress. There were substantial spatial differences in China’s GTFP, primarily caused by transvariation intensity, the average contribution of which is 43.26%. Differences in GTFP between and within regions decreased to varying degrees over time. Spatial heterogeneities in China’s GTFP were primarily caused by driving factors interactions, which were stronger than their individual effects. Thus, we recommend that China should accelerate the establishment of a new coordinated regional development mode, improve its green technology innovation capacity, increase openness, and push for a green model of development.

GRAPHICAL ABSTRACT | Flow chart of China GTFP.
The rapid development of the global economy and anthropogenic climate change have precipitated a series of environmental issues (Li G et al., 2022; Zhang et al., 2022), including rising sea levels, melting glaciers, species extinction, and newly emerging diseases. These problems pose a considerable challenge for the sustainable development of human society (Holden et al., 2014; Han et al., 2020; Zhu et al., 2021). Global warming is currently the most remarkable driver of global environmental change. Carbon dioxide (CO2) is the primary greenhouse gas driving global warming, and the rapid growth of industrial economies worldwide has greatly increased CO2 emissions (Lee and Lee, 2022). Therefore, there is a growing consensus that the global economy must shift towards new energy sources, reduce carbon emission intensity, increase green total factor productivity (GTFP), and promote green low-carbon development. In the 40-odd years that have passed since the Chinese economic reform, China has industrialized and urbanized at a blinding pace, and the gross domestic product (GDP) of China surpassed that of Germany in 2008 and Japan in 2010. China’s rapid economic development is an envy for the world. However, this achievement has been accompanied by severe environmental issues as the extensive GDP-focused economic growth of China has led to the rapid development of industries with high emissions, high energy consumption, low added value, and low efficiency (Xie et al., 2018; Zhang and Wu, 2021). China is currently the world’s largest carbon emitter (Yang et al., 2019). Therefore, China is faced with an urgent task of increasing its GTFP, developing a green, low-carbon economy, and constructing an ecological civilization.
Kaya and Yokobori (1993) considered CO2 as a factor of production and proposed that the TFP needs to be improved for the development of a greener economy. A 2008 report from the McKinsey Global Institute stated that carbon productivity must increase tenfold over the next 50 years to meet the CO2 reduction rate required by commonly discussed climate change abatement paths (Mckinsey, 2008). The TFP is generally calculated using both parametric and non-parametric methods (Li L et al., 2022). Among these, stochastic frontier analysis (SFA) is currently the most used parametric method for TFP calculations. The non-parametric approach usually refers to data envelopment analysis (DEA) (Liu et al., 2022a), which includes the Charnes, Cooper, and Rhodes DEA model, and the epsilon-based measure model. However, SFA needs to determine the specific form of the production frontier. Furthermore, the estimation bias can be large if the sample size is small (Gong and Sickles, 1992; Lin and Wang, 2014). The DEA method can solve the above problems and is widely used in academic research (Feng et al., 2018; Cheng et al., 2020). Peng et al. (2022) analyzed GTFP in the Yangtze Delta River (YDR) region using DEA and Tobit models, and the study showed that there are significant regional differences in GTFP between YDR regions. Tang and Qin (2021) use a three-stage DEA model to find that local government competition can severely inhibit GTFP increases and that there is regional heterogeneity. Therefore, DEA measures GTFP optimally.
As a responsible nation, China has always sought to contribute actively to global economic growth and sustainable development. In September 2020, President Xi Jinping proposed that China would strive to peak carbon emissions by 2030 and achieve carbon neutrality by 2060 (Xi, 2020). However, the ongoing COVID-19 pandemic has placed significant downward pressure on the domestic economy of China, increasing the need to improve GTFP to ensure high-quality economic development. In addition, there are other factors influencing China’s GTFP, and significant regional differences exist in China in terms of economic development (Feng and Wang, 2019), environmental regulation (Yuan and Zhang, 2020), technological innovation (Li Z et al., 2022), and industrial structure (Sun H et al., 2022). This raises a few pertinent questions: How does one perform a scientifically rigorous measurement of China’s GTFP? What is the extent of the spatial difference of GTFP in China as a whole and its three major regions? How do these spatial differences evolve over time? What are the main drivers of GTFP in China? An in-depth study of the above questions provides an objective and comprehensive understanding of the current state of GTFP in China, which is important for achieving the 2030 and 2060 decarbonization goals of China and realizing a new coordinated mode of regional development.
To fill the gaps in existing studies, we used the slacks-based measure-global Malmquist–Luenberger (SBM-GML) index method to measure the GTFP of Chinese regions from 2000 to 2019, and analyzed the spatial differences of regions in depth using the Gini coefficient decomposition and kernel density estimation (KDE) methods, and also conducted a study on the factors influencing the GTFP of China using a geodetector tool. The main goal of this study is to improve the GTFP of each region in China, reduce the development differences among regions, and achieve coordinated regional development and green development. Moreover, this study can provide a useful reference for China and other developing countries to develop a high-quality economy.
The four main contributions of this study are as follows: 1) The SBM-GML index was used to perform a scientifically rigorous measurement of the GTFP of China to facilitate the enrichment of methodological studies of GTFP. 2) In view of China’s decarbonization goals, the GTFP of China was computed using CO2 as the only undesirable output. Because the effects of inputs and outputs in afforested areas quickly manifest in China’s net CO2 emissions, the afforested area was included as an input factor, which fills a gap in existing research. 3) KDE and Dagum’s Gini coefficient decomposition were used to analyze China’s GTFP in terms of absolute and relative disparities, respectively, which led to a comprehensive analysis of the spatial differences and characteristics of GTFP in each region. 4) A geodetector was used to analyze the effects of individual factors and their interactions on the spatial heterogeneity of China’s GTFP, which was beneficial for the government to formulate policies to improve GTFP according to time and place.
The remainder of this paper is presented below. Section 2 is a literature review; Section 3 describes the methods and data; Section 4 presents the results and discussion; and Section 5 summarizes the conclusions and makes recommendations.
Based on the existing literature, this study focuses on three aspects of the theoretical literature: Porter’s hypothesis theory, innovation theory, and sustainable development theory.
Environmental degradation, climate warming, and energy shortages present serious challenges to socioeconomic development and human health (Jacobs, 2022; You and Xiao, 2022). Countries around the world have developed new energy sources to reduce fossil energy consumption and develop green economies (Sun J et al., 2022). GTFP is an important indicator of high-quality economic development, and improving GTFP is crucial for developing a green economy. According to Porter’s hypothesis theory, appropriate environmental regulation can increase firms’ innovative activities (Costantini et al., 2017), further enhancing their GTFP and strengthening their market competitiveness (Porter and Linde, 1995). Rubashkina et al. (2015) found that environmental regulation positively affects the output of innovative activities. Liu et al. (2020) found that low-carbon pilot policies have a catalytic effect on GTFP. Technological innovation is the core driving force of GTFP development, and the improvement of technological innovation level is crucial to GTFP development. According to innovation theory, innovation is the recombination of production factors and production conditions (Schumpeter and Backhaus, 1934). Green innovations are new products that provide value to consumers and businesses while reducing their environmental impact (Fussier, 1996). Both wang et al. (2020) and wang C et al. (2021) found that technological innovation can promote GTFP improvement. The connotation of sustainable development theory is the pursuit of both the quality of economic growth and the sustainable use of resources to achieve coordinated economic, social, and environmental development (WCED, 1987). Green innovation has a strong focus on resource and environmental sustainability (Liao and Li, 2022). The goal of green innovation is to achieve social, economic, and environmental sustainability (Obobisa et al., 2022). Our research further enriches the development of green innovation theory. In conclusion, the transition of global economic development to a green economy has increased the demand for improving GTFP, and the severe environmental problems also urgently require improving GTFP and developing a low-carbon economy, thus promoting sustainable, economic, and social development.
The literature on GTFP has been richly researched and summarized in the following two aspects: first, research methods; and second, regional differences and influencing factors.
First, the research method involves the DEA model, which is most widely used in TFP measurement. Although radial distance functions are commonly used in DEA, they require inputs and outputs to vary proportionally, which often does not occur in the real world. Furthermore, the lack of slack variables in these models likely results in unrealistic DEA efficiency scores. The DEA-based Malmquist index is commonly used for calculating productivity. However, real-world production processes always contain both “good” (desirable) and “bad” (undesirable) outputs; as the effects of the latter are not considered by the Malmquist index, the productivities calculated by this method will be inaccurate. To address this problem, Chung et al. (1997) proposed the ML index, which considers undesirable outputs. However, computations based on the ML index are unstable and error-prone. Therefore, many researchers (Tone, 2001; Fukuyama and Weber, 2009; Färe and Grosskopf, 2010) proposed increasingly generalizable non-radial unoriented SBM directional distance functions to solve this problem, which allowed the efficiency of undesirable outputs to be evaluated using DEA (Fang L et al., 2020; Liu et al., 2022b).
Spatial differences in China’s GTFP can be analyzed using various methods, such as the coefficient of variation (Wu, 2018), direct comparison of indicator values (Geng et al., 2018). Theil index (Wang et al., 2022), and Dagum’s Gini coefficient decomposition (Lu et al., 2022). However, identifying the cause of spatial differences in the GTFP by simply comparing indicator values is not possible. Additionally, the coefficient of variation and Theil index do not account for subgroup distributions and within-group overlapping, making it impossible to estimate the contribution of between-group difference to total difference. Dagum’s Gini coefficient decomposition can identify the source of regional differences and account for within-group overlapping (Wang M et al., 2021), but it is not often used to study regional differences in the GTFP. KDE is a non-parametric method that provides an intuitive overview of the spatial dispersion and agglomeration of GTFP (Dai et al., 2020). For instance, KDE was used by (Cui et al., 2019) to explore the GTFP trends of Chinese industries. Although many methods are available for analyzing spatial heterogeneity, the most common are variance decomposition, quadratic assignment procedure (QAP), and the geodetector method. Variance decomposition ignores the regional differences in each variable, whereas QAP is limited to the analysis of spatial heterogeneity. In contrast, geodetectors reveal the underlying drivers of spatial heterogeneity as well as the role of individual factors and their interactions. Therefore, geodetectors have been widely used in economic studies (Zhao et al., 2020) and were used in this study to elucidate the drivers of GTFP heterogeneities in China (Wang et al., 2020). The main drivers of GTFP are environmental regulation, industrial structure, and energy structure (Cheng et al., 2019; Xu, 2020).
Second, the regional differences and impact factors. Research on industry perspective is reported in the literature. Particularly, Liu et al. (2021) found that the GTFP of Chinese agriculture showed an overall growth trend, and recommendations were made to increase agricultural science and technology R&D and expand agricultural openness. Chen et al. (2022) found that agricultural GTFP was highest in the eastern region, foreign trade in agricultural products can increase GTFP. Chen and Golley (2014) found that China’s industrial GTFP is influenced by the growth of the small private sector and the level of openness. Fang C et al. (2021) found that FDI can contribute to higher GTFP in extractive industries. However, investment in technological innovation has a dampening effect. Yuan et al. (2019) analyzed the regional greening efficiency of the Shandong Peninsula urban agglomeration using the DEA- Malmquist model, and found that there were significant inter-city differences, mainly owing to the unreasonable industrial structure. Similarly, Li Y et al. (2021) studied the GTFP of YDR in China and proposed to reduce government intervention and strengthen foreign investment guidance. Song et al. (2022) estimated the green economic effectiveness (GEE) of provinces in the Yangtze River Economic Belt (YREB) using the super SBM model and found that the inter-basin differences were greater than the intra-basin differences. Zhong et al. (2022) measured industrial GTFP of 108 cities in YREB based on DEA model with metafrontier infrastructure framework and ML index. These results showed that industrial base and government support have a strong impact on GTFP. Li and Chen (2021) analyzed the GTFP of the Pearl River Delta Urban Agglomeration (PRDUA), and found that the GTFP gap between PRD cities generally showed a decreasing trend. In summary, there are notable regional differences in GTFP, and the factors influencing GTFP are heterogeneous and vary depending on region and industry.
Although studies on GTFP have produced many meaningful insights, numerous problems are yet to be addressed. First, radial and angular DEA models are commonly used to estimate the GTFP, but they can lead to bias. This problem can be solved using non-radial and non-angular DEA models. Second, most studies on the GTFP have been limited to capital, labor, and energy inputs, with few including the undesirable output of CO2. Third, studies on spatial GTFP heterogeneity in China are scarce, and most of these studies only discuss relative or absolute disparities. Fourth, studies on the effects of individual factors on China’s GTFP are common, whereas studies on individual and interaction effects are scarce. Therefore, this study used the SBM-GML index to measure the GTFP, then analyzed the spatial differences of GTFP in terms of both relative and absolute differences, and finally analyzed the influencing factors of GTFP using a geodetector tool.
The GML index proposed by Oh (2010) was used in this study, which was based on a global production possibility set established at the time of TFP computation (Xu et al., 2019).
Based on the approach of Färe et al. (2007), we constructed a production possibility set that contains both good (desirable) and bad (undesirable) outputs. Suppose that each DMU k in period t requires N inputs x and produces M good outputs y and I bad outputs b. The global production possibility set obtained from DEA is as follows:
Based on the method of Fukuyama and Weber (2009), the global SBM directional distance function for CO2 emissions is defined as
In these equations, the vectors
We constructed a GML index to compute China’s GTFP using the method reported by Oh (2010). The GML index is defined as follows:
A
Dagum’s Gini coefficient decomposition was used to compute the extent and sources of spatial difference in China’s GTFP (Dagum, 1997). The Gini coefficient is expressed as follows:
where yji (yhr) is the GTFP of province i(r) in region j(h),
In these equations,
where djh is the difference in GTFP influence between regions j and h, this can be interpreted as the mathematical expectation of the sum of all
KDE is a robust method that has only weak model dependence. It was used to fit sample data using smooth peak functions (kernels) to produce a continuous density curve that describes the distribution of random variables. The density function is expressed as follows:
where f(x) is the kernel density estimate, K (∙) is the kernel function, xi is the independent identically distributed observations, x is the mean observation, and h is the bandwidth. The smaller the bandwidth, the less smooth the curve and the higher the accuracy.
Geodetector is a statistical tool that is used to analyze the spatial heterogeneity of things and thus reveal the underlying drivers of spatial heterogeneity (Wang et al., 2010). It can be used to elucidate the impact of individual factors as well as the effects arising from interactions between factors (Wang and Hu, 2012). In this study, the independent variables were classified using the natural break method with five classes in ArcGIS. The factor detection computes the effect of each factor in driving China’s GTFP in terms of the q statistic, whose value range is [0,1]. q is given by:
In these equations, h = 1, …, L is the class of variable Y or factor X; Nh and N are the number of cells in class h and the entire region, respectively; and
Based on the availability of data, we selected panel data of 30 Chinese1 provinces for this study. These provinces can be divided into three major regions: eastern, central, and western China2. Panel data were obtained from the China Energy Statistical Yearbook, provincial statistical yearbooks, and the National Bureau of Statistics of China database. The selected indicators are as follows:
(1) Capital input: The perpetual inventory method is widely used for capital stock estimations. Therefore, capital stocks were estimated based on the method of Shan (2008) to estimate the provincial physical capital stock as follows:
In this equation, Ii,t denotes the actual fixed capital stock of province i in year t, which is deflated using the fixed asset price index with 2000 as the base period, and δ denotes the capital depreciation rate of province i in year t, with δ = 10.96%. Ki,t is the current physical capital stock.
(2) Labor input: In theory, labor input should include labor time, the number of workers, and labor efficiency. However, owing to data limitations, the number of employed persons at the end of the year in each province was used as a proxy variable for labor input.
(3) Energy input: In this study, proxy variables for the energy input are the total consumption of eight types of energy (represented in units of standard coal), including raw coal, coke, and crude oil.
(4) Afforested area: The area of afforestation determines the size of forest carbon sinks. Limited by the natural properties of forest growth, the effects of afforested area inputs and outputs manifest immediately in net CO2 emissions. Therefore, afforestation area was selected as an input.
(5) Desired (good) output: Based on previous studies, we selected the GDP of each province as the proxy variable for the desired output. To exclude the effects of price fluctuations, the consumer price index was used to deflate GDP to the base year of 2000.
(6) Undesirable (bad) output: Since the purpose of this study is to compute China’s GTFP for a low-carbon economy, CO2 emissions were used as the proxy variable for undesired output (Li et al., 2018). Total CO2 emissions were calculated as follows:
In this equation, each type of fossil fuel is represented by i, and Ei, NCVi, CEFi, and COFi are the consumption, net calorific value (NCV), carbon emission factor (CEF), and carbon oxidation factor (COF) of fossil fuel i, respectively. The CO2 emission coefficient is the product of NCV, CEF, and COF. The CO2 emission coefficients of the fuels used in this study are listed in Table 1.
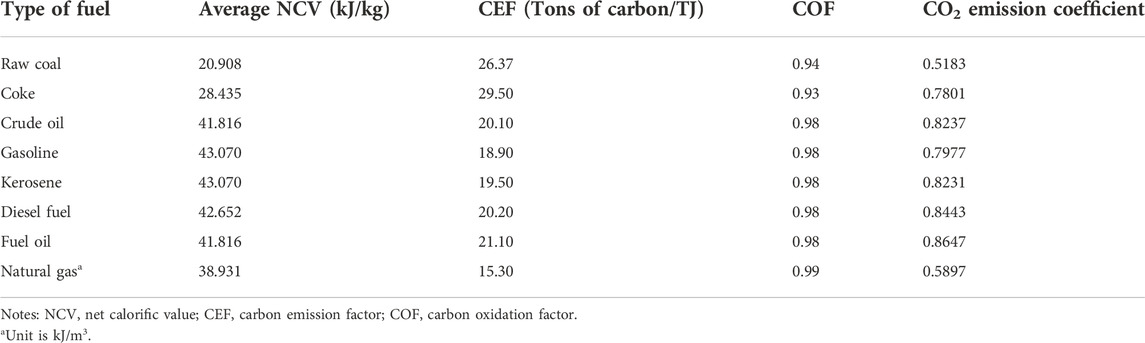
TABLE 1. CO2 emission coefficients for eight types of fossil fuels.
The GTFPs of 30 Chinese provinces during the 2000–2019 period were calculated as GML indices, which were subsequently decomposed into the global technology efficiency change (GEFFCH) and global technical progress change (GTECH) indices. Table 2 shows that China’s GTFP has grown over time, albeit in a fluctuating manner. China had a negative GTFP growth rate of 12% in 2001, which changed to a positive growth rate of 1.5% in 2019. The GTFP of China grew negatively during the 2001–2004, 2007–2009, and 2012–2015 periods and grew positively during the 2005–2006, 2010–2011, and 2016–2019 periods. The average annual growth rates of GEFFCH and GTECH were −2.1% and 1.2%, respectively. Hence, technical progress changes were the primary drivers of uptrend of GTFP. This is consistent with the results of Zhou et al. (2019). The main reason for the positive growth of the GTFP recently may be the important position that the 18th National Congress report offers to the construction of ecological civilization, emphasizing efforts to promote green development and low-carbon development. The guidance and implementation of the policy played an important role in improving GTFP. This finding is inconsistent with the results of Li and Liao (2020), who concluded that GTFP in developed countries exhibits a continuous growth trend, whereas GTFP in developing countries shows a decline before growth, with developed countries outperforming developing countries in terms of GTFP.
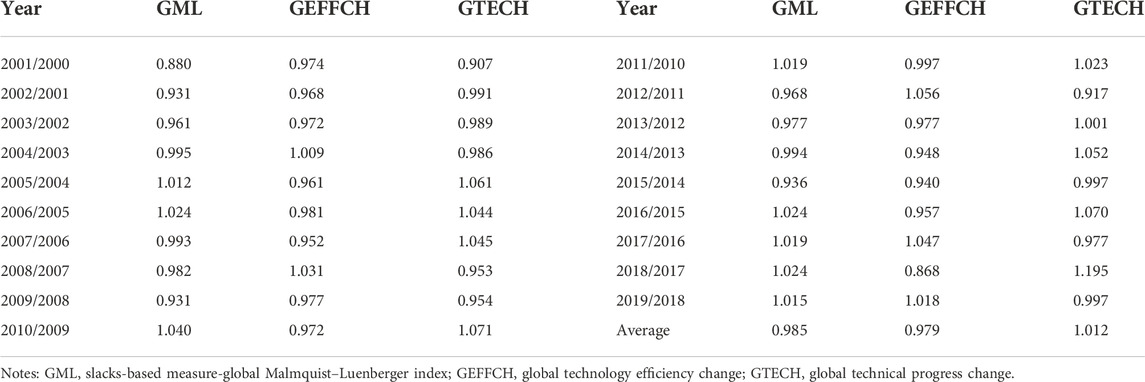
TABLE 2. GML index and its decomposed indicators for the GTFP of China.
Table 3 shows that increases in GTFP in China mainly occurred in eastern coastal cities, such as Beijing, Shanghai, Jiangsu, and Zhejiang, and technical progress changes are the primary drivers of GTFP growth at the provincial level. The average annual growth rate of the GTECH in eastern China was 2.4%, which was considerably higher than that in central and western China because advanced technologies and emerging industries were strongly promoted in the eastern coastal cities. This is consistent with the result of Huang C et al. (2022). The eastern region, with its advantageous geographical location, high level of green technology, and good business environment, can effectively promote the development of GTFP (Xu et al., 2022). The average annual growth rate of the GTFP was positive in Beijing (5.9%), Tianjin (0.1%), Shanghai (2.2%), Jiangsu (1.7%), Zhejiang (1.5%), Anhui (0.1%), Hubei (0.9%), and Chongqing (1%) provinces. The highest average annual GTFP growth rate was observed in Beijing, whose GTFP growth primarily came from its average annual growth in GTECH (5.9%). The average annual GTFP growth rate was negative in Hebei (−2.8%), Shanxi (−1.5%), Inner Mongolia (−4.7%), Liaoning (−6.2%), Shaanxi (−0.8%), and Gansu (−2.5%). In particular, Liaoning had the lowest average annual GTFP growth rate, which was mainly caused by an average annual GEFFCH growth rate of −6.1%. These provinces are large coal-producing regions, particularly Shanxi, Inner Mongolia, and Shaanxi are rich in coal resources, which is not conducive to the improvement of GTFP and once again verifies the “resource curse” or “Dutch disease."
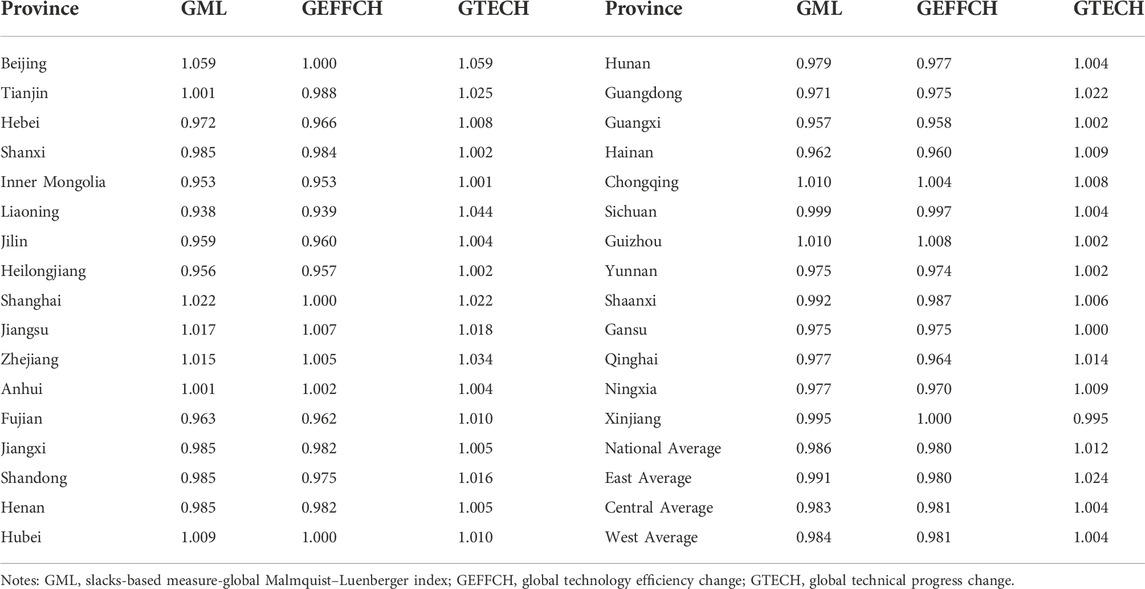
TABLE 3. GTFP index (GML) and its decomposed indicators for 30 Chinese provinces.
Dagum’s Gini coefficient decomposition was used to explore spatial differences in the GTFP of China and its sources.
Based on Table 4; Figure 1A, the overall Gini coefficient ranged from 0.015 to 0.073 during the study period and decreased from 0.066 in 2001 to 0.015 in 2019. The temporal evolution of spatial differences in China’s GTFP may be divided into three stages: a substantial decline in difference, followed by a minor increase in difference, and then another stage of significant decline. Overall, spatial GTFP differences in China have declined over time. Based on the within-region Gini coefficients, the eastern and central regions showed large GTFP differences, as their mean within-region Gini coefficients for the study period were 0.051 and 0.030, respectively. The western region had the smallest GTFP differences, with a mean within-region Gini coefficient of 0.024. The within-region Gini coefficients of the eastern, central, and western regions decreased at the annual average rates of 10.53%, 3.12%, and 3.78%, respectively. The trends of the Gini coefficient for the eastern and central regions were consistent with those of the overall Gini coefficient, as they also show the same “decrease–increase–decrease” pattern. The Gini coefficient of the western region on the other hand, had a “increase–decrease–increase–decrease” pattern. Therefore, overall, the within-region GTFP differences in the three regions of China have narrowed over time.
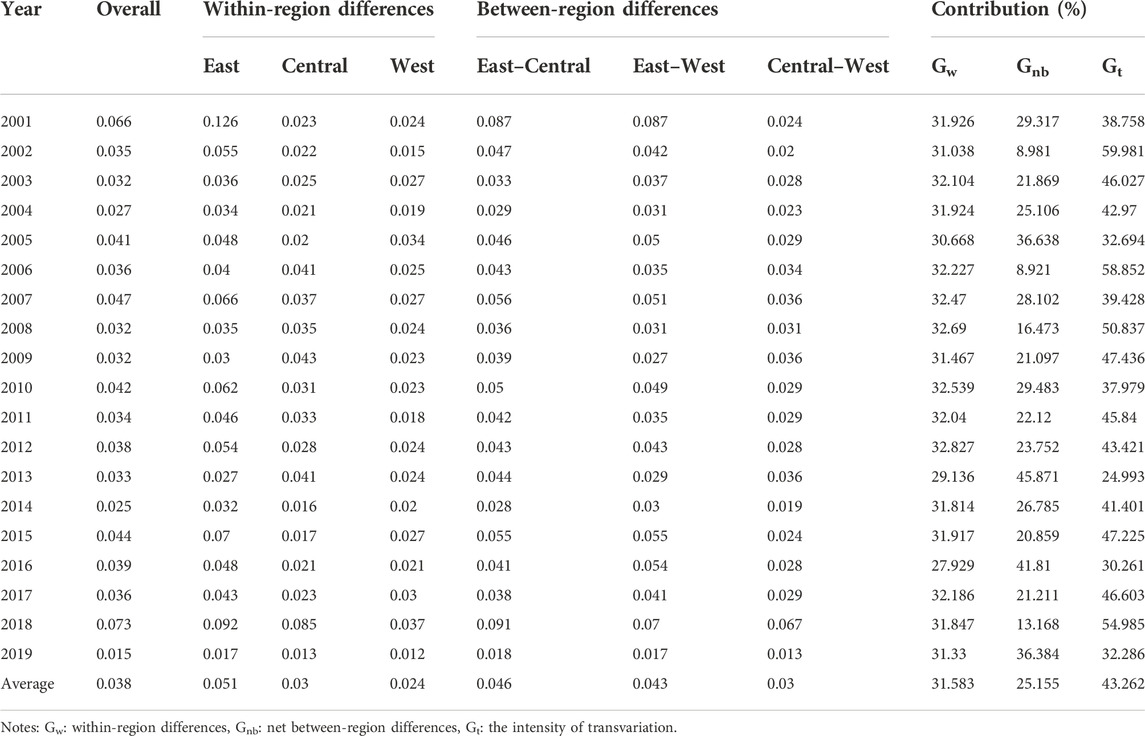
TABLE 4. National and regional Gini coefficients for GTFP difference in China and the contributions of each component of the decomposed Gini coefficient.
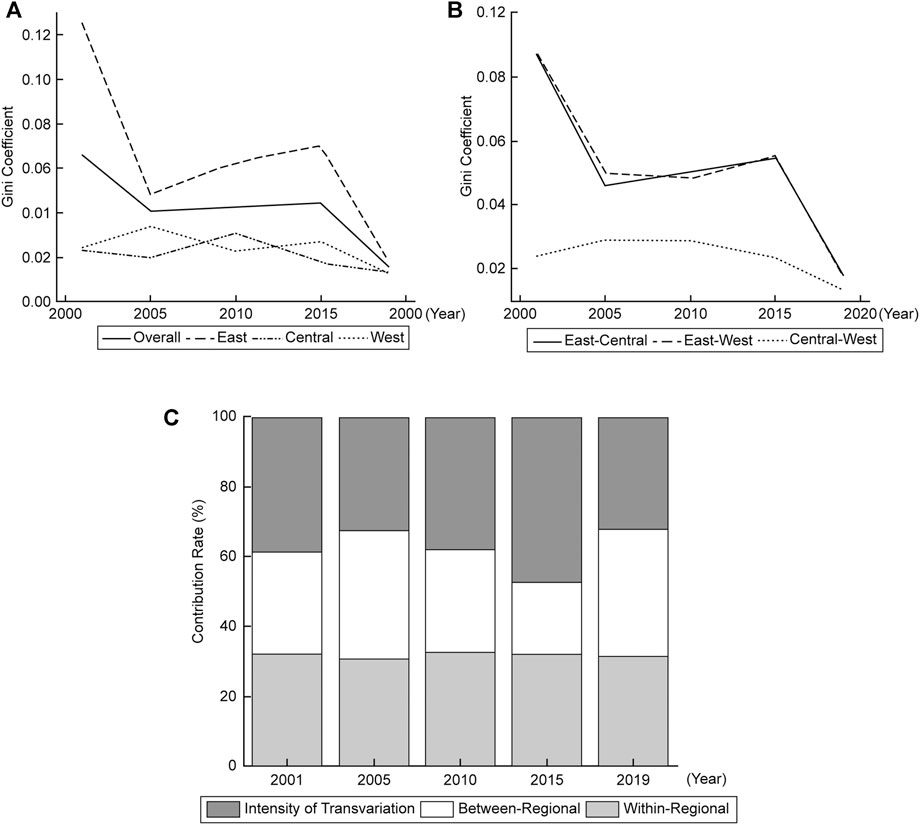
FIGURE 1. Evolution of the Gini coefficient for GTFP differences in China and the contributions of each Gini component. Notes: (A) Temporal evolution of Gini coefficients at the national and within-region levels; (B) Temporal evolution of Gini coefficients at the between region level; (C) Sources of regional GTFP quality and their contributions.
Based on the between-region Gini coefficients shown in Table 4; Figure 1B, the GTFP differences between eastern and central China and between eastern and western were large, with mean between-region Gini coefficients of 0.046 and 0.043, respectively. These coefficients decreased at the average annual rates of 8.38% and 8.67%, respectively. The GTFP difference between Central and West China was small, as the mean between-region Gini coefficient was only 0.030. The between-region Gini coefficients of the eastern–central and eastern–western regions had similar trends, as they had the same “significant decline–minor increase–significant decline” pattern in their fluctuations. The between-region Gini coefficient between central and western China trends was an inverted “U” shape, i.e., increasing and then decreasing. This indicates that GTFP differences in eastern–central, eastern–western, and central–western China contracted over time.
As shown in Table 4; Figure 1C, the average contributions of within-region Gini difference (Gw), between-region Gini difference (Gnb), and intensity of transvariation (Gt) to the spatial GTFP differences of China were 31.58%, 25.16%, and 43.26%, respectively. Hence, the intensity of transvariation was the main source of spatial GTFP difference in China. Gw and Gt decreased by an average of 0.10% and 1.01% per annum, respectively, whereas Gnb increased by an average of 1.21% per annum. Therefore, the contributions from Gt and Gnb had changed considerably. In contrast, the contribution of Gw was relatively stable.
In summary, looking at the decomposition of the Gini coefficients for China as a whole and for the three major regions, their Gini coefficients were generally getting smaller, which indicates that regional differences were narrowing. This is similar to the results of the study by Huang et al. (2021), who demonstrated narrowing of regional differences. The present results strongly support the study of Umetsu et al. (2003), who found that technological progress is the main reason for the growth of TFP of rice in the Philippines. Technological innovation is crucial to GTFP improvement. Yet, education must be given an appropriate level of priority to enhance China’s capacity for green technological innovation. However, these results are inconsistent with those revealed by Huang X et al. (2022). They argued that regional differences in GTFP are widened and that differences between regions are the main source of GTFP, which might be because their study is focused on GTFP in agriculture, further suggesting that the results of GTFP in China can be heterogeneous depending on regions, industries, and study subjects.
To examine the national and regional distributional dynamics of absolute difference GTFP disparities in China, KDE was used to analyze the location, shape, extensivity, and polarization of the national and regional GTFP distributions.
Figure 2A shows the distributional dynamics of the GTFP for all 30 provinces during the study period. The location of the distribution curve initially shifted right, then left, and right again, indicating that the GTFP of China increased. This result is consistent with the finding of Shi and Li (2019). Shape of the distribution: The main peak had a “decrease–increase–decrease–increase” fluctuation pattern in terms of its height and a “widening–narrowing–widening–narrowing” fluctuation pattern in terms of its width. Therefore, the difference in China’s GTFP was narrowing. Extensivity of the distribution: The GTFP distribution initially tailed to the left, then tailed to the right, and eventually lost its tail, indicating convergence. Therefore, intra-provincial disparities in GTFP had narrowed in China. Polarization of the distribution: The curve was either unimodal or bimodal in all years, indicating the presence of some degree of polarization in the GTFP distribution of China.
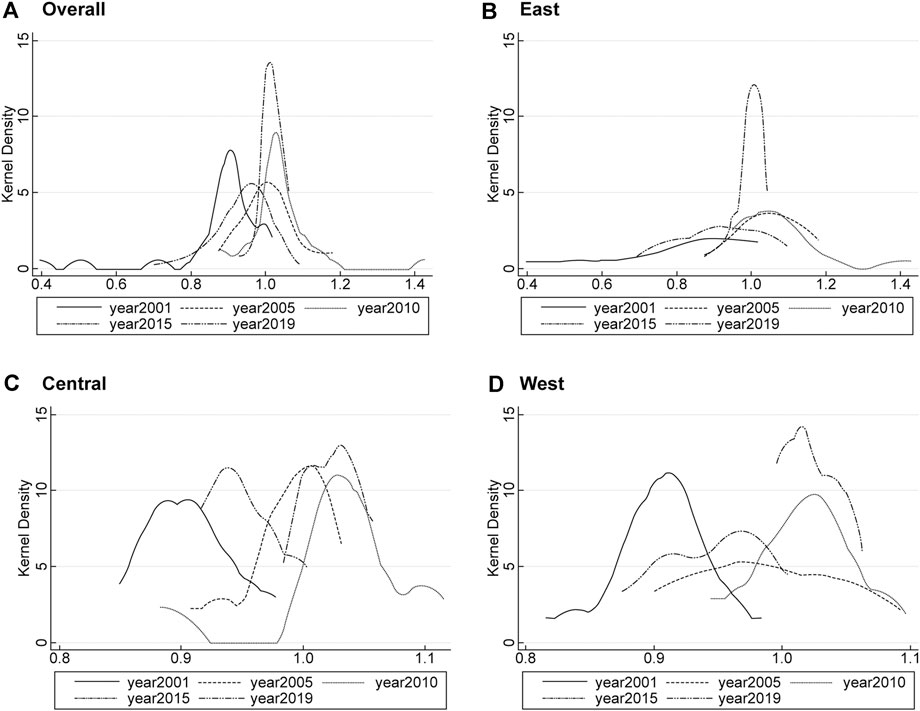
FIGURE 2. Temporal evolution of the national and regional GTFP distributions of China. Notes: (A) Overall temporal evolution; (B) Temporal evolution of the east; (C) Temporal evolution of the central; (D) Temporal evolution of the west.
The distributional dynamics of the GTFP in eastern, central, and western are shown in Figures 2B–D. Locations of the distributions: In all three regions, the location of the GTFP distribution shifted right, then left, and then right again. This is consistent with the dynamics of the national GTFP distribution and shows that the GTFP has been rising in all three regions. Shape of the distributions: Except for 2015, the height and width of the main peak in the GTFP curve of eastern China increased and contracted year-on-year, respectively. This indicates that the GTFP differences in eastern China have contracted over time. The main peak of the central China GTFP curve shows a “increase–decrease–increase” pattern in its height fluctuations, as well as constantly narrowing widths (except in 2019). The GTFP differences of central China, as a whole, narrowed over the study period. The GTFP curve of western China shows a “decrease–increase–decrease–increase” pattern in peak height and a “widening–narrowing–widening–narrowing” pattern in peak width. This indicates that the GTFP differences in the western region fluctuate quite frequently but had decreased as a whole. Extensivity of the distributions: All three regions show some tailing in their GTFP distributions, but as a whole, tailing had diminished owing to the distributions trending towards convergence. Therefore, the gaps between regional GTFPs and the average GTFP of China had contracted to varying degrees. Polarization of the distributions: All three regions had unimodal or bimodal distribution. Therefore, these regions had varying degrees of polarization. The central and western regions of China were mostly bimodal in distribution. Therefore, the GTFP distributions of western and central China were polarizing. The distributions of both regions also exhibited significant slopes. However, the eastern region did not exhibit a considerable slope. This may be because development in central and western China was largely concentrated in capital cities and key cities in their vicinity, whereas eastern China had a much more uniform distribution of development.
Based on the results of our study, the absolute differences in China in general and in the three regions showed a decreasing trend, which was consistent with the previous findings on relative differences (Liu and Xu, 2020). This is consistent with the conclusion by Bao et al. (2022), who observed gradual decrease in the absolute difference of grain GTFP in Poyang Lake area.
Spatial heterogeneity is the spatial manifestation of natural and socioeconomic processes, and the spatial heterogeneity of the GTFP in China has also been influenced by socioeconomic and natural environmental factors. Based on previous studies, we probed the effects of the following factors on GTFP: level of economic development (eco), which is represented by the real per capita GDP (Guo et al., 2021); energy structure (ene), which is represented by the ratio of coal consumption to total energy consumption (Wang and Jia, 2022); the intensity of environmental regulation (ers), which is represented by the ratio of industrial pollution control investment to industrial value added (Wei et al., 2012); the level of openness (ope), which is represented by the trade volume to GDP ratio (Peng et al., 2021); level of industrial structure (ins), which is represented by the ratio of the added value of tertiary industries to the added value of secondary industries (Shu and Qi, 2020); the level of technological innovation (tec), which is represented by the number of patent applications received (Liu et al., 2022); the level of education (edu), which is represented by years of per capita education (Földvári and van Leeuwen, 2009); and the level of governmental intervention (gov), which is represented by the ratio of fiscal expenditure to GDP (Huang and Xie, 2008). A geodetector was used to identify the key drivers of GTFP development in China and the types of interactions between factors.
Figure 3 illustrates the individual and interaction effects of the aforementioned factors on spatial GTFP heterogeneity in China over several five-year planning periods. Individual effects: Over the entire study period, the intensity of environmental regulation (0.4) and energy structure (0.09) were the strongest and weakest drivers of spatial GTFP heterogeneity in China, respectively. This is consistent with the results of the study by Xu et al. (2021). Environmental regulation can have a catalytic effect on GTFP. In the tenth five-year plan period, the strongest and weakest contributors were the level of openness (0.36) (Li J et al., 2021) and intensity of environmental regulation (0.03), respectively. In the eleventh five-year plan period, the level of economic development (0.33) was the primary driver of GTFP heterogeneity, and energy structure (0.03) was the weakest driver during this period. In the twelfth five-year plan period, government intervention (0.35) played a major role in driving spatial heterogeneities in the GTFP. Interaction effects: Over the entire study period, interactions between the level of industrial structure and level of education (0.87), level of educational and technological innovation (0.82), and the intensity of environmental regulation and level of industrial structure (0.82) played major roles in driving spatial GTFP heterogeneities, and the least impactful interaction was between energy structure and level of industrial structure (0.41). In the tenth five-year plan period, the interaction between level of education and level of openness (0.79) was the strongest driver of spatial GTFP heterogeneity. In the eleventh five-year plan period, energy structure–technological innovation (0.87) and education level–technological innovation (0.77) interactions were important drivers of spatial GTFP heterogeneity, and the interaction between government intervention and environmental regulation intensity (0.27) was the least impactful interaction. In the twelfth five-year plan period, the level of education–energy structure (0.86), education level–technological innovation (0.78), and level of government intervention–education level (0.78) interactions were strong drivers of spatial GTFP heterogeneity.
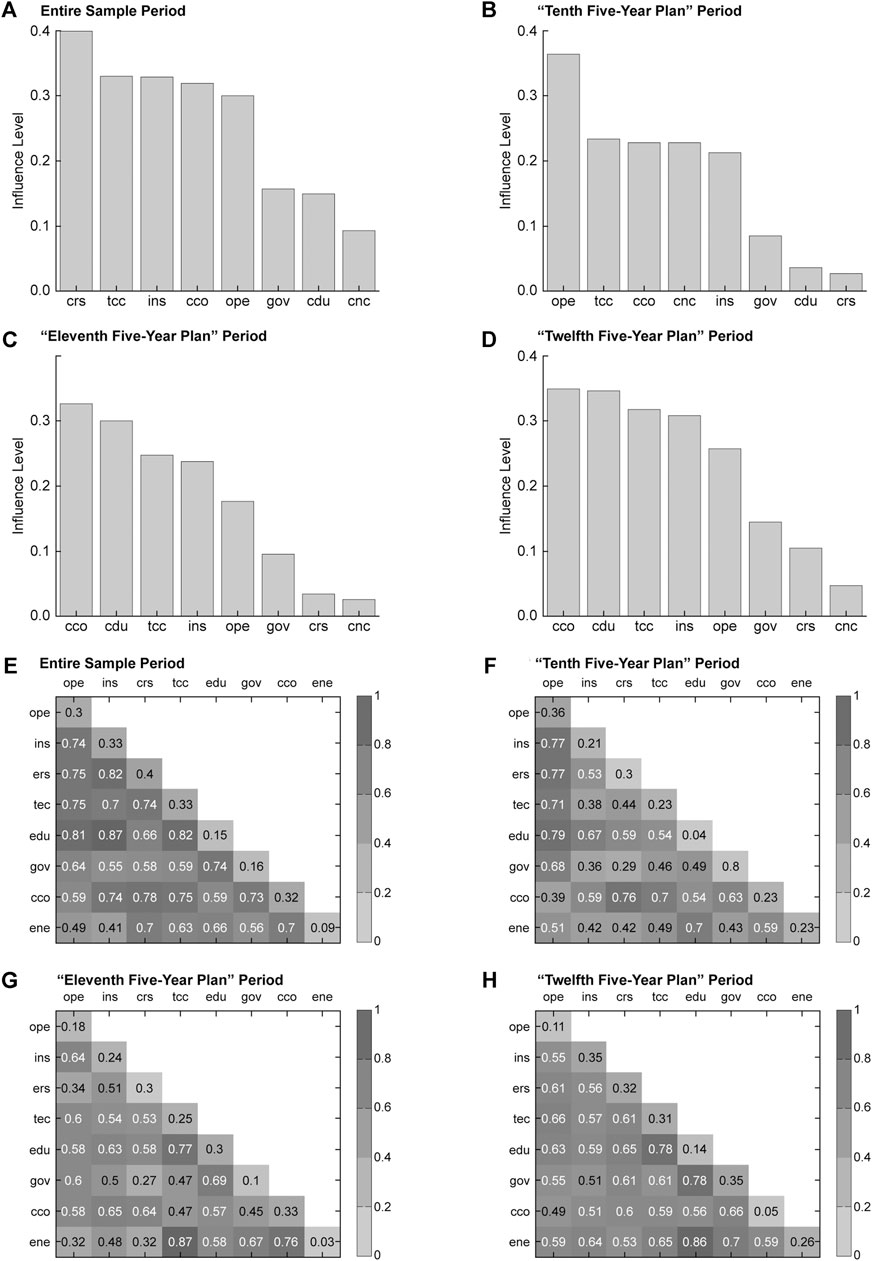
FIGURE 3. Drivers of spatial GTFP heterogeneity in China. Notes: (A) Results of the detection of factors influencing GTFP in China for the entire sample period; (B) Results of the detection of factors influencing GTFP in China during the “Tenth Five-Year Plan” period; (C) Results of the detection of factors influencing GTFP in China during the “Eleventh Five-Year Plan” period; (D) Results of the detection of factors influencing GTFP in China during the “Twelfth Five-Year Plan” period; (E) Interaction detection results of factors influencing GTFP in China for the entire sample period; (F) Interaction detection results of factors influencing GTFP in China during the “Tenth Five-Year Plan” period; (G) Interaction detection results of factors influencing GTFP in China during the “Eleventh Five-Year Plan” period; (H) Interaction detection results of factors influencing GTFP in China during the “Twelfth Five-Year Plan” period.
The above results, similar to those by Ma et al. (2022), indicate that the drivers of GTFP in China are different in different regions at different periods. Industrial structure, technological innovation, energy structure, and openness level contribute to green total factor energy efficiency. This finding is consistent with that by Chen et al. (2018), who argued that environmental regulation can promote GTFP. However, the finding is inconsistent with that of Feng et al. (2021), who concluded that market-based environmental regulations have no significant effect on GTFP. In addition to the extent of effect of individual factors, it is possible to determine the effect of the interaction of two factors on GTFP, which is a remarkable contribution of this study and fills a research gap in this field.
Based on provincial panel data of 30 Chinese provinces from 2000 to 2019, this paper first measures the GTFP in each region of China, then analyzes the spatial differences of GTFP in each region, and finally analyzes the driving factors of GTFP in each region. The following main conclusions are drawn: 1) The GTFP of China had an overall upward trend, and technical progress changes were the primary drivers of this upward trend. 2) Considerable disparities exist in GTFP of one region or province and another. The eastern region had the highest GTFP. 3) Overall, the relative and absolute differences between the national, eastern, central, and western regions of China are narrowing, and the intensity of transvariation is the main source of spatial differences in GTFP in China. 4) Among the individual factors, the intensity of environmental regulations was the strongest individual driver of spatial GTFP heterogeneity in China. The interactions that contributed most strongly to spatial heterogeneities in the GTFP were the levels of industrial structure and education, levels of educational and technological innovation, and energy structure–technological innovation. Based on the conclusions of this study, we propose the following recommendations.
(1) Accelerate the establishment of a new coordinated mode of regional development: Although China is shifting towards high-quality economic development, most Chinese provinces have low GTFPs, and there are substantial GTFP differences from one province or region to another. Between-region GTFP differences also strongly contributed to China’s national GTFP differences. To solve these issues, China’s regions and provinces should first collaborate to improve the GTFP. Efforts should be made to accelerate the modernization of eastern China, facilitate the ascent of central China, and accelerate development in western China. It is also crucial to examine the implementation of major and coordinated regional development strategies. Second, differentiated development strategies should be formulated to address the requirements of each region and province. The eastern region and high-GTFP provinces should make full use of their comparative advantage to develop core cities, metropolitan areas, and urban clusters, thus driving the development of neighboring cities and regions, which will narrow intra-and inter-regional disparities in the GTFP, improve the coordination of regional development, increase economic integration, and accelerate the establishment of a new coordinated mode of regional development.
(2) Enhance China’s capacity for green technology innovation: It must remain steady in its commitment to innovation-driven development. First, investments in green technology should be increased alongside the promotion of academia–industry collaboration to drive the transformation of scientific research findings into technical standards and to comprehensively enhance China’s capacity for innovation in carbon reduction technologies. Second, the green technological efficiency index must be increased considerably. Currently, technical efficiency change has a negative effect, which is a major obstacle in efforts to improve China’s capacity for green technology innovations. Therefore, businesses creating high pollution and low technological efficiency should be eliminated, and concerted efforts should be made to create green and technologically advanced businesses.
(3) Promote the transformation and upgradation of industrial structures: As China is currently transforming its economy from a manufacturing-dominated economy to a services-driven economy, all provincial governments should formulate locally adapted policies to promote the upgradation of their industrial structures. First, the development of strategic emerging industries (e.g., new energy vehicles, next-generation information technology, and green aviation) must be prioritized, and the integration of modern service industries and advanced manufacturing should be promoted. Second, efforts should be made to optimize and upgrade the industrial supply chain. As the traditional supply chain still plays an important role in socioeconomic development, the transformation of old industrial bases should be supported to help traditional industries reinvent themselves as green, high-end, and intelligent industries, thus improving China’s industrial structure. Finally, investment in human capital should increase. There is a mismatch between the current industrial and labor structures of China. Therefore, investment in the schooling system and higher education for workers should be increased.
(4) Increase the level of openness of China: First, to increase trade and thus achieve a high level of openness, China should seek to introduce high-tech products, improve management of the foreign investment negative list, and encourage the import of high-tech green technologies and devices to maximize technology spillovers to domestic enterprises and industries, enhance China’s capacity for independent innovation, and avoid becoming a “pollution haven” for advanced nations. Second, china should also implement incentives such as export tax rebates for green high-tech products. The stringent product quality requirements of host states for imported products, when combined with domestic incentives, will serve to encourage independent innovation from domestic enterprises and lead to the export of green high-tech products from China.
(5) Promoting the establishment of a new mode of green development: First, China must develop a low-carbon economy by improving laws and regulations on green development, fully implementing the pollutant discharge permit system and market-based carbon trading, and transforming traditional industrial structures into green industrial structures, thus reducing the carbon intensity of the economy. Second, increases in the area of afforestation should be prioritized, as the size of forest carbon sinks is strongly affected by afforested areas, and the effects of inputs and outputs in afforested areas have immediate effects on the net CO2 emissions of China. Third, the energy structure should be optimized to increase energy use efficiency. To this end, investment in pollution control should be increased, using of clean energy, reduce the use of carbon-intense and inefficient fuels such as coal, and push for a green model of development to improve China’s GTFP.
Although this study fills some of the research gaps related to GTFP in China, there are still some limitations that need to be discussed for future research. First, this study is not updated to the latest data for 2021 owing to data unavailability. Second, compared with provincial macro data, prefecture-level city data can improve the precision of the study. Third, owing to mobility of resource factors between regions, the introduction of spatial effects can be considered in the future research on
The original contributions presented in the study are included in the article/Supplementary Material, further inquiries can be directed to the corresponding author.
PZ: Conceptualization, methodology, writing—review and editing, visualization, and funding acquisition. HW: Supervision. ZL: Resources, supervision. JK: Data curation, methodology, and writing—review and editing. JD: Supervision. All authors have read and agreed to the published version of the manuscript.
This research was supported by the Major Project of the Key Research Base of Humanities and Social Sciences of the Ministry of Education (grant number 13JJD79044) and The Postgraduate Innovation Development Fund Project of Shenzhen University (grant number 315–0000470715).
We would like to thank Editage (www.editage.cn) for English language editing.
The authors declare that the research was conducted in the absence of any commercial or financial relationships that could be construed as a potential conflict of interest.
All claims expressed in this article are solely those of the authors and do not necessarily represent those of their affiliated organizations, or those of the publisher, the editors and the reviewers. Any product that may be evaluated in this article, or claim that may be made by its manufacturer, is not guaranteed or endorsed by the publisher.
1Note: Tibet, Hong Kong, Macau, and Taiwan were excluded from the study.
2Note: The eastern region includes Beijing, Tianjin, Hebei, Liaoning, Shanghai, Jiangsu, Zhejiang, Fujian, Shandong, Guangdong, and Hainan; the central region includes Shanxi, Jilin, Heilongjiang, Anhui, Jiangxi, Henan, Hubei, and Hainan. The western region includes Inner Mongolia, Guangxi, Chongqing, Sichuan, Guizhou, Yunnan, Shaanxi, Gansu, Qinghai, Ningxia, and Xinjiang.
Bao, B., Jin, S., Li, L., Duan, K., and Gong, X. (2022). Analysis of green total factor productivity of grain and its dynamic distribution: Evidence from Poyang lake basin, China. Agriculture 12, 8. doi:10.3390/agriculture12010008
Chen, C., Lan, Q., Gao, M., and Sun, Y. (2018). Green total factor productivity growth and its determinants in China’s industrial economy. Sustainability 10, 1052. doi:10.3390/su10041052
Chen, S., and Golley, J. (2014). ‘Green’ productivity growth in China's industrial economy. Energy Econ. 44, 89–98. doi:10.1016/j.eneco.2014.04.002
Chen, Y., Fu, W., and Wang, J. (2022). Evaluation and influencing factors of China’s agricultural productivity from the perspective of environmental constraints. Sustainability 14, 2807. doi:10.3390/su14052807
Cheng, Y., Shao, T., Lai, H., Shen, M., and Li, Y. (2019). Total-factor eco-efficiency and its influencing factors in the Yangtze River delta urban agglomeration, China. Int. J. Environ. Res. Public Health 16, 3814. doi:10.3390/ijerph16203814
Cheng, Z., Li, L., and Liu, J. (2020). Natural resource abundance, resource industry dependence and economic green growth in China. Resour. Policy 68, 101734. doi:10.1016/j.resourpol.2020.101734
Chung, Y. H., Färe, R., and Grosskopf, S. (1997). Productivity and undesirable outputs: A directional distance function approach. J. Environ. Manag. 51, 229–240. doi:10.1006/jema.1997.0146
Costantini, V., Crespi, F., and Palma, A. (2017). Characterizing the policy mix and its impact on eco-innovation: A patent analysis of energy-efficient technologies. Res. Policy 46, 799–819. doi:10.1016/j.respol.2017.02.004
Cui, H., Wang, H., and Zhao, Q. (2019). Which factors stimulate industrial green total factor productivity growth rate in China? An industrial aspect. Greenh. Gas. Sci. Technol. 9, 505–518. doi:10.1002/ghg.1874
Dagum, C. (1997). A new approach to the decomposition of the Gini income inequality ratio. Empir. Econ. 22, 515–531. doi:10.1007/BF01205777
Dai, J., Liu, Y., Chen, J., and Liu, X. (2020). Fast feature selection for interval-valued data through kernel density estimation entropy. Int. J. Mach. Learn. Cybern. 11, 2607–2624. doi:10.1007/s13042-020-01131-5
Fang, C, C., Cheng, J., Zhu, Y., Chen, J., and Peng, X. (2021). Green total factor productivity of extractive industries in China: An explanation from technology heterogeneity. Resour. Policy 70, 101933. doi:10.1016/j.resourpol.2020.101933
Fang, L, L., Hu, R., Mao, H., and Chen, S. (2021). How crop insurance influences agricultural green total factor productivity: Evidence from Chinese farmers. J. Clean. Prod. 321, 128977. doi:10.1016/j.jclepro.2021.128977
Färe, R., and Grosskopf, S. (2010). Directional distance functions and slacks-based measures of efficiency. Eur. J. Oper. Res. 200, 320–322. doi:10.1016/j.ejor.2009.01.031
Färe, R., Grosskopf, S., and Pasurkajr, C. A. (2007). Environmental production functions and environmental directional distance functions. Energy 32, 1055–1066. doi:10.1016/j.energy.2006.09.005
Feng, C., Huang, J., and Wang, M. (2018). Analysis of green total-factor productivity in China’s regional metal industry: A meta-frontier approach. Resour. Policy 58, 219–229. doi:10.1016/j.resourpol.2018.05.008
Feng, C., and Wang, M. (2019). Journey for green development transformation of China’s metal industry: A spatial econometric analysis. J. Clean. Prod. 225, 1105–1117. doi:10.1016/j.jclepro.2019.04.025
Feng, J., Yan, J., and Tao, X. (2021). Exposing the effects of environmental regulations on China’s green total factor productivity: Results from econometrics analysis and machine learning methods. Front. Environ. Sci. 9, 9358. doi:10.3389/fenvs.2021.779358
Földvári, P., and van Leeuwen, B. (2009). An alternative interpretation of “average years of education” in growth regressions. Appl. Econ. Lett. 16, 945–949. doi:10.1080/13504850701222178
Fukuyama, H., and Weber, W. L. (2009). A directional slacks-based measure of technical inefficiency. Socioecon. Plann. Sci. 43, 274–287. doi:10.1016/j.seps.2008.12.001
Fussier, C. (1996). Driving eco-innovation: A breakthrough discipline for innovation and sustainability. London: Pitman.
Geng, S., Shi, P., Zong, N., and Zhu, W. (2018). Using soil survey database to assess soil quality in the heterogeneous Taihang Mountains, North China. Sustainability 10, 3443. doi:10.3390/su10103443
Gong, B., and Sickles, R. C. (1992). Finite sample evidence on the performance of stochastic frontiers and data envelopment analysis using panel data. J. Econ. 51, 259–284. doi:10.1016/0304-4076(92)90038-S
Guo, K., Li, S., Wang, Z., Shi, J., Bai, J., and Cheng, J. (2021). Impact of regional green development strategy on environmental total factor productivity: Evidence from the Yangtze River economic Belt, China. Int. J. Environ. Res. Public Health 18, 2496. doi:10.3390/ijerph18052496
Han, Y., Qi, X., and Yang, Y. (2020). Analysis of the spillover effect of energy intensity among provinces in China based on space-time lag model. Environ. Sci. Pollut. Res. 27, 16950–16962. doi:10.1007/s11356-020-08169-6
Holden, E., Linnerud, K., and Banister, D. (2014). Sustainable development: Our common future revisited. Glob. Environ. Change 26, 130–139. doi:10.1016/j.gloenvcha.2014.04.006
Huang, H., Mo, R., and Chen, X. (2021). New patterns in China’s regional green development: An interval Malmquist–Luenberger productivity analysis. Struct. Chang. Econ. Dyn. 58, 161–173. doi:10.1016/j.strueco.2021.05.011
Huang, H. Z., and Xie, D. Y. (2008). Fiscal sustainability and fiscal soundness. Ann. Econ. Fin. 9, 239–251.
Huang, C, C., Yin, K., Guo, H., and Yang, B. (2022). Regional differences and convergence of inter-provincial green total factor productivity in China under technological heterogeneity. Int. J. Environ. Res. Public Health 19, 5688. doi:10.3390/ijerph19095688
Huang, X, X., Wang, X., Chen, B., Li, F., Su, S., and Zhang, T. (2022). Temporal trend and regional disparity of agricultural green total factor productivity in China: Data envelopment analysis with biennial environmental technology. Discrete Dyn. Nat. Soc. 2022, 1–17. doi:10.1155/2022/2219779
Jacobs, M. (2022). Reflections onCOP26 : International diplomacy, global justice and the greening of capitalism. Polit. Q. 93, 270–277. doi:10.1111/1467-923x.13083
Kaya, Y., and Yokobori, K. (1993). Environment, energy and economy: Strategies for sustainability. Delhi: Bookwell Publication.
Lee, C., and Lee, C. (2022). How does green finance affect green total factor productivity? Evidence from China. Energy Econ. 107, 105863. doi:10.1016/j.eneco.2022.105863
Li, T., and Liao, G. (2020). The heterogeneous impact of financial development on green total factor productivity. Front. Energy Res. 8, 29. doi:10.3389/fenrg.2020.00029
Li, W., Wang, W., Wang, Y., and Ali, M. (2018). Historical growth in total factor carbon productivity of the Chinese industry – a comprehensive analysis. J. Clean. Prod. 170, 471–485. doi:10.1016/j.jclepro.2017.09.145
Li, Y., and Chen, Y. (2021). Development of an SBM-ML model for the measurement of green total factor productivity: The case of pearl river delta urban agglomeration. Renew. Sustain. Energy Rev. 145, 111131. doi:10.1016/j.rser.2021.111131
Li, G, G., Gao, D., and Li, Y. (2022). Dynamic environmental regulation threshold effect of technical progress on green total factor energy efficiency: Evidence from China. Environ. Sci. Pollut. Res. 29, 8804–8815. doi:10.1007/s11356-021-16292-1
Li, J, J., Tang, D., Tenkorang, A. P., and Shi, Z. (2021). Research on environmental regulation and green total factor productivity in Yangtze River Delta: From the perspective of financial development. Int. J. Environ. Res. Public Health 18, 12453. doi:10.3390/ijerph182312453
Li, L, L., Li, M., Ma, S., Zheng, Y., and Pan, C. (2022). Does the construction of innovative cities promote urban green innovation? J. Environ. Manag. Energy Res. 3182020, 1156058. doi:10.1016/j.jenvman.2022.115605
Li, Y, Y., Wu, Y., Chen, Y., and Huang, Q. (2021). The influence of foreign direct investment and trade opening on green total factor productivity in the equipment manufacturing industry. Appl. Econ. 53, 6641–6654. doi:10.1080/00036846.2021.1947961
Li, Z, Z., Lin, B., and Luan, R. (2022). Impact assessment of clean air action on total factor energy productivity: A three-dimensional analysis. Environ. Impact Assess. Rev. 93, 106745. doi:10.1016/j.eiar.2022.106745
Liao, B., and Li, L. (2022). Spatial division of labor, specialization of green technology innovation process and urban coordinated green development: Evidence from China. Sustain. Cities Soc. 80, 103778. doi:10.1016/j.scs.2022.103778
Lin, B., and Wang, X. (2014). Exploring energy efficiency in China׳s iron and steel industry: A stochastic frontier approach. Energy Policy 72, 87–96. doi:10.1016/j.enpol.2014.04.043
Liu, C., Zhou, Z., Liu, Q., Xie, R., and Zeng, X. (2020). Can a low-carbon development path achieve win-win development: Evidence from China’s low-carbon pilot policy. Mitig. Adapt. Strateg. Glob. Chang. 25, 1199–1219. doi:10.1007/s11027-019-09897-y
Liu, D., Zhu, X., and Wang, Y. (2021). China’s agricultural green total factor productivity based on carbon emission: An analysis of evolution trend and influencing factors. J. Clean. Prod. 278, 123692. doi:10.1016/j.jclepro.2020.123692
Liu, F., and Xu, H. (2020). Heterogeneity of green TFP in China’s logistics industry under environmental constraints. Complexity 2020, 1–12. doi:10.1155/2020/8842560
Liu, K., Wang, X., and Zhang, Z. (2022). Assessing urban atmospheric environmental efficiency and factors influencing it in China. Environ. Sci. Pollut. Res. 29, 594–608. doi:10.1007/s11356-021-15692-7
Liu, S., Hou, P., Gao, Y., and Tan, Y. (2022a). Innovation and green total factor productivity in China: A linear and nonlinear investigation. Environ. Sci. Pollut. Res. 29, 12810–12831. doi:10.1007/s11356-020-11436-1
Liu, S., Lei, P., Li, X., and Li, Y. (2022b). A nonseparable undesirable output modified three-stage data envelopment analysis application for evaluation of agricultural green total factor productivity in China. Sci. Total Environ. 838, 155947. doi:10.1016/j.scitotenv.2022.155947
Lu, F., Wang, W., Liu, M., Liu, M., and Qi, D. (2022). The non-linear effect of agricultural insurance on agricultural green competitiveness. Technol. Anal. Strateg. Manag. 102, 1. doi:10.1080/09537325.2022.2098102
Ma, D., Xiong, H., Zhang, F., Gao, L., Zhao, N., Yang, G., et al. (2022). China’s industrial green total-factor energy efficiency and its influencing factors: A spatial econometric analysis. Environ. Sci. Pollut. Res. 29, 18559–18577. doi:10.1007/s11356-021-17040-1
Mckinsey, G. I. (2008). The carbon productivity challenge: Curbing climate change and sustaining economic growth[M]. Chicago: McKinsey & Company, McKinsey Global Institute.
Obobisa, E. S., Chen, H., and Mensah, I. (2022). Transitions to sustainable development: The role of green innovation and institutional quality. Environ. Dev. Sustain. 24, 1–30. doi:10.1007/s10668-022-02328-0
Oh, D. (2010). A global Malmquist-Luenberger productivity index. J. Product. Anal. 34, 183–197. doi:10.1007/s11123-010-0178-y
Peng, H., Qi, S., and Zhang, Y. (2021). Does trade promote energy efficiency convergence in the Belt and Road Initiative countries? J. Clean. Prod. 322, 129063. doi:10.1016/j.jclepro.2021.129063
Peng, Y., Lin, H., and Lee, J. (2022). Analyzing the mechanism of spatial–temporal change of green total factor productivity in Yangtze Delta Region of China. Environ. Dev. Sustain. 24, 1–22. doi:10.1007/s10668-022-02662-3
Porter, M. E., and Linde, C. van der (1995). Toward a new conception of the environment-competitiveness relationship. J. Econ. Perspect. 9, 97–118. doi:10.1257/jep.9.4.97
Rubashkina, Y., Galeotti, M., and Verdolini, E. (2015). Environmental regulation and competitiveness: Empirical evidence on the Porter Hypothesis from European manufacturing sectors. Energy Policy 83, 288–300. doi:10.1016/j.enpol.2015.02.014
Schumpeter, J., and Backhaus, U. (2006). “The theory of economic development,” in Joseph alois schumpeter (Boston: Kluwer Academic Publishers), 61–116.
Shi, X., and Li, L. (2019). Green total factor productivity and its decomposition of Chinese manufacturing based on the MML index: 2003–2015. J. Clean. Prod. 222, 998–1008. doi:10.1016/j.jclepro.2019.03.080
Shu, Y., and Qi, Z. (2020). The effect of market-oriented government fiscal expenditure on the evolution of industrial structure: Evidence from Shenzhen, China. Sustainability 12, 3703. doi:10.3390/su12093703
Song, Y., Sun, X., Xia, P., Cui, Z., and Zhao, X. (2022). Research on the spatiotemporal evolution and influencing factors of green economic efficiency in the Yangtze River Economic Belt. Environ. Sci. Pollut. Res. 29, 68257–68268. doi:10.1007/s11356-022-20542-1
Sun, H, H., Zhang, Z., and Liu, Z. (2022). Regional differences and threshold effect of clean technology innovation on industrial green total factor productivity. Front. Environ. Sci. 10, 985591. doi:10.3389/fenvs.2022.985591
Sun, J, J., Tang, D., Kong, H., and Boamah, V. (2022). Impact of industrial structure upgrading on green total factor productivity in the Yangtze River economic Belt. Int. J. Environ. Res. Public Health 19, 3718. doi:10.3390/ijerph19063718
Tang, J., and Qin, F. (2021). Analyzing the effect of local government competition on green total factor productivity from the market segmentation perspective in China—Evidence from a three-stage DEA model. Front. Environ. Sci. 9, 763945. doi:10.3389/fenvs.2021.763945
Tone, K. (2001). A slacks-based measure of efficiency in data envelopment analysis. Eur. J. Oper. Res. 130, 498–509. doi:10.1016/S0377-2217(99)00407-5
Umetsu, C., Lekprichakul, T., and Chakravorty, U. (2003). Efficiency and technical change in the philippine rice sector: A malmquist total factor productivity analysis. Am. J. Agric. Econ. 85, 943–963. doi:10.1111/1467-8276.00499
Wang, J. F., Li, X. H., Christakos, G., Liao, Y., Zhang, T., Gu, X., et al. (2010). Geographical detectors-based health risk assessment and its application in the neural tube defects study of the Heshun Region, China. Int. J. Geogr. Inf. Sci. 24, 107–127. doi:10.1080/13658810802443457
Wang, J., and Hu, Y. (2012). Environmental health risk detection with GeogDetector. Environ. Model. Softw. 33, 114–115. doi:10.1016/j.envsoft.2012.01.015
Wang, K.-L., Pang, S.-Q., Ding, L.-L., and Miao, Z. (2020). Combining the biennial Malmquist–Luenberger index and panel quantile regression to analyze the green total factor productivity of the industrial sector in China. Sci. Total Environ. 739, 140280. doi:10.1016/j.scitotenv.2020.140280
Wang, X., Wang, S., and Xia, Y. (2022). Evaluation and dynamic evolution of the total factor environmental efficiency in China’s mining industry. Energies 15, 1232. doi:10.3390/en15031232
Wang, Z., and Jia, X. (2022). Analysis of energy consumption structure on CO2 emission and economic sustainable growth. Energy Rep. 8, 1667–1679. doi:10.1016/j.egyr.2022.02.296
Wang, C, C., Miao, Z., Chen, X., and Cheng, Y. (2021). Factors affecting changes of greenhouse gas emissions in Belt and Road countries. Renew. Sustain. Energy Rev. 147, 111220. doi:10.1016/j.rser.2021.111220
Wang, M, M., Pang, S., Hmani, I., Hmani, I., Li, C., and He, Z. (2021). Towards sustainable development: How does technological innovation drive the increase in green total factor productivity? Sustain. Dev. 29, 217–227. doi:10.1002/sd.2142
Wei, J., Jia, R., Marinova, D., and Zhao, D. (2012). Modeling pollution control and performance in China’s provinces. J. Environ. Manage. 113, 263–270. doi:10.1016/j.jenvman.2012.08.040
Wu, D. (2018). Impact of green total factor productivity in marine economy based on entropy method. Pol. Marit. Res. 25, 141–146. doi:10.2478/pomr-2018-0123
Xi, J. (2020). Full text of xi’s statement at the general debate of the 75th session of the united nations general assembly. Available at: http://www.xinhuanet.com/english/2020-09/23/c_139388686.htm (accessed on Sep 16, 2020).
Xie, H., Zhang, Y., and Choi, Y. (2018). Measuring the cultivated land use efficiency of the main grain-producing areas in China under the constraints of carbon emissions and agricultural nonpoint source pollution. Sustainability 10, 1932. doi:10.3390/su10061932
Xu, L., Wang, D., and Du, J. (2022). Spatial-temporal evolution and influencing factors of urban green and smart development level in China: Evidence from 232 prefecture-level cities. Int. J. Environ. Res. Public Health 19, 3939. doi:10.3390/ijerph19073939
Xu, X. F., Cui, Y. J., and Zhong, Y. D. (2021). Impact of environmental regulation and FDI on green total factor productivity: Evidence from China. Environ. Eng. Manag. J. 20, 177–184. doi:10.30638/eemj.2021.018
Xu, X., Huang, X., Huang, J., Gao, X., and Chen, L. (2019). Spatial-temporal characteristics of agriculture green total factor productivity in China, 1998–2016: Based on more sophisticated calculations of carbon emissions. Int. J. Environ. Res. Public Health 16, 3932. doi:10.3390/ijerph16203932
Yang, F., Shi, B., Xu, M., and Feng, C. (2019). Can reducing carbon emissions improve economic performance – evidence from China. Economics 13, 20190047. doi:10.5018/economics-ejournal.ja.2019-47
You, J., and Xiao, H. (2022). Can FDI facilitate green total factor productivity in China? Evidence from regional diversity. Environ. Sci. Pollut. Res. 29, 49309–49321. doi:10.1007/s11356-021-18059-0
Yuan, B., and Zhang, Y. (2020). Flexible environmental policy, technological innovation and sustainable development of China’s industry: The moderating effect of environment regulatory enforcement. J. Clean. Prod. 243, 118543. doi:10.1016/j.jclepro.2019.118543
Yuan, W., Li, J., Meng, L., Qin, X., and Qi, X. (2019). Measuring the area green efficiency and the influencing factors in urban agglomeration. J. Clean. Prod. 241, 118092. doi:10.1016/j.jclepro.2019.118092
Zhang, J., Wang, Y., Feng, L., Hou, C., and Gu, Q. (2022). Effects of air pollution and green spaces on impaired lung function in children: A case-control study. Environ. Sci. Pollut. Res. 29, 11907–11919. doi:10.1007/s11356-021-16554-y
Zhang, Y., and Wu, Z. (2021). Intelligence and green total factor productivity based on China’s province-level manufacturing data. Sustainability 13, 4989. doi:10.3390/su13094989
Zhao, R., Zhan, L., Yao, M., and Yang, L. (2020). A geographically weighted regression model augmented by Geodetector analysis and principal component analysis for the spatial distribution of PM2.5. Sustain. Cities Soc. 56, 102106. doi:10.1016/j.scs.2020.102106
Zhong, S., Wang, L., and Yao, F. (2022). Industrial green total factor productivity based on an MML index in the Yangtze River Economic Belt. Environ. Sci. Pollut. Res. 29, 30673–30696. doi:10.1007/s11356-021-17625-w
Zhou, Y., Xu, Y., Liu, C., Fang, Z., Fu, X., and He, M. (2019). The threshold effect of China’s financial development on green total factor productivity. Sustainability 11, 3776. doi:10.3390/su11143776
Keywords: green total factor productivity, dagum’s gini coefficient, kernel density estimation, geodetector, climate change, slacks-based measure-global malmquist-luenberger index
Citation: Zhao P, Wu H, Lu Z, Kou J and Du J (2022) Spatial differences, distributional dynamics, and driving factors of green total factor productivity in China. Front. Environ. Sci. 10:1058612. doi: 10.3389/fenvs.2022.1058612
Received: 30 September 2022; Accepted: 15 November 2022;
Published: 01 December 2022.
Edited by:
Kazi Sohag, Ural Federal University, RussiaReviewed by:
Md. Monirul Islam, Bangladesh Institute of Governance and Management (BIGM), BangladeshCopyright © 2022 Zhao, Wu, Lu, Kou and Du. This is an open-access article distributed under the terms of the Creative Commons Attribution License (CC BY). The use, distribution or reproduction in other forums is permitted, provided the original author(s) and the copyright owner(s) are credited and that the original publication in this journal is cited, in accordance with accepted academic practice. No use, distribution or reproduction is permitted which does not comply with these terms.
*Correspondence: Jiali Kou, a291amlhbGlpQDE2My5jb20=
Disclaimer: All claims expressed in this article are solely those of the authors and do not necessarily represent those of their affiliated organizations, or those of the publisher, the editors and the reviewers. Any product that may be evaluated in this article or claim that may be made by its manufacturer is not guaranteed or endorsed by the publisher.
Research integrity at Frontiers
Learn more about the work of our research integrity team to safeguard the quality of each article we publish.