 Jie Liu1
 Ziyi Chen
95% of researchers rate our articles as excellent or good
Learn more about the work of our research integrity team to safeguard the quality of each article we publish.
Find out more
BRIEF RESEARCH REPORT article
Front. Environ. Sci. , 17 November 2022
Sec. Environmental Economics and Management
Volume 10 - 2022 | https://doi.org/10.3389/fenvs.2022.1058372
This article is part of the Research Topic Green Energy Technologies for Environmental Sustainability: Drivers, Challenges, and Future Aspects View all 27 articles
The new energy that aims to reduce pollution is the technological trend of energy development in the future. The development of the new energy industry is a complex system. Studying the spatio-temporal revolution of new energy industry helps analyse the development trend, supply, and demand of new energy. Thus, taking Zhejiang Province as an example, the spatial evolution of the new energy industry from 2016 to 2021 is studied. The evolution trend of spatial agglomeration of the new energy industry shows the coexistence of agglomeration and diffusion. No overall agglomeration of the new energy industry in Zhejiang Province is observed. The development performs solid spatial dependence. The results indicate that it is challenging to aggregate resources and achieves economies of scale without a leading enterprise. The diffusion of new energy technologies in the future depends on industrial agglomeration and the cultivation of leading enterprises.
New Energy (NE) is an academic term belonging to energy research and economics. The new energy was officially defined at the United Nations Conference on New and Renewable Sources of Energy in 1981. The conference adopted the Nairobi Programme of Action for the Development and Utilization of New and Renewable Energy Sources of Energy. The definition of new and renewable energy was inexhaustible energy based on material science that can replace traditional fossil energy with limited reserves and environmental pollution. Generally, there are five aspects of new energy development: efficiency of energy utilization, utilization of green resources, renewable energy, substitutability of energy, and conservation degree of energy (Anser et al., 2020). Pan et al. (2020) believes that the concept of new energy should include both understanding and practice. However, he emphasized that understanding new energy should base on practice. Thus, the meaning of new energy is dynamic. At different times and technology levels, new energy refers to different contents (Di Silvestre et al., 2018). However, the diversity of its definition does not affect it as an important component of sustainable development. The characteristics of low consumption and high efficiency of the new energy industry attract the attention of countries worldwide (Lian et al., 2019). Especially, in China, new energy has become a comprehensive industrial concept and has been the focus of policy attention.
China, the world’s largest developing country, contributes more than 30 percent to global economic growth (Lin, 2021). It has become the world’s second-largest economy. With the rapid economic growth, the total energy consumption of China has also risen rapidly. Sufficient energy is the foundation of economic development (Wang and Wang, 2020). The balance between economic growth, environmental protection, and sustainable use of resources is a widely concerning issue. Developing new energy is considered the primary method to solve such dilemma (Xu et al., 2020). The 13th Five-Year Plan of China puts forward that green and low-carbon energy is the strategic orientation of future energy development, green energy development and green production should be focused on, and the proportion of coal in the energy consumption should be reduced, substantially increasing the proportion of new and renewable energy. In 2017, the importance of ecological progress and green development was further emphasized by the Chinese Government. A clean, low-carbon, safe and efficient energy system shall be constructed by building a market-oriented green technology innovation system, developing green finance, strengthening energy conservation and environmental protection, clean production industries, and clean energy industries. Driven by policies, China has rapidly developed its new energy industry in recent years by relying on its resource endowment, especially the electric vehicle, photovoltaic and wind energy industries.
The development of the new energy industry has been widely discussed in existing economic literature (Usman et al., 2021; Usman and Makhdum 2021; Yang et al., 2021; Ahmad et al., 2022). Most past research about new energy development focused on scientific innovation, human capital, and financing. Zhang et al. (2022) made an overview of the development status of the new energy industry, discussed the existing problems in the development of the new energy industry, and put forward a development countermeasure adapting problems the development of the new energy industry is facing. Ferrer et al. (2018) pointed out in “strategic thinking” on the development of new energy industry that the development of new energy industry has become a fundamental tendency in the world. Bersalli et al. (2020) discussed the integration of energy and finance based on the policy of large-scale public financial support for new energy between China and Europe and analyzed the European Union’s clean energy public financial policy. Xu et al. (2019) analyzed the factors affecting the development of the new energy industry according to the development status. Jing et al. (2020) established a model to analyze the export trade fluctuation factors of China’s new energy industry, concluded that the export trade fluctuation and other factors affected its import demand in the international market, and put forward suggestions to promote the development of China’s new energy industry. Zhang et al. (2019) pointed out what restricted China’s new energy industry. It was the rigid grid system, the lack of flexible mechanisms, and unreasonable prices. Whether the national grid between provinces can support each other, achieving the synchronous connection has become the biggest bottleneck of China’s new energy development. Although these studies have well explored the factors affecting the development of the new energy industry from the economic lenses, these studies tend to focus on the macro perspective and are used to using panel data for analysis (Bilal et al., 2021; Usman et al., 2022). This, in part, has led to criticism from some sociologists that economists tend to ignore micro-level dynamics and fail to provide policy support for actual regional developments (Martin, 2021; Zhang et al., 2022; Sun et al., 2022; Zhang and Huang, 2022). Therefore, some scholars, such as Sun et al. (2020), have explored the factors affecting industrial progress and technological innovation from both macro and micro perspectives. By studying the building energy efficiency (BEE) innovations, they found that compared with the macro national results, the influencing factors at the regional level are more complex and the industrial agglomeration has an important impact. And this provides a good insight and leads us to the importance of spatial methods in economic research. As Tisdell (2020) pointed out that any economic activity involves “what, where, why and how.” Economic activity should be explained by a combination of time and space. At present, economic research involving the impact of spatial factors on the development of the new energy industry is insufficient.
Although discussions on the use of microdata are rare, spatial topics are actually widely studied in economics, especially with regard to industrial agglomeration. Industrial agglomeration refers to the phenomenon that economic activities are relatively concentrated in a certain geographical region. The research on the influencing factors of new energy industry agglomeration is popular. For example, Busu (2019) used panel data model to quantitatively evaluate the environmental policies of EU member states and analyze the impact of their environmental policies on new energy industry agglomeration. Dou et al. (2022) constructed the evaluation index system of the competitiveness of new energy industry clusters in Jilin Province and conducted empirical analysis through GEM and AHP models. Research on spatial agglomeration of new energy industry such as Xu et al. (2022) used coupling model to analyze the coupling relationship between new energy industry agglomeration and regional knowledge carrying capacity. Chen et al. (2022) used ESDA and SDM to analyze the spillover effect of industrial agglomeration on economic growth. Wu Z et al. (2021) established an industrial innovation chain and the “supply and demand” policy framework on new energy vehicles, analyzed the characteristics of new energy vehicle industrial policies by comparing the differences between regions, and proposed policy formulation suggestions.
Wang et al. (2020) selected new energy industrial clusters in coastal regions, discussed the development law of China’s new energy industry from the perspective of the growth and evolution of industrial clusters, and put forward relevant countermeasures to promote the development of new energy industrial clusters. Although the previous literature has well considered the factors affecting the development of new energy industries in different regions and proposed corresponding strategies, most studies are limited by the availability of data and often fail to provide timely guidance for policy making. This has been greatly improved in recent years with the proposal of multi-source data acquisition methods in geography, and some geographers have proposed that we can equate the aggregation of industries with the aggregation among enterprises. The distance between enterprises needs to be measured to evaluate industrial agglomeration. Scholars such as Xue et al. (2020) found that we can accurately realize measurement through the spatial point locations provided by multi-source data such as enterprise addresses. And the point data in ArcGIS software can achieve efficient spatial analysis.
At present, such methods have become increasingly popular to explain spatial differences in economic phenomena, especially topics such as technological innovation and industrial agglomeration. For example, Bai et al. (2021) paid attention to spatial effects and introduced spatial methods to study smart grid innovations. Finally, based on the analysis of the spatial information carried in the patents, they found that the innovation of China’s smart grid has nothing to do with regional economic development, but is more related to the level of regional universities and innovation culture. Similarly, the information of the company and annual report published by the enterprise also contains its spatial address, which can be converted into spatial point coordinates to measure industrial agglomeration. For instance, Xue et al. (2020) and Wu W et al. (2021) analyzed the impact of spatial heterogeneity on industrial agglomeration through adjacent geographical units and time dimensions. Such research has been applied to the new energy industry since 2021, among which the most representative ones are Wu et al. (2022) and Lv et al. (2022). They used the Gini coefficient and spatial autocorrelation method to analyze the distribution and spatial agglomeration of the new energy industry in China’s Beijing-Tianjin-Hebei region and Hebei region. Moreover, the spatial evolution characteristics of new energy industry and traditional energy industry are compared. Based on their understanding of evolution, they found that the expansion of the renewable energy industry in the past two decades was orderly and benign, with the characteristics of moving southwest from the capital city of Beijing under the influence of policies. This research has inspired us to investigate other key provinces in China’s new energy development, among which we will focus on Zhejiang Province in our study.
Zhejiang Province is a coastal province of China located on the southern side of the Yangtze River Delta (Sun et al., 2020). Zhejiang Province has excellent natural resources and economic power for developing new energy industries. Since the conduction of 12th Five-Year Plan (2012–2017), Zhejiang Province has developed nuclear power, solar energy, and other new energy sources. Until 2017, Zhejiang has achieved a 6.89 million kW hydropower capacity, 1.283 million kW photovoltaic power, 980,000 kW biomass power, 200 million cubic meters of biogas energy, and 6 million square meters of geothermal energy. As the economy of Zhejiang was mainly based on a small-scale peasant economy and the real economy, the government has issued series of policies on cultivating new energy enterprises in these years with hoping to upgrade its economic structure (Chen and Lin, 2020; Liu and Xiong, 2021).
However, it is unknown whether the current industrial development is in line with the policy expectation, and we can achieve exploratory understanding by referring to the research of Wu et al. (2022) and Lv et al. (2022). Taking Zhejiang as an example, the spatial evolution of the new energy industry is analyzed with the enterprise location data in the present study. By studying new energy industry agglomeration in Zhejiang Province, the evolution stage of the new energy industry can be clarified. It helps the government to formulate related policies and provides a reference for location selection of new energy enterprises. Specifically, the data of the enterprises in our study come from the National Enterprise Credit Information Publicity System (http://bt.gsxt.gov.cn/). This platform is open-access and classifies different enterprise nature, among which new energy enterprise was divided into four segments: 1) science and technology promotion, 2) scientific research, 3) experimental development, and 4) specialist technical services. Therefore, each segment was analysed separately in the present study. Referring to Wu et al. (2022) and Lv et al. (2022) and considering the number of enterprises in Zhejiang Province, the spatial techniques adopted in this paper includes Spatial Gini Coefficient, Standard Deviation Ellipse and Spatial Autocorrelation. These spatial models are explained in detail in the next section Methods. In the Results section, technical analysis of the findings is made. In the final section of Discussion and Conclusion, the policy implications of the findings and the limitations are discussed.
In economics, the Gini coefficient is defined as a coefficient to indicate the equity of social wealth distribution (Castro, 2022). However, the Gini coefficient has an entirely different meaning in geography. Kurgman (1991) proposed the spatial Gini coefficient by combining the Lorentz curve with the traditional Gini coefficient when investigating the agglomeration degree of the American manufacturing industry. As Wu et al. (2022) pointed, the spatial Gini coefficient can be used to measure the spatial agglomeration degree of the new energy industry. The reason is that Gini coefficient can detect the distribution difference of geographical factors in different regions (cities), which can provide help for understanding spatial evolution. The formula for spatial Gini coefficient is as follows:
Where:
Standard deviation Ellipse (SDE) is a spatial statistical method that visualizes the distribution characteristics of a geographical element (Abd Majid et al., 2019). Each parameter of SDE contains different information about the studied distribution. The direction and density of the studied distribution can be obtained by observing the major and minor axes of the SDE (Sanaei et al., 2019). SDE has been widely applied in economics, geography, and environmental science. As emphasized by Lv et al. (2022), if SDE has strong directivity in space, it can show the intensity of the impact of policies on industries. The formula for SDE is as follows:
Where:
Spatial autocorrelation is a calculation to determine whether geographic units are spatially correlated and to what extent (Lo et al., 2022). It is an essential method in spatial analysis. Spatial autocorrelation analysis is mainly divided into global and local spatial autocorrelation. The global autocorrelation describes the overall distribution and judges whether there is aggregation in the space, but it cannot precisely point out where the aggregation is located. Local spatial autocorrelation can help analyze whether the aggregation has hierarchical distribution in the space (Chen et al., 2020).
Global spatial autocorrelation reflects the similarity between attribute values of a unit and its adjacency areas. Global Moran’s I, the most used global spatial autocorrelation measurement, is widely used in exploratory spatial analysis. The formula for global Moran’s I is as follows:
Where:
The local Moran’s I is calculated to test the aggregation degree of a specific unit and its surrounding. The formula for local Moran’s I is as follows:
Where:
The value of the Gini coefficient is in the interval of [0, 1]. If the value of the Gini coefficient is close to 0, the industrial distribution in this region will be more balanced; if the value of G is close to 1, the degree of industrial agglomeration is indicated to be strong. Generally, a Gini coefficient higher than 0.3 is considered the existence of agglomeration. From 2016 to 2021, the segment with the highest average spatial Gini coefficient is specialist technical services, with an average spatial Gini coefficient of 0.413 (See Table 1). A spatial agglomeration of development of specialist technical services segment is indicated. The agglomeration degree of science and technology promotion and application service segment was rising. The spatial agglomeration degree of experimental development and specialist technical services fluctuation decreases, and the spatial agglomeration degree of scientific research has a minor change range during the period. In general, the development of some segmented industries of new energy industries in Zhejiang shows a clear spatial agglomeration, while the development of some segmented industries shows a diffusion trend. The trend of spatial agglomeration of the new energy industry in Zhejiang Province shows the coexistence of agglomeration and diffusion (See Figure 1).
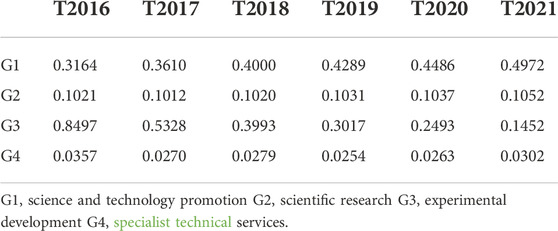
TABLE 1. Spatial Gini coefficient of new energy industry in Zhejiang Province.
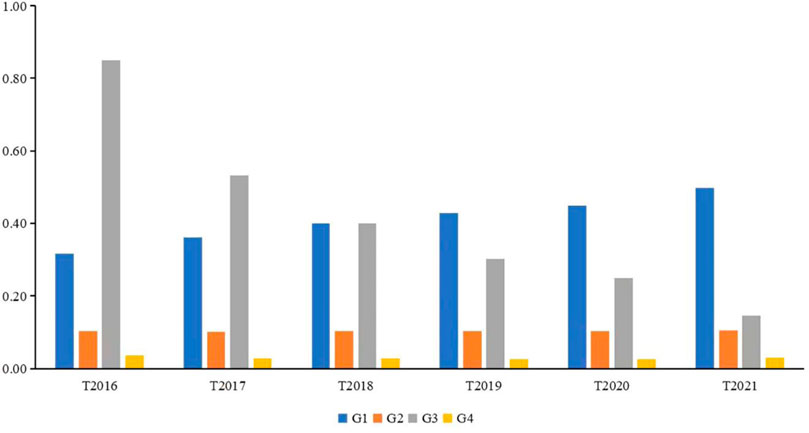
FIGURE 1. Spatial Gini coefficient of new energy industry. G1, science and technology promotion G2, scientific research G3, experimental development G4, specialist technical services.
By observing the azimuth change (See Figure 2), the rotation of the standard deviation ellipse from northeast to west-north can be seen. The amplitude of the rotation Angle is tiny, indicating an insignificant shift trend in new energy industry distribution in Zhejiang Province. The trend of new energy industry distribution has kept the northwest direction. The major axis of the standard deviation ellipse lengthened southward from 2016 to 2021, indicating a downward trend in the spatial agglomeration degree of the new energy industry. The minor axis of the standard deviation ellipse is shortened to the west from 2016 to 2021, indicating that the spatial agglomeration of the new energy industry in Zhejiang Province is enhanced in the northwest. The center of the standard deviation ellipse of the new energy industry is located near the junction of Zhuji and Shengzhou. The center’s trajectory migrated to the southeast from 2016 to 2021. The center of the new energy industry in Zhejiang Province showed a trend of moving to the southeast during the period.
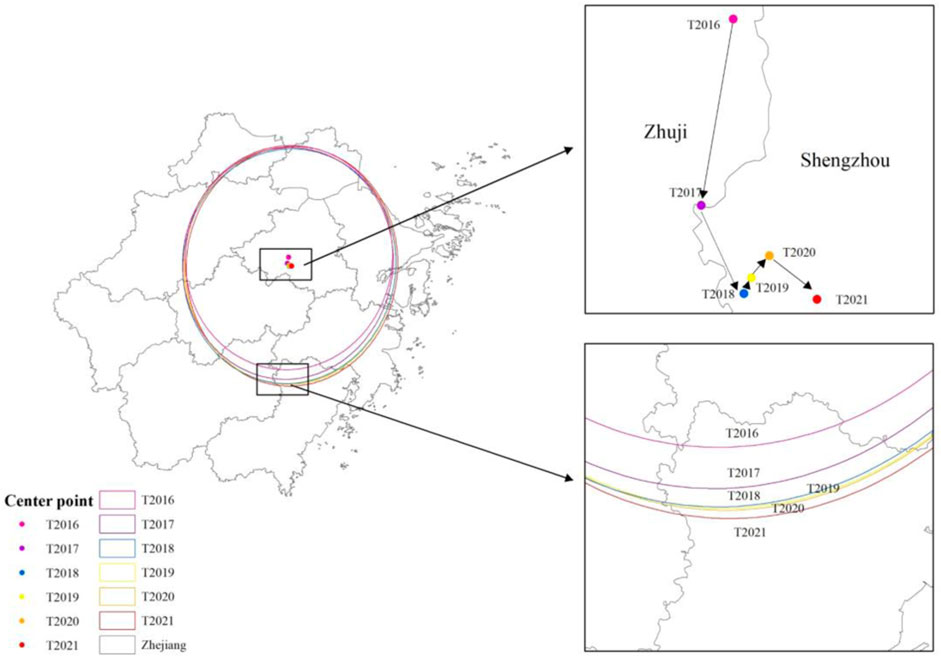
FIGURE 2. Ellipse of standard deviation of Zhejiang new energy industry.
Table 2 shows the global Moran’s I based on the new energy industry in Zhejiang. The results show that the average global Moran’s I of scientific research and specialist technical services segment were positive at a 1% significance level. The distribution of the new energy industry in the scientific research and specialist technical services segment in Zhejiang Province is not random but performs a near centralized distribution.
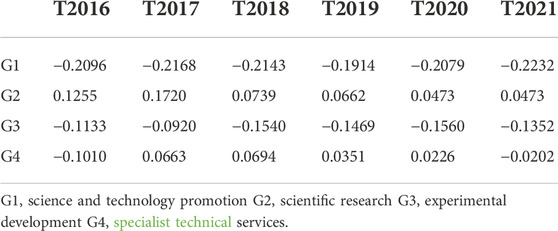
TABLE 2. Global Moran’s I.
The Moran scatter diagram analyses the four types of clusters of the new energy industry in Zhejiang. New energy industrial clusters are divided into four types: 1) H-H cluster, indicating areas with high clustering degrees are adjacent to areas with high clustering degrees. 2) An area surrounds the L-H cluster, indicating an area with a high clustering degree with low degrees. 3) L-L cluster, indicating low-clustering areas are adjacent to other low-clustering areas. 4) An area surrounds the H-L cluster, indicating an area with a low clustering degree with high degrees. H-H and L-L clusters are equivalent to positive spatial autocorrelation, while H-L and L-H refer to negative spatial correlation.
As shown in Figure 3, the new energy industry in Zhejiang mainly presents H-L and L-H clustering. Although fluctuations in different years are observed, the overall clustering remains stable. Anji, Shaoxing, Haining, Jiaxing City, and Changshan County of Quzhou City showed an H-L pattern. Huangyan, Dongyang, Beilun, and Binjiang showed an L-H clustering. Overall, the clusters of new energy industry mainly appear in Huzhou, Shaoxing, Jiaxing, and Quzhou. Apart from the above areas, no evident clustering occurred in the new energy industry in Zhejiang Province.
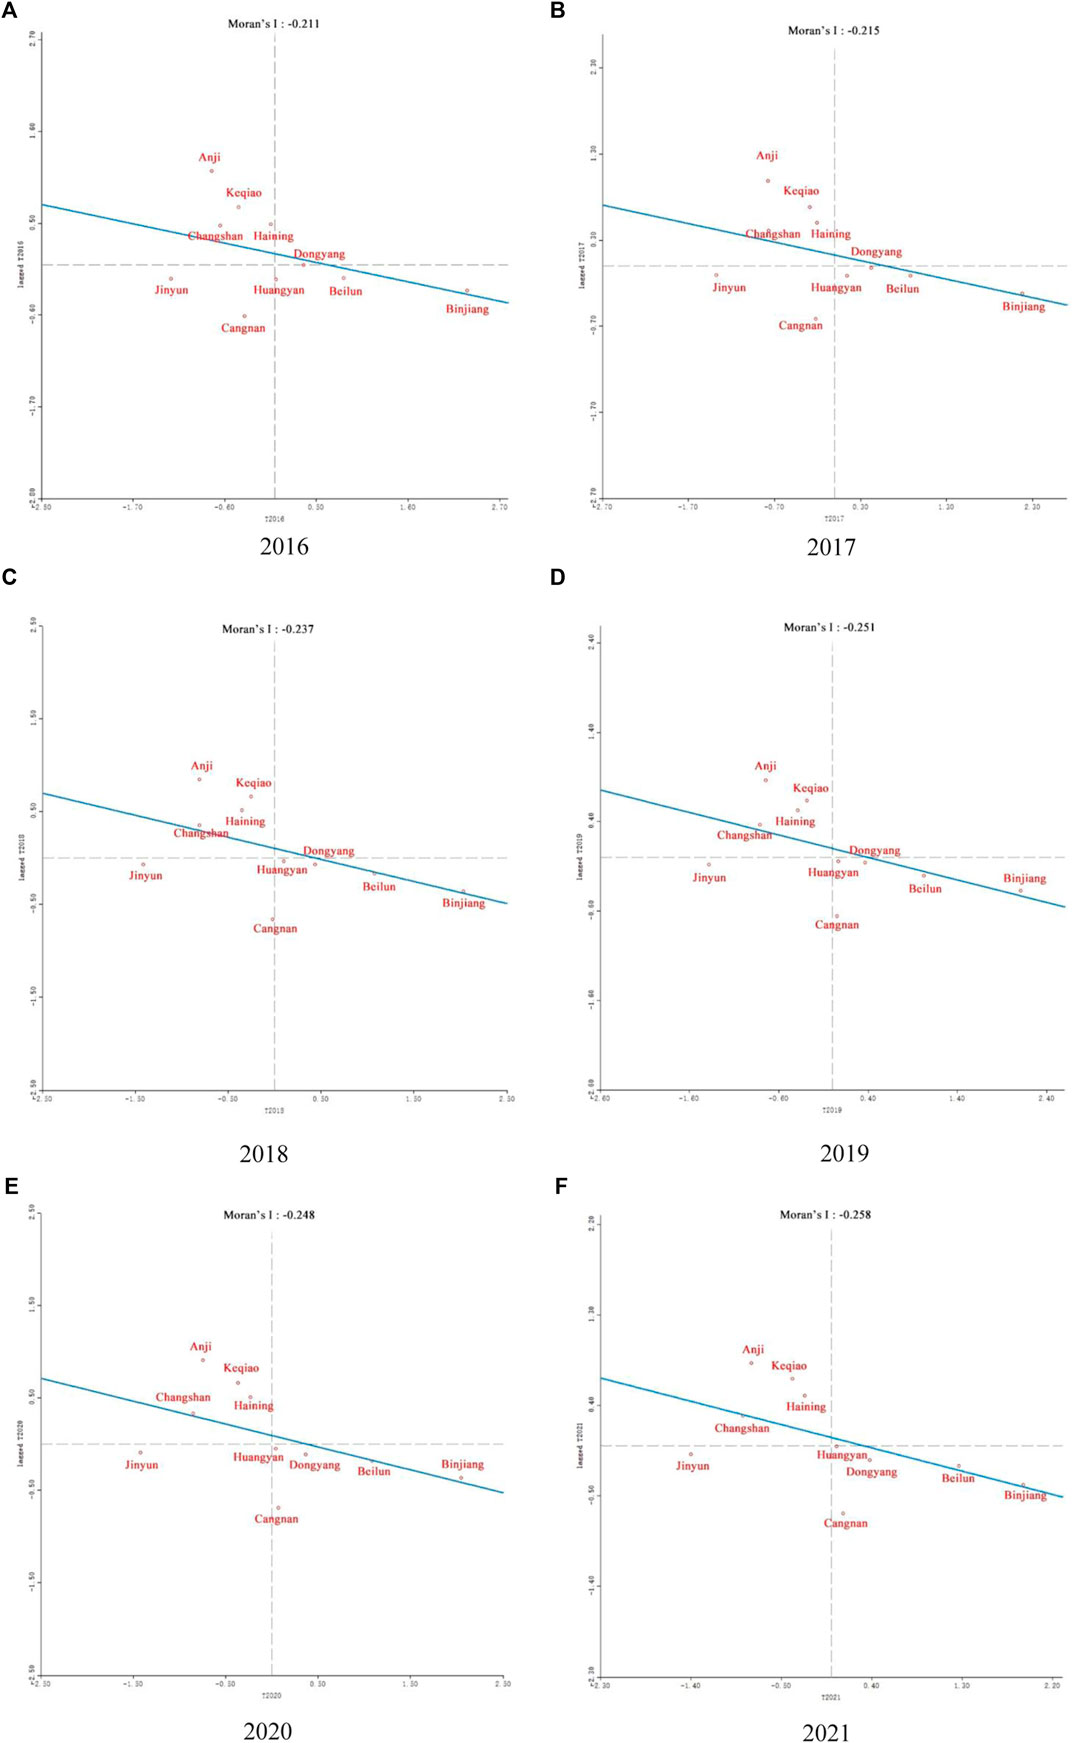
FIGURE 3. (Continued). Moran scatter plot. (A) 2016, (B) 2017, (C) 2018, (D) 2019, (E) 2020, (F) 2021.
The new energy industry is a complex system, the sustainable and stable development of new energy is restricted by many factors. Spatial aggregation is the organizational form of the new energy industry, namely the industrial cluster. Industrial clustering, the spatial aggregation of the new energy industry, is one of the factors affecting the development of new energy. On the one hand, industrial clusters improve the usage of the advantages of local resources. On the other hand, enterprise clusters can be formed and developed in a specific area. It is beneficial to achieve economies of scale and facilitate mutual learning and innovation between enterprises. The formation of new energy industry clusters in specific regions can lead to the influx of talents into the industry, the acceleration of development, and the possibility of breakthrough innovation. To help policymaker understand the new energy industry and its evolutions, this paper collected point data and applied the geo-analysis software ArcGIS to analyse the spatial distribution of the new energy industry in Zhejiang Province. The following findings and implications are drawn:
1. The new energy industry in Zhejiang Province is divided into four segments. It can be observed that the development of application and promotion industries shows a spatial agglomeration trend, while the development of scientific research industries shows a spatial diffusion trend. The evolution trend of spatial agglomeration of the new energy industry in Zhejiang Province shows the coexistence of agglomeration and diffusion. The Zhejiang provincial government needs to pay more attention to the research industry. It is speculated that the application and promotion industry have a natural agglomeration trend due to the supply chain demand. For example, Guo et al. (2020) studied agglomeration effect on green development and concluded that private industry forms industrial aggregation easier. At the same time, the research industry is consists of public enterprises, so the distribution of the scientific research industry is scattered under the premise of ensuring educational fairness. For the research industry, there is no need for large-scale spatial agglomeration to achieve scale effect. However, the quality of cooperation between the scientific research industry and the application and promotion industry can affect scientific research on new energy efficiency and quality. It indicates that the efficiency of cooperation needs to be studied in the future.
2. The overall clustering degree of the new energy industry in Zhejiang Province is low. From 2016 to 2021, the overall cluster degree of the new energy industry in Zhejiang Province decreased. The size of the clustered industry is tiny. A large industrial cluster in Zhejiang has not yet formed. A leader enterprise is required to achieve economies of scale. As an emerging industry, new energy is still in a relatively unstable state. Zhang et al. (2022) concluded that external economies of scale brought by agglomeration benefits, such as reduced production costs, detailed specialization, innovation benefits and competition benefits, can accelerate the development of industry. Therefore, large-scale industrial clusters are needed, the government should guide the location selection of companies through policies, such as giving subsidies to specific locations.
3. The development of the new energy industry in Zhejiang Province from 2016 to 2021 shows strong spatial dependence, and the difference in development between regions is significant. Little clusters of the new energy industry in Zhejiang are mainly distributed near the junction of Zhuji and Shengzhou. This may be caused by the differences in the level of economic development and technological accumulation in different regions. The junction of Zhuji and Shengzhou is sparsely populated and near the main road, which is suitable for the development of industrialization (Jiang et al., 2021). Taking industrial agglomeration effect as the objective, the junction of Zhuji and Shengzhou can be considered suitable for the development of new energy industry.
Since the present research is a brief research report, a full analysis of the development of new energy enterprises in Zhejiang is not achieved. The biggest limitation of this paper is that it cannot clarify the causal relationship, because different regions have different technological innovation abilities and resources. More theoretical work is needed in the future to analyze the impact of economic variables on evolution. However, as far as this paper is concerned, it is more about helping the Chinese government to understand the energy industry development. Therefore, possible factors such as economic level, technological development, and local culture were not considered. It is also needed to admit that the analysis techniques used is relatively simple, and no new spatial models has been constructed. Further research may also lie in how to maximize the realization of the improvement of the spatial point data models. To achieve this, greater collaboration with geographers may be needed in the future. At the same time, future research may also include the innovation capability of enterprises, and the comparative research with other industries, as suggested by Khan et al. (2018), Usman and Radulescu (2022), and Lv et al. (2022).
The raw data supporting the conclusion of this article will be made available by the authors, without undue reservation.
All authors contributed to the study conception and design. Material preparation, data collection, and analysis were performed by JL and ZC. The first draft of the manuscript was written by JL and ZC, and TC commented on previous versions of the manuscript. All authors read and approved the final manuscript.
This study is funded by Research Start-up Funding Project "The Impact of FDI on China's Industrial Green Transformation" of Guangdong Ocean University (Project No. 060302092103) and Guangdong Province Social Science Planning General Project "Research on Deepening Rural Finance and Integrated Development of Agricultural Industry in Western Guangdong under the Background of Rural Revitalization Strategy" (Project No: GD21CYJ07).
The authors declare that the research was conducted in the absence of any commercial or financial relationships that could be construed as a potential conflict of interest.
All claims expressed in this article are solely those of the authors and do not necessarily represent those of their affiliated organizations, or those of the publisher, the editors and the reviewers. Any product that may be evaluated in this article, or claim that may be made by its manufacturer, is not guaranteed or endorsed by the publisher.
Abd Majid, N., Muhamad Nazi, N., and Mohamed, A. F. (2019). Distribution and spatial pattern analysis on dengue cases in Seremban District, Negeri Sembilan, Malaysia. Sustainability 11 (13), 3572. doi:10.3390/su11133572
Ahmad, U. S., Usman, M., Hussain, S., Jahanger, A., and Abrar, M. (2022). Determinants of renewable energy sources in Pakistan: An overview. Environ. Sci. Pollut. Res. 29, 29183–29201. doi:10.1007/s11356-022-18502-w
Anser, M. K., Yousaf, Z., Zaman, K., Nassani, A. A., Alotaibi, S. M., Jambari, H., et al. (2020). Determination of resource curse hypothesis in mediation of financial development and clean energy sources: Go-for-green resource policies. Resour. Policy 66, 101640. doi:10.1016/j.resourpol.2020.101640
Bai, Y., Chou, L., and Zhang, W. (2021). Industrial innovation characteristics and spatial differentiation of smart grid technology in China based on patent mining. J. Energy Storage 43, 103289.
Bersalli, G., Menanteau, P., and El-Methni, J. (2020). Renewable energy policy effectiveness: A panel data analysis across Europe and Latin America. Renew. Sustain. Energy Rev. 133, 110351. doi:10.1016/j.rser.2020.110351
Bilal, A., Li, X., Zhu, N., Sharma, R., and Jahanger, A. (2021). Green technology innovation, globalization, and CO2 emissions: Recent insights from the OBOR economies. Sustainability 14 (1), 236. doi:10.3390/su14010236
Busu, M. (2019). The role of renewables in a low-carbon society: Evidence from a multivariate panel data analysis at the eu level. Sustainability 11 (19), 5260. doi:10.3390/su11195260
Castro, C. V. (2022). Optimizing nature-based solutions by combining social equity, hydro-environmental performance, and economic costs through a novel Gini coefficient. J. Hydrology X 16, 100127. doi:10.1016/j.hydroa.2022.100127
Chen, Q., Du, M., Cheng, Q., and Jing, C. (2020). Quantitative evaluation of spatial differentiation for public open spaces in urban built-up areas by assessing sdg 11.7: A case of deqing county. ISPRS Int. J. Geoinf. 9 (10), 575. doi:10.3390/ijgi9100575
Chen, Y., and Lin, B. (2020). Decomposition analysis of patenting in renewable energy technologies: From an extended LMDI approach perspective based on three Five-Year Plan periods in China. J. Clean. Prod. 269, 122402. doi:10.1016/j.jclepro.2020.122402
Chen, Y., Xu, Y., and Wang, F. (2022). Air pollution effects of industrial transformation in the Yangtze River Delta from the perspective of spatial spillover. J. Geogr. Sci. 32 (1), 156–176. doi:10.1007/s11442-021-1929-6
Di Silvestre, M. L., Favuzza, S., Sanseverino, E. R., and Zizzo, G. (2018). How Decarbonization, Digitalization and Decentralization are changing key power infrastructures. Renew. Sustain. Energy Rev. 93, 483–498. doi:10.1016/j.rser.2018.05.068
Dou, Z., Li, L. S., and Lu, L. (2022). A public health-oriented new energy industry competitiveness evaluation. J. Environ. Public Health 2022, 1–10. doi:10.1155/2022/4573629
Ferrer, R., Shahzad, S. J. H., López, R., and Jareño, F. (2018). Time and frequency dynamics of connectedness between renewable energy stocks and crude oil prices. Energy Econ. 76, 1–20. doi:10.1016/j.eneco.2018.09.022
Guo, Y., Tong, L., and Mei, L. (2021). The effect of industrial agglomeration on green development efficiency in Northeast China since the revitalization. J. Clean. Prod. 258, 120584.
Jiang, W., Liu, J., and Lin, X. (2021). “Urban–rural coordination in shaoxing: Small and medium town development amid urban–rural relationship transformation,” in Human-centered urban planning and design in China (Cham: Springer), 181–195.
Jing, S., Zhihui, L., Jinhua, C., and Zhiyao, S. (2020). China’s renewable energy trade potential in the" belt-and-road" countries: A gravity model analysis. Renew. Energy 161, 1025–1035. doi:10.1016/j.renene.2020.06.134
Khan, M. K., He, Y., Akram, U., Zulfiqar, S., and Usman, M. (2018). Firms’ technology innovation activity: Does financial structure matter? Asia. Pac. J. Financ. Stud. 47 (2), 329–353. doi:10.1111/ajfs.12213
Lian, J., Zhang, Y., Ma, C., Yang, Y., and Chaima, E. (2019). A review on recent sizing methodologies of hybrid renewable energy systems. Energy Convers. Manag. 199, 112027. doi:10.1016/j.enconman.2019.112027
Liu, S., and Xiong, X. (2021). Problem-oriented approach to political economy. China Econ. Rev. 69, 101674. doi:10.1016/j.chieco.2021.101674
Lo, D., Chau, K. W., Wong, S. K., McCord, M., and Haran, M. (2022). Factors affecting spatial autocorrelation in residential property prices. Land 11 (6), 931. doi:10.3390/land11060931
Lv, W., Feng, J., and Wu, Q. (2022). Spatial evolution of the energy industry in Hebei province and drivers of green productivity factors. Sci. Technol. Energy Transition 77, 9. doi:10.2516/stet/2022007
Martin, R. (2021). Putting the case for a pluralistic economic geography. J. Econ. Geogr. 21 (1), 1–28.
Pan, Y., Qiao, F., Tang, K., Chen, S., and Ukkusuri, S. V. (2020). Understanding and estimating the carbon dioxide emissions for urban buses at different road locations: A comparison between new-energy buses and conventional diesel buses. Sci. Total Environ. 703, 135533. doi:10.1016/j.scitotenv.2019.135533
Sanaei, N., Fatemi, A., and Phan, N. (2019). Defect characteristics and analysis of their variability in metal L-PBF additive manufacturing. Mater. Des. 182, 108091. doi:10.1016/j.matdes.2019.108091
Sun, W., Shan, J., Wang, Z., Wang, L., Lu, D., Jin, Z., et al. (2020). Geospatial analysis of urban expansion using remote sensing methods and data: A case study of Yangtze River Delta, China. Complexity 2020 (4), 1–12. doi:10.1155/2020/3239471
Sun, Y., Chen, M., Yang, J., Ying, L., and Niu, Y. (2022). Understanding Technological Input and Low-Carbon Innovation from Multiple Perspectives: Focusing on Sustainable Building Energy in China. Sustain. Energy Technol. Assess 53, 102474.
Tisdell, C. A. (2020). Economic, social and political issues raised by the COVID-19 pandemic. Econ. analysis policy 68, 17–28. doi:10.1016/j.eap.2020.08.002
Usman, M., Jahanger, A., Makhdum, M. S., Radulescu, M., Balsalobre-Lorente, D., and Jianu, E. (2022). An empirical investigation of ecological footprint using nuclear energy, industrialization, fossil fuels and foreign direct investment. Energies 15 (17), 6442. doi:10.3390/en15176442
Usman, M., and Makhdum, M. S. (2021). What abates ecological footprint in BRICS-T region? Exploring the influence of renewable energy, non-renewable energy, agriculture, forest area and financial development. Renew. Energy 179, 12–28. doi:10.1016/j.renene.2021.07.014
Usman, M., Makhdum, M. S. A., and Kousar, R. (2021). Does financial inclusion, renewable and non-renewable energy utilization accelerate ecological footprints and economic growth? Fresh evidence from 15 highest emitting countries. Sustain. Cities Soc. 65, 102590. doi:10.1016/j.scs.2020.102590
Usman, M., and Radulescu, M. (2022). Examining the role of nuclear and renewable energy in reducing carbon footprint: Does the role of technological innovation really create some difference? Sci. Total Environ. 841, 156662. doi:10.1016/j.scitotenv.2022.156662
Wang, Q., and Wang, L. (2020). Renewable energy consumption and economic growth in oecd countries: A nonlinear panel data analysis. Energy 207, 118200. doi:10.1016/j.energy.2020.118200
Wang, Y., Zhang, D., Ji, Q., and Shi, X. (2020). Regional renewable energy development in China: A multidimensional assessment. Renew. Sustain. Energy Rev. 124, 109797. doi:10.1016/j.rser.2020.109797
Wu, W., Ding, Z., Huang, K., Song, Y., and Dong, H. (2021). Spatial distribution of enterprise communities and its implications based on POI data: Case of Xi’an, China. J. Urban Plan. Dev. 147 (3), 05021028. doi:10.1061/(asce)up.1943-5444.0000707
Wu, X., Zhou, Y., Cheng, C., and Yang, S. (2022). Industrial characteristics of renewable energy and spatial aggregation correlations in Beijing–Tianjin–Hebei. Sci. Technol. Energy Transition 77, 3. doi:10.2516/stet/2022002
Wu, Z., Shao, Q., Su, Y., and Zhang, D. (2021). A socio-technical transition path for new energy vehicles in China: A multi-level perspective. Technol. Forecast. Soc. Change 172, 121007. doi:10.1016/j.techfore.2021.121007
Xu, Q., Dhaundiyal, S., and Guan, C. (2020). Structural conflict under the new green dilemma: Inequalities in development of renewable energy for emerging economies. J. Environ. Manag. 273, 111117. doi:10.1016/j.jenvman.2020.111117
Xu, X., Wei, Z., Ji, Q., Wang, C., and Gao, G. (2019). Global renewable energy development: Influencing factors, trend predictions and countermeasures. Resour. Policy 63, 101470. doi:10.1016/j.resourpol.2019.101470
Xu, Z., Wang, X., and Wu, G. (2022). Exploring the coupling relationship of industrial agglomeration and low-carbon economy considering spatiotemporal differentiation: An empirical study in China’s construction machinery industry. Front. Eng. Manag., 1–15. doi:10.1007/s42524-022-0197-1
Xue, B., Xiao, X., and Li, J. (2020). Identification method and empirical study of urban industrial spatial relationship based on POI big data: A case of shenyang city, China. Geogr. Sustain. 1 (2), 152–162. doi:10.1016/j.geosus.2020.06.003
Yang, B., Jahanger, A., Usman, M., and Khan, M. A. (2021). The dynamic linkage between globalization, financial development, energy utilization, and environmental sustainability in GCC countries. Environ. Sci. Pollut. Res. 28 (13), 16568–16588. doi:10.1007/s11356-020-11576-4
Zhang, F., Zhao, Z., and Tang, C. (2019). Study on China’s electricity market mechanism of renewable energy IOP conference series: Material. IOP Conf. Ser. Mat. Sci. Eng.IOP Publ. 677 (3), 032024. doi:10.1088/1757-899x/677/3/032024
Zhang, J., and Huang, W. (2022). A Pilot Assessment of New Energy Usage Behaviors: The Impacts of Environmental Accident, Cognitions, and New Energy Policies. Front. Environ. Sci. 1035.
Zhang, L., Huang, F., Lu, L., Ni, X., and Iqbal, S. (2022). Energy financing for energy retrofit in COVID-19: Recommendations for green bond financing. Environ. Sci. Pollut. Res. 29 (16), 23105–23116. doi:10.1007/s11356-021-17440-3
Keywords: new energy, sustainable development, technological diffusion, spatial evolution, Zhejiang
Citation: Liu J, Chen T and Chen Z (2022) Revolution of new energy industry: Spatio-temporal dynamics and drivers of technological diffusion in Zhejiang, China. Front. Environ. Sci. 10:1058372. doi: 10.3389/fenvs.2022.1058372
Received: 30 September 2022; Accepted: 27 October 2022;
Published: 17 November 2022.
Edited by:
Magdalena Radulescu, University of Pitesti, RomaniaReviewed by:
Mihaela Simionescu, University of Social Sciences, PolandCopyright © 2022 Liu, Chen and Chen. This is an open-access article distributed under the terms of the Creative Commons Attribution License (CC BY). The use, distribution or reproduction in other forums is permitted, provided the original author(s) and the copyright owner(s) are credited and that the original publication in this journal is cited, in accordance with accepted academic practice. No use, distribution or reproduction is permitted which does not comply with these terms.
*Correspondence: Ziyi Chen, MjAyMTkwOTZAd3piYy5lZHUuY24=
Disclaimer: All claims expressed in this article are solely those of the authors and do not necessarily represent those of their affiliated organizations, or those of the publisher, the editors and the reviewers. Any product that may be evaluated in this article or claim that may be made by its manufacturer is not guaranteed or endorsed by the publisher.
Research integrity at Frontiers
Learn more about the work of our research integrity team to safeguard the quality of each article we publish.