 Yushan Chen
 Tong Zhao
- Business School, Nanjing XiaoZhuang University, Nanjing, China
This study adopts a relatively infrequent approach to explore the impact of environmental regulation and technological innovation on energy efficiency (EFF) based on the undesired superefficiency SBM and random Tobit model. To study the universal EFF, we establish the undesired superefficiency SBM model, which is composed of three input indexes such as energy, one expected output index, and three pollution emissions as the undesired output index, consider the EFF of the sample with an effective decision-making unit (DMU) value less than 1, and calculate with the MATLAB software, according to panel data of 30 Chinese provincial-level regions from 2001 to 2019. The empirical results show that the EFF has an N-type trend in the eastern, central, and western regions of China. When exploring the impact of environmental regulation and technological innovation on EFF, we conduct an empirical analysis of the eastern, central, and western regions with the random Tobit model. The regression results indicate that the impact of environmental regulation on EFF in the different regions varies significantly. Technological innovation has different impacts on EFF in different regions and is the main influencing factor of EFF. Moreover, we strive to analyze the impact of cross-term environmental regulation and technological innovation and find that the cross-term has a significant positive impact on EFF in each region. These results emphasize that environmental regulation and technological innovation have positive or negative impacts on EFF, and both impacts may exist simultaneously, which is a perfection of the EFF theory.
1 Introduction
In the past 20 years, China’s economy has grown rapidly. This rapid growth requires the support of a large amount of energy consumption. Unfortunately, this large amount of energy consumption has also brought about problems of major social development. First, the degree of environmental contamination in China is getting higher. Large-scale haze weather has repeatedly appeared in China, indicating that the degree of industrial pollution has approached the limit of environmental carrying. According to the 2010 World Energy Statistical Yearbook, it is the largest energy consumer that China has become in the world. A large amount of energy consumption will inevitably bring about air and serious water pollution (Liu et al., 2019). With China’s economic development in the future, energy consumption is likely to increase (Feng and Wang, 2017), and balancing environmental protection and economic development has become an important factor affecting the sustainable development of China’s economy and society (Zhang and Zhou, 2020). Therefore, reducing environmental pollution and improving energy efficiency (EFF) have become urgent in China. Second, it is difficult to achieve the goals of energy conservation, emission reduction, and EFF improvement simply by relying on the market; therefore, environmental regulations proposed by the government are needed to compensate for the market failure. The so-called “environmental regulation” refers to the direct intervention of the government in the utilization of environmental resources through non-market means (Zhao et al., 2009). China’s environmental regulation is aimed at improving environmental quality and forcing enterprises to improve EFF (Zhang et al., 2019). However, any policy, like a coin, has two sides. Although environmental regulation can interfere with pollution emissions of enterprises, it is worth studying whether it can improve EFF. Third, the energy-saving effect of many emission reduction policies in China is unsatisfactory, and environmental pollution has not been alleviated from the root. However, there is no unified opinion on whether technological innovation, as the main factor of technological progress, can achieve EFF improvement and pollution reduction. It is generally believed that technological innovation can improve the level of the production process and is an effective way to improve energy utilization efficiency (Kemfert and Truong, 2007). However, not all innovations can improve EFF (Jia and Zhang, 2013). Whether environmental regulation and technological progress can affect EFF also needs further exploration. Therefore, studying the relationship between environmental regulation, technological innovation, and EFF, as well as how to reduce environmental pollution and improve EFF, has become an issue of great concern to academia, the Chinese government, and even the world. This is an important practical value to meet the era requirements of China’s eco-efficient development economy.
The study on this issue has many meanings. First, it is beneficial to explore the impact mechanism of environmental regulation and technological innovation on EFF. Theoretically, the relationship is explored between environmental regulation and technological innovation to EFF to provide theoretical support for energy conservation and emission reduction in developing countries. The second aspect is helpful to clarify the differences in the impact of EFF among the three major regions of China in the process of economic development, which provides a reference for the balanced economic development of various regions in China. The third point is conducive to reducing pollution emissions and improving the environment, making the economy of various regions in China shift to the green growth of low energy consumption and high output, and providing a certain reference for other countries when formulating energy policies.
This study has three main contributions: first, it explores the mechanism of environmental regulation and technological innovation on China’s EFF. The impact of this mechanism on EFF of the three regions in China is quite different; the internal reasons for its impact on EFF are also different. This provides a theoretical reference for China to save energy, reduce emissions, and improve EFF in the process of economic development. Secondly, the cross-terms of environmental regulation and technological innovation have significant positive effects on EFF in different regions. However, the coefficients are different, and the impact coefficients are different at the same time. This indicates that part of technological innovation and part of environmental regulation are put into the production process of energy saving and efficiency improvement, which improved the EFF. This can further explain why scientific and technological innovation has a positive or negative impact on EFF in the literature. Thirdly, the EFF of the three regions is approximately N-shaped, and it is concluded that the EFF of the economically developed regions is sometimes lower than that of the undeveloped regions.
The idea of this study is divided into five parts. The first part is an introduction, which explains the research background, significance, and contributions. The second part is the literature review, which summarizes the impact of environmental regulation, technological innovation, and the two variables on EFF. The third part is the study design, which mainly introduces the undesired superefficiency SBM model, Tobit models, and variable setting. The fourth part is the analysis of empirical results. It includes whether the Tobit model needs to contain the cross-term, the selection of the random Tobit model, and the quantitative analysis of the influence on EFF of the three major regions and the whole country in the random Tobit model. The fifth part is the research conclusions and suggestions. Based on the measurement results and the existing research, this study sorts out the research conclusions and puts forward suggestions.
2 Literature review
EFF means that the actual energy input was optimal when the production output was fixed (Patterson, 1996). In the early research of EFF, the traditional DEA and SFA models were mostly applied. Such models did not consider the impact of undesired output, and the results of the models were difficult to reflect the true level of EFF. Therefore, some scholars began to use the superefficiency DEA method and build the SBM model that can deal with unwanted output to study EFF (Fan and Wang, 2013).
2.1 Impact of environmental regulation on EFF
At present, environmental regulation has made remarkable achievements in controlling environmental pollution, but there were differences in the research views on the impact of environmental regulation on EFF.
(1) Environmental regulation had a negative impact on EFF “following costs” because environmental regulation increased pollution control costs of enterprises, which directly increased production costs. Thus, EFF can be reduced by environmental regulation. Jorgenson and Wilcoxen (1990) reported that environmental regulation led to the decline in the gross national product, through their empirical research on the economic growth of the United States through environmental regulation. Levinsohn and Petrin (2003) concluded that the high cost of pollution control in the US paper industry had a dampening effect on the productivity of the paper industry. Li et al. (2019) pointed out that the reduction of EFF had only become apparent when the intensity of environmental regulation increased to a certain extent.
(2) Environmental regulation positively affects “innovation compensation” on EFF, which improves EFF. Environmental regulation forces enterprises to perform energy-saving technology innovation, which reduces the demand for energy under the condition of constant output, which improves the energy intensity. Porter (1991) proposed that environmental regulation, in an appropriate way, had offset the constraint of “compliance cost” and had improved the level of enterprise productivity. Costantini and Crespi’s (2008)’ research showed that the dynamic impact of environmental regulation on the export of energy technology improved the efficiency under the background of international trade, which was in line with Porter’s hypothesis. Mandal (2010) conducted an empirical study on India’s cement industry and found that environmental regulation reduced pollution and improved EFF. Bi et al. (2014) suggested that limiting pollutant emissions improved EFF by comparing the change of total factor EFF in the thermal power generation industry, which was the idea of improving EFF that Peng (2020) also supported.
(3) Environmental regulation may have a nonlinear effect on increasing or decreasing EFF. According to Yang et al. (2016), there was an inverted U-shaped relationship between environmental regulation and EFF. When environmental regulation reached certain conditions, per capita energy consumption was reduced. Albrizio et al. (2017) found that regulation intensity had different effects on the productivity growth of enterprises with different productivities. For enterprises with high productivity, strict environmental regulations boosted their productivity, while for enterprises with low productivity, strict environmental regulation reduced their product productivity. Hu et al. (2019) believed that environmental regulation had a positive effect of U-shaped on the EFF and a lower environmental regulation, leading to reduced EFF.
2.2 Impact of technological innovation on EFF
It is almost common sense that technological innovation, as the main source of technological progress, contributes to EFF. However, there are two types of technological innovation (Lee, 2010). The first category is product innovation, which refers to technological innovation based on product design changes, and the second category is process innovation, which refers to technological changes in the production (service) process, which is an effective part of improving energy utilization. Although there are a lot of research achievements in the field of technological progress and EFF at home and abroad, most of the literature from unilateral or involving other factors. However, few studies directly describe the relationship between technological innovation and EFF (Trianni et al., 2013).
(1) Technological innovation has a positive impact on EFF; it improves EFF by saving scarce production factors and changing the proportion of the marginal output of each factor. Technological progress was originally proposed by Hicks (1932), who believed that technological progress had been the use of abundant production factors to save scarce production factors and who divided it into capital-saving, labor-saving, and neutral technological progress. Acemoglu (2002) believed that technological progress had changed the proportion of the marginal output of each factor and the use ratio of energy factors to non-energy factors, thus improving EFF. Bala Subrahmanya and Kumar (2011) concluded from their study of SMEs in the Indian machine tool industry that technological innovation activities aimed at saving production costs contribute to improving EFF. Ramirez-Portilla et al. (2014) confirmed the positive correlation between innovation and EFF of enterprises. After their research on Italian foundry companies, Cagno et al. (2015) found that companies of high innovation activity preferred to use energy-saving technologies to improve EFF. Herrerias et al. (2016) supported that technological innovation had a significant co-directional impact on EFF.
(2) Technological innovation has a negative or insignificant impact on EFF, which would reduce EFF. Sun et al. (2011) believed that due to the diversity of expenditure on technological innovation in the industry, EFF had a negative impact when technological expenditure was mainly used for product design rather than for the improvement of production process efficiency. Luo et al. (2015) showed that technological innovation had no significant impact on EFF and sometimes had a negative impact. Wang and Wang (2020) used the exponential decomposition method and the regression method to prove that excessive investment in technological progress did not significantly improve EFF. The reason was caused by the diversity of the expenditure direction of technical funds and the great difference in the investment of technical funds in various industries.
2.3 Impact of environmental regulation and technological innovation on EFF
There were few studies on the relationship between environmental regulation, technological innovation, and EFF. In the long run, energy consumption was reduced only when the positive effect of “innovation compensation” was greater than the negative effect of “compliance cost” (Jaffe and Stavins, 1995; Liu et al., 2017). Managi et al. (2005) studied the natural gas and oil industry in the Gulf of Mexico and found that environmental regulation and technological innovation had a negative impact on the energy intensity in the current period, which had a positive impact on energy intensity in the lagged period. According to Yang and Zhu (2017), technological innovation in eastern and central China had no significant positive impact on EFF under environmental regulation. However, in western China, it had a significant negative impact.
In summary, most of the literature mainly studied the impact of environmental regulations on EFF of a certain enterprise from the micro-perspective and rarely considered the impact of environmental regulations under macro-policies. Regarding the relationship between technological innovation and EFF, the research literature based on Chinese data has not formed a consistent empirical conclusion. As for the views contrary to common sense, the formation mechanism behind them also lacked in-depth discussion in the relevant literature. Most of the literature on the relationship between the three aspects was qualitative judgment, which cannot quantitatively explain the impact of environmental regulation and technological innovation on industrial energy consumption. Based on the research of the above scholars and the provincial panel data of China from 2001 to 2019, this study used the undesired superefficiency SBM model to calculate the EFF with undesired output, which built the Tobit model of EFF on this basis. It further analyzed the magnitude and direction of the impact of environmental regulation and technological innovation on EFF in China’s three major regions while discussing the impact of their cross-terms on EFF. This would provide a theoretical reference for the development of low-energy consumption and a green and sustainable economy in all regions of China. It also provided a reference for developing countries to make energy policies. This was the innovation and unique value of this study.
3 Research methods and hypotheses
3.1 EFF measurement method
Currently, the superefficiency DEA model has been applied more in different fields, but there are not many related studies applying it to China’s EFF evaluation. The research on energy and efficiency is not satisfied with the study of single-factor EFF, and the research on multi-factor EFF is the development tendency of future research in the field of EFF. Therefore, on the basis of relevant research at home and abroad, this study considers the following two aspects for improvement: first, carbon dioxide emissions and other pollution emissions are studied as unintended output indicators to examine the relationship between emission reduction and energy saving and EFF and second, the undesired superefficiency DEA model is used to study the EFF value of effective decision-making units and provides data basis for detailed research on improving EFF.
3.1.1 Selection of superefficiency DEA model
The DEA method is first proposed by Charnes and Cooper (1984). Up to now, the DEA model has been applied to mathematics, management science, and many other fields, but the original conventional DEA model is not applied to some fields of in-depth research with the research needs of scholars on DEA model, DEA model has also been further developed. When there is excessive input or insufficient output, the result of the decision-making unit (DMU) calculation will not conform to the objective reality. Therefore, to overcome the above problems, Tone (2001) created the measurement method of efficiency based on slack variables, that is, the SBM model.
The efficiency value calculated by the SBM model can be kept within the interval 0 to 1, and the efficient DMU takes the value of 1, whereas the DMU less than 1 is regarded as an invalid state. However, when quite a few DMUs are set to 1, we cannot compare efficient DMUs. Nevertheless, the efficiency value ρ is calculated by the superefficiency SBM model, which can be greater than or equal to 1, and which can perfectly compare the efficient DMUs in the SBM model. Modern production methods increase labor productivity, while industrial production inevitably generates a large amount of wastewater and gas (we call it undesirable output). Tone (2004), based on his own research, constructed an undesired superefficiency SBM model to calculate the true efficiency of the DMU.
Based on the research of Tone (2003) and Cheng (2014), this article constructed a non-radial and non-oriented SBM model with constant returns to scale (CRS) and non-expected superefficiency. It used MATLAB software to calculate EFF to compare and analyze the efficiency.
The model assumed that there were n DMUs, and each DMU contained elements of input, desired output, and undesired output (e.g., carbon dioxide and wastewater), represented by three vectors X, Y, and Z, respectively. It was assumed that the DMU of the SBM model with undesired superefficiency in this study was (x0, y0, z0), and the formula was as follows:
where sx∈sm and sz∈s2 represent the excess of input and undesired output, respectively, and sy∈s1 represents the shortage of desired output. ρ stands for the efficiency value of the DMU. M, S1, and S2 stand for the number of variables for input, desired output, and undesired output. Eq. 1 satisfies constant returns to scale (CRS). If ∑λ = 1 is satisfied in Eq. 2, then Eq. 1 satisfies the case of variable returns to scale (VRS). Similar to the superefficient SBM model, the efficiency value ρ is calculated for the non-desired superefficient SBM model. When ρ is greater than or equal to 1, DMU is valid. On the contrary, it symbolizes that DMU is not effective and that there is room for improvement on DMU.
3.1.2 Variable selection and data sources
The undesired superefficiency SBM model of China’s EFF in this study adopts three input indicators, one expected output index, and three unexpected output indicators. Among them, the input indicators include energy input and non-energy input (including capital input and labor input), and the EFF value is calculated by MATLAB software.
3.1.2.1 Variable choice
Energy is an avital input factor in the production process, which mainly includes coal, crude oil, natural gas, and other energy sources. Due to the differences in the energy consumption structure of each province, it is uniformly converted into “ten thousand tons of standard coal” and then summed up. The obtained total energy consumption is taken as the energy input (Tobin, 1958). In this study, all kinds of energy in each province are converted into total energy consumption (Feng and Wang, 2015).
Capital input is represented by the fixed capital investment of each province after depreciation, and the depreciation rate of this study is calculated by the perpetual inventory method of Shan (2008):
where
Labor input, which is the best indicator to measure, is the labor time in the manufacturing process, but the data on labor time cannot be obtained. Therefore, referring to relevant literature, this study chooses to measure labor input by the “average number of employees in industrial enterprises above designated size” in each province (Ye and Li, 2022).
Desirable output, the pollutants emitted by energy consumption are mainly air pollution and water pollution. It is also the undesired output of energy consumption to the output of the environment. The existing literature mostly uses the gross product as the expected output, and the expected output of this study selects the adjusted GDP of each regional gross product index as the measurement index (Li and Li, 2018). To consider the year 2000 as the base period, divide the GDP of each region by the GDP deflator and get the real GDP, which is the expected output.
• Undesirable output, the pollutants emitted by energy consumption are chiefly air and water pollution. It is also the undesired output of energy consumption to the environment. By referring to the methods adopted by Managi and Kaneko (2006) and Watanabe and Tanaka (2007), the undesired output is measured by CO2, SO2, and industrial wastewater emissions, as shown in Table 1.
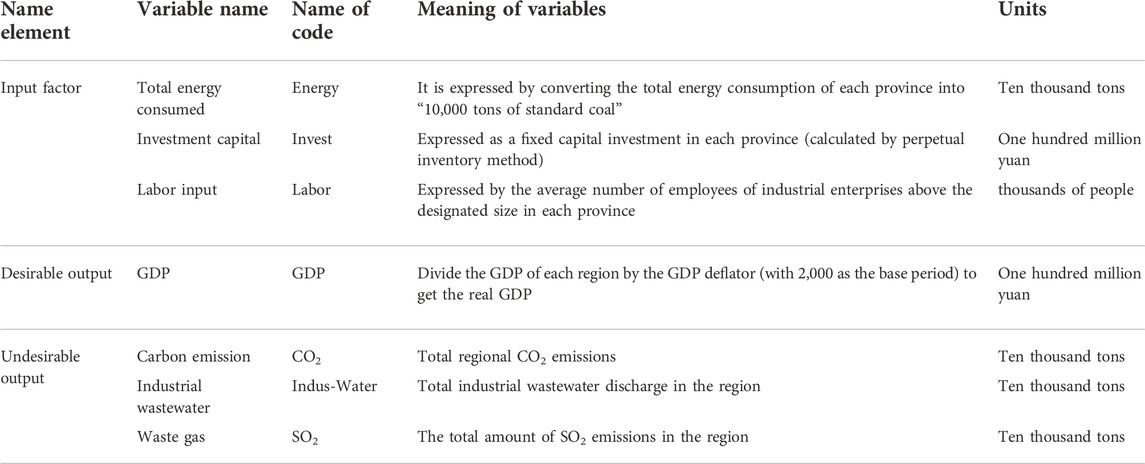
TABLE 1. Input–output variation table of the DEA model.
3.1.2.2 Data sources
According to the research purpose and data availability, this study considers 30 provinces, municipalities, and autonomous regions of China (hereinafter referred to as “provinces”) as independent decision-making units and selects EFF panel data from 2001 to 2019, among which Tibet, Hong Kong, Macao, and Taiwan are not included due to missing data. According to the principle of combining economic development level and geographical location, China is divided into three major economic zones: eastern, central, and western. The eastern region includes Beijing, Hainan, and 11 other provinces. The central region includes eight provinces, such as Shanxi and Hunan. The western region includes 11 provinces, including Inner Mongolia and Xinjiang.
Among them, the data of each input variable are summarized from the data center of the National Bureau of Statistics of China and the statistical yearbooks of various provinces. The research data of expected and unexpected outputs are mainly summarized from the China Energy Statistical Yearbook, China Statistical Yearbook, and China Environmental Statistical Yearbook from 2001 to 2019.
3.1.2.3 Descriptive statistics of DEA model variables
In the process of calculating the EFF of China’s 30 provinces by the DEA model, we not only study the overall EFF of China but also divide China’s 30 provinces into three regions and make a comparative analysis of the EFF of the three regions. Between 2001 and 2019, the average EFF in the east was 0.4435, the maximum value was 0.8337, and the minimum value was 0.0851. The mean value of EFF in the central region is 0.2817, the maximum value is 0.5257, and the minimum value is 0.0364. In the west, the mean value of EFF is 0.3944, the maximum value is 0.6130, and the minimum value is 0.2018. The national average EFF is 0.3824, the maximum is 0.5753, and the minimum is 0.1730. The order of EFF of the three economic zones from high to low is eastern, western, and central.
Meanwhile, among the 11 eastern provinces, the average EFF of Hainan province is the highest (0.9692), and that of Shandong province is the lowest (0.2300). Among the 11 western provinces, the highest EFF is 0.6739 in Ningxia, and the lowest is 0.2097 in Inner Mongolia. Among the eight provinces in central China, Heilongjiang province has the highest average EFF of 0.4014, whereas Henan province has the lowest average EFF of 0.2032, as shown in Table 2.
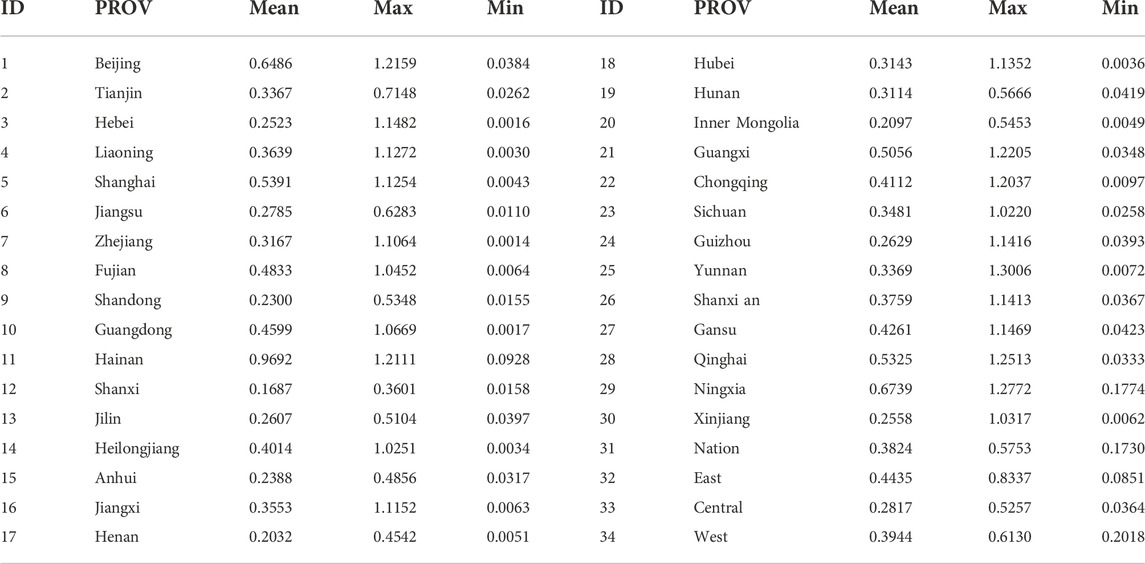
TABLE 2. Average EFF of China’s 30 provinces from 2001 to 2019 (unit, none).
From the average change trend (shown in Table 3), the EFF of each region is between 0 and 0.9. From 2001 to 2008, the EFF of the three major regions fluctuated slowly, and the order of EFF from high to low was the eastern, central, and western regions. The period 2008–2009 was a watershed in EFF from high to low, with a decline in EFF in all regions.
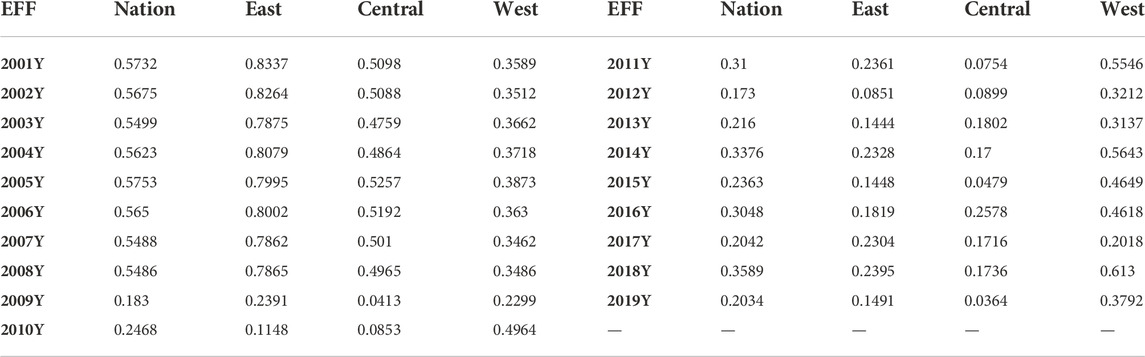
TABLE 3. EFF statistics of China’s eastern, central, western, and national regions from 2001 to 2019 (unit, none).
Between 2009 and 2019, the EFF of the eastern, central, and western regions of China all fluctuated greatly. The EFF of the western region jumped up and became the most energy-efficient region. Then, the eastern region was the second high and the lowest in the central region. The trend of EFF across the country is extremely similar to that of the eastern region, and the values for each year are the average of the EFF of the three major regions, as shown in Figure 1.
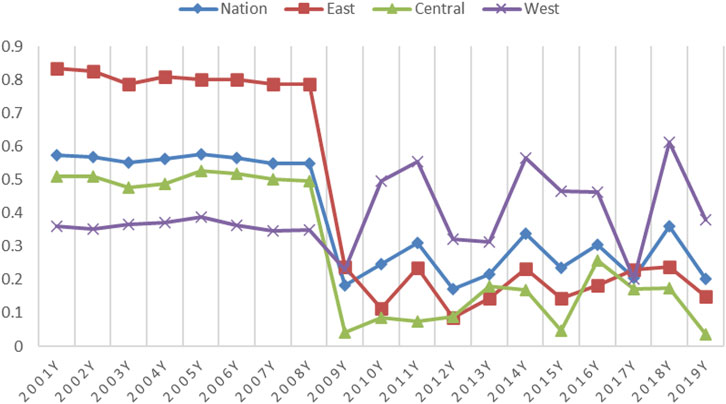
FIGURE 1. Trend of average EFF in eastern, central, western and national China.
After comparing the EFF of the three regions, the average trend line of EFF in the west is the highest, the average trend line of EFF in the central is the second highest, and the average trend line of EFF in the east is the lowest. The EFF of the national average has a very similar trend to the average of the eastern region. There is a high possibility that this phenomenon is caused by the undesired output in the EFF model. In other words, in the economic development of various regions in China, not only the economic output, but also the emissions of environmental pollution are concerned.
3.2 Analysis method of influencing factors of EFF
3.2.1 Tobit model construction
The classic Tobit model is a generalization of the Probit probability regression model in Tobin J’s research, which is a regression model with limited dependent variables (Chen et al., 2022). Although the superefficiency DEA model in this study can calculate the EFF value of each DMU, it cannot estimate the magnitude and direction of the factors affecting EFF based on slack variables. Therefore, this study introduces the Tobit regression model and establishes a superefficiency DEA-Tobit two-stage model system to analyze the influencing factors of EFF.
The Tobit regression model criterion is defined as follows:
where
This study assumes that the Tobit model of EFF is as follows:
Among them, EFF stands for EFF, ER is energy regulation, TI is technological innovation, PGDP stands for economic development, IS is industrial structure, ENST represents energy structure, OPEN represents the degree of opening to the outside world, i represents the cross-section of each province, and t represents the year.
In Eq. 7, M represents the cross-term of energy regulation and technological innovation that affects EFF simultaneously. The definitions of the remaining variables are the same as those in Eq. 6:
3.2.2 Variable selection and data sources
3.2.2.1 Variable selection
The Tobit model is calculated by STATA software. The model calculation mainly involves the following three types of variables: explained variables, core explanatory variables, and control variables. As for the explained variable EFF, different scholars have different understandings of it and different methods for calculating EFF. This study uses the non-expected superefficiency SBM model to calculate the EFF of each province and takes the EFF of each province as the explained variable of the Tobit model.
The core explanatory variables of this study are the environmental regulation and technological innovation of each province, which is also the focus of this study. It should be noted that if the explanatory variables used for EFF are different, the conclusions may be inconsistent.
Environmental regulation (ER), according to the practice of most scholars, is expressed by the completion of the investment in industrial pollution control per thousand yuan of industrial added value (Wang and Zhong, 2015), that is, the actual amount of industrial pollution control investment in each province (hundred million yuan) divided by the actual value of industrial added value (hundred million yuan) and then multiplied by 1,000.
For technological innovation (TI), this study draws on Dong Huazhong to express the ratio of the research and experimental development expenditure (100 million yuan) of each province to the GDP of each province (Zhang et al., 2021). Many scholars use research and experimental development expenditures as technological innovations, but separate research and experimental development expenditures contain inflationary factors. Therefore, this study uses the ratio of it to provincial GDP to eliminate inflationary factors.
In order to avoid bias due to the omission of other variables in the EFF estimation, this study introduces four control variables: economic development level, industrial structure, energy structure, and degree of opening to the outside world.
• The level of economic development (PGDP) is expressed by the per capita GDP of each region, that is, PGDP, to measure the level of economic development (Dai and Fu, 2020; Wang, 2022). Industrial structure (IS) is caused by the different dependences of industries on labor and energy in different regions. Considering that the secondary industry is the main factor of energy consumption in China, this study adopts the proportion of the total output value of the secondary industry in each region as the ratio of the total industrial output value of each region as the industrial structure (Mu et al., 2022). Energy structure (ENST, is expressed by the proportion of coal consumption (converted to standard coal) in each province to the total energy consumption (converted to standard coal) of each province (Torrie et al., 2016). The degree of opening to the outside world (OPEN), usually the degree of openness of a country’s economy, is related to the country’s resource endowment, the size of the country, and the nature of its economic system. This study uses the ratio of regional total import and export to regional GDP to measure. The unit of total import and export is US dollars, whereas the unit of regional GDP is RMB. Therefore the approximate conversion is made at the exchange rate of US dollars to RMB at the end of each year (Wu et al., 2017), as shown in Table 4.
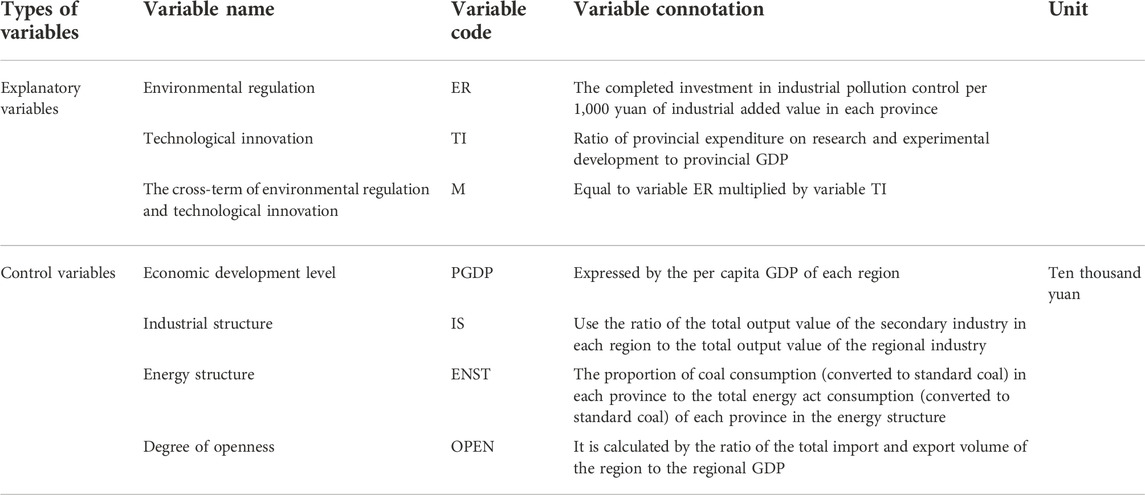
TABLE 4. Explanatory variables and control variables in the Tobit model.
3.2.2.2 Data sources
The data of the explained variables are derived from the calculation results of the undesired superefficiency SBM model in this study. The data of explanatory and control variables come from the 2001–2019 “China Energy Statistical Yearbook,” “China Statistical Yearbook,” “China Environmental Statistical Yearbook,” the data center of the National Bureau of Statistics, and the statistical yearbooks of various provinces.
3.2.2.3 Descriptive statistics of variables in the Tobit model
In the process of calculating the influence of variables on EFF by the Tobit model, there were 570 EFF samples of panel data in all provinces, among which the mean of EFF was 0.382, the maximum value was 1.301, the minimum value was 0.0014, and the standard deviation was 0.377.
The mean value of environmental regulation (ER) was 7.510, the maximum value was 34.070, the minimum value was 2.580, and the standard deviation was 0.377. The mean value of technological innovation (TI) was 0.014, the maximum value was 0.063, the minimum value was 0.001, and the standard deviation was 0.011. The mean value of the cross-term (M = ER*TI) was 0.100, the maximum value was 0.491, the minimum value was 0.011, and the standard deviation was 0.087. The mean, maximum, and minimum values and standard deviation of the four control variables are recorded in detail in Table 5.
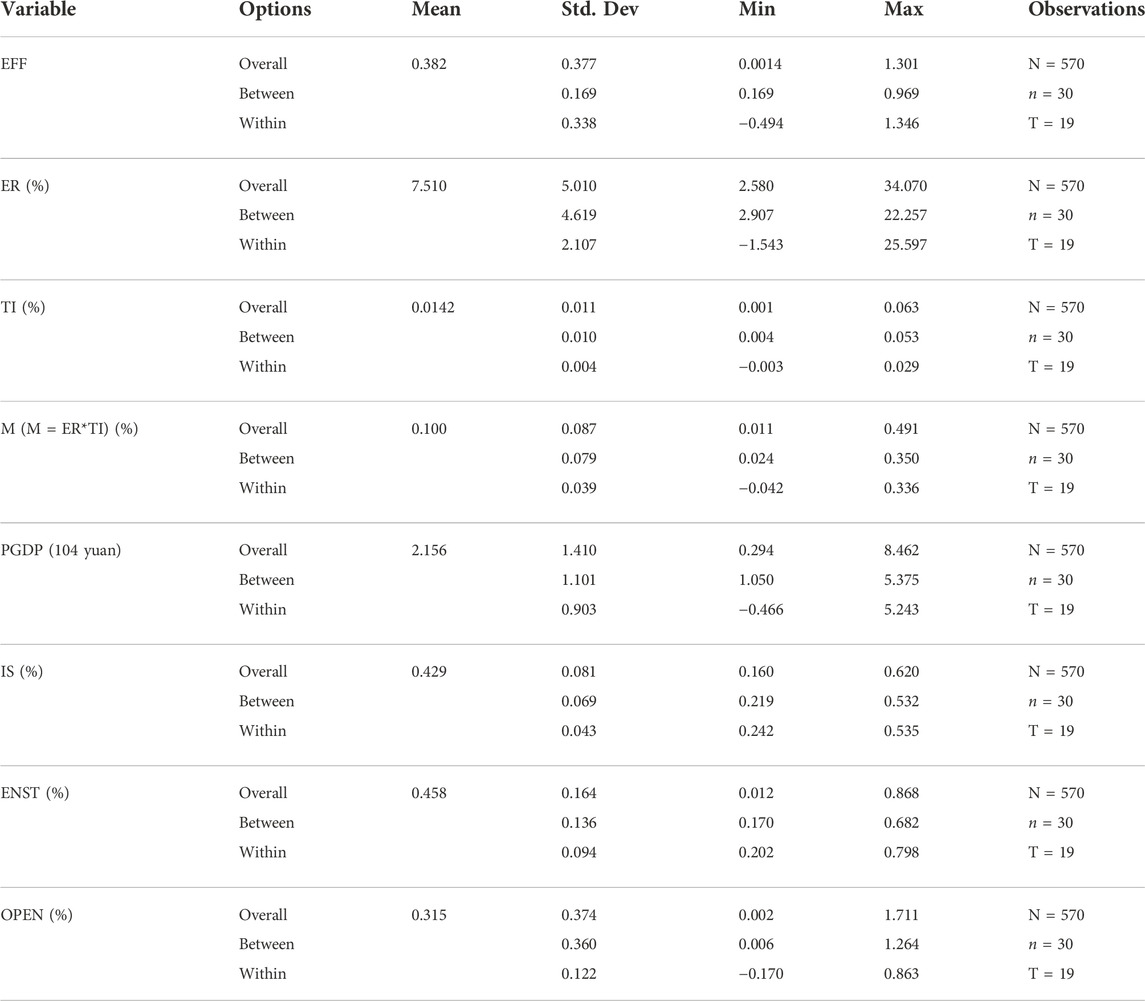
TABLE 5. Statistics of Tobit variables.
The “overall” option represents the statistical description of the whole sample, “between” represents the statistical description of the 30 provinces, and “within” represents the statistical description of the 19 years in Table 5. These three options have different parameters in descriptive statistics except for the same mean value.
4 Empirical process and results analysis
4.1 Correlation test
After the correlation analysis of all variables affecting EFF in the TOBIT model, the correlation coefficients between almost all explanatory and control variables were less than 0.3. Empirically, there is no correlation between them. Meanwhile, the values in parentheses are p-values, and most of the p-values are less than 0.05. Therefore, it can be judged that the variables are significantly uncorrelated. Detailed data are shown in Table 6. Therefore, it is necessary to further carry out regression or Tobit analysis on the data.
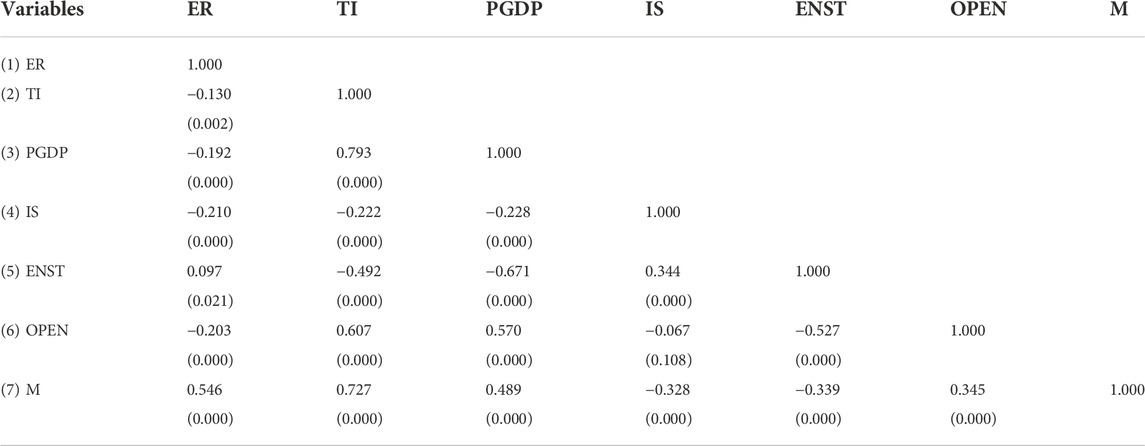
TABLE 6. Correlation test.
4.2 Selection of model
4.2.1 Selection of Tobit model and cross-term M
4.2.1.1 Comparison and selection of four models
For the energy panel data of 30 provinces in China, this study first performs OLS, random effects, fixed effects, and Tobit regression on formula (5), and their output calculation results are shown in Table 7. At the same time, the regression model was tested by the Houseman test. The Houseman test result showed that the p-value was 0.00 and less than 0.05, which was significant. For this purpose, we chose the fixed effects model.
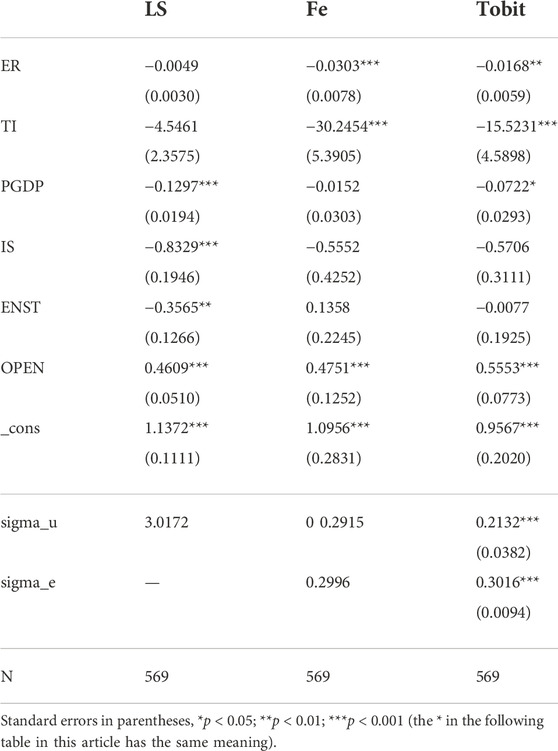
TABLE 7. Four model outputs without cross-terms: OLS, fixed effect, and Tobit model.
Secondly, after selecting the fixed effect model, it was compared with the output results of the OLS and Tobit regression model. In the output results of these models (see Table 7), we clearly found that the Tobit model has a better significance of the variables and the residual has better significance when compared with the other three models. Therefore Tobit’s model is superior.
4.2.1.2 Comparative selection of models with or without the cross-term
Of course, Table 7 is the consequence of the model calculation without the cross-term (M). For Eq. 6 with cross-term (M), we conduct OLS, fixed effect, and Tobit regression calculation, and the results are shown in Table 8.
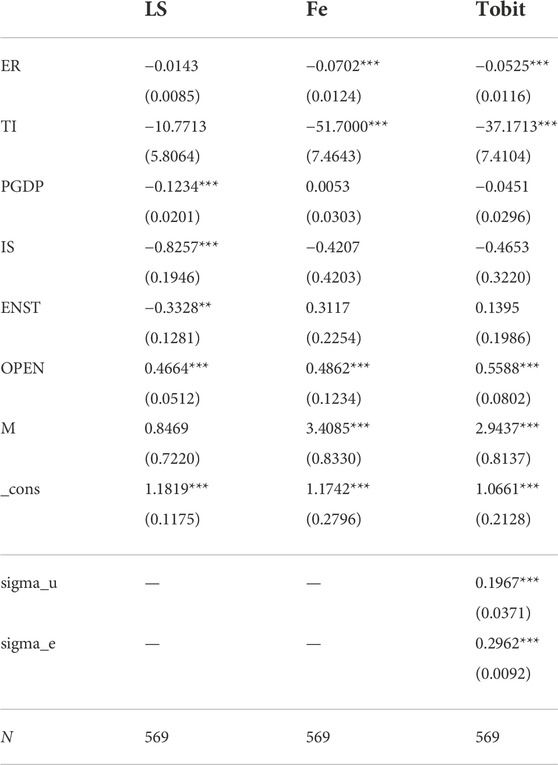
TABLE 8. Four model outputs with cross-terms: OLS, fixed effect, and Tobit model.
In the comparison between the Tobit model without and with cross-term M, this study has more significant variables and smaller residuals. Therefore, it is better to choose the Tobit model with cross-term M.
4.2.2 Comparison and selection of random Tobit models
After the selection of the Tobit model is determined, it is necessary to further determine the type of Tobit model to be selected. To this end, it is necessary to compare and analyze the three regression models of OLS, mixed OLS-Tobit, and stochastic Tobit for the EFF model. Then, we found that the number of significant variables in the stochastic Tobit model was more than that in other models, and the residual significance was also better than other models. Moreover, the Wald test results are significant, indicating that the hypothesis of individual effect exists; in other words, the mixed Tobit model is rejected. Finally, the LR test of the Tobit model is significant, indicating that the random Tobit model passes the overall test. Therefore, using the random Tobit model for the regression calculation in this study is appropriate. The specific calculation results are shown in Table 9.
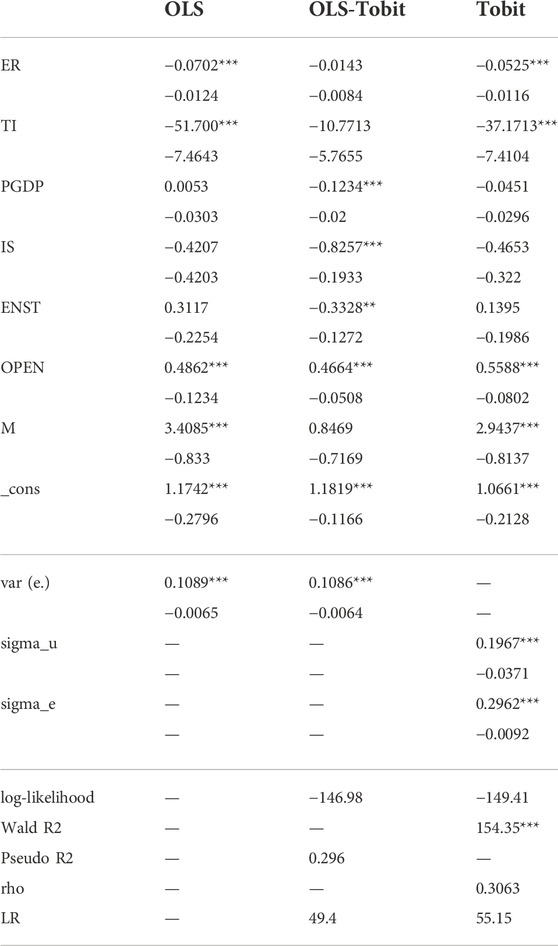
TABLE 9. Regression output of OLS, mixed OLS-Tobit, and random Tobit models.
4.2.3 Multicollinearity test of random TOBIT model
In time series data model, a multicollinearity test is usually performed, which is judged by the VIF of the value inflation factor. For example, if the panel data composed of provinces and time in this study are regarded as time series data, the VIF value can be calculated to judge whether the model in this study was multicollinearity. The data are shown in Table 10.

TABLE 10. Multicollinearity test of OLS regression model for time series.
In Table 10, the VIF values of some variables are more than 10, indicating that there is collinearity in the Tobit model.
However, the model data in this study are panel data, and VIF values are generally not calculated for random Tobit models. When using STATA software to calculate, if there is complete multicollinearity in the Tobit model, STATA software will automatically omit collinearity variables. For incomplete multicollinearity, we can ignore it if we do not care about the specific regression coefficients and only care about the ability of the whole equation to predict the explained variable, or we can ignore it if we care about the specific regression coefficients. However, multicollinearity does not affect the significance of the variable of interest (Stock and Watson, 2003). It is necessary to study whether multicollinearity causes insignificant results only if the coefficient of the core variable is insignificant.
As shown in the above description, incomplete multicollinearity exists in the Tobit model. When the core explanatory variables, environmental regulation (ER), technological innovation (TI), and cross-term (M), are put into the Tobit model together, the coefficients of these three variables are significant. When all the control variables are put into the model, the coefficients of several variables, including the core variables, are insignificant. However, when the ENST variable is removed, the coefficient significance of the core variable is greatly improved. When the IS variable is removed again, the coefficient significance of the core variable is little improved.
Therefore, according to Table 9 and the idea of the stepwise regression method, the insignificant variable ENST is deleted from the random Tobit model.
4.3 Analysis of results
According to the panel data of China’s EFF, we divide panel data into four different regions: the eastern, central, western, and national regions. The Tobit models of the four regions were analyzed and compared. The model running results are shown in Table 11.
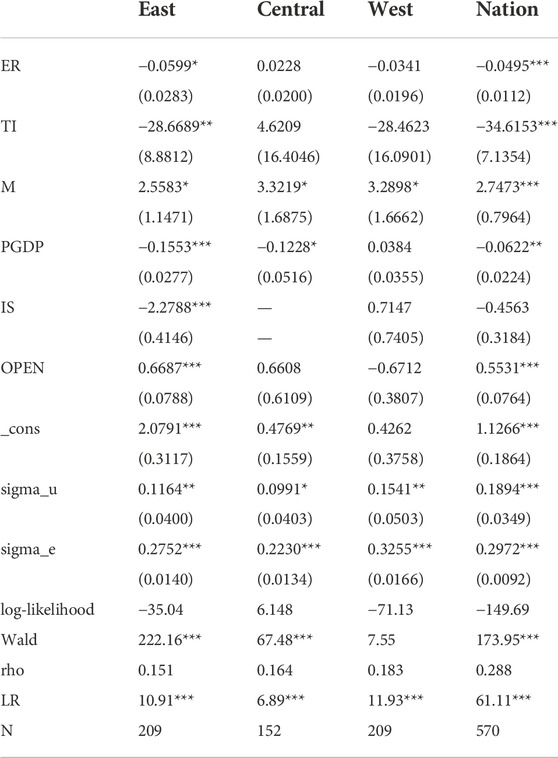
TABLE 11. Comparison of Tobit model results in the eastern, central, western, and national regions.
On the whole, the national and eastern models are very similar. In other words, the correlation coefficients of the explanatory variables of the national and the eastern models are inconsistent. However, the direction and significance of the correlation coefficients are the same except for “IS.” In order to avoid repetition, the following mainly introduces the eastern, central, and western models.
The overall comparison of the eastern, central, and western models shows that the direction, magnitude, and significance of their correlation coefficients are quite different. In the Tobit models of EFF, the LR test of the EFF model is passed in the eastern, central, and western regions, and the model is significant. However, the LR test failed in the central model. In the eastern and national models, the core explanatory variables ER, TI, and the cross-term (M) passed the significance test. In the central and the western models, only the crossover variable M is significant, except for ER and TI.
4.3.1 The EFF shows large and regular fluctuations in eastern, central, and western regions after 2008
From the trend of mean value change (Figure 1), there is the watershed on EFF change of the three regions in 2008. Before 2008, the EFF of the first three regions fluctuated slowly, and the order of their EFF from high to low was eastern, central, and western regions, respectively. This was in line with the general perception that the EFF of economically developed regions was higher than that of underdeveloped regions. After 2008, the EFF of the three regions fluctuated greatly. The EFF has declined significantly in the eastern and central regions, whereas EFF has risen to a certain extent and has become the most energy-efficient in the western region. It would be concluded that the EFF of economically developed regions was sometimes lower than that of underdeveloped regions.
The EFF in the national region is the overall average of the three regions, and its fluctuation pattern is similar to that of the eastern region. However, the decline in the EFF is smaller in the national region after 2008, mainly due to increased EFF in the western region.
4.3.2 Environmental regulation has a linear effect on EFF
According to the output results in Table 11, the coefficients of environmental regulation (ER) variables are −0.0599*, 0.0228, −0.0341, and −0.0495***, in the eastern, central, western, and national models, respectively. In general, environmental regulation has a significant negative impact on EFF in the national model, but the impact of environmental regulation on EFF varies among the three major regions.
Environmental regulation in the eastern region has a significant negative linear impact on EFF, which has a negative impact on EFF of “following costs.” The current environmental regulations are more inclined to end-of-production environmental pollution control in the eastern region. This kind of environmental pollution control expenditure will increase the production cost of enterprises and crowd out other technological investments in production while reducing corporate profits and EFF.
Environmental regulation in the central region has an insignificant positive impact of “innovation compensation” on EFF. Although the cost of pollution control has squeezed the production cost, it forces companies to innovate in energy-saving technologies and use the money invested in pollution control to reduce unwanted pollution emissions. Therefore, under the condition of constant expected output GDP, environmental regulation reduces the energy demand and improves EFF.
Environmental regulation has an insignificant negative impact on EFF in the western region. On the one hand, environmental regulation has a negative effect of “following costs” on EFF in the western region, and the pollution control costs squeeze the production costs, resulting in a decline in EFF. On the other hand, the western region is the source of China’s water resources, so it has stricter requirements for environmental protection. The increase in the state’s requirements for environmental regulation will inevitably make pollution control fees occupy more production costs of enterprises and reduce the EFF.
4.3.3 Technological innovation also has a linear effect on EFF
The results show that in the eastern, central, western, and national models, the coefficients of technological innovation (TI) are −28.6689**, 4.6209, −28.4623, and −34.6153***. Owing to the great impact of technological innovation on EFF, this also verified that technological progress is generally considered an important factor, or even a dominant factor, affecting EFF. For the whole country, increasing technological innovation is an important reason for the decline in EFF in China. However, the impact of technological innovation on EFF varies among the three regions.
Technological innovation has a significant negative impact on EFF in the eastern region. The main reasons are as follows. First, there is diversity in the direction of expenditures for technological innovation, and the investment in technological innovation in the eastern region is mostly used for the design of product quality, not efficiency in the production process increase, resulting in a decrease in EFF. Second, there are technological innovations with high value-added output and increased energy input in technological innovation. This type of innovation still brings high-profit returns after deducting the cost of increasing energy input. For example, the eastern region is an export-intensive area of China’s manufacturing industry, which faces fierce competition from overseas products. Companies may invest a lot of money in technological innovation with high-quality products and high returns to improve product competitiveness. Such technological innovations still require an increase in energy, resulting in a decrease in EFF.
Technological innovation has an insignificant positive impact on EFF in the central region because the technological innovation in the central region improves the use ratio of energy factors to non-energy factors in the production process, thereby improving EFF. For the central region, there is a large amount of old and high-energy-consuming equipment and energy is a scarce resource for them. Enterprises in the central region may be keen on technological innovations in energy conservation and emission reduction in the production process to reduce the emission of undesired pollutants in the production process. Under the condition that the expected output GDP remains unchanged, the enterprises in the central region reduce the energy demand, thereby improving EFF.
Technological innovation has an insignificant negative impact on EFF in the western region. There may be two reasons for this. First, there is diversity in the direction of expenditure on technological innovation. Some technological innovations may be mainly used for the design of product quality rather than the improvement of efficiency in the production process. Second, there is a shortage of scientific and technological talents in the western region. Although the western region invests a lot of money in technological innovation, technological innovation is finally implemented in the use of talents, and the shortage of scientific and technological talents may be the reason why this technological innovation is insignificant.
4.3.4 The cross-term has a significant positive linear relationship with EFF
The results show that in the models of the eastern, central, western, and national regions, the coefficients of the cross-terms (M) of environmental regulation and technological innovation on EFF are 2.5583*, 3.3219*, 3.2898*, and 2.7473***. On the whole, the cross-term has a significant positive impact on the national EFF. In terms of regions, the cross-terms also have significant positive impacts on the three major regions; however, only their coefficients are different.
The absolute value of the cross-term coefficient is greater than the coefficient of environmental regulation and smaller than the coefficient of technological innovation, which indicates that the casts of some technological innovation and some environmental regulations are invested in technological innovation of energy conservation and emission reduction. This conclusion is not consistent with that of Yang (2017) because, under the requirement of the synergy between technological innovation and environmental regulation, the enterprises in the three major regions have improved the proportion of production scarce factors through their own technological innovation, which has greatly improved the production process. Output GDP has increased substantially. At the same time, the increased profits of enterprises far exceed the costs incurred by environmental regulations, thereby improving EFF.
4.3.5 Control variables have different effects on EFF in different regions
The influence coefficients of economic development (PGDP) on EFF in the eastern, central, western, and national areas are −0.1553***, −0.1228*, 0.0384, and −0.0622**, respectively. In other words, the impact of economic development on EFF in the eastern, central, and national regions is significantly negative, indicating that the economic development of the three regions significantly contributed to the reduction of regional EFF. The impact on EFF in the western region is insignificant in the positive direction.
The influence coefficients of industrial structure (IS) on EFF in the eastern, central, western, and national regions are −2.2788***, −0.7147, and −0.4563, respectively. In other words, the impact of the industrial structure on EFF in the east is significantly negative but insignificant for regions excluding the east.
The influence coefficients of opening to the outside world (OPEN) on EFF of the eastern, central, western, and national regions are 0.6687***, 0.6608, −0.6712, and 0.5531***, respectively. In other words, the impacts of opening to the outside world on EFF in the eastern and national regions are significantly positive. The impact on EFF in the central region is insignificantly positive, which is insignificantly negative in the western region.
5 Conclusion and countermeasures
This study investigates the impact of environmental and technological innovations and their cross-terms on EFF using the undesired superefficiency SBM model and Tobit model. Its main conclusions are as follows:
(1) Using the energy panel data of 30 provinces in China from 2001 to 2019, the article constructs an undesired superefficiency SBM model that includes both desired and undesired outputs. The results of the model showed that the EFF of the three major regions in China was similar to an N-type trend and increased slowly before 2008, which was in line with the perception that the EFF of economically developed regions was higher than that of underdeveloped regions. From 2008 to 2009, EFF decreased rapidly and then slowly increased. The western region became the region with the highest EFF, so the EFF of economically developed regions was sometimes lower than that of less developed regions.
(2) The impact of environmental regulation on EFF in different regions varies greatly. Environmental regulation has a “following cost” effect on EFF in the eastern, western, and national regions, which has a significant negative impact, resulting in a decline in EFF. It has an “innovative compensation” effect on EFF in the central region and an insignificant positive impact, increasing the EFF.
(3) Technological innovation is the main factor affecting EFF, and its impact on EFF in different regions is also quite different. In the eastern and national regions, technological innovation has diversified expenditure directions, high added value, and high energy consumption, which has a significant negative impact on EFF of the eastern and national regions. Technological innovation has an insignificant positive impact on EFF in the central region. It also has an insignificant negative impact on the western region.
(4) The cross-term has a significant positive impact on EFF in the three regions and the national region, indicating that part of technological innovation and environmental regulation costs is invested in the production innovation to improve the EFF.
(5) The effects of control variables on EFF also differ in different regions. Economic development impacts on EFF in the eastern and central regions are significantly negative, the impact of industrial structure on EFF of the eastern region is significantly negative, and the impacts of opening in the eastern and national regions are significantly positive. In addition, the impacts of these variables on other regions are insignificant.
According to the above conclusions, in order to reduce environmental pollution, improve EFF, and make the economy of country grow steadily and continuously, the following suggestions are put forward:
(1) Formulating unified environmental regulations to encourage energy-saving production in various regions.
Due to the cost effect of environmental regulation, if enterprises consider reducing such undesirable output emissions as waste gas and wastewater in production, it will indeed increase the cost of enterprises. Therefore, in places with stricter environmental regulations, some enterprises withdraw from investment. In places where environmental regulations have been relaxed, some companies have increased production. In the long run, these will only divert China’s environmental pollution rather than reduce it. To this end, all parts of the country should formulate a unified environmental protection policy and treat all types of enterprises equally in implementing the policy. In addition, we must strictly check the approval of environmental regulations during the construction of enterprises and must not take the old road of pollution first and consider treatment later.
(2) Encouraging technological innovation of enterprises in energy-saving production.
Technological innovation has the state of improving and reducing EFF, which is the choice of enterprises in market competition. Enterprises need more advanced production technology and equipment for energy-saving production and emission reduction and more energy-saving production emissions, which will increase the production cost of enterprises. However, the government can reduce the cost of enterprises through policies such as financing support and tax relief, encourage enterprises to carry out clean production, encourage enterprises to introduce advanced energy-saving technologies, and encourage enterprises to introduce efficient, clean production equipment.
(3) Encouraging enterprises to use and innovate energy-saving technologies under environmental regulation and technological innovation
The government should design sound environmental regulation policies, and encourage enterprises to use energy-saving production technologies, and encourage enterprises to optimize resource allocation to improve their energy efficiency. On the one hand, the design and improvement of environmental regulation policies will stimulate enterprises to invest in clean technological innovation. On the other hand, the government will improve policies to encourage technological innovation and provide preferential tax policies for enterprises in the process of technological transformation and upgrading. Energy-saving production does indeed increase the cost of enterprises. However, the negative impact of “cost compliance” can still be partially or completely offset through the form of policy dividends to encourage enterprises to innovate in energy conservation and emission reduction. Therefore, through the innovation and application of green technology, the economic benefits of enterprises can be increased, and the sustainable development of enterprises can be led.
(4) Improve the mechanisms for public participation and environmental protection.
We will focus on training a highly skilled labor force and high-level R&D personnel in enterprises and encourage the innovation and use of new energy technologies in society. Furthermore, we will strengthen the media publicity on energy saving and emission reduction and encourage the public to monitor the pollution behavior of enterprises.
Data availability statement
The original contributions presented in the study are included in the article/supplementary material. Further inquiries can be directed to the corresponding author.
Author contributions
Conceptualization, validation, formal analysis, investigation, data curation, writing—original draft preparation, visualization, supervision, project administration, and funding acquisition: YC. Methodology, software, resources, writing—review and editing: TZ. All authors have read and agreed to the published version of the manuscript.
Funding
This paper was supported by the Social Science Fund of Jiangsu Province in China (19GLD010): Research on the optimization of rural spatial structure in Jiangsu Province under the rural revitalization strategy (19GLD010).
Conflict of interest
The authors declare that the research was conducted in the absence of any commercial or financial relationships that could be construed as a potential conflict of interest.
Publisher’s note
All claims expressed in this article are solely those of the authors and do not necessarily represent those of their affiliated organizations or those of the publisher, the editors, and the reviewers. Any product that may be evaluated in this article, or claim that may be made by its manufacturer, is not guaranteed or endorsed by the publisher.
References
Acemoglu, D. (2002). Directed technical change. Rev. Econ. Stud. 69 (4), 781–809. doi:10.1111/1467-937x.00226
Albrizio, S., Kozluk, T., and Zipperer, V. (2017). Environmental policies and productivity growth: Evidence across industries and firms. J. Environ. Econ. Manag. 81, 209–226. doi:10.1016/j.jeem.2016.06.002
Bala Subrahmanya, M. H., and Kumar, R. S. (2011). Technological innovations and energy intensity of machine tool SMEs in Bangalore: Do process innovations contribute to energy efficiencyc. Int. J. energy Technol. policy 7 (5-6), 519–536. doi:10.1504/ijetp.2011.045237
Bi, G. B., Song, W., Zhou, P., and Liang, L. (2014). Does environmental regulation affect energy efficiency in China's thermal power generation? Empirical evidence from a slacks-based DEA model. Energy Policy 66, 537–546. doi:10.1016/j.enpol.2013.10.056
Cagno, E., Ramirez-Portilla, A., and Trianni, A. (2015). Linking energy efficiency and innovation practices: Empirical evidence from the foundry sector. Energy Policy 83, 240–256. doi:10.1016/j.enpol.2015.02.023
Charnes, A., and Cooper, W. W. (1984). Preface to topics in data envelopment analysis. Ann. Oper. Res. 2 (1), 59–94. doi:10.1007/bf01874733
Chen, J. Q., Lian, X. Y., Ma, X. J., and Mi, J. (2022). China's total-factor energy efficiency calculation and its driving factors. Chin. Environ. Sci. 42 (5), 2453–2463.
Cheng, G. (2014). Data envelope analysis method was compared with the MaxDEA software. Intellectual Property Press, Cambridge, Massachusetts, US.
Costantini, V., and Crespi, F. (2008). Environmental regulation and the export dynamics of energy technologies. Ecol. Econ. 66 (2-3), 447–460. doi:10.1016/j.ecolecon.2007.10.008
Dai, J., and Fu, Y. M. (2020). Environmental regulation, the influence of industrial structure on energy efficiency. Agric. Resour. regionalization China 41 (9), 55–63.
Fan, D., and Wang, W. G. (2013). Analysis of regional total factor energy efficiency and energy conservation and emission reduction potential in China- -the SBM model based on undesired output. Pract. Underst. Math. 43 (7), 12–21.
Feng, B., and Wang, X. Q. (2015). Research on energy economic efficiency and energy environmental efficiency in — a two-stage analysis based on SBM model and panel Tobit model, J. Soc. Sci. Ed., 1, 14–22. doi:10.15918/j.jbitss1009-3370.2015.0103
Feng, C., and Wang, M. (2017). Analysis of energy efficiency and energy savings potential in China’s provincial industrial sectors. J. Clean. Prod. 164, 1531–1541. doi:10.1016/j.jclepro.2017.07.081
Herrerias, M. J., Cuadros, A., and Luo, D. (2016). Foreign versus indigenous innovation and energy intensity: Further research across Chinese regions. Appl. Energy 162, 1374–1384. doi:10.1016/j.apenergy.2015.01.042
Hu, Z. Y., Zhang, L. N., and Li, Y. (2019). Study on the effect of sewage levy on green total factor productivity — policy effect assessment based on GPSM. Financial Theory Pract. 6, 9–15. doi:10.16339/j.cnki.hdxbcjb.2019.06.046
Jaffe, A. B., and Stavins, R. N. (1995). Dynamic incentives of environmental regulations: The effects of alternative policy instruments on technology diffusion. J. Environ. Econ. Manag. 29 (3), S43–S63. doi:10.1006/jeem.1995.1060
Jia, J., and Zhang, Z. (2013). An empirical study on the collaborative development of technological innovation and energy efficiency in China's high-tech industry. China Popul. Resour. Environ. 23 (2), 36–42.
Jorgenson, D. W., and Wilcoxen, P. J. (1990). Environmental regulation and US economic growth. Rand J. Econ. 21, 314–340. doi:10.2307/2555426
Kemfert, C., and Truong, T. (2007). Impact assessment of emissions stabilization scenarios with and without induced technological change. Energy Policy 35 (11), 5337–5345. doi:10.1016/j.enpol.2006.01.033
Lee, J. J. (2010). Can we accelerate the improvement of energy efficiency in aircraft systems? Energy Convers. Manag. 51 (1), 189–196. doi:10.1016/j.enconman.2009.09.011
Levinsohn, J., and Petrin, A. (2003). Estimating production functions using inputs to control for unobservables. Rev. Econ. Stud. 70 (2), 317–341. doi:10.1111/1467-937x.00246
Li, S. J., and Li, C. Q. (2018). Revised design and application of total factor energy efficiency measurement. Quantitative Econ. Tech. Econ. Res. 9, 110–125. doi:10.13653/j.cnki.jqte.2018.09.007
Li, Y., Xu, X. F., and Zheng, Y. (2019). The impact of environmental regulation intensity on Industrial Total factor Energy Efficiency in China -Empirical study based on 30 provincial panel data from 2003 to 2016. Manag. Rev. 31 (12), 40–48. doi:10.14120/j.cnki.cn11-5057/f.2019.12.004
Liu, H., Chen, Y. D., Liu, T., and Lin, L. (2019). The river chief system and river pollution control in China: A case study of foshan. Water 11 (8), 1606. doi:10.3390/w11081606
Liu, W., Tong, J., and Xue, J. (2017). Industry heterogeneity, environmental regulation and industrial technology innovation. Sci. Res. Manag. 38 (5), 1–11. doi:10.19571/j.cnki.1000-2995.2017.05.001
Luo, H. J., Fan, R. G., and Luo, M. (2015). Measurement and evolution analysis of energy efficiency in China? Quantitative, Econ. Tech. Econ. Res. 5, 54–71. doi:10.13653/j.cnki.jqte.2015.05.004
Managi, S., and Kaneko, S. (2006). Economic growth and the environment in China: An empirical analysis of productivity. Int. J. Glob. Environ. Issues 6 (1), 89–133. doi:10.1504/ijgenvi.2006.009402
Managi, S., Opaluch, J. J., Jin, D., and Grigalunas, T. A. (2005). Environmental regulations and technological change in the offshore oil and gas industry. Land Econ. 81 (2), 303–319. doi:10.3368/le.81.2.303
Mandal, S. K. (2010). Do undesirable output and environmental regulation matter in energy efficiency analysis? Evidence from Indian cement industry. Energy Policy 38 (10), 6076–6083. doi:10.1016/j.enpol.2010.05.063
Mu, X. Z., Zhou, W. T., and Hu, G. W. (2022). Effect of different types of environmental regulations on total factor energy efficiency. J. Beijing Inst. Technol. Soc. Sci. Ed. 24 (3), 56–74. doi:10.15918/j.jbitss1009-3370.2022.3908
Patterson, M. G. (1996). What is energy efficiency?Concepts, indicators and methodological issues. Energy policy 24 (5), 377–390. doi:10.1016/0301-4215(96)00017-1
Peng, S. Y. (2020). Research on provincial total factor energy efficiency in China — Is based on a three-stage global UHSBM model. Econ. issues 1, 11–19. doi:10.16011/j.cnki.jjwt.2020.01.002
Porter, M. E. (1991). Towards a dynamic theory of strategy. Strateg. Manag. J. 12, 95–117. doi:10.1002/smj.4250121008
Ramirez-Portilla, A., Cagno, E., and Trianni, A. (2014). Is innovation an enabler of energy efficiency? An exploratory study of the foundry sector. Energy Procedia 61, 1191–1195. doi:10.1016/j.egypro.2014.11.1051
Shan, H. J. (2008). Re-Estimation of China's capital stock K: 1952-2006. Quantitative, Econ. Tech. Econ. Res. 25 (10), 17–31.
Sun, G. S., Yang, X. M., and Huang, Y. (2011). Research on the — Change trend, energy saving potential and influencing factors of energy efficiency (1987-2005) in China's industrial industry. China Soft Sci. 11, 29–39.
Tobin, J. (1958). Estimation of relationships for limited dependent variables. Econometrica 26, 24–36. doi:10.2307/1907382
Tone, K. (2004). Dealing with undesirable outputs in DEA: A slacks-based measure (SBM) approach. Toronto: Presentation At NAPW III, 44–45.
Tone, K. (2001). A slacks-based measure of efficiency in data envelopment analysis. Eur. J. Operational Res. 130, 498–509. doi:10.1016/s0377-2217(99)00407-5
Torrie, R. D., Stone, C., and Layzell, D. B. (2016). Understanding energy systems change in Canada: 1.Decomposition of total energy intensity. Energy Econ. 6, 101–106. doi:10.1016/j.eneco.2016.03.012
Trianni, A., Cagno, E., and Worrell, E. (2013). Innovation and adoption of energy efficient technologies: An exploratory analysis of Italian primary metal manufacturing SMEs. Energy Policy 61, 430–440. doi:10.1016/j.enpol.2013.06.034
Wang, H., and Wang, M. (2020). Effects of technological innovation on energy efficiency in China: Evidence from dynamic panel of 284 cities. Sci. Total Environ. 709, 136172. doi:10.1016/j.scitotenv.2019.136172
Wang, R . (2022). Fuzzy-based multicriteria analysis of the driving factors and solution strategies for green infrastructure development in China. Sustain. Cities Soc. 82, 103898. doi:10.1016/j.scs.2022.103898
Wang, Y. L., and Zhong, A. (2015). Empirical test of industrial industry environmental regulation, innovation capacity and total factor energy efficiency. Statistics Decision-making 15, 139–142. doi:10.13546/j.cnki.tjyjc.2015.15.038
Watanabe, M., and Tanaka, K. (2007). Efficiency analysis of Chinese industry: A directional distance function approach. Energy policy 35 (12), 6323–6331. doi:10.1016/j.enpol.2007.07.013
Wu, C. Q., Huang, L., and Wen, C. H. (2017). Research on technology innovation efficiency and its impact factors in the yangtze river economic belt. China Soft Sci. 5, 160–170.
Yang, X. M., Tian, Y. X., and Ma, N. (2016). Energy total factor efficiency and its influencing factors under environmental constraints in China. China's Popul. Resour. Environ. 26 (12), 147–156.
Yang, Z. J., and Zhu, G. L. (2017). Technological innovation, environmental regulation and energy efficiency - based on China interprovincial panel data. Res. Dev. Manag. 29 (4), 23–32. doi:10.13581/j.cnki.rdm.2017.04.001
Ye, H. Y., and Li, Y. G. (2022). Environmental regulation, biased technological progress and energy efficiency. East China Econ. Manag. 36 (04), 97–106. doi:10.19629/j.cnki.34-1014/f.210621011
Zhang, J., Wu, G. Y., and Zhang, J. P. (2004). Estimation of interprovincial material capital stock in China: 1952- -2000. Econ. Res. 10, 35–44.
Zhang, N., and Zhou, M. (2020). The inequality of city-level energy efficiency for China. J. Environ. Manag. 255, 109843. doi:10.1016/j.jenvman.2019.109843
Zhang, Q. Q., Zhang, R., and Zhang, Y. Y. (2019). The impact of FDI on environmental quality under environmental regulation — Is based on a comparative study of different industry groups. Bus. Res. 5, 61–68. doi:10.13902/j.cnki.syyj.2019.05.008
Zhang, R., Chen, X., and Sun, X. L. (2021). Environmental regulation, economic diversity and energy strength — empirical analysis based on interprovincial panel data. Bus. Res. 01, 24–31. doi:10.13902/j.cnki.syyj.2021.01.004
Keywords: energy efficiency, technological innovation, environmental regulation, undesirable superefficiency SBM model, Tobit model
Citation: Chen Y and Zhao T (2022) Exploring the role of technology innovation and environmental regulation in energy efficiency. Front. Environ. Sci. 10:1056877. doi: 10.3389/fenvs.2022.1056877
Received: 29 September 2022; Accepted: 02 November 2022;
Published: 29 November 2022.
Edited by:
Faik Bilgili, Erciyes University, TurkeyReviewed by:
Luigi Aldieri, University of Salerno, ItalyXin Zhao, Anhui University of Finance and Economics, China
Copyright © 2022 Chen and Zhao. This is an open-access article distributed under the terms of the Creative Commons Attribution License (CC BY). The use, distribution or reproduction in other forums is permitted, provided the original author(s) and the copyright owner(s) are credited and that the original publication in this journal is cited, in accordance with accepted academic practice. No use, distribution or reproduction is permitted which does not comply with these terms.
*Correspondence: Tong Zhao, MjAwNTA1MUBuanh6Yy5lZHUuY24=