 Xi Chen
 Lirong Xing2
 Kai Wang
95% of researchers rate our articles as excellent or good
Learn more about the work of our research integrity team to safeguard the quality of each article we publish.
Find out more
ORIGINAL RESEARCH article
Front. Environ. Sci. , 16 January 2023
Sec. Environmental Economics and Management
Volume 10 - 2022 | https://doi.org/10.3389/fenvs.2022.1056054
Currently, China mainly adopts the waste treatment model of “household sorting, village collection, town transfer and county disposal.” Determining the spatial and temporal distribution of China’s county solid waste harmless disposal capacity and formulating strategies according to local conditions are of great significance in promoting the construction of beautiful villages in China and realizing the Beautiful China strategy. This paper explores the spatial and temporal evolution characteristics of county solid waste harmless disposal capacity by selecting relevant data from 27 provinces in China from 2006 to 2020, and adopts the Dagum Gini coefficient method to measure the spatial gap of it. In addition, this paper empirically analyses the drivers affecting county solid waste harmless disposal capacity using the spatial Durbin model (SDM). The main conclusions are as follows: 1) In terms of time, county solid waste harmless disposal capacity in China as a whole shows a year-by-year increasing trend, especially after 2018 when the growth rate is faster. 2) In terms of spatial patterns, the solid waste harmless disposal capacity of coastal areas is generally higher than that of inland areas, and the distribution of provinces with low and middle levels of solid waste harmless disposal capacity is characterized by concentrated contiguity. From the perspective of spatial agglomeration, the characteristics of spatial agglomeration in the north are gradually becoming more pronounced, while those in the south are not significant. From the trajectory of the evolution of the spatial center of gravity, the center of gravity of county solid waste harmless disposal capacity as a whole shows a northeast, then northwest, then northeast movement, and the speed of “northward expansion” is greater than the speed of “eastward expansion”. 3) The results of the Dagum Gini coefficient and its decomposition show that the northeast has the smallest average annual rate of change in the Gini coefficient. The reduction of the within-group gap is an important driver towards equilibrium. The contribution of hypervariable density is decreasing year by year. 4) The number of harmless disposal plants, GDP per person, population urbanization, the number of township waste transfer stations and county waste disposal fixed asset investment are important drivers of county waste harmless disposal capacity. Findings provide helpful insights into optimizing rural habitat and promoting the comprehensive transformation of China’s county development.
China’s urbanization has undergone strategic adjustments since entering the new era, and county urbanization will enter a new stage of development. In particular, the General Office of the State Council of China issued the Opinions on Promoting Urbanization with Counties as an Important Carrier in May 2022, emphasizing the need to vigorously develop the urbanization of counties, which means that county urbanization will become an important form of urbanization (General Office of the State Council, 2022). According to data from the China Urban and Rural Construction Statistical Yearbook, China’s county urbanization rate exceeded 20% in 2012 and had reached 23.59% by the end of 2020, showing an increasing trend year by year. However, as towns and cities continue to grow in size, the conflict between county solid waste and environmental protection is becoming more and more pronounced.
It was found that rapidly urbanizing developing countries are facing serious solid waste treatment problems (Al-Khatib et al., 2010). China was already the world’s largest producer of waste as early as 2004. The amount of county seat solid waste generated in China was .6306, reaching .68 × 108 tons in 2020, with an average annual growth rate of .56% (Ministry of Housing and Urban-Rural Development, 2020). If solid waste is not harmlessly disposed of properly, the waste undergoes a series of chemical reactions and fermentation, which can produce toxic gases and liquids that may contaminate groundwater sources and soil (Wang et al., 2019). These not only destroyed the habitat, affected the physical and mental health of residents, but also seriously threatened the national ecological security. Especially during the current period of high prevalence of infectious diseases such as COVID-19, the need and importance of public health governance cannot be overstated.
Currently, the Chinese government mainly adopts the waste treatment model of “household sorting, village collection, town transfer and county disposal”. From the point of view of terminal disposal, the county seat is responsible for waste disposal. Therefore, the county solid waste harmless disposal is particularly important and there is an urgent need to improve the county solid waste harmless disposal capacity of China. Thus, how has the development of county solid waste harmless disposal capacity in China progressed? What is the spatial and temporal evolution pattern? What are the main factors affecting the county solid waste harmless disposal capacity in China? What is the effect and significance of their influence? This paper will provide a detailed analysis and answers to these questions.
Current research on waste treatment by domestic and international scholars has yielded some results. In terms of study regions, the majority of scholars have focused on the provincial and urban characteristics of solid waste (Jiang et al., 2009; Kang et al., 2020; Khan et al., 2021), but few have studied the spatial and temporal characteristics of solid waste at the county level. In terms of research methods, statistical descriptive analysis is the main method (Wei et al., 1997; Kang et al., 2020; Guo et al., 2021), and few scholars have considered the role of spatial geographical factors in model regressions. From a research perspective, there are more examinations from a cost-benefit perspective (Yaman, 2012; Kinnaman, 2014; Di Foggia and Beccarello, 2020), and few scholars have conducted research from a spatial-geographical perspective. From the perspective of factors influencing individuals, scholars have mainly examined the impact of internal and external factors on individual waste treatment behavior (willingness to treat waste and level of waste treatment) such as environmental concern (Stern et al., 1995), waste governance cognition (Zeng et al., 2016), environmental governance perceptions (Wang and Hao, 2020), economic incentives (Xu et al., 2018), transportation conditions (Liu and Huang, 2014), fiscal decentralization (Ma et al., 2021), environmental advocacy and monitoring (Li X. R. et al., 2019). In addition, some scholars introduce initiatives and experiences of waste treatment in other countries (Lv and Du, 2016; Yang et al., 2019), with a view to providing methodological references for urban waste treatment in China.
From the above literature, we can find that scholars have made certain academic achievements in the field of waste treatment, which provide beneficial insights and references for this research, but there are still shortcomings. First, previous studies have taken provinces or cities as the object of study, with simple descriptive statistical analysis as the main research method, lacking the exploration of empirical analysis at the county level. Second, the existing literature mainly examines the problem of waste sorting at the individual level, with few studies conducted at the end of waste disposal. Third, few scholars have taken spatial geography into account in previous studies on the factors influencing solid waste harmless disposal capacity, which may lead to biased empirical estimates. Therefore, this paper not only complements the study of the issue of county solid waste harmless disposal from the perspective of spatial and temporal evolution, but also adopts a spatial econometric model to empirically investigate the factors that may affect the county solid waste harmless disposal capacity.
This study includes five parts. The first part is an introduction that describes the background, problem and significance of the study. Data sources, method and variables in this study are described in the second part. In the third part, this paper mainly analyzes the spatial and temporal evolution and spatial correlation of county solid waste harmless disposal capacity. The fourth part is to explore the driving factors of the county solid waste harmless disposal capacity. The fifth part is the main research conclusions and policy recommendations.
China has adjusted the statistical caliber of environmental-related indicators since 2006. Combined with the availability of data, this paper collects statistics for 27 provinces in China for the period 2006–2020. It needs to be noted that Beijing, Shanghai, Tianjin, Hong Kong, Macau, Taiwan and Tibet are not included as samples in the analysis due to missing data. The data are obtained from the China Urban and Rural Construction Statistical Yearbook and the China Statistical Yearbook.
The main methods of measuring spatial disequilibrium are the coefficient of variation, the Thayer index and the Gini coefficient. They are also often decomposed by source or region, the most common being the Thayer index. However, the Thiel index only takes into account the differences in subsamples, but not the distribution of the subsamples (Dagum, 1997). This paper cites the Gini coefficient and its decomposition method proposed by Mukherjee and Shorrocks (Mookherjee and Shorrocks, 1982). The formula for calculating the Gini coefficient is as follows:
In Eq. 1, G represents the total Gini coefficient for the county. n represents the number of samples in the group. μ represents the mean value of the samples within the group. yi and yj represent the solid waste harmless disposal capacity of districts i and j respectively. The formula for the decomposition of the Gini coefficient is as follows:
Further simplifying the formula is as follows:
In Eq. 2 and Eq. 3, G represents the total county Gini coefficient which measures the overall spatially uneven degree of county solid waste harmless disposal capacity in China. Pm and Pn denote the ratio of the number of samples in the mth and nth groups to the full sample size. λm and λn denote the ratio of the average county solid waste harmless disposal capacity of group m and group n to the average county solid waste harmless disposal capacity of the whole sample. Gm is the Gini coefficient for group m. Gw represents intra-regional disparities. Gb represents the inter-regional gap. R is the hypervariable density, reflecting the interaction effects between different groups due to overlap.
Exploratory spatial data analysis methods can identify the presence or absence of spatial agglomeration, including global spatial autocorrelation and local spatial autocorrelation (Anselin et al., 2006).
①Global spatial autocorrelation is measured using Moran’s index (Moran’s I) to judge the extent to which geographic phenomena or attribute values across the region are spatially dependent at the spatial scale. The commonly used formula is as follows (Sanjeev et al., 2007):
②Local spatial autocorrelation is used to describe how similar an attribute is between a spatial unit and its neighboring regions, presenting how the degree of spatial dependence varies with location. Local Moran’s I and LISA aggregation charts are often used in academia to study local spatial distribution patterns. The calculation formula is as follows:
In Eq. 4 and Eq. 5, n represents the number of subjects studied. Xi represents the observed values.
In geographical studies, spatial center of gravity analysis reflects the spatial and temporal shifts in the center of gravity of a matter. The center of gravity of solid waste harmless disposal capacity in a county is the point at which the development layout of solid waste harmless disposal capacity in a county reaches equilibrium in a regional space in a certain period of time. In other words, if the solid waste harmless disposal capacity of a region grows rapidly, given constant conditions, the center of gravity shifts in the direction of that region. If the movement distance is longer, it means that the contribution to the solid waste harmless disposal capacity of the region is stronger. The formula for calculating the center of gravity in space is as follows (Li Z. et al., 2019):
In Eq. 6, Xt and Yt represent the longitude and latitude of the geographical location where the center of gravity of county solid waste harmless disposal capacity is located in year t, respectively. Xi and Yi represent the central coordinates (latitude and longitude) of the i province respectively. Mit represents the value of county solid waste harmless disposal capacity of the i province in year t. N represents the number of provinces. The equation for the spatial center of gravity shift distance is as follows:
In Eq. 7, D represents the shift in distance between the center of gravity of county solid waste harmless disposal capacity. Q is the value of the spherical latitude and longitude coordinates converted to plane distance, taken as a constant 111.13. (Xi—Xj) and (Yi—Yj) represent the latitude and longitude coordinates of the center of gravity of the county’s solid waste harmless disposal capacity in year i and year j respectively.
If the county solid waste harmless disposal capacity has spatial autocorrelation characteristics, a spatial econometric model should be constructed. The main common spatial econometric models are the spatial error model (SEM), the spatial lag model (SLM) and the spatial Durbin model (SDM). If the LR test and Wald test are passed, a spatial Durbin model (SDM) should be constructed. The SDM model not only includes the spatial error factors of the SLM model and SEM model but also incorporates the explanatory variables into the regression model at the same time, which focuses on the spatial correlation of the independent and dependent variables (Hao et al., 2021). At the same time, the SDM model also considered time and individual fixed effects (Yang et al., 2022). Drawing on the ideas of LeSage and Pace (2009), the Spatial Durbin Model (SDM) is constructed as follows:
In Eq. 8, Y represents the dependent variable. X represents the explanatory variable.
In Eq. 8, If
In Eq. 9, Y is the N*1 dimensional dependent variable. I is an N*1 dimensional unit matrix. C is a constant term.
In Eq. 10,
It should be clarified that the county solid waste harmless disposal capacity in this paper adopts the average daily county solid waste harmless disposal capacity as a measure, and it is measured in tons per day. There are more factors affecting county solid waste harmless disposal capacity. Drawing on the studies of related scholars (Chu et al., 2016; Spoann et al., 2018; Chu et al., 2020; Paulauskaite-Taraseviciene et al., 2022), this paper focuses on macro factors such as the construction of public facilities, regional economic development, population density, urbanization and investment in fixed assets for waste disposal.
1) Public facilities construction. The improvement of county solid waste harmless disposal capacity requires local governments to implement policy instruments to improve supporting facilities and make the public more actively involved in waste management. In this paper, the number of harmless disposal plants and sanitation vehicles at the county are selected to reflect the construction of public facilities in each province. The number of sanitation vehicles is expressed as the total number of sanitation vehicles in the county seat and sanitation vehicles in the townships. In addition, considering that a part of solid waste disposal in the county is also derived from rural domestic waste, and that waste transfer stations in townships play an important role between rural areas and the county. Therefore, the number of transfer stations in townships is also included in the analysis of this paper.
2) Economic development. The county solid waste disposal industry in China is an important part of the public sector and funding is an important factor in the development of an industry. The level of economic development within a region not only impacts the spending capacity of residents, but can also be directly related to the proportion of funding spent on solid waste disposal. Therefore, this paper adopts GDP per person to measure the level of economic development of each province.
3) Population density. China has made the level of local solid waste treatment a part of the performance assessment of government officials, which is directly related to their promotion. In terms of solid waste treatment, the central government pays great attention to the promotion of this work. Studies show that the population density of a jurisdiction is closely linked to the adoption of government policies, with higher population density implying a greater need for government governance (Kearney et al., 2000), and a greater likelihood of a focus on building local solid waste disposal capacity. In addition, in densely populated areas, domestic waste collection services can be centralized, reducing the average cost of service provision and making it more likely that domestic waste will be generated (Johnstone and Labonne, 2004). However, some studies have come to the opposite conclusion. In densely populated areas where land resources are often scarce, the costs levied for waste disposal are higher, resulting in lower per capita domestic waste production (Mazzanti et al., 2008). It can be seen that the impact of population density on regional solid waste disposal capacity has not yet reached a uniform conclusion and needs to be further tested.
4) Population urbanization. At present, urbanization in China is undergoing a strategic restructuring. The central government is using counties as the fulcrum of its rural revitalization strategy, with the aim of realizing the transfer of rural population to counties and pursuing the development of county urbanization. This initiative places greater demands on the county’s ability to provide public services and infrastructure. In terms of waste treatment, it is shown that urbanization development, in addition to economic development and rising standards of living, can also increase the volume and complexity of waste production (Grazhdani, 2016), which in turn affects county solid waste disposal capacity.
5) Waste disposal fixed asset investment. In recent years, the Chinese government has attached great importance to environmental treatment in order to build a beautiful countryside and a beautiful China. From the central to the local levels, various laws and regulations have been introduced to prevent environmental pollution. At the same time, the government has also increased its financial investment in environmental pollution treatment and harmless disposal of solid waste. Therefore, this paper chooses the proportion of fixed asset investment in waste treatment in county seats to measure the degree of policy importance attached to harmless waste treatment in each province. Table 1 shows the description and statistics of the relevant variables.
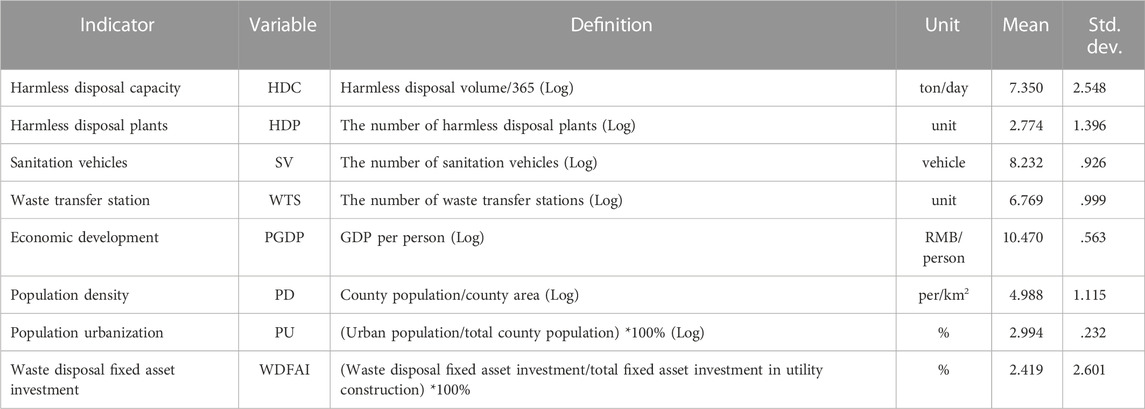
TABLE 1. Variable descriptive statistics.
China’s economic regions are divided into eastern, middle, western and northeastern regions depending on the level of socio-economic development (National Bureau of Statistics of China, 2011). Figure 1 shows that China’s county solid waste harmless disposal capacity as a whole tends to increase year by year from 2006 to 2020. From a national perspective, it rose from 1.50 × 10⁴ tons/day in 2006 to 3.57 × 10⁵ tons/day in 2020, a cumulative growth of 34.20 × 10⁴ tons/day, which represents an increase of 22.82%.
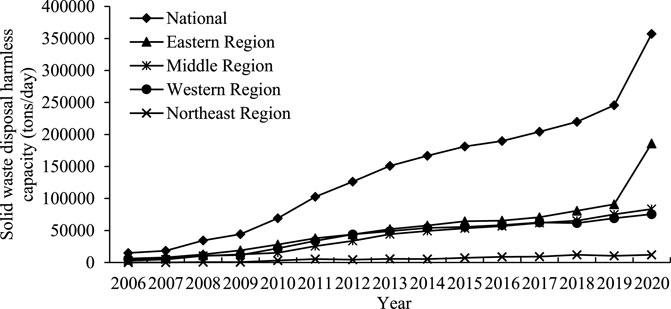
FIGURE 1. Chronological evolution of county solid waste harmless disposal capacity in China from 2006 to 2020.
From a regional economic perspective, the eastern, middle, western and northeastern regions of China also show an overall increasing trend. The eastern region has historically ranked first in county solid waste harmless disposal capacity and fourth in the northeastern. The western was higher than the middle Region from 2006 to 2018 and the middle Region started to overtake the western after 2018 to rank second. Eastern, middle, western and northeast rose from .62 × 104 tons/day, .30 × 104 tons/day, .57 × 104 tons/day and 170 tons/day in 2006 to 18.61 × 10⁴ tons/day, 8.36 × 10⁴ tons/day, 7.55 × 10⁴ tons/day and 1.20 × 10⁴ tons/day in 2020 respectively, with cumulative growth of 17.99 × 10⁴ tons/day, 8.06 × 10⁴ tons/day, 6.99 × 10⁴ tons/day and 1.19 × 10⁴ tons/day, representing increases of 29.15%, 27.14%, 12.29% and 69.76% respectively. It is worth noting that solid waste harmless disposal capacity in China’s counties is growing at a faster rate in 2019–2020. This indicates that the Three-Year Action Programme for Rural Habitat Improvement (2018–2020) pursued by the Chinese government is remarkably effective. In addition, the disparity between the eastern, middle, western and northeastern regions is closely related to their own level of economic development. In general, the better the level of economic development, the higher the fiscal revenue. The county solid waste harmless disposal facilities construction mainly comes from the local government’s financial expenditure.
In order to reflect the spatial pattern characteristics, this paper takes 2006 as the base period and adopts the natural break method to classify China’s county solid waste harmless disposal capacity in 2006, 2010, 2015 and 2020 as low level (<9,571 tons/day), medium level (9,571–25,379 tons/day) and high level (>25,379 tons/day) respectively. The ArcGIS 10.7 software was used to create the maps and the results are shown in Figure 2.

FIGURE 2. Spatial distribution of county solid waste harmless disposal capacity by province in China (from (A–D)).
Specifically, county solid waste harmless disposal capacity in all Chinese provinces was at a low level in 2006. Compared to 2006, solid waste harmless disposal capacity has increased in 2010, with the vast majority of provinces still at a low level and only Henan Province stepping into the middle level. In 2015, there were six provinces with a middle level of solid waste harmless disposal capacity, namely Henan, Hebei, Shandong, Jiangsu, Zhejiang and Yunnan. In 2020, the county solid waste harmless disposal capacity of Hebei stepped into the high level. In addition, 10 other provinces reached the middle level, namely Henan, Shandong, Jiangsu, Anhui, Hunan, Jiangxi, Zhejiang, Fujian, Guangdong and Yunnan.
Overall, the spatial distribution of county solid waste harmless disposal capacity in China’s provinces has two main characteristics. First, there are significant regional differences. The overall capacity for solid waste harmless disposal is higher in coastal areas than inland areas. Second, the spatial clustering feature is significant. The distribution of provinces with low and middle levels of solid waste harmless disposal capacity shows concentrated and contiguous characteristics.
Adopting the Dagum Gini coefficient and its decomposition method, the results of measuring the spatial equilibrium state of the county solid waste harmless disposal capacity of the whole China and the four regions are shown in Table 2.
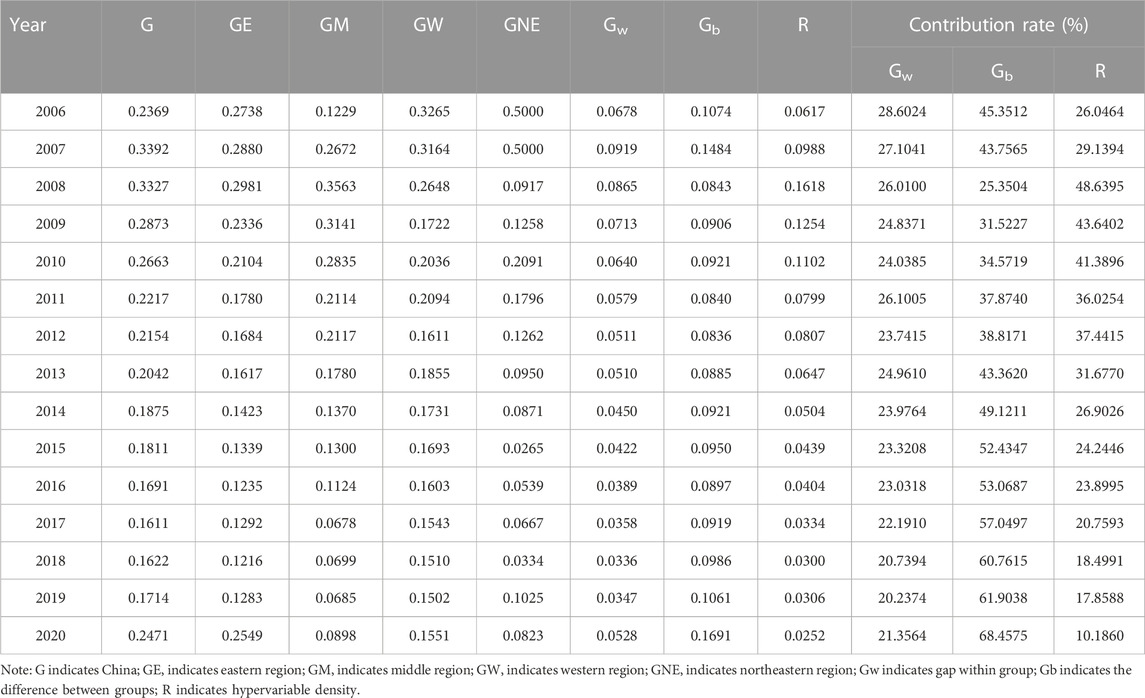
TABLE 2. Decomposition of the spatial gap in China’s county solid waste harmless disposal capacity and contribution rates.
First, although the Gini coefficient of China’s county solid waste disposal capacity rebounded slightly from 2007 to 2008, it still showed a downward trend overall, indicating that the differences between regions are narrowing. The most pronounced decline was seen in the northeastern, where the Gini coefficient grew at an average annual rate of -12.09%, compared to -.51%, -2.22% and -5.18% in the eastern, middle and Western regions respectively. This suggests that the northeastern is equalizing at a higher rate than the eastern and middle. Comparing the Gini coefficients of the four regions, it can be found that the mean value of the Gini coefficient of the northeastern region is .1520 in the study period, which is much lower than that of the eastern region (.1897), the middle region (.1747) and the western region (.1969). This indicates that the balance of county domestic waste disposal capacity is higher in the northeastern than in the other three regions. The main reason for it is that compared to the other three regions, there are only three provinces in the northeast regions, and the three provinces have basically the same level of economic development and population outflow.
Second, the Gini coefficient of county solid waste harmless disposal capacity within the four regional groups shows a fluctuating decreasing trend, with an average annual growth rate of -1.77%, while the average annual growth rate of the inter-group Gini coefficient is 3.30%. It can be tentatively concluded that, among the four regions, the reduction of disparities within the group is an important motivation for the move towards a balanced county solid waste harmless disposal capacity. Comparing the contribution of the within-group gap and the between-group gap, it can be seen that the between-group gap is the main source of uneven solid waste disposal capacity in the four regions, while the contribution of the between-group gap has also been increasing year by year since 2008. The main reason for it is that after 2008, the gradual liberalization of the household registration system and the widening income gap between urban and rural areas have led to a gradual tide of population movement in China. This was manifested by the influx of many people to work in economically developed regions, such as the eastern part of the country, which resulted in a widening disparity between the four regions.
Third, the contribution of hypervariable density has declined annually since 2008, being higher than the within-group gap from 2007 to 2016, lower than the between-group gap after 2011, and lower than both the within-group and between-group gaps after 2016. This indicates a decreasing trend in the degree of staggering of the county solid waste harmless disposal capacity between the four regions year by year. This paper considers the following as possible reasons. First, the degree of economic development in all regions of China has increased and regional differences are gradually narrowing. Second, with the introduction of the national policy of returning to one’s hometown to start a business and find employment, there has been a wave of population movement back to one’s hometown in China. Third, the country has strengthened its special action on domestic waste management, which is gradually attracting the attention of local governments. Finally, the outbreak of COVID-19 after 2019 has lowered the population movement between regions even more.
To further validate the spatially relevant characteristics of county solid waste disposal capacity in China, this paper uses GeoDa1.12 software to measure the global Moran’s I values of county solid waste harmless disposal capacity from 2006 to 2020.
Table 3 shows that from 2006 to 2019, county solid waste harmless disposal capacity as a whole shows global spatial positive autocorrelation characteristics, and the global Moran’s I values do not fluctuate much overall. In addition, the Moran’s I of county solid waste harmless disposal capacity declines year by year from 2014 to 2020, especially declining at a faster rate from 2018 to 2020, even to a negative Moran’s I value in 2020. This is closely linked to the introduction of a solid waste treatment policy by the Chinese government. In particular, the Three-Year Action Plan for the Improvement of Rural Habitat Environment (2018–2020) implemented by the government has set higher requirements for the treatment of rural domestic waste, forcing provinces to continuously strengthen the construction of county solid waste harmless disposal capacity. For example, sanitary landfills, incineration plants and other harmless disposal terminals are placing higher demands in terms of quantity and disposal capacity. The spatial distribution of county solid waste harmless disposal capacity is beginning to show a scattered character as a result of the strengthening of solid waste harmless disposal facilities around the region.
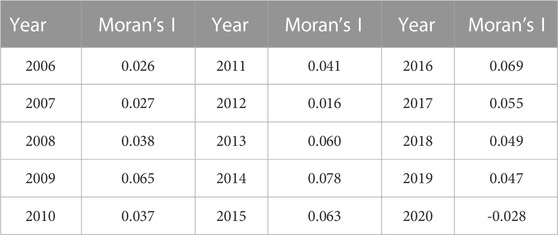
TABLE 3. Global Moran’s I (2006–2020).
The global Moran’s I can only observe the spatial autocorrelation characteristics of the whole, but not the correlation between the spaces within it. In other words, it cannot present the spatial clustering characteristics of county solid waste harmless disposal capacity between provinces. Therefore, further analysis of the local Moran’s I is necessary. This paper uses ArcGIS 10.7 software to draw a LISA agglomeration map of county solid waste harmless disposal capacity in China (Figure 3).
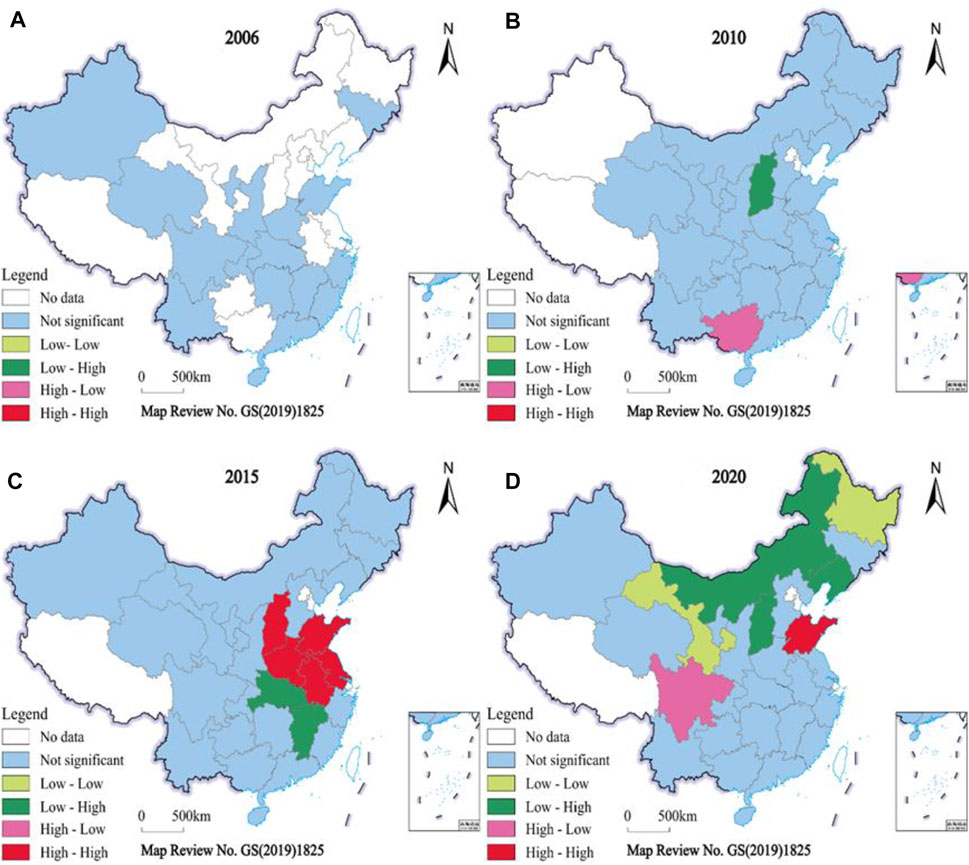
FIGURE 3. LISA agglomeration map of county solid waste harmless disposal capacity in China (from (A–D)).
Figure 3 shows that there are only 17 provinces as a study area in 2006, with no spatial clustering characteristics. In 2010, there were 26 provinces as the study area, with the “high-low” agglomeration feature in Guangxi and the “low-high” agglomeration feature in Shanxi. In 2015, there were 27 provinces as the study area, with the “high-high” agglomeration feature mainly concentrated in Shanxi, Henan, Shandong, Jiangsu and Anhui, and the “low-high” agglomeration feature mainly concentrated in Hubei and Jiangxi. The “low-high” clustering characteristics were mainly concentrated in Hubei and Jiangxi. In 2020, the “high-high” agglomeration feature was distributed in Shandong, the “high-low” agglomeration feature was distributed in Sichuan, the “low -high” agglomeration was mainly distributed in Inner Mongolia, Shanxi and Liaoning, and “low-low” agglomeration is distributed in Heilongjiang and Gansu. Overall, spatial agglomeration is gradually becoming more pronounced in northern China and is not significant in the south.
Based on the trajectory of the center of gravity, Figure 4 shows that the center of gravity of county solid waste harmless disposal capacity as a whole shows a northeastern, then northwest, then northeast movement, and the speed of “northward expansion” is greater than the speed of “eastward expansion”. First, the center of gravity moves in a latitude and longitude range of 111.97°E-113.65°E and 30.27°N-34.40°N. It can be seen that the north-south movement distance is greater than the east-west, and it shifts 495.49 km to the northeast. In other words, the speed of “northward expansion” is greater than the speed of “eastward expansion.”
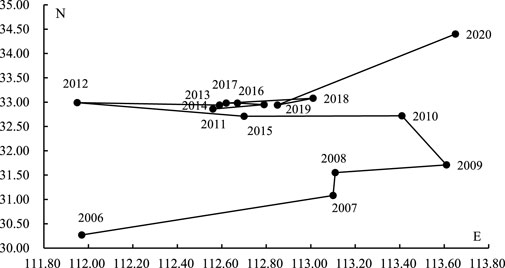
FIGURE 4. Trajectory of the center of gravity movement of county solid waste harmless disposal capacity in China (2006–2020).
In addition, this paper divides the center of gravity shift into three phases based on the trend of center of gravity shift. The first phase (2006–2009) shifts towards the northeast. The movement distance is 242.54 km and the movement speed is 80.85 km/year, indicating that the provinces in the northeast direction have a faster growth rate of county solid waste harmless disposal capacity, resulting in the center of gravity shifting in the northeast. The second phase (2009–2012) shifts towards the northwestern. The movement distance is 232.95 km and the speed of movement is 77.65 km/year, indicating that the provinces in the northwest direction have a higher growth rate in county solid waste disposal capacity, resulting in the center of gravity shifting in the northwest. The third phase (2012–2020) shifts towards the northeastern. The movement distance is 245.45 km and the movement speed is 30.68 km/year, with the fastest movement speed (185.01 km/year) from 2019 to 2020. This indicates that the provinces in the northeast direction have a faster growth rate of county solid waste harmless disposal capacity, resulting in the center of gravity shifting in the northeast.
The previous analysis finds that the waste harmless disposal capacity shows significant spatial autocorrelation. Therefore, it is necessary to take the geospatial factor into account when studying the factors influencing waste harmless disposal capacity. Because the use of spatial econometric models can reduce the bias of regression results. Currently, the commonly used spatial econometric models are the Spatial Error Model (SEM), the Spatial Lag Model (SLM) and the Spatial Durbin Model (SDM).
Table 4 shows that the LM test found the Moran’s I to be significantly positive and that the LM tests for both the lag and error terms were significant at the 1% statistical level, indicating the need for the spatial econometric model to be used for analysis. In addition, the LR test, LM test and Wald test are significantly positive at least above the 5% statistical level, indicating that the SDM cannot be reduced to SLM or SEM (Anselin et al., 2006; Lesage and Pace, 2009; Elhorst, 2014). Therefore, the SDM is more appropriate to be chosen. Finally, the Hausman test rejects the original hypothesis of a random effect at the 1% statistical level. To sum up, the spatial panel Durbin model (SPDM) with fixed effects is ultimately chosen to conduct the study in this paper.
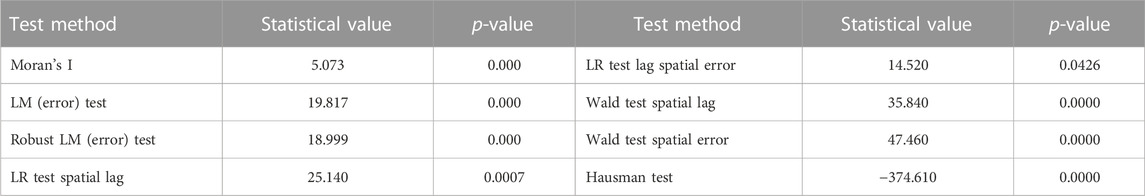
TABLE 4. Spatial model tests.
Table 5 shows the results of the SPDM estimates. Table 5 shows that the spatial autoregressive coefficient rho is significantly positive at the 1% level, which indicates that there is a significant spatial positive autocorrelation characteristic of county solid waste harmless disposal capacity. This further illustrates the rationality of introducing geospatial factors into the analysis. As the regression coefficients of the explanatory variables in the spatial econometric model do not directly reflect the extent of the effect on waste disposal capacity. Therefore, we need to be decomposed into direct, indirect and total effects by solving for the partial differential (Lesage and Pace, 2009). The estimated results are shown in Table 6.
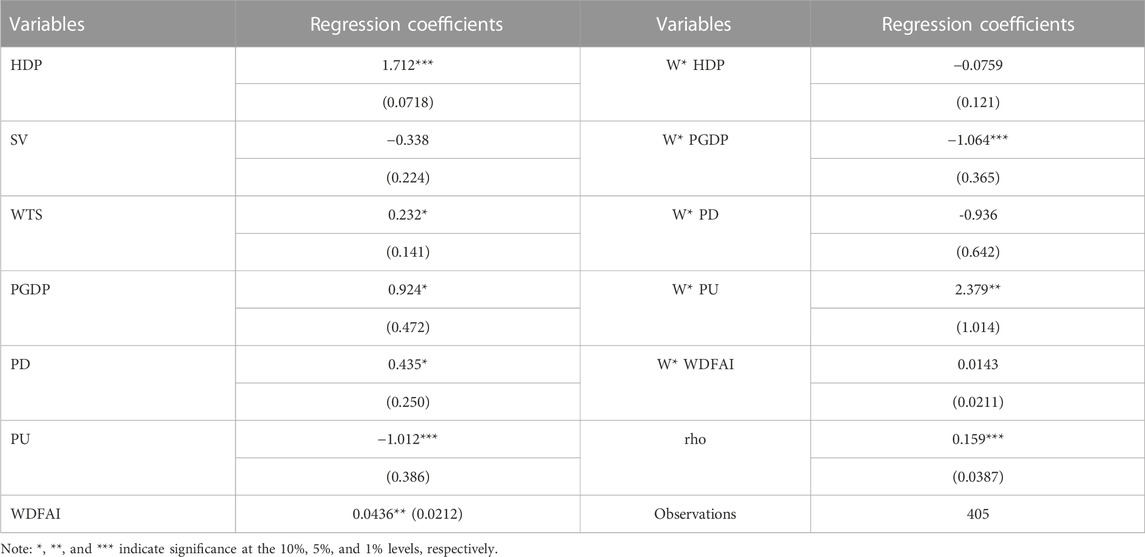
TABLE 5. The estimation results of spatial durbin model (SDM).
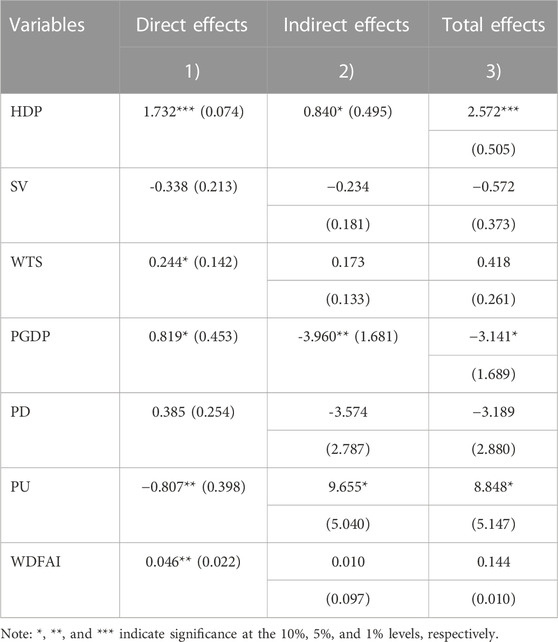
TABLE 6. The spatial effect decomposition.
The estimation results in Table 6 show that the direct and indirect effects of the number of harmless disposal plants (HDP) are significantly positive at the 1% and 10% statistical levels respectively, leading to a significant positive total effect as well. This suggests that the greater the number of HDP in the region, the more waste disposal capacity can be increased not only in the region, but also in neighboring regions. On the one hand, waste treatment has become part of the performance assessment of local officials, and there is often competition among government officials in neighboring regions in environmental treatment, forcing government officials in neighboring regions to pay attention to waste treatment capacity building. On the other hand, there is information and knowledge spillover from neighboring regions due to their geographical location, which in turn drives up the waste disposal capacity of neighboring regions.
The direct effect of the township waste transfer station (WTS) is significantly positive at the 10% statistical level, while the positive indirect and total effects are not significant. This indicates that each 1% increase in WTS in the region improves waste harmless disposal capacity by .244%, but does not significantly affect neighboring regions. It is because that the function of the township WTS is to transfer the rural domestic waste from the region to the county seat waste disposal plant for harmless disposal, which only affects the region and does not operate across the region.
The direct effect of GDP per person (PGDP) is statistically significantly positive at the 10% level, indicating that an increase in the level of economic development contributes to an increase in the waste harmless disposal capacity. However, the indirect effect shows that PGDP is statistically significantly negative at the 5% level, which means that an increase in PGDP in neighboring regions in turn has a dampening effect of 3.960% on the region’s waste harmless disposal capacity, resulting in a significantly negative total effect as well. It is because there is fierce competition in the waste treatment market. As the economic development of neighboring regions increases, the waste treatment industry becomes more developed, which inevitably squeezes the market space in the region, inhibiting the development of the waste treatment industry in the region.
The direct, indirect and total effects of population urbanization (PU) are statistically significant at the 5%, 10% and 10% levels respectively. For every 1% increase in the population urbanization in the region, the waste harmless disposal capacity decreases by .807%, suggesting that an increase in the level of population urbanization in the region reduces the waste harmless disposal capacity of the region. However, the indirect effect shows that the increase in the level of population urbanization in neighboring regions gives a 9.655% boost to local waste harmless disposal capacity in turn, resulting in a significantly positive total effect. Because the increase in the level of PU in neighboring regions can attract the population of the region to transfer to it, slowing down the growth rate of the local PU higher than the growth rate of the waste harmless disposal capacity improvement.
The direct effect of waste disposal fixed asset investment (WDFAI) is significantly positive at the 5% statistical level, while the positive indirect and total effects are not significant. This indicates that every 1% increase in WDFAI in the region improves waste harmless disposal capacity by .046%, but does not significantly affect neighboring regions. On the one hand, WDFAI are mainly the actions of the county governments with the aim of increasing local waste harmless disposal capacity. On the other hand, the environmental protection requirements faced by all regions are basically the same and the overall level of investment is low, resulting in the indirect effect not passing the significance test.
Neither the direct nor the indirect effects of population density (PD) pass the significance test. As discussed in the previous analysis of the selection of indicators, PD has both positive and negative effects. The combined effect is not apparent due to the complexity of the transmission mechanism. But its impact cannot be ignored. Neither the direct nor the indirect effect of the number of sanitation vehicles (SV) pass the significance test. It is possible that the main function of SV is transportation and their number does not have a direct impact on waste harmless disposal capacity.
This paper explores the spatial and temporal evolution characteristics of county solid waste harmless disposal capacity by selecting relevant data from 27 provinces in China from 2006 to 2020, and adopts the Dagum Gini coefficient to measure the spatial gap of county solid waste harmless disposal capacity. In addition, this paper empirically analyses the drivers affecting county solid waste harmless disposal capacity using the spatial Durbin model (SDM). Some interesting conclusions obtained are as follows:
First, in terms of time, county solid waste harmless disposal capacity in China as a whole shows a year-by-year increasing trend, especially after 2018 when the growth rate is faster. Second, in terms of spatial pattern, the solid waste harmless disposal capacity of coastal areas is generally higher than that of inland areas, and the distribution of provinces with low and middle levels of solid waste harmless disposal capacity is characterized by concentrated contiguity. From the perspective of spatial agglomeration, the characteristics of spatial agglomeration in the north are gradually becoming more pronounced, while those in the south are not significant. From the trajectory of the evolution of the spatial center of gravity, the center of gravity of county solid waste harmless disposal capacity as a whole shows a northeastern, then northwestern, then northeastern movement, and the speed of “northward expansion” is greater than the speed of “eastward expansion”. Third, the results of the Dagum Gini coefficient and its decomposition reveal that the spatial gap of county solid waste harmless disposal capacity in China generally shows a fluctuating downward trend, with the smallest average annual rate of change of the Gini coefficient in the northeast region. The narrowing of the gap within the group is an important driver towards a balanced county solid waste harmless disposal capacity over the period examined. The contribution of hypervariable density decreases gradually between the four regions of China, implying a reduction in the degree of intersection between regions. Finally, the spatial and temporal evolution of county solid waste harmless disposal capacity is the result of a combination of direct and indirect effects. The number of harmless disposal plants (HDP), GDP per person (PGDP) and population urbanization (PU) all have significant direct and indirect effects, implying that waste harmless disposal capacity is influenced by the combination of this factor in the region and in neighboring regions. The direct effect of both the number of township waste transfer stations and waste disposal fixed asset investment is significant, which indicates a significant contribution to the improvement of waste harmless disposal capacity in the region.
Based on the above analysis and conclusions, this paper proposes the following recommendations.
1) There is an obvious spatial gap in China’s county solid waste harmless disposal capacity, and it is necessary to grasp the law of the layout of harmless waste disposal and optimize the layout of industrial development. It is necessary to give full play to the advanced advantages of the eastern region, strengthen mutual learning and sharing of information, knowledge and technology between regions, and establish a mechanism for synergistic cooperation between regions. In addition, government departments need to keep strengthening the infrastructure for waste harmless disposal in the western and northeastern regions through policy support and other ways.
2) The county is taken as the center of governance, and the system of solid waste harmless disposal is reasonably planned. Local governments need to take into account the characteristics of local governance and actively implement the waste treatment model of “household sorting, village collection, town transfer and county disposal”, and strive to achieve close cooperation between the various links.
3) The development rate of population urbanization should be reasonably controlled. On the one hand, we should raise the awareness of urban and rural residents of environmental protection and implement a waste sorting policy to reduce the amount of waste at source. On the other hand, local governments should take into account the environmental carrying capacity of the county seat and implement the county’s population urbanization process in a planned manner, so as to achieve coordination between population urbanization development and waste treatment.
4) Increasing financial support to improve the infrastructure of county waste harmless disposal. In terms of waste disposal technology, on the one hand, enterprises with insufficient waste disposal capacity should be eliminated in a timely manner. On the other hand, existing waste disposal technology and equipment should be upgraded to improve the harmless waste disposal capacity. In terms of human capital, there is a need to strengthen the training of professional technicians and managers in the region so as to improve the efficiency of waste disposal.
5) Strengthen collaboration between industry, university and research in waste disposal technology. We should clearly recognize that technology research and development is fundamental to waste harmless disposal. Local governments should pay attention to the cooperation with institutes of science and draw on the strength of professional talents to scientifically plan the construction of waste disposal facilities in the county. The aim is to match the disposal capacity with the number of disposal facilities and avoid wasting resources.
The datasets presented in this study can be found in online repositories. The names of the repository/repositories and accession number(s) can be found below: https://data.cnki.net/yearbook/Single/N2021110027.
Conceptualization, XC and KW; Methodology, XC, JZ, LX and JL; Writing-original draft and editing, XC, JZ, KW, LX, JL and XH; All authors were committed to improving this paper and are responsible for the viewpoints mentioned in this work.
This study is supported by Shandong Provincial Social Science Foundation, China grant number 21CJJJ26.
The authors declare that the research was conducted in the absence of any commercial or financial relationships that could be construed as a potential conflict of interest.
All claims expressed in this article are solely those of the authors and do not necessarily represent those of their affiliated organizations, or those of the publisher, the editors and the reviewers. Any product that may be evaluated in this article, or claim that may be made by its manufacturer, is not guaranteed or endorsed by the publisher.
Al-Khatib, I. A., Monou, M., Zahra, A. S. F. A., Shaheen, H. Q., and Kassinos, D. (2010). Solid waste characterization, quantification and management practices in developing countries. A case study: Nablus district- Palestine. J. Environ. Manag. 91 (5), 1131–1138. doi:10.1016/j.jenvman.2010.01.003
Anselin, L., Syabri, I., and Kho, Y. (2006). GeoDa: An introduction to spatial data analysis. Geogr. Anal. 38 (1), 5–22. doi:10.1111/j.0016-7363.2005.00671.x
Chu, Z. J., Wu, Y. G., Zhou, A., and Huang, W. C. (2016). Analysis of influence factors on municipal solid waste generation based on the multivariable adjustment. Environ. Prog. Sustain. Energy 35 (6), 1629–1633. doi:10.1002/ep.12399
Chu, Z. J., Zhou, A., Ma, Y. F., Zhuang, J., Zhang, L., and Ma, J. (2020). Comparison of municipal solid waste treatment capacity in China: A tournament graph method. J. Material Cycles Waste Manag. 22, 1913–1921. doi:10.1007/s10163-020-01077-4
Dagum, C. (1997). A new approach to the decomposition of the Gini income inequality ratio. Empir. Econ. 22 (4), 47–63. doi:10.1007/978-3-642-51073-1_4
Di Foggia, G., and Beccarello, M. (2020). Drivers of municipal solid waste management cost based on cost models inherent to sorted and unsorted waste. Waste Manag. 114, 202–214. doi:10.1016/j.wasman.2020.07.012
Elhorst, J. P. (2014). Matlab software for spatial panels. Int. Regional Sci. Rev. 37 (3), 389–405. doi:10.1177/0160017612452429
General Office of the State Council (2022). Opinions on promoting urbanization with counties as an important carrier. Available at: http://www.gov.cn/zhengce/2022-05/06/content_5688895.htm (Accessed August 6, 2022).
Grazhdani, D. (2016). Assessing the variables affecting on the rate of solid waste generation and recycling: An empirical analysis in Prespa Park. Waste Manag. 48, 3–13. doi:10.1016/j.wasman.2015.09.028
Guo, W., Xi, B. D., Huang, C. H., Li, J., Tang, Z., Li, W., et al. (2021). Solid waste management in China: Policy and driving factors in 2004–2019. Resour. Conservation Recycl. 173, 105727. doi:10.1016/j.resconrec.2021.105727
Hao, Y., Gai, Z., Yan, G., Wu, H., and Irfan, M. (2021). The spatial spillover effect and nonlinear relationship analysis between environmental decentralization, government corruption and air pollution: Evidence from China. Sci. Total Environ. 763, 144183. doi:10.1016/j.scitotenv.2020.144183
Jiang, J. G., Lou, Z. Y., Ng, S. L., Luobu, C. R., and Ji, D. (2009). The current municipal solid waste management situation in Tibet. Waste Manag. 29 (3), 1186–1191. doi:10.1016/j.wasman.2008.06.044
Johnstone, N., and Labonne, J. (2004). Generation of household solid waste in OECD countries: An empirical analysis using macroeconomic data. Land Econ. 80 (4), 529–538. https://ideas.repec.org/a/uwp/landec/v80y2004i4p529-538.html. doi:10.2307/3655808
Kang, P., Zhang, H., and Duan, H. B. (2020). Characterizing the implications of waste dumping surrounding the Yangtze River economic belt in China. J. Hazard. Mater. 383, 121207. doi:10.1016/j.jhazmat.2019.121207
Kearney, R. C., Feldman, B. M., and Scavo, C. (2000). Reinventing government: City manager attitudes and actions. Public Adm. Rev. 60 (6), 535–548. doi:10.1111/0033-3352.00116
Khan, S., Anjum, R., Raza, S. T., Ahmed Bazai, N., and Ihtisham, M. (2021). Technologies for municipal solid waste management: Current status, challenges, and future perspectives. Chemosphere 288, 132403. doi:10.1016/j.chemosphere.2021.132403
Kinnaman, T. C. (2014). Determining the socially optimal recycling rate. Resour. Conservation Recycl. 85, 5–10. doi:10.1016/j.resconrec.2013.11.002
Li, X. R., Bi, F., Han, Z. D., Qin, Y., Wang, H., and Wu, W. (2019). Garbage source classification performance, impact factor, and management strategy in rural areas of China: A case study in hangzhou. Waste Manag. 89, 313–321. doi:10.1016/j.wasman.2019.04.020
Li, Z., Jiang, W. G., Wang, W. J., Lei, X., and Deng, Y. (2019). Exploring spatial-temporal change and gravity center movement of construction land in the Chang-Zhu-Tan urban agglomeration. J. Geogr. Sci. 29 (08), 1363–1380. doi:10.1007/s11442-019-1664-5
Liu, Y., and Huang, J. (2014). Rural domestic waste disposal: An empirical analysis in five provinces of China. China Agric. Econ. Rev. 6 (4), 558–573. doi:10.1108/CAER-05-2013-0076
Lv, W. X., and Du, J. (2016). Japan’s waste classification management experience and its inspiration to China. J. Central China Normal Univ. Humanit. Soc. Sci. 55 (1), 39–53. (in Chinese).
Ma, Q. Z., Huang, D. J., Li, H., Hu, Y., P. Paudel, K., Zhang, S., et al. (2021). Effects of fiscal decentralization on garbage classifications. Front. Energy Res. 9, 1–14. doi:10.3389/fenrg.2021.686561
Mazzanti, M., Montini, A., and Zoboli, R. (2008). Municipal waste generation and socioeconomic drivers: Evidence from comparing northern and southern Italy. J. Environ. Dev. 17 (1), 51–69. doi:10.1177/1070496507312575
Ministry of Housing and Urban-Rural Development (2020). China urban and rural construction statistical yearbook (2006-2020). Beijing: China Statistics Press.
Mookherjee, D., and Shorrocks, A. (1982). A decomposition analysis of the trend in UK income inequality. Econ. J. 92 (368), 886–902. https://ideas.repec.org/a/ecj/econjl/v92y1982i368p886-902.html. doi:10.2307/2232673
National Bureau of Statistics of China (2011). Eastern, western, middle and northeastern regions division method. Available at: http://www.stats.gov.cn/ztjc/zthd/sjtjr/dejtjkfr/tjkp/201106/t20110613_71947.htm (Accessed August 16, 2022).
Paulauskaite-Taraseviciene, A., Raudonis, V., and Sutiene, K. (2022). Forecasting municipal solid waste in Lithuania by incorporating socioeconomic and geographical factors. Waste Manag. 140, 31–39. doi:10.1016/j.wasman.2022.01.004
Sanjeev, S., Helena, T., Richard, L., and Mitchell, R. (2007). An exploratory spatial data analysis approach to understanding the relationship between deprivation and mortality in Scotland. Soc. Sci. Med. 65, 1942–1952. doi:10.1016/j.socscimed.2007.05.052
Spoann, V., Fujiwara, T., Seng, B., and Lay, C. (2018). Municipal solid waste management: Constraints and opportunities to improve capacity of local government authorities of Phnom Penh Capital. Waste Manag. Res. 36 (10), 985–992. doi:10.1177/0734242X18785722
Stern, P. C., Dietz, T., Kalof, L., and Guagnano, G. A. (1995). Values, beliefs, and pro-environmental action: Attitude formation toward emergent attitude objects. J. Appl. Soc. Psychol. 25 (18), 1611–1636. doi:10.1111/j.1559-1816.1995.tb02636.x
Wang, L., Yan, D. Y., Xiong, Y., and Zhou, L. (2019). A review of the challenges and application of public- private partnership model in Chinese garbage disposal industry. J. Clean. Prod. 230, 219–229. doi:10.1016/j.jclepro.2019.05.028
Wang, Y., and Hao, F. (2020). Public perception matters: Individual waste sorting in Chinese communities. Resour. Conservation Recycl. 159 (8), 104860–104912. doi:10.1016/j.resconrec.2020.104860
Wei, J. B., Herbell, J. D., and Zhang, S. (1997). Solid waste disposal in China—situation, problems and suggestions. Waste Manag. Res. 15 (6), 573–583. doi:10.1177/0734242X9701500603
Xu, L., Ling, M. L., and Wu, Y. L. (2018). Economic incentive and social influence to overcome household waste separation dilemma: A field intervention study. Waste Manag. 77, 522–531. doi:10.1016/j.wasman.2018.04.048
Yaman, C. (2012). Costs pertaining to the collection, transportation and disposal of domestic solid wastes and general city cleaning in the city of Istanbul. Fresenius Environ. Bull. 21 (4), 908–917. https://www.mendeley.com/catalogue/64bf93e0-0ed9-32b6-8eae- 1d754b1a7af2/.
Yang, G., Liu, Y. J., and Zhou, C. B. (2019). International practice of municipal solid waste resource management and its inspiration to China. Environ. Prot. 47 (12), 56–61. (in Chinese).
Yang, X. D., Wang, W. L., Su, X. F., Ren, S., Ran, Q., Wang, J., et al. (2022). Analysis of the influence of land finance on haze pollution: An empirical study based on 269 prefecture-level cities in China. Growth Change, 1–34. doi:10.1111/grow.12638
Keywords: solid waste, harmless disposal capacity, spatial and temporal evolution, Dagum Gini coefficient, space Durbin model (SDM), China
Citation: Chen X, Xing L, Zhou J, Wang K, Lu J and Han X (2023) Spatial and temporal evolution and driving factors of county solid waste harmless disposal capacity in China. Front. Environ. Sci. 10:1056054. doi: 10.3389/fenvs.2022.1056054
Received: 28 September 2022; Accepted: 20 December 2022;
Published: 16 January 2023.
Edited by:
Dingde Xu, Sichuan Agricultural University, ChinaReviewed by:
Xiaodong Yang, Xinjiang University, ChinaCopyright © 2023 Chen, Xing, Zhou, Wang, Lu and Han. This is an open-access article distributed under the terms of the Creative Commons Attribution License (CC BY). The use, distribution or reproduction in other forums is permitted, provided the original author(s) and the copyright owner(s) are credited and that the original publication in this journal is cited, in accordance with accepted academic practice. No use, distribution or reproduction is permitted which does not comply with these terms.
*Correspondence: Kai Wang, a3dhbmdAbmphdS5lZHUuY24=
Disclaimer: All claims expressed in this article are solely those of the authors and do not necessarily represent those of their affiliated organizations, or those of the publisher, the editors and the reviewers. Any product that may be evaluated in this article or claim that may be made by its manufacturer is not guaranteed or endorsed by the publisher.
Research integrity at Frontiers
Learn more about the work of our research integrity team to safeguard the quality of each article we publish.