 Wei Wei1
 Xiaoyan Qian
 Qing Lin
 Li-Chen Chou
- 1College of Economics and Management, Nanjing Forestry University, Nanjing, China
- 2School of Economics and Management, Nanjing Vocational University of Industry Technology, Nanjing, China
- 3Institute of Economic Development, Nanjing Academy of Social Sciences, Nanjing, China
- 4School of Finance and Trade, Wenzhou Business College, Wenzhou, China
- 5Institute of Economic Development, Shantou University, Shantou, China
Agricultural production has high correlations with natural hazards and water resource dynamic. Extreme rainfall brought by typhoons has a profound impact on agriculture in Taiwan. How typhoons impact agricultural activities and outputs is lacking research, especially in coastal regions such as Taiwan. In this report, the impacts of typhoon on agricultural loss from 2006 to 2019 in Taiwan was measured and called attention to the role of flood control construction in sustaining agricultural activities. With the help of Data Envelopment Analysis and geographical mapping, it is found that there are spatial differences in agricultural losses caused by typhoons. The main results indicate that the efficiency scores bring a inverse U-shape trend from the year 2007 (efficiency .718) to 2019 (efficiency .708). Looking further, Tainan City, Yunlin City, Chiayi County and other plain areas are vulnerable to hazards because the efficiency scores in these counties all below than 70%. However, some areas with prominent flood control construction showed a trend of agricultural damage reduction. This paper suggests that scholars should collect relevant data in the future and pay attention to the macro relationship between regional flood control construction and agricultural damage.
1 Introduction
Agricultural production is deeply affected by the environment and climate, and it is more at risk from natural hazards than any other industry. Because Taiwan is located in a subtropical region and is affected by warm humid air currents and ocean currents, it has an oceanic climate. However, because it is close to the mainland and the weather system mostly moves from west to east, Taiwan is also affected by the continental climate. The Tropic of Cancer (23.5 N) passes through the central part of Taiwan Island, so the southern climate is tropical, and the northern part is subtropical, with warm and humid climate. On the east coast, the mainstream Kuroshio flows northward, bringing in hot and humid air currents, with the prevailing winds in different seasons, such as northeast wind in winter and southwest wind in summer, causing rain on the windward slopes and inland mountainous areas, making Taiwan abundant in rainfall. Taiwan is often affected by typhoons from June to September each year (Bayrak et al., 2021). On average, three to four typhoons hit Taiwan in summer and autumn each year. Although it brings abundant rainfall, the time and space distribution of rainfall is very uneven, which often causes hazards such as floods and soil flows. However, if the rain brought by typhoons is lacking, droughts are prone to occur in winter. According to statistics from the agricultural department of the Taiwan government, meteorological hazards are the main source of agricultural hazards in Taiwan. Typhoons and the heavy rains it brought are the main hazards (Chuang and Ho, 2021). Chen et al. (2018) pointed out that 70% of Taiwan’s agricultural economic losses are caused by typhoons, and 27% are caused by rain hazards (including heavy rain). According to the Executive Yuan (2020), over the past 10 years, 90% of the damage to agricultural activities in Taiwan has been caused by floods, heavy rains and typhoons.
In view of the frequent extreme rainfall brought by typhoons, how to deal with the uneven distribution of hydraulic power and the application of resources in economic activities has an important impact on the efficiency of economic output (Frame et al., 2020). For example, how to effectively store precipitation and use it as an input for agricultural activities to drive product supply is very important for efficiency at the current or future output level. In contrast, excessive water supply, such as floods and heavy rainfall, will cause losses in agricultural activities such as undesired output value (Saeed et al., 2021; Sahana et al., 2021). Based on above discussion, this article uses Taiwan’s agricultural statistical annual report, agricultural loss statistics, typhoon database, and rainfall distribution surveys, and uses the agricultural production of the counties and cities in Taiwan’s main island from 2006 to 2019 as the research object, applying the Data Envelopment Analysis (DEA) and the concept of output efficiency analysis to explore the impact of typhoon over the years on the overall and inter-regional agricultural output and agricultural losses. This paper expected to find a positive correlation between agricultural losses and typhoon frequency and the significance of such correlation should have spatial differences, especially in ecologically fragile areas.
2 Literature review
Due to the characteristics of disaster statistics, part of the research uses input-output analysis for analysis (Yu et al., 2019; Lin et al., 2020). Shibusawa and Matsushima (2021) used the Japanese geographic environment data and the input-output table of each region to carry out the earthquake disaster economic evaluations based on the output value of each region. They estimated the direct losses of hazards based on natural hazards, population density, spatial distribution of economic sectors, and production profiles revealed by geographic data of every 500 square meters. The empirical results found that the degree of disaster loss isn’t proportional to population density and inter-industry development. The study suggests that preventive measures or post-disaster reconstruction policies should consider more aspects to avoid overall economic losses. Lin et al. (2020) used the statistical data from agricultural annual reports to discuss the impacts of the natural hazards on climate change and crop losses on the regional economy. In their study, the regional input-output model combined with the Miller and Blair (2009) supply-side input-output model was applied. Due to the low ability of crops to resist hazards, the impact of the uncertain natural hazards on crop losses is the first to bear the brunt. They concluded that agricultural disaster losses have a great impact on income and employment effects, and the largest impact on domestic gross production is nearly 30%, resulting in an increase in unemployment and a decline in economic growth. They found that the input-output model can be used to estimate the effects of hazards on income and indirect effects. If combined with the social accounting matrix, the direct and indirect effects of disaster losses in various sectors can be estimated. Lee et al. (2020) and Lin et al. (2020) further analyzed the impact of single-day disaster events on agricultural losses and the economy. Their studies took Typhoons Morakot and Van Nabey as examples, using Input-Output Analysis to discuss. The empirical results found that: Typhoon Morakot and Typhoon Van Nabe caused damage to agriculture and industry. The multiplier effects of output reduction were 1.49 and 1.33, respectively, and the unemployment rate increased by .13 percentage points and .06 percentage points, respectively.
Natural hazards such as wind strikes not only affect agricultural losses, but also indirectly affect local employment issues (Qin et al., 2020). For example, after the passage of Typhoon Morakot in 2009, the labour force in the disaster area faced the problem of temporary unemployment, which caused the government to amend the law to help the laborers find employment. Sperling (2021) compared the employment situation of laborers in counties and cities hit and untouched by hurricanes and floods in Mexico after 2007. The study found that seasonal hurricanes invaded the region and caused the local labour population to migrate to avoid the hurricane in a short period of time, resulting in a decline in labour participation. As a result, the average salary in the hurricane-affected area was greatly reduced due to a large reduction in labour supply. Although the relatively neighbouring areas that weren’t hit by the hurricane didn’t suffer direct economic losses as a result, they included workers from areas affected by the hurricane, resulting in a drop in average wages. Chen et al. (2018) studied based on spatial database and geographic information system, integrating the original data of agricultural census, the current status of agricultural land use, and the potential of rainfall inundation. This assessment was based on Yunlin and Chiayi, which are important agricultural production areas in Taiwan. They explored the spatial distribution and spatial heterogeneity of potential agricultural losses when an extreme rainfall event occurs under rainfall scenarios with different flooding potentials. The results of the study showed that when the daily rainfall reaches 200 to 450 mm, the agricultural areas in central and southern Taiwan are threatened by flood, and the functions of water storage and drainage facilities will reach the upper limit of operation. If the scale of rainfall that will become more and more variable in the future, the formulation of measures such as hydraulic facilities and the use of hydraulic energy will have a key impact. Similar studies also have Liang et al. (2020a), Liang et al. (2020b), and Liang and Li (2020). By reviewing the literature, it is obvious that there is a lack of research on Taiwan in the existing studies, and most studies of typhoon focused on economic variables such as income and employment, and rarely explore specific agricultural losses. The study of Chen et al. (2018) is important as it gives us a good starting point and pointed out the spatial heterogeneity of agricultural losses caused by rainfall and floods. But the study is still county-based and doesn’t explore Taiwan as a whole. This paper finds that DEA is a good method to solve the problem of multi-input and multi-output, and is effective in evaluating the effectiveness of multi-input and multi-output units (Basavalingaiah et al., 2022; Rehman et al., 2022). For example, Xie et al. (2019) pointed out in their study that since DEA is based on relative efficiency through linear programming, it isn’t necessary to determine the weight of input and output indicators in advance during the application of the model, thus avoiding the influence of subjective factors. Therefore, DEA model will be used in this study to analyze the spatial difference of agricultural losses caused by typhoons in Taiwan. Meanwhile, Chen et al. (2018) is referred in the present study to visualize the losses by GIS platform. At the same time, considering the impact of massive rainfall brought by typhoon on agriculture, this paper combined with the changes of water conservancy facilities to discuss the impact of typhoon on agricultural water management in Taiwan.
3 Methodology
3.1 DEA
In traditional, the Data Envelopment Analysis (DEA) developed by Charnes et al. (1978) usually applies strong disposal reference technology:
In Eq. 1, x and y represent the input and output. Eq. 1 means the outputs are “desirable” when producer fabricates and therefore these outputs won’t bring negative external effect. Färe et al. (1989) then constructed several efficiency measures according to the different ways of including desirable and undesirable outputs asymmetrically. Their weak disposal reference technology is as follows:
In Eq. 2, define input, undesirable and desirable output as x, yU and yD. As Hsiao et al. (2012) pointed, region OFBCDE represents strong disposability, producer can yield the outputs freely or costless disposable if the outputs are “goods”. However, if some outputs are “goods”, and others are not, it is unreasonable to assume the production behavior under strong disposability assumption because it implies the “bad” outputs can be freely disposed. Therefore, the assumption of freely (strong) disposability of “bad” output is violated and we should use another approach which apply the concept of weakly disposability appropriately. Under the weak disposability assumption of undesirable outputs, moving (YU, YD) horizontally leftwards to the vertical axis on which YU = 0 is not possible unless YD = 0, and (YU, YD) can only be proportionally scaled down to (λA YU, λA YD),
In our opinion, we consider the outputs of agriculture have a similar phenomenon. They also produce some “goods” (e.g., agricultural commodities and related economic productions) and some “bads” (e.g., pollution, production damage) that these outputs are desirable and undesirable. The “bad” outputs affect other outputs and take shape their whole performance indirectly in the industry. The evaluation of the agricultural industry efficient may calculates the results inaccurately if we measure under the assumption of strongly disposability. The reason is that when the outputs are undesirable, one can’t assume that it is possible to produce less of that output keeping the other output and input fixed because these undesirable outputs are the byproducts of the remaining outputs.
Follow the concept of Färe et al. (1985) and Färe et al. (1989), we apply the methods of Cooper et al. (2007), Cooper et al. (2009) and measure the efficiency by solving the following equation:
In Eq. 3,
3.2 Analysis process
The analysis process is as follows: First, through the above equations, the annual agricultural production efficiency of each county/city in Taiwan can be calculated. Then, the production efficiency value will be compared with the impact of typhoons on each county/city in each year to explore whether the frequency of typhoons is related to production performance. Our main results found that typhoons did have an impact on agricultural production efficiency in some counties, but did not necessarily have a comprehensive impact on production performance. Finally, in order to look for underlying reasons, our study enumerates data of water conservancy facilities in each county to explain why typhoons did not have a negative impact on agricultural production in some counties.
Accordingly, the input and output variables used in this article are summarized as follows:
Agricultural Outputs: Refers to the total agricultural output value (Unit: Thousand Taiwan dollars, Mean = 11,191,373, Variance = 10,771,685).
Agricultural Loss: The agricultural losses in the area caused by the typhoon during the year. (Unit: Thousand Taiwan Dollars, Mean = 85,463, Variance = 363,122).
Labor: Refers to workers engaged in agricultural activities. (Unit: person, Mean = 38,672, Variance = 27,899).
Area = The area of land actually used as farming in agricultural activities also includes short-term leisure or fallow land. (Unit: hectares, Mean = 40,270, Variance = 27,866)
DT = The number of typhoons that have landed Taiwan each year (Mean = 2.786, Variance = 1.372).
It is worth noting that the variable DT is an environmental variable that counts the number of typhoons landed in Taiwan over the years. According to historical data, about 8–15 typhoons form in the Pacific Ocean every year. The average number of travel routes to Taiwan is 2.786. Due to the geographical area, every time a typhoon makes landfall, almost the entire island is surrounded. Therefore, we can analyze whether the typhoon will affect the agricultural activities of each county or city.
3.3 Data sources
The research data in this paper were manually collected from several official websites by referring to previous literatures on Taiwan, such as Su et al. (2010), Chang et al. (2019), and Yeh et al. (2021). The panel data of agricultural losses and related input and output variables related to typhoons from 2007 to 2019 were collected through the council of Agriculture. Meanwhile, in order to explain the findings of this paper, we also sorted out the variables of farmland water conservancy facilities in counties and cities of Taiwan from the executive Yuan in Taiwan, including the length of water storage pipelines and drainage pipelines. At the same time, the record of rainfall in Taiwan Meteorological Bureau were collected for helping explain the findings.
4 Results
4.1 Correlations between typhoon and agricultural loss
Figure 1 summarizes the statistics of agricultural losses which caused by typhoons and the number of typhoons landed Taiwan in 2009, 2013, 2016, and 2019. It can be found that the number of typhoons and agricultural losses are not necessarily positively correlated. For example, three typhoons in 2009 were less than five in 2013, but the scale of overall agricultural losses in 2009 was about 50 times that of 2013. Similarly, the number of typhoons in 2016 was three less than in 2013, but the agricultural losses in that year were 68 times that of 2013. The data shows that although typhoons are the main factor causing agricultural losses in Taiwan, there is no inevitable relationship between the number of typhoons and the scale of losses. Second, according to the Natural Disaster Yearbook (2019), the agricultural damage caused by the typhoon is concentrated in a specific area. For example, from 2006 to 2019, only three agricultural damages occurred in northern cities such as Taipei, New Taipei, Taoyuan, and Keelung. In contrast, there have been 20 agricultural hazards in southern cities such as Yunlin and Tainan. The most extreme is Chiayi County, where agricultural losses are still erupting every year even when there is no typhoon crossing the border in 2018.
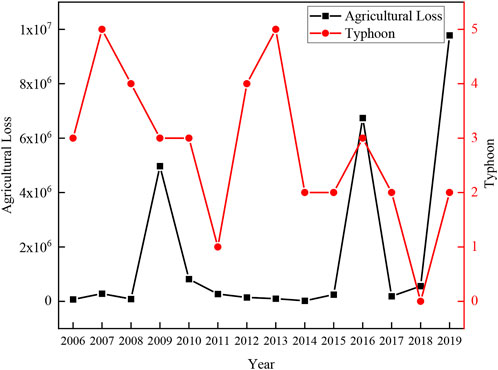
FIGURE 1. Agricultural losses and frequency of typhoons in Taiwan.
According to the undesired output efficiency Eq. 3, this paper sorts out the average output efficiency of each city and region over the years (see full description in Supplementary Appendix SA1). The empirical results show that Keelung City has the highest output efficiency of .975 and Chiayi County has the lowest output efficiency of .682. From a regional perspective, the northern region has the highest performance at .778 and the southern region has the lowest performance at .700. Secondly, from the distribution of output efficiency samples, it can be found that the variance and standard deviation are between .003–.116. This result indicates that the fluctuation of agricultural output efficiency among regions, counties and cities is relatively low. From the perspective of areas where agricultural losses occur more frequently, the efficiency values of the southern and eastern regions are worse than other regions, but the fluctuations in the distribution of sample efficiency values are not as high as those of regions with better performance such as the northern region. The result reflects that when natural hazards such as typhoons strike, the impact on the efficiency of agricultural output in various regions of Taiwan will not fluctuate greatly.
Figure 2and Table 1 summarizes the output efficiency of Taiwan’s counties and cities in 2007, 2009, 2011, 2013, 2015, 2017, and 2019. First of all, from the perspective of time trends, such as New Taipei City, Taoyuan City, Taichung City, Kaohsiung City, Hsinchu City and other regional production efficiency the output efficiency has shown a downward trend in recent years. Tainan City, Yunlin City, Chiayi County, Pingtung County and other regions showed a growth trend. It is worth noting that the main production areas of various crops in Taiwan are mostly located in Yunlin County, Chiayi County and Tainan City. However, Yunlin and Chiayi areas are prone to flooding due to low-lying terrain, while Tainan is due to the terrain. It can be seen from Figure 2 that 2009 and 2019 were the years when Taiwan’s agricultural losses were relatively serious, but the output efficiency of these three regions did not significantly decrease in that year. The efficiency value of Chiayi County in 2019 was even the second of the 7 years. The high level indicates that in the event of a typhoon, regional agricultural output activities have a negative impact on the efficiency of disaster prevention and mitigation.
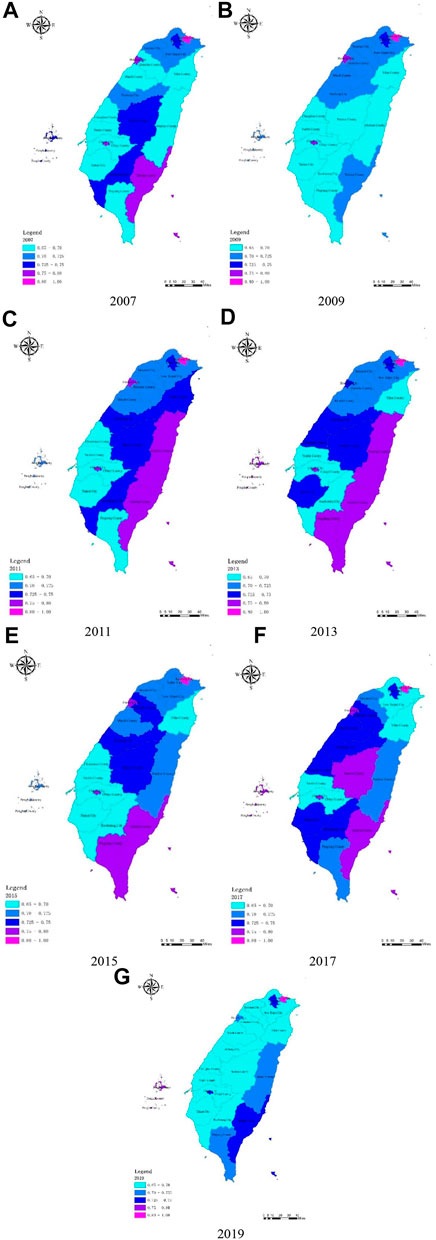
FIGURE 2. Agricultural production efficiency of various counties and cities in different years. (A-G) are, respectively, 2007, 2009, 2011, 2013, 2015, 2017, 2019.

TABLE 1. Agricultural production efficiency.
5 Potential explanation: Flood control construction differences
In order to explain our findings, past literature was referred. Among literature, Hung and Kao (2010) and Shiu et al. (2009) points out that the number of days of heavy rain and the frequency of heavy rain in Taiwan in the past 30 years have been significantly increasing, especially between 2000 and 2006, the frequency of heavy rain was significantly higher than that from 1970 to 1999. Due to the concentration of rainfall and the increased variance of variation, how to deal with sudden heavy rains and save water for the sustainable use of water resources during the subsequent dry season has become an urgent problem for Taiwan’s agricultural development in recent years. From the perspective of Taiwan’s overall agricultural activities, Yunlin, Chiayi, and Tainan are the few plain areas in Taiwan. The land is easier to cultivate and become the main agricultural economic area in Taiwan. However, some areas are low-lying, if there is no drainage pipeline. Drainage can easily cause flooding, mudslides and other hazards, which in turn makes agricultural activities stop.
According to agricultural statistics from the Council of Agricultural and Executive Yuan of the Taiwan Region, Table 2 and Figure 3 summarize statistics related to farmland water conservancy facilities in all counties and cities on the island in Taiwan from 2005 to 2018. As mentioned above, because Yunlin, Chiayi, and Tainan are the main agricultural production areas and are prone to flooding due to geographical factors, the establishment of local drainage measures is extremely important. In addition, due to the uneven distribution of rainfall in recent years, how to effectively store water is also an important policy issue. From Figure 3, it can be found that the length of agricultural water storage and drainage pipelines in Taiwan, such as Taipei, Taoyuan, and Taitung, remains unchanged for many years. For the average area, the construction of water storage equipment is increasing year by year. Figure 3 shows that when agricultural activities are in response to heavy rainfall and uneven rainfall, Tainan City, Yunlin City, and Chiayi County have effectively used flood storage and flood drainage channels to reduce flood risks and strengthen water resource utilization. by comparing the changes in agricultural losses in the areas where flood-control construction performed well, this paper believes that correlation exists, but it has not been able to achieve clear statistical verification. On the one hand, the economic data and the rainfall data of Taiwan have not been well integrated. For example, the regional rainfall data brought by the typhoon is not exist and the relevant definitions are not unified. Therefore, we believe that it is necessary to put forward relevant hypotheses and call on scholars to conduct relevant research in the future. This paper proposes the following hypothesis: The installation of storage and drainage equipment has made agricultural economic activities more sustainable in the face of the concentrated rainfall brought by typhoons.
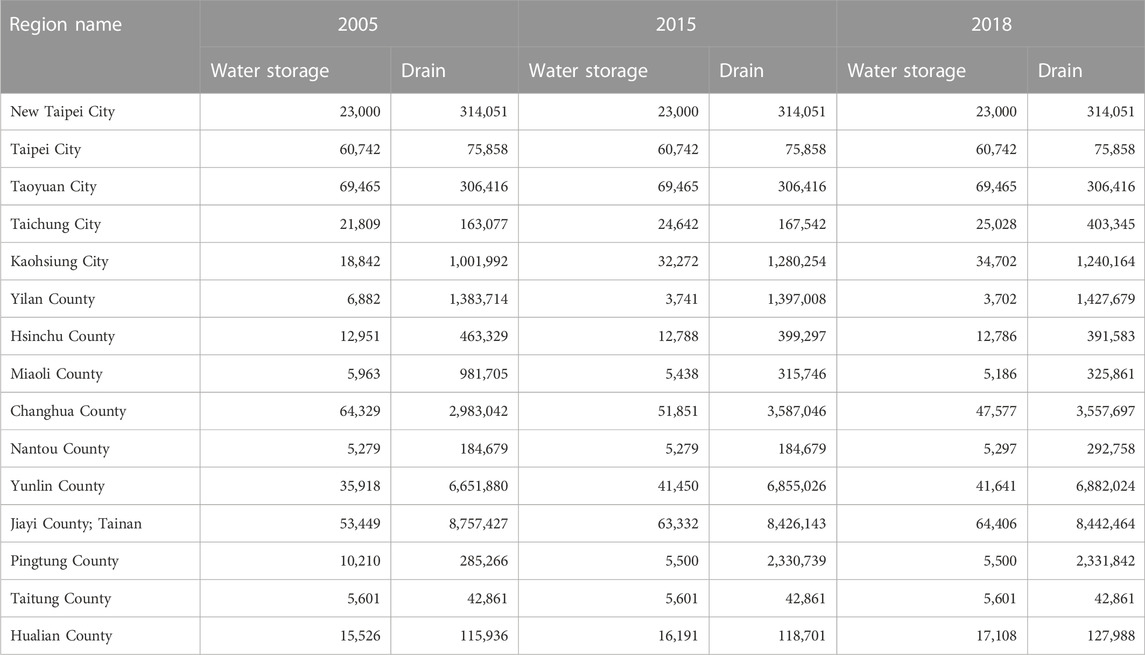
TABLE 2. Annual changes in water storage pipelines and drainage pipelines of farmland water conservancy facilities (unit: meters).
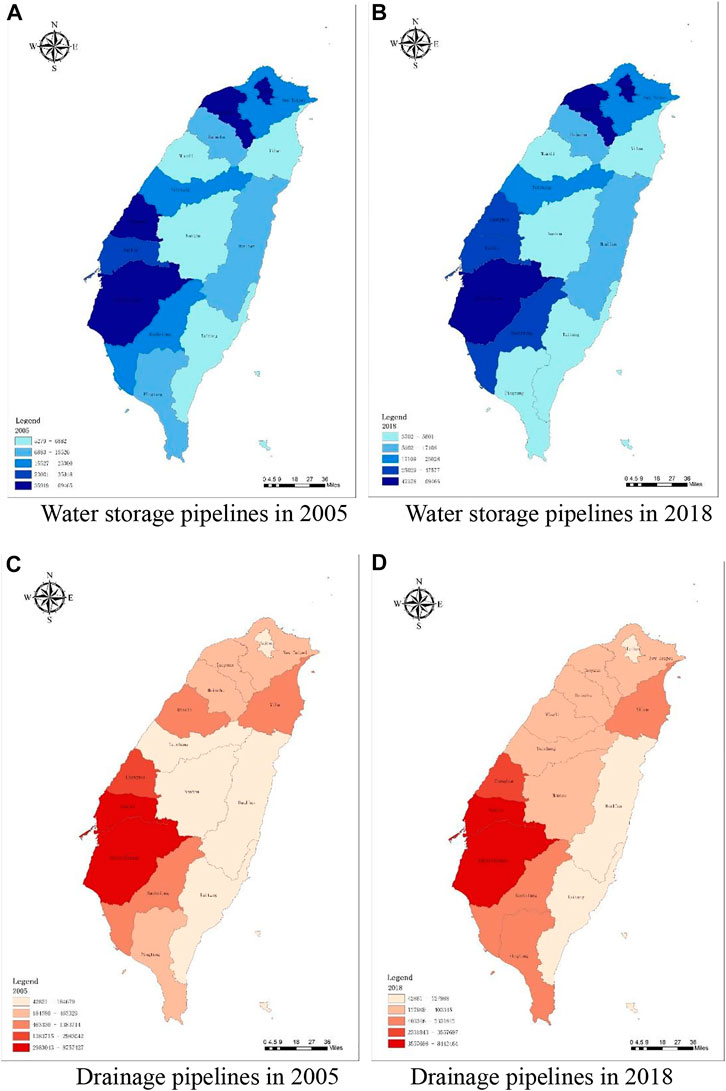
FIGURE 3. Annual changes in water storage pipelines and drainage pipelines of farmland water conservancy facilities (unit: meters). (A) Water storage pipelines in 2005; (B) Water storage pipelines in 2018; (C) Drainage pipelines in 2005; (D) Drainage pipelines in 2018.
6 Conclusion
This article takes the agricultural production of the counties and cities on the island of Taiwan from 2006 to 2019 as the research object, and applies the undesired output efficiency of Data Envelopment Analysis (DEA) to analyze the impact of typhoon on the overall and inter-regional agricultural output and agricultural losses. The results show that the performance in the northern region is the highest and the southern region is the lowest. Tainan City, Yunlin City, Chiayi County and other plain areas are vulnerable to hazards, especially the extreme rainfall brought by typhoons. However, the construction of flood storage and drainage facilities seems effectively slow down the impact of rainfall brought by typhoons. As some local governments have built drainage and water storage pipelines and other facilities in recent years, we propose a causal relationship that need to be further tested between the construction of water facilities and the agricultural damage caused by typhoons. Areas such as Taipei, Taoyuan, and Taitung that have made less efforts in flood control have notably failed to contain agricultural losses. Areas that actively build flood storage and drainage facilities, such as Tainan City, Yunlin City, and Chiayi County, are making their agricultural production more resilient and reducing losses in the face of hazards. Although this paper is a brief research report and not aim at proving this causal relationship, we believe this phenomenon is worth paying attention to in the future. This means that the construction of flood control facilities has gradually become more and more effective in making up for the agricultural losses caused by geographical disadvantages, which has important reference value for promoting local policies.
This study is based on the data of counties and cities on the main island of Taiwan. The analysis data still has macroeconomic characteristics. Therefore, it is needed to acknowledge our limitations. How to conduct more detailed analysis or micro-level discussions is the goal that must be paid attention to in the future. Due to the limitations of research data, future study can further integrate the spatial data of different crops in the geographic area, and further consider the actual conditions of various crops. After the spatial distribution of agricultural losses is clearly identified, the factors affecting the spatial distribution of agricultural losses can be further explored in future studies from the perspective of agricultural production factors to clarify the relationship between various production factors and the distribution of agricultural losses.
Data availability statement
The raw data supporting the conclusion of this article will be made available by the authors, without undue reservation.
Author contributions
All authors contributed to the study conception and design. Material preparation, data collection, and analysis were performed by WW, XQ, and QL. The first draft of the manuscript was written by WW, QL, QZ, L-CC and XC, and QL commented on previous versions of the manuscript. All authors read and approved the final manuscript.
Funding
This paper was supported the Social Science Foundation of Jiangsu Province (Nos 19GLC006, 2019SJA0244, and 20GLC008), China Postdoctoral Science Foundation (No. 2020M671510), the National Natural Science Foundation of China (No. 72104108).
Acknowledgments
The researchers thank the reviewers for their comments.
Conflict of interest
The authors declare that the research was conducted in the absence of any commercial or financial relationships that could be construed as a potential conflict of interest.
Publisher’s note
All claims expressed in this article are solely those of the authors and do not necessarily represent those of their affiliated organizations, or those of the publisher, the editors and the reviewers. Any product that may be evaluated in this article, or claim that may be made by its manufacturer, is not guaranteed or endorsed by the publisher.
Supplementary material
The Supplementary Material for this article can be found online at: https://www.frontiersin.org/articles/10.3389/fenvs.2022.1055215/full#supplementary-material
References
Basavalingaiah, K., Paramesh, V., Parajuli, R., Girisha, H. C., Shivaprasad, M., Vidyashree, G. V., et al. (2022). Energy flow and life cycle impact assessment of coffee-pepper production systems: An evaluation of conventional, integrated and organic farms in India. Environ. Impact Assess. Rev. 92, 106687. doi:10.1016/j.eiar.2021.106687
Bayrak, M. M., Hsu, Y. Y., Hung, L. S., and Tsai, H. M. (2021). Global climate change and indigenous peoples in taiwan: A critical bibliometric analysis and review. Sustainability 13 (1), 29. doi:10.3390/su13010029
Chang, H. H., Mishra, A. K., and Lee, T. H. (2019). A supply-side analysis of agritourism: Evidence from farm-level agriculture census data in Taiwan. Aust. J. Agric. Resour. Econ. 63 (3), 521–548. doi:10.1111/1467-8489.12304
Charnes, A., Cooper, W. W., and Rhodes, E. (1978). Measuring the efficiency of decision making units. Eur. J. Operational Res. 2, 429–444. doi:10.1016/0377-2217(78)90138-8
Chen, Y., Wang, C., Lee, C., and Chen, Y. (2018). Spatial analysis loss and policy review: A case study of flood potential area in Yunlin, Chiayi, and tainan counties. Surv. Research-Method Appl. (In Chinese) 41 (3), 7–55.
Chuang, S., and Ho, H. Y. (2021). Taiwan’s experience in disaster coordination. Natural Hazards Review 22 (1), 04020047. doi:10.1061/(asce)nh.1527-6996.0000420
Cooper, W. W., Ruiz, J. L., and Sirvent, L. (2009). Selecting non-zero weights to evaluate effectiveness of basketball players with DEA. European Journal of Operational Research 195, 563–574. doi:10.1016/j.ejor.2008.02.012
Cooper, W. W., Seiford, L. M., and Tone, K. (2007). Data envelopment analysis: A comprehensive text with models, applications, reference and DEA- solver software. New York: Springer Science & Business Media.
Färe, R., Grosskopf, S., Lovell, C. A. K., and Pasurka, C. (1989). Multilateral productivity comparisons when some outputs are undesirable: A nonparametric approach. Review of Economics and Statistics 71 (1), 90–98. doi:10.2307/1928055
Färe, R., Grosskopf, S., and Lovell, C. A. K. (1985). The measurement of efficiency of production. New York: Cornell University.
Frame, D. J., Rosier, S. M., Noy, I., Harrington, L. J., Carey-Smith, T., Sparrow, S. N., et al. (2020). Climate change attribution and the economic costs of extreme weather events: A study on damages from extreme rainfall and drought. Climatic Change 162 (2), 781–797. doi:10.1007/s10584-020-02729-y
Hsiao, B., Yu, M. M., Chern, C. C., and Chou, L. C. (2012). “Considering production limits in greenhouse gas emission trading using the data envelopment analysis approach,” in 2012 45th Hawaii International Conference on System Sciences, 04 January 2012 (IEEE), 1157–1166.
Lee, C. H., Lin, S. H., Kao, C. L., Hong, M. Y., Mr, P. C. H., Shih, C. L., et al. (2020). Impact of climate change on disaster events in metropolitan cities -trend of disasters reported by Taiwan national medical response and preparedness system. Environmental research 183, 109186. doi:10.1016/j.envres.2020.109186
Li, Y. (2020). “Disposal of undesirable output in measurement of productivity: Theory and methods,” in Environmental economics research and China’s green development strategy (China: Chinese Academy of Social Sciences), 217–243.
Liang, X., Jin, X., Ren, J., Gu, Z., and Zhou, Y. (2020a). A research framework of land use transition in Suzhou City coupled with land use structure and landscape multifunctionality. Science of the Total Environment 737, 139932. doi:10.1016/j.scitotenv.2020.139932
Liang, X., and Li, Y. (2020). Identification of spatial coupling between cultivated land functional transformation and settlements in Three Gorges Reservoir Area, China. Habitat International 104, 102236. doi:10.1016/j.habitatint.2020.102236
Liang, X., Li, Y., Ran, C., Li, M., and Zhang, H. (2020b). Study on the transformed farmland landscape in rural areas of southwest China: A case study of chongqing. Journal of Rural Studies 76, 272–285. doi:10.1016/j.jrurstud.2020.04.017
Lin, H. C., Chou, L. C., and Zhang, W. H. (2020). Cross-Strait climate change and agricultural product loss. Environmental Science and Pollution Research 27 (12), 12908–12921. doi:10.1007/s11356-019-05166-2
Miller, R. E., and Blair, P. D. (2009). Input-output analysis: Foundations and extensions. Cambridge: Cambridge University Press.
Natural Disaster Yearbook (2019). National cardiovascular data registry. Available at: https://www.itdr.tw/dispPageBox/getFile/GetView.aspx?FileLocation=PJ-SITEVC%5CFiles%5CPrjFiles%5C140%5C&FileFullName=%E5%85%A8%E6%96%87%E5%A0%B1%E5%91%8A.pdf&FileName=FR3098761927NXp2h.PDF.
Qin, G., Zhang, P., Hou, X., Wu, S., and Wang, Y. (2020). Risk assessment for oil leakage under the common threat of multiple natural hazards. Environmental Science and Pollution Research 27 (14), 16507–16520. doi:10.1007/s11356-020-08184-7
Rehman, A., Ma, H., Khan, M. K., Khan, S. U., Murshed, M., Ahmad, F., et al. (2022). The asymmetric effects of crops productivity, agricultural land utilization, and fertilizer consumption on carbon emissions: Revisiting the carbonization-agricultural activity nexus in Nepal. Environmental Science and Pollution Research 29 (26), 39827–39837. doi:10.1007/s11356-022-18994-6
Saeed, M., Maqbool, A., Ashraf, M. A., Arshad, M., Mehmood, K., Usman, M., et al. (2021). Competency of groundwater recharge of irrigated cotton field subjacent to sowing methods, plastic mulch, water productivity, and yield under climate change. Environmental Science and Pollution Research 29, 17757–17771. doi:10.1007/s11356-021-17017-0
Sahana, M., Rehman, S., Paul, A. K., and Sajjad, H. (2021). Assessing socio-economic vulnerability to climate change-induced disasters: Evidence from sundarban biosphere reserve, India. Geology, Ecology, and Landscapes 5 (1), 40–52. doi:10.1080/24749508.2019.1700670
Shibusawa, H., and Matsushima, D. (2021). Assessing the economic impact of tsunami and nuclear power plant hazards in shizuoka, Japan: A dynamic inter-regional input–output (IRIO) approach. Asia-Pacific Journal of Regional Science, 1–27.
Shiu, C. J., Liu, S. C., and Chen, J. P. (2009). Diurnally asymmetric trends of temperature, humidity, and precipitation in Taiwan. Journal of climate 22 (21), 5635–5649. doi:10.1175/2009jcli2514.1
Sperling, L. L. (2021). Flooded jobs: Income development after the 2007 tabasco flood. Climate and Development 14, 321–346. doi:10.1080/17565529.2021.1922335
Su, W. R., Hsu, P. H., Wu, S. Y., Lin, F. T., and Chou, H. C. (2010). Development of safe taiwan information system (SATIS) for typhoon early warning in taiwan. Journal of Systemics, Cybernetics and Informatics 8 (4), 48–52.
Xie, L., Chen, C., and Yu, Y. (2019). Dynamic assessment of environmental efficiency in Chinese industry: A multiple DEA model with a gini criterion approach. Sustainability 11 (8), 2294. doi:10.3390/su11082294
Yeh, H. T., Cheah, H. Y., Chiu, M. C., Liao, J. R., and Ko, C. C. (2021). Assessment of potential invasion for six phytophagous quarantine pests in Taiwan. Scientific reports 11 (1), 10666–10715. doi:10.1038/s41598-021-89914-w
Yu, J., Hu, P., and Chou, L. (2019). Apply supply-driven input-output model to evaluate economic losses from coastal typhoons. Journal of Coastal Research 96 (SI), 26–31. doi:10.2112/si96-005.1
Keywords: output efficiency, agricultural losses, drainage facility, Taiwan, typhoon
Citation: Wei W, Qian X, Zheng Q, Lin Q, Chou L-C and Chen X (2023) Spatio-temporal impacts of typhoon events on agriculture: Economic losses and flood control construction. Front. Environ. Sci. 10:1055215. doi: 10.3389/fenvs.2022.1055215
Received: 27 September 2022; Accepted: 15 December 2022;
Published: 06 January 2023.
Edited by:
Zhanhong Wan, Zhejiang University, ChinaReviewed by:
Muhammad Sajjad, Hong Kong Baptist University, Hong Kong SAR, ChinaMuhammad Kamran Khan, Bahria University, Pakistan
Copyright © 2023 Wei, Qian, Zheng, Lin, Chou and Chen. This is an open-access article distributed under the terms of the Creative Commons Attribution License (CC BY). The use, distribution or reproduction in other forums is permitted, provided the original author(s) and the copyright owner(s) are credited and that the original publication in this journal is cited, in accordance with accepted academic practice. No use, distribution or reproduction is permitted which does not comply with these terms.
*Correspondence: Li-Chen Chou, bGN6aG91QHN0dS5lZHUuY24=