 Panpan Zhao
 Bingbo Xie1
 Bo Qu
Bo Qu- 1College of Water Resources, North China University of Water Resources and Electric Power, Zhengzhou, China
- 2Henan Key Laboratory of Water Resources Conservation and Intensive Utilization in the Yellow River Basin, Zhengzhou, China
- 3Yellow River Institute of Hydraulic Research, Zhengzhou, China
Current climate change has led to frequent drought events in the Weihe River Basin, and the risks and impacts of drought are becoming increasingly severe. In order to study meteorological drought and hydrological drought at different scales and the propagation of drought between them, in this study, meteorological and hydrological drought conditions were calculated for 3-, 6-, 9-, and 12-month timescales based on 56 years of monthly precipitation and monthly runoff data of the Weihe River Basin using the Standardized Precipitation Index (SPI) and the Streamflow Drought Index (SDI), respectively. We explore analyzing the differences between them and their relationship and establishing regression equations based on the relationship and the dynamic propagation time of meteorological and hydrological droughts at different timescales. The results demonstrate that 1) the frequencies of both meteorological and hydrological droughts have shown an increasing trend in the last 56 years; 2) the relationship between meteorological drought and hydrological drought varied over time; 3) according to dynamic change analysis, propagation time tends to be shorter on the 3-month timescale and longer on the 6-month, 9-month, and 12-month timescales; and 4) the accelerated propagation time between meteorological drought and hydrological drought may be related to the increase in precipitation and temperature. The findings not only provide scientific support for the formulation of drought prevention and disaster reduction strategies in this basin but also have important scientific and practical application value.
1 Introduction
Drought is a complex and one of the most serious natural hazards (Lesk et al., 2016). Drought is very harmful, and prolonged drought can have some impact on social and national development (Qu et al., 2018). According to the statistics, crop loss due to drought in China accounts for 60% of the total loss from various natural disasters (Yao et al., 2010). Since the process of drought formation and the factors that affect drought formation are different, drought is often divided into meteorological drought, agricultural drought, hydrological drought, and socioeconomic drought (Xu et al., 2019). Drought propagation is defined as the transmission of water loss signals between different types of droughts (Lucas et al., 2013). Some studies have shown that a lack of rain primarily causes meteorological drought (Liu et al., 2021). Insufficient rainfall in the long term will lead to insufficient surface water and runoff unavailability; hence, runoff will be less than normal, resulting in a hydrological drought. It takes a certain amount of time for meteorological drought to spread to hydrological drought (Q. Zhang et al., 2011). Wang et al. (2021) concluded that climate change accelerated meteorological drought to hydrological drought by 3 months, and human activities delayed transmission by 11–12 months. Xing et al. (2021) concluded that under the influence of reservoir operation, the frequency of hydrological drought is significantly increased and the correlation between meteorological drought and hydrological drought decreases. Analyzing the propagation time from meteorological drought to hydrological drought is critical for forming a basis for establishing a hydrological drought early warning system. However, it also has important scientific significance in studying the transmission mechanism from meteorological drought to hydrological drought.
Drought indices are often used to describe the characteristics of a drought (Qu et al., 2014); there are many different and unified drought indicators at present. In 1993, McKee et al. (1993) proposed the Standardized Precipitation Index (SPI), which has the advantages of easy data collection, a relatively simple calculation process, and good stability, being suitable for multiple timescales. Nalbantis (2008) proposed the Streamflow Drought Index (SDI), which is like the SPI in calculation and also applicable to multiple timescales. Recently, drought propagation has become a hot topic in the field of hydrology and water resources, and the study of drought propagation is an important part of revealing the process of drought formation (Huang et al., 2015; Wu et al., 2018). T. Zhang et al. (2022) proposed an effective framework to comprehensively assess the impact of human activities on hydrological and drought changes in the Weihe River Basin at different periods. Ho et al. (2021) established a new framework for calculating the transmission time, measuring temporal changes (transmission time) in the areas affected by drought. Zhou et al. (2021) introduced a nonlinear correlation with the Directional Information Transfer Index (DITI) to build a new drought response time (DRT) evaluation system and then determined the trigger threshold from meteorological drought to hydrological drought. Ding et al. (2021) used SPE, SRI, and scPDSI to represent meteorological drought, agricultural drought, and hydrological drought, respectively, to explore the interaction of multiple droughts between different climatic zones and seasons in China. The abovementioned research is mainly to choose appropriate drought indicators to characterize the drought and describe the drought transmission process and clarify the drought transmission mechanism by discussing the drought transmission time. At the same time, it is beneficial to reveal the process of drought formation and lay the groundwork for future drought alerts.
In this paper, we use the Mann–Kendall (M–K) trend analysis method to analyze the evolution trend of meteorological drought and hydrological drought at different scales, studying the lead–lag relationship between meteorological drought and hydrological drought, establishing a regression equation between them, and exploring the propagation time of meteorological drought across different timescales. It is useful to reveal the propagation process and discover the range of dynamic changes between them. Therefore, it improves the accuracy of hydrological forecasting and provides scientific and technical support for drought prevention in the Weihe River Basin.
2 Study area and methodology
2.1 Study area
As the largest tributary of the Yellow River, the Weihe River Basin (Figure 1) originates from Niaoshu Mountain in Weiyuan, Gansu, and flows through the three provinces (regions) of Gansu, Ningxia, and Shaanxi, between 103° and 110°E and 34° and 38°N, with a total mainstream length of 818 km and a basin area of 134,800 km2, representing 18% of the Yellow River basin area (Yuan, 2008). As the Weihe River Basin is in the continental monsoon climate zone, there is less rain in spring, hot and rainy in summer, cold and wet weather in autumn, and less rain in winter. The average annual precipitation is about 580 mm (Ma, 2019), and the average annual temperature is 10.0°C (Song et al., 2007).
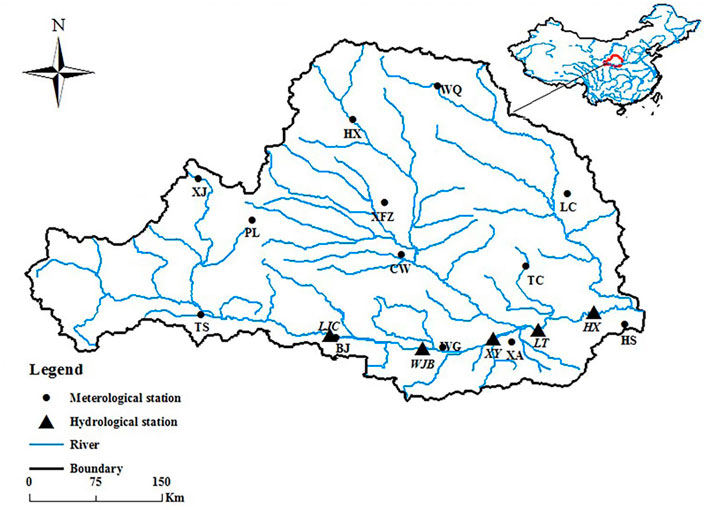
FIGURE 1. The weihe River Basin map.
Daily precipitation temperature data from 13 standard meteorological stations within the basin were obtained from the China Meteorological Administration (http://data.cma.cn/) covering the period from 1960 to 2018. These stations contain high-quality data preserved according to the standard methods by the National Meteorological Administration of China, which enforces data quality control before releasing the data. The monthly streamflow data are derived from the daily runoff data recorded by the HX hydrological station and were obtained from the Institute of Soil and Water Conservation of the Chinese Academy of Sciences and Ministry of Water Resources (http://loess.geodata.cn), covering the period from 1960 to 2018.
2.2 Methodology
2.2.1 Standardized Precipitation Index (SPI)
In 1993, the SPI was used for the first time to describe the meteorological drought in Colorado, United States. As rainfall varies greatly at different periods and the rainfall distribution obeys an asymmetric distribution, the analysis of the rain process requires the use of a gamma distribution function to describe the change in rainfall, and then the SPI value is calculated from normal standardization (McKee et al., 1993). The calculation method is as follows:
If the measured rainfall of a time series is
where
The SPI calculation formula (Nalbantis et al., 2009) is as follows:
where
To eliminate drift from the accumulated rainfall, another SPI calculation formula is as follows:
where
Here,
In our research, four timescales (3, 6, 9, and 12 months) were selected based on the hydrological year of the Weihe River Basin. The classification of meteorological droughts was as follows: no drought
2.2.2 Streamflow Drought Index (SDI)
The SDI was used for the first time by Nalbantis et al. (2009) to validate data from two river basins in Greece, and it is generally a drought index used to represent hydrological drought. The calculation method is similar to the SPI meteorological drought index. To eliminate the deviation of the accumulated runoff deviation, the SDI calculation formula is as follows:
where Vi,j is the accumulated runoff, and
2.2.3 Mann–Kendall method
The nonparametric Mann–Kendall test is a trend test established based on data sequence ordering and time order correlation. Currently, this method has been widely used in analyzing trends and testing the significance of rainfall, temperature, and hydrological series. The Mann–Kendall test determines the chance for a climate mutation in the climate sequence to occur (Yu, 2013).
In order to analyze the trend in the number of months of meteorological drought and hydrological drought that occur each year and the dynamic trend of drought propagation time, we first calculated the number of months that occur in each year and the drought propagation time, and then the M–K trend analysis method was applied. To understand whether the number of months of meteorological drought and hydrological drought occurring each year changed abruptly, the M–K abrupt change method was employed to analyze the number of months that occurred.
3 Results and discussion
3.1 Analysis of meteorological and hydrological droughts
The meteorological drought index SPI in the Weihe Basin on four timescales is shown in Figure 2. In this region, drought events were not the same at different computational timescales: findings indicated that there were more drought events in the case of the 12-month scale (March–February) than in the other three timescales. In terms of drought severity, there was one light drought event and one severe drought or extreme drought event on the 3-month timescale (March–May), 6-month timescale (March–August), and 9-month timescale (March–November). On the 12-month timescale, there was one moderate drought event and 23 severe or extreme drought events. This happened because precipitation varies on different timescales.
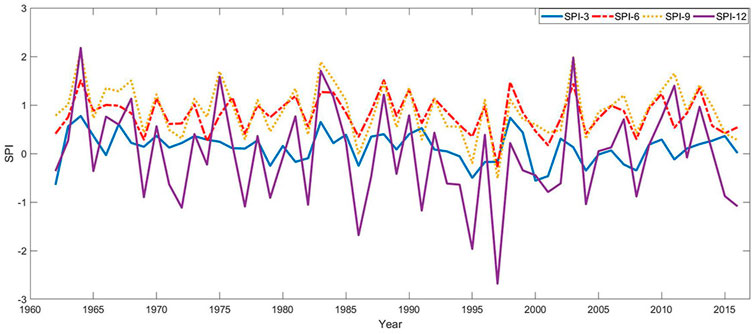
FIGURE 2. Meteorological drought on four time scales.
Using the hydrological drought index SDI to calculate the number of droughts and drought conditions in the Weihe Basin on four timescales (3-month, 6-month, 9- month, and 12-month), the result is shown in Figure 3. The numbers of hydrological droughts in four timescales were 35, 27, 22, and 31, respectively; among them, the light drought events occurred 25 times, 15 times, 15 times, and 10 times, respectively. The moderate drought events occurred five times, eight times, two times, and seven times, respectively. The events were five, four, five, and 14 times, respectively. Overall, there were more hydrological drought events on the 3-month timescale than on the 12-month timescale. This occurs in the Weihe Basin region because much of the winter precipitation falls in the form of snow, and, consequently, spring thaw can alter river flow regimes with the increased river flows in the March to May season.
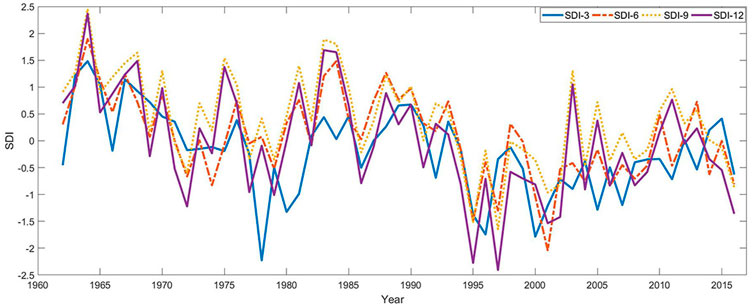
FIGURE 3. Hydrological drought on four time scales.
To better study the meteorological drought and hydrological drought throughout the hydrological year of the basin, the severity of the meteorological drought was analyzed based on a timescale of 12 months. The severity of the meteorological drought from 1961 to 2016 on a 12-month scale is shown in Figure 4. It appears that 1997 was the driest year, which was consistent with the record in the China Historical Drought Yearbook (1949–2000) (Sun et al., 2008). In addition, the severity of meteorological droughts has the most significant trend.

FIGURE 4. Meteorological drought and hydrological drought severity during 1961–2016 on a 12-month time scale.
Like the meteorological drought study, the severity of the hydrological drought on the 12-month timescale was analyzed. The result shows that there were 31 years of hydrological drought (Figure 4). Among them, 1997 was the most severe year of hydrological drought, and its SDI value was −2.4. According to the severity of the meteorological drought on the 12-month scale, the highest severity of the meteorological drought was the year 1997. The lack of precipitation in 1997 caused a meteorological drought and, at the same time, led to a significant reduction in surface runoff and the lack of groundwater replenishment, which caused severe hydrological droughts.
The Mann–Kendall method was used to analyze the changing trend of meteorological drought and hydrological drought numbers for the months from 1961 to 2016 on a 12-month timescale (as shown in Figure 5). The result showed an increasing trend during 1961–2016 in the number of meteorological drought months. The Z value of the M–K statistical test was 0.71, and under α = 0.05, the annual number of meteorological drought months from 1961 to 2016 did not increase significantly. Overall, the number of hydrological drought months that occur each year showed an increasing trend. The M–K statistical Z value was 0.84.
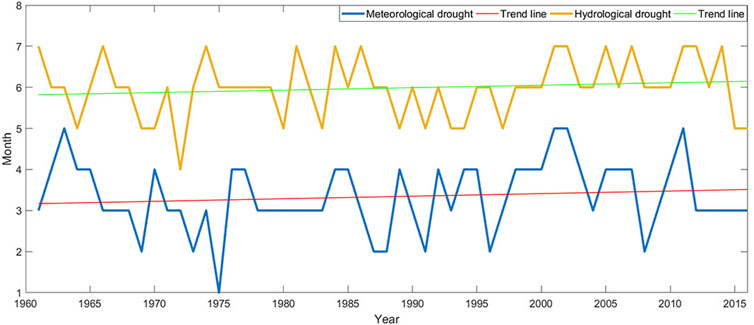
FIGURE 5. The Number of months of annual meteorological drought and hydrological drought from 1961 to 2016 on a 12-month time scale.
Furthermore, we tested the number of meteorological drought months (Figure 6) and the number of hydrological drought months (Figure 7) for mutations to understand whether the number of months in which drought occurs each year will change abruptly. The results showed that the number of meteorological drought months suddenly changed in 1967; the number of hydrological drought months mutated in 1963, 1965, and 1966, and all met the 95% confidence test.
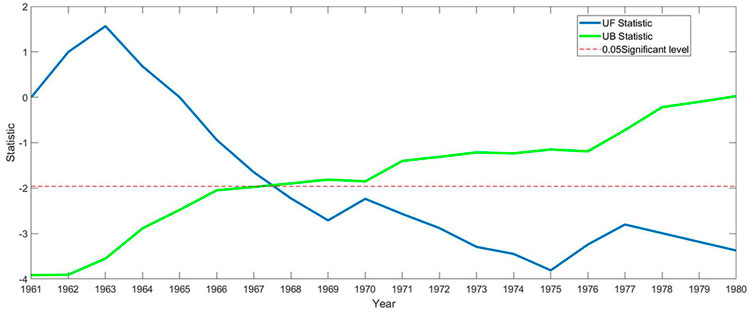
FIGURE 6. Meteorological drought month number mutation test.
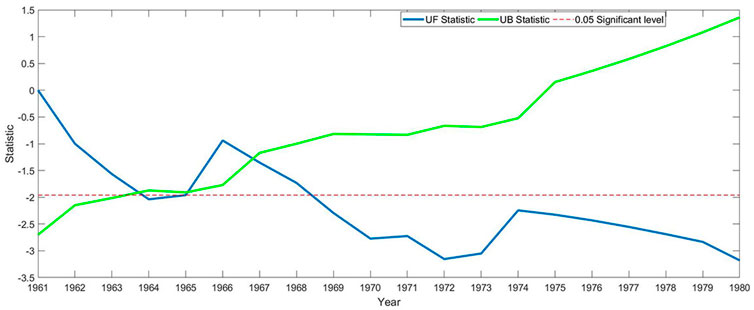
FIGURE 7. Hydrological drought month number mutation test.
3.2 Lead–lag relationship between meteorological drought and hydrological drought
To better analyze the relationship between meteorological drought and hydrological drought, we compared the meteorological drought index and the hydrological drought index with the 5-year moving average on four timescales. As shown in Figure 8, meteorological and hydrological droughts have similar but different trends. The relationship between the SPI and the SDI was strong on the 12-month timescale, and the relationship was weak on the 3-month timescale. The reason for this phenomenon on a 3-month timescale could be that melting snow increases runoff and the construction of storage reservoirs affects hydrological characteristics (Zhao et al., 2019). The construction of reservoirs affects the process of changing hydrological characteristics, increasing water storage and leakage losses. The amount of water used for irrigation increases, as well as the land use change, human activities, and other factors (He et al., 2015). There were two reservoirs in the Weihe River Basin in 2000, with a total reservoir storage of 2.73 billion m3 and a usable capacity of 1.55 billion m3; the effective irrigation area was 121,000 hm2 (Bi et al., 2013).
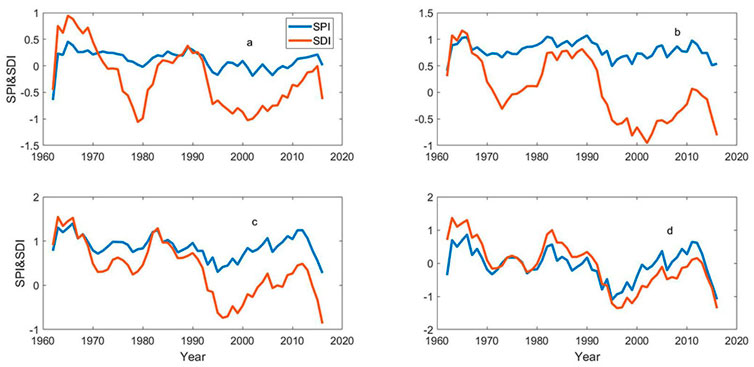
FIGURE 8. Moving average of the SPI and the SDI at different time scales. (A) is a 3-month timescale, (B) is a 6-month timescale, (C) is a 9-month timescale, and (D) is a 12-month time scale.
To estimate the impact of meteorological drought on hydrological drought, the lead–lag correlation coefficient between the SPI and the SDI was assessed (Figure 9). As shown in the figure, the SPI was 1 month behind the SDI for the 3- and 12-month timescales. The reason for this could be the hydrological drought caused by the reduction of surface runoff due to the construction of the reservoir and the meteorological drought caused by the absence of precipitation. For the 6-month timescale, the SPI was 2 months longer than the SDI, that is, the propagation time from meteorological drought to hydrological drought was 2 months. For the 9-month and 12-month timescales, the SPI was 2 months longer than the SDI. That is, the propagation time was 1 month.
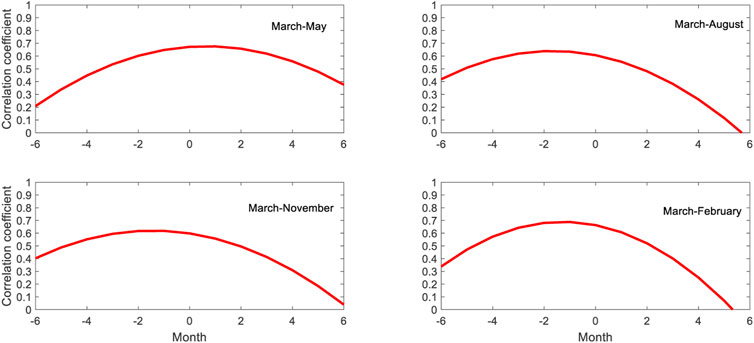
FIGURE 9. The Lead–lag correlation coefficient of the meteorological drought SPI index and the hydrological drought SDI index. “March-August” is a 3-month timescale, “March-August” is a 6-month timescale, “March-November” is a 9-month timescale, and “March-February” is a 12-month timescale.
3.3 Dynamic change of propagation from meteorological drought to hydrological drought at different timescales and the influence of hydrological factors on the propagation time
We analyzed the propagation time from meteorological drought to hydrological drought across the sequence, for a better understanding of the changing trend of drought propagation and to establish the basis for drought monitoring. The data from 1961 to 2016 were selected, having as the research object the sliding window of 30 years, divided into 27 groups to analyze the changing trend in the propagation time (Ma, 2019). The Z values obtained at different timescales are shown in Table 1. A positive value represents an upward trend and a negative value represents a downward trend, indicating that the propagation time becomes longer and shorter, respectively.

TABLE 1. Trend changes in the propagation time from meteorological drought to hydrological drought in the Weihe River Basin at different timescales.
Our assumption, based on Table 1, indicates that the propagation time from meteorological drought to hydrological drought in the Weihe River Basin has a decreasing (downward) trend on the 3-month timescale; it has an increasing (upward) trend on the other three timescales. There is an obvious upward trend at 12 months, and the test meets the significance test with 99% confidence. In other words, the propagation time becomes shorter on the 3-month timescale and longer on the 6-month, 9-month, and 12-month timescales.
The propagation from meteorological drought to hydrological drought was affected by different factors, which have different effects in different seasons. Among these factors, we noticed meteorological factors having the most direct impact. Its changes will affect the variations in precipitation and runoff and then directly affect the process of drought propagation. The propagation time from meteorological drought to hydrological drought is related to hydrological elements. The determination coefficients (R2) of temperature and precipitation and propagation time are calculated in this paper, and the results are shown in Figure 10. For the 3-month and 6-month timescales, the R2 values for temperature and precipitation for the propagation time were 0.72 and 0.69 and 0.90 and 0.78, respectively, indicating that temperature and precipitation had a greater impact on drought propagation time in these two scales. Conversely, the R2 values on both the 9- and 12-month timescales are lesser than 0.1, indicating that temperature and precipitation have very little effect on propagation time on both scales.
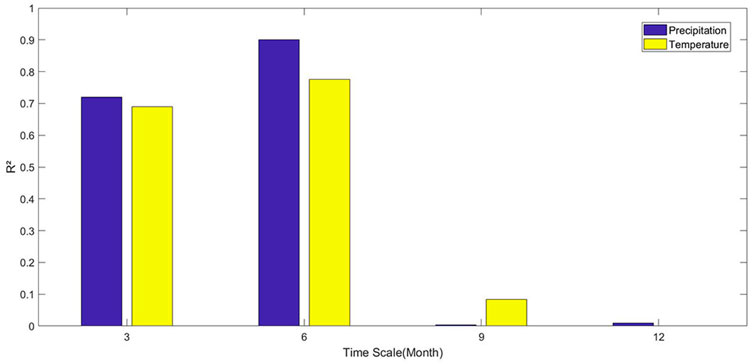
FIGURE 10. The Determination coefficient (R2) of the linear regression model between the propagation time and temperature and precipitation.
The results also show that temperature and precipitation have a greater effect on the drought propagation time in short timescales. Among them, the temperature has a greater influence on the drought propagation time. But as the timescale gradually increases from 6 months to 12 months, the impact on drought propagation time will become smaller and smaller, until it disappears.
4 Discussion
The dynamic propagation time of drought varies from time to time, mainly for the following reasons. 1) For the 3-month timescale, the melting surface snow leads to an increase in surface water, but most of the surface water forms groundwater by infiltration, which eventually leads to a decrease in surface water. Therefore, the propagation time from meteorological drought to hydrological drought is shortened. 2) For the 6-month and 9-month timescales, on the one hand, precipitation increases in summer, resulting in high soil moisture, and on the other hand, the temperature in autumn is low. Decreased rainfall will lead to meteorological drought; however, hydrological drought will react within a certain time. Therefore, the propagation time from meteorological drought to hydrological drought becomes longer. 3) For the 12-month timescale, in the whole hydrological year perspective, precipitation in winter decreases, but there will be snow, and after a meteorological drought, it will take longer to propagate to the hydrological drought.
5 Conclusion
This study analyzes the static and dynamic changes of meteorological and hydrological droughts in the Weihe River Basin on four timescales, and the following conclusions are drawn. 1) Severe or extreme meteorological drought events occurred more frequently in the Weihe River Basin based on the 12-month timescale than the other three timescales, but more hydrological droughts occur on the 3-month timescale. 2) The regression coefficients of a linear regression between the SPI and the SDI indicated that with increasing timescales, the regression coefficients become weaker. The reason for the differences between meteorological and hydrological droughts included, but was not limited to, climate change, variability, and human activities. 3) The number of meteorological drought months and hydrological drought months on the 12-month timescale showed an upward trend, and they mutated in 1967, 1963, 1965, and 1966, respectively. 4) For the 6-month timescale, the propagation time from meteorological drought to hydrological drought was 2 months, and its propagation time has an upward trend; for the 9-month and 12-month timescales, the propagation time was 1 month, and there is also an upward trend. 5) Temperature and precipitation have a strong influence on the drought propagation time of 3 months and 6 months, of which temperature is particularly prominent, and its R2 value reaches 0.90.
Data availability statement
Publicly available datasets were analyzed in this study. These data can be found here: http://data.cma.cn/ and http://loess.geodata.cn/.
Author contributions
PZ, BX contributed to the design and conception of the study. PZ, QB provided the experimental idea conception and methodological design, PZ, BX wrote the first draft of the manuscript. QB, XH contributed to the manuscript revision and provided financial support.
Funding
This work was supported by the National Natural Science Foundation of China (42001034, and 42207100), the Youth Science Foundation of Henan (212300410202) Key Science and Technology Program of Henan Province, China (222102320083).
Acknowledgments
The authors thank three reviewers and the editors for their thoughtful comments and suggestions. The authors also express their gratitude to EditSprings (https://www.editsprings.cn) for the expert linguistic services provided.
Conflict of interest
The authors declare that the research was conducted in the absence of any commercial or financial relationships that could be construed as a potential conflict of interest.
Publisher’s note
All claims expressed in this article are solely those of the authors and do not necessarily represent those of their affiliated organizations, or those of the publisher, the editors, and the reviewers. Any product that may be evaluated in this article, or claim that may be made by its manufacturer, is not guaranteed or endorsed by the publisher.
References
Bi, C., Mu, X., Zhao, G., and Bai, H. (2013). Effects of climate change and human activity on streamflow in the Wei River Basin. Sci. Soil Water Conservation 11 (2), 33–38.
Ding, Y., Gong, X., Xing, Z., Cai, H., Zhou, Z., Zhang, D., Sun, , and Shi, (2021). Attribution of meteorological, hydrological and agricultural drought propagation in different climatic regions of China. Agricultural Water Management 255, 106996. doi:10.1016/j.agwat.2021.106996
He, F., Hu, C., Wang, J., and Wang, Y. (2015). Analysis of meteorological and hydrological drought in the Yellow River basin during the past 50 Years based on SPI and SDI. Geogr. Geo-Information Sci. 23–235.
Ho, S., Tian, L., Disse, M., and Tuo, Y. (2021). A new approach to quantify propagation time from meteorological to hydrological drought. Journal of Hydrology 603, 127056. doi:10.1016/j.jhydrol.2021.127056
Huang, S., Huang, Q., Chang, J., Leng, G., and Xing, L. (2015). The response of agricultural drought to meteorological drought and the influencing factors: A case study in the wei river basin, China. Agricultural Water Management 159, 45–54. doi:10.1016/j.agwat.2015.05.023
Lesk, C., Rowhani, P., and Ramankutty, N. (2016). Influence of extreme weather disasters on global crop production. Nature 529 (7584), 84–87. doi:10.1038/nature16467
Liu, Y., Huang, S., and Fang, W. (2021). Propagation and dynamic change of meteorological drought to hydrological drought in different seasons. J. Hydraul. Eng. 52, 93–102.
Lucas, W. J., Groover, A., Lichtenberger, R., Furuta, K., Yadav, S. R., Helariutta, Y., He, , Fukuda, , Kang, , Brady, , Patrick, , Sperry, , Yoshida, , López-Millán, , Grusak, , and Kachroo, (2013). The Plant Vascular System: Evolution, Development and FunctionsF. J. Integr. Plant Biol. 55 (04), 294–388. doi:10.1111/jipb.12041
Ma, L. (2019). Dynamic change of propagation from meteorological drought to hydrological drought and the driving forces. (master). China, Shan Xi Sheng: Xi'an University of Technology. Available from Cnki.
McKee, T. B., Doesken, N. J., and Kleist, J. The relationship of drought frequency and duration to time scales. Proceedings of the 8th Conference on Applied Climatology, 17(22), 179–183.3 January 1993 Anaheim, California
Nalbantis, I. (2008). Evaluation of a hydrological drought index. Eur. Water 23 (24), 67–77.doi:10.1007/s11269-008-9305-1
Nalbantis, I., and Tsakiris, G. (2009). Assessment of hydrological drought revisited. Water Resour. manage. 23 (5), 881–897. doi:10.1007/s11269-008-9305-1
Qu, Y., Li, J., Lü, J., Su, Z., Qiu, B., and Li, A. (2014). A quantitative framework for assessing drought disaster risk and key techniques. Adv. Water Sci. 25 (2), 297–304.
Qu, Y., Lü, J., Su, Z., Sun, H., and Ma, M. (2018). Research review and perspective of drought mitigation. J. Hydraul. Eng. 49, 115–125.
Song, J., Xu, Z., Liu, C., and Li, H. E. (2007). Ecological and environmental instream flow requirements for the Wei River-the largest tributary of the Yellow River. Hydrol. Process. 21 (8), 1066–1073. doi:10.1002/hyp.6287
Sun, Y., Zhang, S., Song, D., Zhang, Y., Song, H., and Gu, Y. (2008). Historical drought in China 1949-2000. China: Hohai University Press.
Wang, M. H., Jiang, S. H., Ren, L. L., Xu, C. Y., Menzel, L., Yuan, F., Xu, , Liu, , and Yang, , (2021). Separating the effects of climate change and human activities on drought propagation via a natural and human-impacted catchment comparison method. Journal of Hydrology, 603(PA). ARTN 126913126913, doi:10.1016/j.jhydrol.2021.126913
Wu, J., Chen, X., Yao, H., Liu, Z., and Zhang, D. (2018). Hydrological Drought Instantaneous Propagation Speed Based on the Variable Motion Relationship of Speed-Time Process. Water Resour. Res. 54 (11), 9549–9565. doi:10.1029/2018wr023120
Xing, Z., Ma, M., Zhang, X., Leng, G., Su, Z., Lv, J., Yu, , and Yi, (2021). Altered drought propagation under the influence of reservoir regulation. Journal of Hydrology 603 (PC), 127049. doi:10.1016/j.jhydrol.2021.127049
Xu, Y., Zhang, X., Wang, X., Hao, Z., Singh, V. P., and Hao, F. (2019). Propagation from meteorological drought to hydrological drought under the impact of human activities: A case study in northern China. Journal of Hydrology 579, 124147. doi:10.1016/j.jhydrol.2019.124147
Yao, G., and Yuan, M. (2010). International experience and reference for the construction of drought early warning system. NY China: China Emergency Management, 43–48.03
Yu, D., and Yuan, C. (2013). “Multivariate statistical model and application of extreme drought under the background of climate change,” in Study on hydrological drought characteristics of main rivers in Weihe River basin (Beijing China: Northwest A&F University). (master)Available from Cnki.
Zhang, Q., Zhang, L., Cui, X., and Zeng, J. (2011). Progresses and challenges in drought assessment and monitoring. Adv. Earth Sci. 26 (7), 763–778.
Zhang, T., Su, X., Zhang, G., Wu, H., Wang, G., and Chu, J. (2022). Evaluation of the impacts of human activities on propagation from meteorological drought to hydrological drought in the Weihe River Basin, China. Science of The Total Environment 819, 153030. doi:10.1016/j.scitotenv.2022.153030
Zhao, P., Lü, H., Wang, W., and Fu, G. (2019). From meteorological droughts to hydrological droughts: A case study of the Weihe River basin, China. Arab. J. Geosci. 12 (11), 364. doi:10.1007/s12517-019-4524-8
Keywords: meteorological drought, hydrological drought, dynamic changes, Weihe River Basin, drought propagation
Citation: Zhao P, Xie B, Huang X and Qu B (2022) The dynamic change of propagation from meteorological drought to hydrological drought at the basin scale: A case study from the Weihe River Basin, China. Front. Environ. Sci. 10:1054975. doi: 10.3389/fenvs.2022.1054975
Received: 27 September 2022; Accepted: 04 November 2022;
Published: 25 November 2022.
Edited by:
Yuanchun Zou, Northeast Institute of Geography and Agroecology (CAS), ChinaReviewed by:
Huicai Yang, Hebei GEO University, ChinaJunlong Zhang, Shandong Normal University, China
Copyright © 2022 Zhao, Xie, Huang and Qu. This is an open-access article distributed under the terms of the Creative Commons Attribution License (CC BY). The use, distribution or reproduction in other forums is permitted, provided the original author(s) and the copyright owner(s) are credited and that the original publication in this journal is cited, in accordance with accepted academic practice. No use, distribution or reproduction is permitted which does not comply with these terms.
*Correspondence: Bo Qu, cXVib19lZHVfaG9oYWlAMTYzLmNvbQ==