 Hongkai Qie
 Yudie Chao
 Qianwen Yang
 Yong Lu
- 1College of Humanities & Social Development, Nanjing Agricultural University, Nanjing, China
- 2College of Finance, Nanjing Agricultural University, Nanjing, China
The study examines the influence of the urban spatial structure on smog pollution and its mechanism of action using the panel data of Chinese cities from 2012 to 2017. Research suggests that the multi-center development of Chinese cities has aggravated regional smog pollution. Robustness test results support this finding. Results of the interaction term shed light on the fact that multi-center spatial development in backward regions can exert a greater influence on smog pollution. Meanwhile, suppose the research samples are divided by different zones. In that case, it can be observed that an inverted-U shape characterizes the multi-center development of regions of East China and smog pollution. This indicates that worsening smog pollution appears only as a periodical phenomenon of the pre-stage multi-center development of Chinese cities, which can be ushered into a turning point through certain paths. Analysis of the influence mechanism shows that the transport mode and the energy consumption intensity constitute two major channels for multi-center development of Chinese cities to affect regional smog pollution.
1 Introduction
Since 2013, smog pollution caused by a mixture of inhalable particles (Abbas et al., 2020; Abbas et al., 2022), PM10, and fine particulate matter PM2.5, has been rampant throughout China, causing serious concern for the Chinese government (Yuan et al., 2018; Liu et al., 2021). To protect the fundamental interests of the Chinese people and to ensure sound and sustainable development of the Chinese economy, the Central Committee of the Communist Party of China and the State Council have pinpointed the prevention and control of environmental pollution as a key task of improving people’s livelihood and promoting high-quality economic development. The “Air Pollution Prevention and Control Action Plan” issued by the State Council states expressly that the inhalable particle concentration of Chinese cities at the county level or above should be brought down by 10% in 2017 compared with that in 2012. The Chinese government and party have long been committed to promoting the treatment of smog pollution. But the ongoing efforts seem to have not yet found a radical solution to this problem besetting Chinese cities. Worse still, some Chinese regions have even experienced the aggravation of smog pollution. Therefore, tackling regional smog pollution has posed a severe challenge for China.
As an unpleasant outcome of urbanization, smog pollution has a close bearing on the spatial development of cities (Clark et al., 2011; Han et al., 2020; Liu et al., 2021). Examined by the formation mechanism, smog pollution is decided by the pollutant concentration, atmospheric conditions and air moisture (Li et al., 2022). Among these factors, pollutant concentration provides the material basis of pollution, which is closely related to the spatial development of cities. Driven by the clustering of elements and the intensity of human activities, there has been an increasing demand for motor vehicles and industrial emissions. Urban spatial development has also significantly changed the climate and air humidity. Therefore, whether regional environmental protection can be realized via proper urban spatial development modes is not only a major concern for the Chinese government and party but also a theoretical issue urgently requiring further academic discussions.
A majority of scholars have been interested in investigating how to address regional smog pollution and have achieved fruitful findings. Their research generally focuses on economic development (Cheng et al., 2017; Xie et al., 2019), demographic distribution (Yu et al., 2020), industrial structure (Bao and Yao, 2016; Hao and Liu, 2016), technological innovation (Abbott, 2017) and environmental regulation (Dong et al., 2020; Gan et al., 2021). All these research attempts can contribute to a better understanding of the formative factors of smog pollution in China. Nevertheless, Chinese scholars have failed to reflect on smog pollution from the perspective of spatial development (either single-center or multi-center). Facts have revealed that multi-center spatial development has a pronounced influence on regional smog pollution.
On the one hand, multi-center spatial development can alleviate traffic jams in downtown areas, reduce excessively high population density, and reduce concentrated environmental pollution. On the other hand, multi-center spatial development can aggravate regional smog pollution. Diffusion of resources has deprived regional production of the cluster advantage. The scattered spatial layout of industries has also increased the cost of environmental management. All this can result in the worsening of smog pollution. Therefore, the correlation between smog pollution and regional multi-center development involves various factors. It is a thought-provoking issue whether the acceleration of multi-center spatial development in Chinese cities can aggravate or mitigate smog pollution. The extant literature still lacks clear empirical evidence and a mechanism explanation for this issue.
To better clarify the correlation between smog pollution and multi-center spatial development of Chinese cities, this study adopts panel data from 2012 to 2017 as research samples. It develops the multi-center index based on the global night light data to measure the multi-center spatial development of Chinese cities. Moreover, the satellite-measured PM2.5 concentration is used to denote smog pollution and examine the influence of urban spatial structure on smog pollution and its mechanism of action.
The study has four main contributions. First, the urban spatial structure indicated by the pollution size or the land area might have dimensional defects. Therefore, this study pursues vectorization of the night light data to construct the multi-center index to measure the internal spatial structure of a city and empirically study the influence of multi-center development on smog pollution. Second, multi-center development’s positive and negative influences on smog pollution are studied under the same framework. Third, the heterogeneity influence of multi-center development at different economic levels on smog pollution is explored. Fourth, the mediating effect model is employed to identify the mechanism of action behind the influence of multi-center spatial development of cities on smog pollution.
The article is divided into four sections. Section 1 belongs to the introduction. Section 2 focuses on theoretical analysis. Section 3 relates to research methodology. Section 4 emphasis on results and discussion. Section 5 explains the influence difference and mechanism analysis. Similarly, Section 6 summarizes the main findings of the study and proposes policy implications.
2 Theoretic analysis
Multi-center development is, in essence, a multi-center spatial structure formed by a relatively balanced distribution of elements among different cities within one region (Gebremariam et al., 2012). Therefore, agglomeration theory can be used to investigate the influence of multi-center development on smog pollution, combining the resource aggregation effect, population agglomeration effect, and concentrated pollution treatment effect. What makes it possible for cities to maximally optimize resource allocation and improve resource utilization efficiency, thus reducing regional environmental pollution, is the positive agglomeration effect brought by the concentration of resources in central cities. Population agglomeration can increase the utilization efficiency of regional infrastructures, which can further improve the quality of the regional environment (Andreoni and Levinson, 1998; Castells-Quintana et al., 2021). At the same time, a higher population agglomeration can bring down the cost of public supervision but increase the earnings of supervision; this can stimulate public demand for supervision and positively promote regional pollution emission reduction and pollution treatment (Leeuwen, 2004). Central cities can effectively allocate resources to set up a comprehensive public transport service system and a pollution treatment and discharge system. All of this is beneficial to concentrated prevention and control of pollutants.
But after the development scale is beyond the bearing capacity of downtown areas, resource agglomeration can negatively influence the environment. Particularly in megacities such as Beijing, Shanghai and Guangzhou, the excessive accumulation of population and industries have given rise to myriad urban problems, such as traffic congestion and environmental pollution. Pressured by the flow of population to central cities, residence, business, and production areas have constantly been expanding, which has inevitably increased the demand for high-energy-consuming and high-pollution products, such as cement, steel and iron, and coal. When the resident population of central cities is close to saturation, the phenomenon of people living and working in different areas will be growingly prominent. The lengthening of commuting distance and time can aggravate traffic jams and emissions of motor vehicle exhaust (Zhang et al., 2021).
To summarize, multi-center development and smog pollution are not governed by a simple linear correlation. The influence of multi-center development at different stages on smog pollution might be varied. Thereby, we propose the first hypothesis as below:
3 Research methodology
3.1 Measurement model
In this study, we adopt the panel data model to examine the influence of multi-center development on smog pollution.
where the subscript i is used to denoting the region; t denotes the year; PMit denotes the PM2.5 concentration of city i at the point of time, t; qit denotes the multi-center index of city i at the point of time, t; X is the control variable which can affect the smog pollution; μi and γt represent the region and year fixed effect, respectively; β0 stands for the intercept parameter; β1 and β2 represent the regression coefficient; ε indicates the impact of other random factors. The error term is assumed to be normally distributed at zero mean value and constant variance (Elahi et al., 2021; Elahi and Khalid, 2022).
3.2 Smog pollution
The influence of multi-center spatial structure on smog pollution is the research issue of this paper. We adopt the global PM2.5 raster data published by the Atmospheric Composition Analysis Group affiliated to Dalhousie University. Compared with air pollutant data measured by ground monitoring spots, the global air pollution data obtained by remote sensing retrieval demonstrate better spatial continuity. They can help measure the pollutant spatial distribution and changes. This study converts the annual global PM2.5 raster data reprojection into Lambert conformal conic projection. Meanwhile, it was cut by China’s administrative boundary to extract the average annual PM2.5 concentration data1 of different Chinese cities in 2017.
3.3 Multi-center index
We used the night light data to measure the regional multi-center spatial development level. Currently, the multi-center index is usually based on the population size or the land area. Thus, the measurement index cannot provide a full picture of the regional multi-center spatial development level. Additionally, unlike most countries, China organizes its urbanization on the basis of the household registration system, which separates rural areas from urban areas. Consequently, the household type and the flow of the population are inconsistent. Because of the inconsistency, population flow has been restricted, and the regional multi-center index thus measured is smaller than the actual value. Similarly, the measurement means based on the land area is also faced with some challenges, for the land use type and area published by the national government are limited to the provincial and municipal levels.
In contrast, the multi-center index obtained from the night light data can favorably address the problems mentioned above. The night light data are acquired by the VIIRS, which is carried out by the National Polar-orbiting Operational Environmental Satellite System Preparatory Project (NPP). The data thus acquired have a higher definition and sensitivity than the DMSP-OLS night light data. The China Remote Sensing Satellite Ground Station of the Chinese Academy of Sciences, after statistical cleaning and an average noise reduction of the new-generation night light images, NPP-VIIRS, turns the data into a complete data product via smooth transition. On that basis, constraints are established for the annual data product to realize smoothening of interferences beyond earth surface data between different years. The difference between annual data products is equivalent to the difference between the earth’s surface light. As an indicator of human activities, the night light can reflect the population agglomeration degree, active economic degree and other social and economic conditions. In turn, the conditions above reflected by the night light data can describe the development status of a country or a region. This paper uses the night light data product processed by the Chinese Academy of Sciences, and the annual global light image data reprojection is converted into the Lambert conformal conic projection. Following that, the data are cut by China’s administrative boundary to obtain the night light data within Chinese administrative regions at a spatial resolution of 500 m from 2012 to 2017, respectively.
Combining the night light data and following the spirit of Meijers and Burger (2010) and Liu et al. (2020) in measuring the regional multi-center spatial structure, the following equation is built:
where Pi stands for the night light luminance of the county i; C denotes the constant term; Ri represents the ranking (in descending order) of the total night light illuminance of the county i in the city to which it belongs to. Substitute the total light illuminance of different counties and their corresponding ranking into the formula to obtain the coefficient, q, the urban multi-center index. The larger q is, the more likely the city’s internal spatial structure features a multi-center one. On the contrary, it tends to be a single-center one. While measuring the regional multi-center index, scholars can consider the importance of fixed ranking. In the end, they will take the top 1, top 3 and top 4 for computing to ensure the comparability of the multi-center index in different provinces. We think that all counties reflect a city’s multi-center/single-center spatial structure. Including all counties in the measurement formula can more accurately reflect the regional multi-center and single-center characteristics. Besides, research findings that consider the fixed ranking are not significantly varied from results not considering it (Li et al., 2019).
To reduces the heterogeneity among cities, the research samples do not include Hong Kong, Macau, Taiwan, four municipalities, and other county-level units, such as states, alliances and regions. Because of data inadequacy, Tibet, Qinghai, and Hainan are not included. Besides, regions under the administration of Jiyuan City, Dongguan City, and Zhongshan City are also eliminated.
3.4 Intervening variables
Intervening variables of this paper include the travel mode, energy consumption intensity, degree of industrial agglomeration, and level of environmental regulation. The travel mode is indicated by the regional per capita public bus service. The energy consumption intensity is measured by the total industrial electricity utilization percentage in the total regional industrial output. The degree of industrial aggregation is measured by the number of industrial enterprises in the regional unit area. The environmental regulation level is reflected by the ratio of industrial waste emissions to the total industrial output.
3.5 Control variables
The control variables include regional economic development, foreign direct investment (FDI), industrial structure, population density, urbanization ratio, urban greening, urban innovation, and climate conditions. The regional economic development level is denoted by the per capita GDP and is processed by the GDP deflation index, with 2012 as the base period. The percentage of FDI in GDP measures FDI. The industrial structure refers to the output percentage of the second industry in GDP. The population size calculates the population density within the regional unit area. The percentage of the non-agricultural population can give the urbanization rate in the total regional population. Urban greening can be measured as the percentage of public green areas in the land area. Urban innovation is measured by the number of regional per capita patents. Climate conditions are measured by annual regional average temperature and precipitation.
This study adopts the statistics of Chinese cities from 2012 to 2017, which contain 1,578 observed values, as balanced panel data. These statistics consist of satellite-monitored data and officially-published yearbook data. The smog data are from the Atmospheric Composition Analysis Group, affiliated with Dalhousie University. The light data are contributed by the China Remote Sensing Satellite Ground Station of the Chinese Academy of Sciences. Other variable data are from the “Statistical Yearbooks of Chinese Cities” and the statistical yearbooks of different provinces in different years. The temperature and precipitation data are from the China Meteorological Data Service Center. Besides, we try to supplement the missing value based on statistical yearbooks of different regions. If the observed value of the same index fluctuates dramatically in adjacent years, it will be replaced after being verified by statistical yearbooks of different places. The descriptive statistics of variables are shown in Table 1.
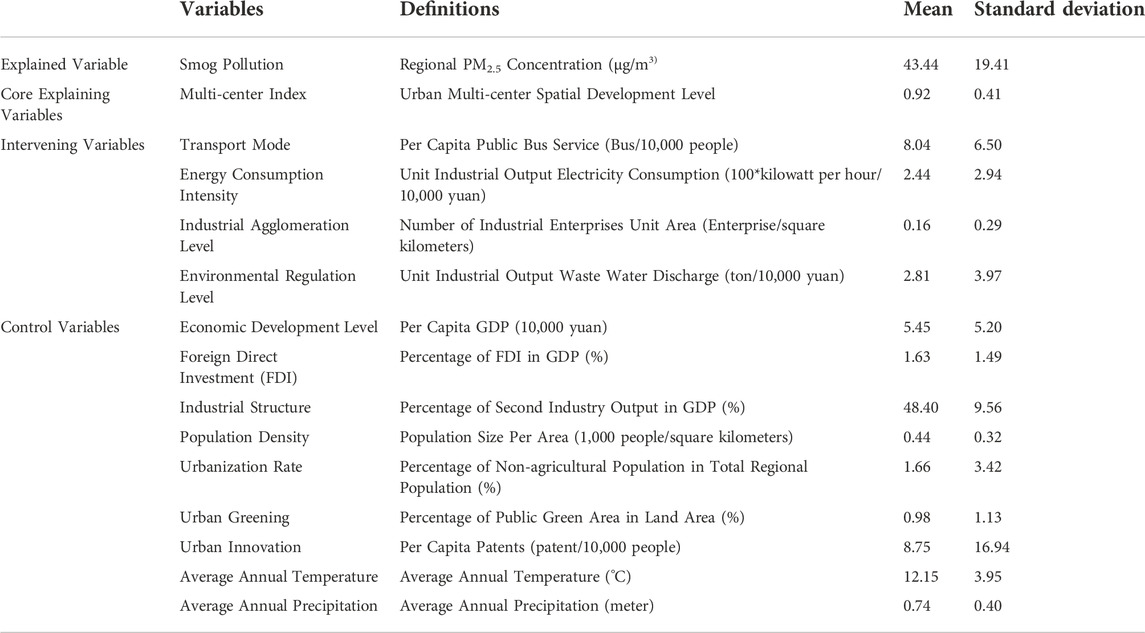
TABLE 1. Descriptive statistics of variables.
4 Results and discussion
4.1 Multi-center development and smog pollution
In the study, a regression analysis of explained variables such as smog pollution and multi-center index is performed. Compared with Columns (3) and (4), Columns (1) and (2) of Table 2 added the quadratic term of multi-center index to the estimation model. The results of the Hausman test are statistically significant at 1%. This means that the fixed effect model should be chosen. Therefore, Columns (1) and (3) estimation results required further attention. When the quadratic term of multi-center index is added to the model, the quadratic term coefficient fails to pass the significance test. In other words, there is no inverted U-shaped correlation between the multi-center index and smog concentration. According to the EKC curve verification process, the quadratic term is eliminated for another round of regression. The multi-center index coefficient is significantly positive at the significance level of 1%. This means that the multi-center spatial development has aggravated regional smog pollution. This suggests that H1 proposed by this paper is not substantiated. The multi-center development of Chinese cities is still in a worsening state of smog pollution.

TABLE 2. Regression results of multi-center development and smog pollution.
Resource integration, population aggregation and concentrated pollution treatment can all promote the development of central cities and reduce smog pollution. The concentration of elements enables a full play of the agglomeration effect of central cities as well as efficient utilization of resources. Population agglomeration can improve the utilization efficiency of infrastructures and provide public monitoring of environmental regulation. Through reasonable utilization of resources, central cities can finish constructing the public transport service system and pollution treatment and discharge system. Therefore, agglomeration of elements can alleviate regional environmental pollution at the early development stage.
When the actual resource bearing of central cities is beyond the environmental bearing capacity, resource agglomeration can lead to the worsening smog pollution. Under this condition, multi-center spatial development is conducive to mitigating pollution through reduction of energy consumption, diffusion of high-pollution industrial clusters, and improvement of regional environmental standards. However, estimation results of this paper suggest that multi-spatial development within a city has aggravated smog pollution to a larger extent than reduced the latter.
The regression coefficient of other control variables is basically consistent with the expectation. The economic development level has a negative influence on smog pollution. This means that regions with a higher economic development level have adequate funds for local pollution treatment. Meanwhile, economic growth can also increase residents’ requirements for the quality of the environment. In this process, the economic development level can play the role of informal environmental regulation. The industrial structure has significantly reduced smog pollution. The increasing percentage of the second industry characterized by high energy consumption and pollution has a significantly positive influence on smog pollution.
The influence of urban greening on regional smog pollution is significantly negative. Favorable greening areas of a city can help purify the air by filtering and absorbing dust.
At last, dust is found to have a significantly positive influence on regional smog pollution. When the temperature rises, the aerosol concentration will speed up its increase. Thereby, smog will be hard to diffuse. This is also why a high temperature can lead to a worsening of regional smog.
4.2 Analysis of interaction term
Considering the relevance between the multi-center spatial development of a region and the economic development level, the interaction term between the aforesaid two variables is added to the model for further analysis. As one can observe from Table 3, the regression results with and without adding the control variable show good agreement with each other. The influence of the interaction term on smog concentration is significantly negative. This means that, compared with developed regions, regions with backward economic development experience a stronger negative influence of multi-center development on smog pollution. Restricted by backward economic development, infrastructure construction and fiscal support will be limited. The low production efficiency caused by multi-center spatial development of these regions can compound smog pollution.
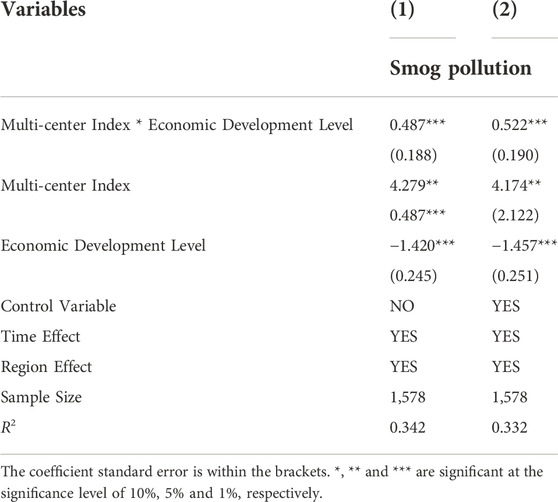
TABLE 3. Regression results of the interaction term.
Additionally, local governments are eager to seek economic growth, thus showing too much preference for industrial development. Under this condition, the local governments do not have adequate funds to invest in public transport and technological innovation. Consequently, smog pollution can be aggravated.
4.3 Robustness test
To verify the robustness of estimation results given by the model of this paper, the explained variable and the explaining variable are alternatively chosen. Specifically, following the spirit of Meijers and Burger (2010), cities ranking in the top 2, top 3 or top 4 in a province are adopted for regression by Eq. 1. The mean of the multi-center index, q, obtained by the three regressions is the new multi-center index of the province. The new variable is used to replace the multi-center index in the benchmark model for regression. Second, the average annual PM2.5 concentration of inhalable of newly-increased cities in “Statistical Yearbooks of China 2019” is used to replace the satellite-monitored smog data. The results are reported in Table 4.
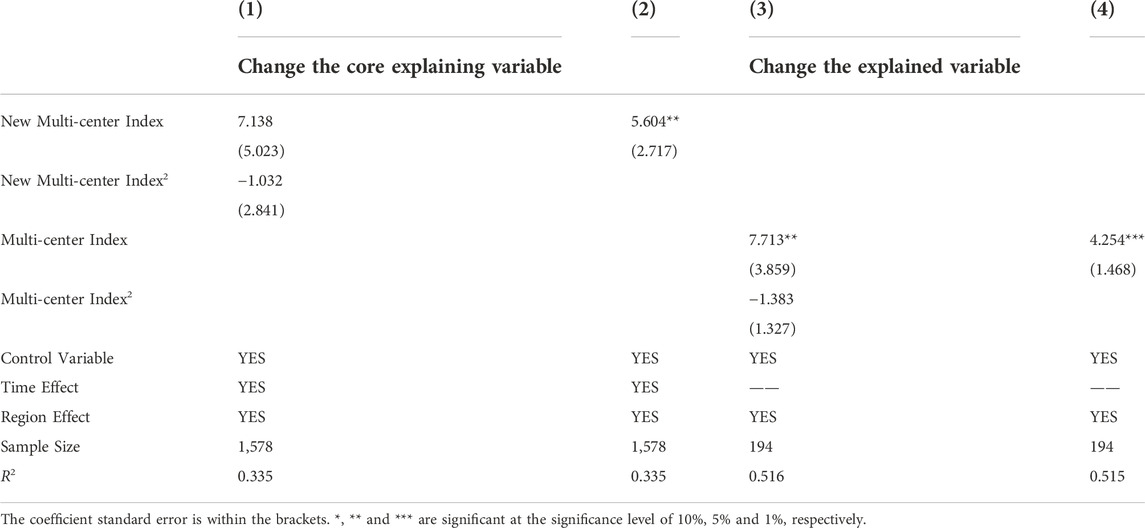
TABLE 4. Results of robustness test.
It is obvious that the multi-center index’s positive influence on smog pollution remains significant at the significance level of 1%. Besides, the quadratic term has failed to pass the significance test. The correlation between multi-center development and smog pollution is not a significant inverted-U shape but a significantly positive monotonic one. This can provide solid evidence for the high robustness of benchmark analysis in the previous part.
4.4 Verification of instrumental variable
Though the robustness of benchmark results is verified by changing variables, this method cannot effectively address the endogeneity resulting by omitted variables and simultaneous causality. To further enhance reliability of research findings, this paper resorts to the research method proposed by Gebremariam et al. (2012). The product between the scale distribution of river density and the reciprocal rate is adopted as the instrumental variable of the multi-center index for a more robust estimation. The results are reported in Table 5 below.
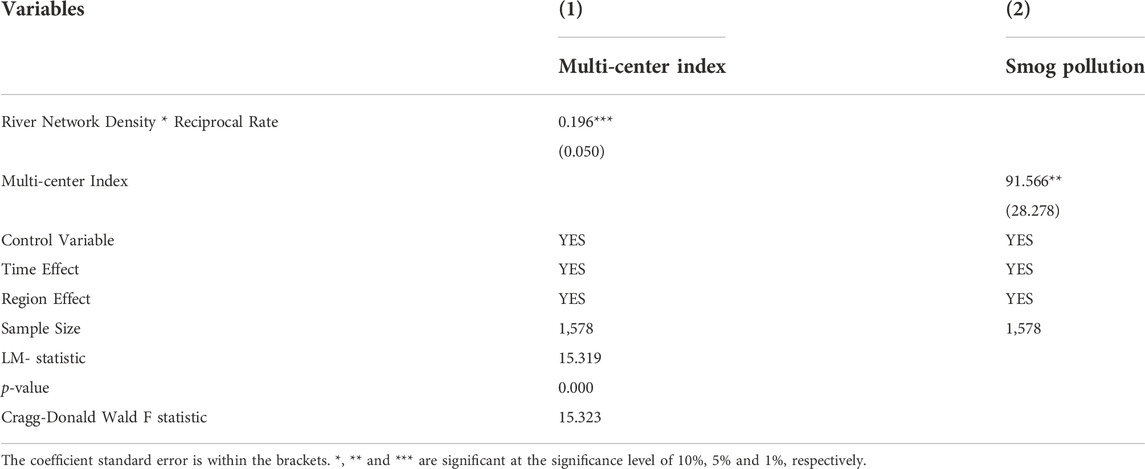
TABLE 5. Estimation based on instrumental variable.
Regression results of the instrumental variable obtained by the multi-center index are shown in Table 5 above. The coefficient of the instrumental variable is significantly positive. At the same time, the under-identification test and the weak instrumental variable test results also indicate the feasibility of adopting the product between the scale distribution of river density and the reciprocal rate as the instrumental variable. The influence of the multi-center index on smog pollution is still significantly positive. Estimation by the instrumental variable approach suggests that the core conclusions of this paper can still be substantiated.
5 Influence difference and mechanism analysis
5.1. Regional difference
Multi-center spatial development is significantly varied in different Chinese regions, with the multi-center development level of eastern regions being significantly higher than that of central and western regions (Day et al., 2017). This brings forth the following question: Does regional difference exist in the influence of multi-center spatial development on smog pollution? Table 6 estimates the influence of multi-center development of eastern, central and eastern regions on smog pollution.
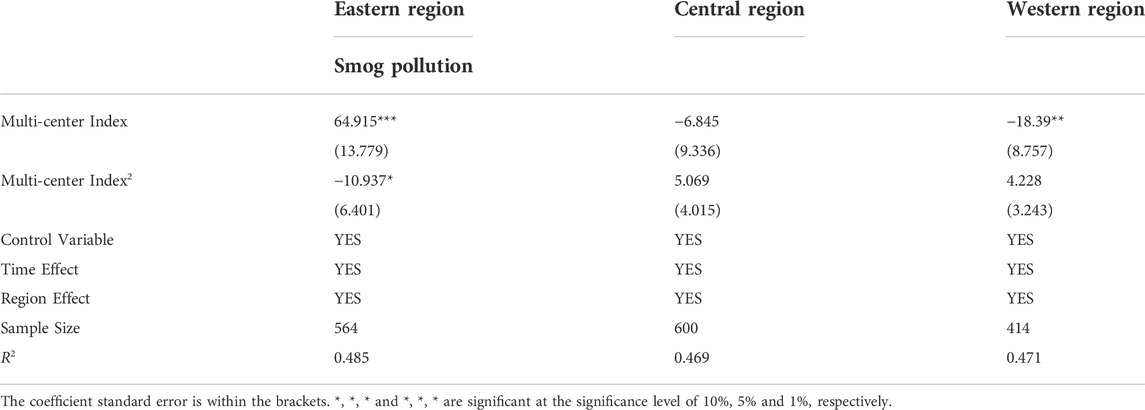
TABLE 6. Sample regression by different regions.
Unlike national results, the multi-center index and its quadratic term from regression results of the eastern region both pass the significance test. This means that the PM2.5 concentration of the eastern region first rises and then decreases along with the progress of multi-center development. Therefore, it is apt to say that aggravation of smog pollution is only a periodical phenomenon at the early stage of multi-center development, which can enter a turning point through a certain paths. This further substantiates that H1 makes sense under some conditions and gives us the hope that smog pollution will be mitigated with the deepening of multi-center development. Nevertheless, the significantly inverted U-shaped correlation has not yet formed between multi-center development and smog pollution in the western and central regions.
Why is the regional difference between the eastern region and the central and western region so significant considering the influence of their multi-center development on smog pollution? This paper attributes this phenomenon to the following causes. First, in contrast to the central and western regions, the eastern region enjoys a higher economic and social development level. Thereby, when multi-center development happens to the eastern region, economic development of the eastern region will still be on track towards high-quality development by limiting the development of high-energy-consumption, high-pollution industries. Moreover, in regions with a high economic development level, residents have a higher requirement of the environment, which will prompt local governments to draw up higher environmental standards.
On the other hand, the infrastructures of the eastern region are relatively comprehensive. Urban residents can reduce traffic transportation via public transport. At the same time, regions can ensure a high energy utilization efficiency and reduce pollution emissions through the reciprocal borrowing model and a full play of the comparative advantages of specialization and collaboration under a comprehensive traffic network.
In contrast, the social and economic development of the central and western regions is backward, and their infrastructure construction is insufficient. When cities seek multi-center development in these regions, local governments might introduce industrial enterprises to speed up local economic growth. But the backward transport facilities have impeded efficient resource flow among regions, reducing their energy utilization efficiency and objectively compounding smog pollution in central and western regions.
5.2 Mechanism analysis
The theoretical analysis of this paper suggests that multi-center development can influence regional smog pollution through four mediating transmission mechanisms, namely transport mode, energy consumption intensity, industrial agglomeration level, and environmental regulation level. Therefore, this paper follows the method proposed by Baron and Kenny (1986) to build a mediating effect model:
where X denotes the vector set made up of control variables; Medium is a potential mediating variable, transport mode, energy consumption intensity, industrial agglomeration degree or environmental regulation level; PM stands for the degree of smog pollution; q represents the urban multi-center index. According to the principle of the mediating effect model, if the coefficients, β1, θ1 and λ2, are both significant, and the coefficient, λ1, is smaller than β1 or the significance of the former reduces compared with that of the latter, it means the mediating effect exists.
Table 7 reports the estimation results of various mediating variables. The coefficient of urbanization in Eq. 3 is the estimation coefficient of urbanization in Column (3) of Table 2. We find that when transport mode and energy consumption intensity are regarded as mediating variables, the coefficient of the multi-center index in Eq. 5 is smaller than the corresponding coefficient in Eq. 3. This can help lead to the conclusion that the multi-center spatial structure can cause an increase in adoption of private transport modes and energy consumption intensity, which can jointly compound regional pollution. However, as mediating variables, estimation results with industrial agglomeration degree and environmental regulation level fail to pass the mediating effect test. Table 7 reveals that the multi-center spatial structure cannot significantly reduce the degree of industrial agglomeration and improve the level of environmental regulation. A possible reason is that attempting to drive economic growth in the short term, local governments of new towns and districts might attract enterprises to gather there via policy preferences, fund support, and reduction of discharge standards. To sum up, multi-center development at the national level has not effectively stimulated the transfer of regional industrial enterprises and increased the intensity of local environmental regulation. This means that the role of multi-center development in reducing smog pollution has not yet been fully played.
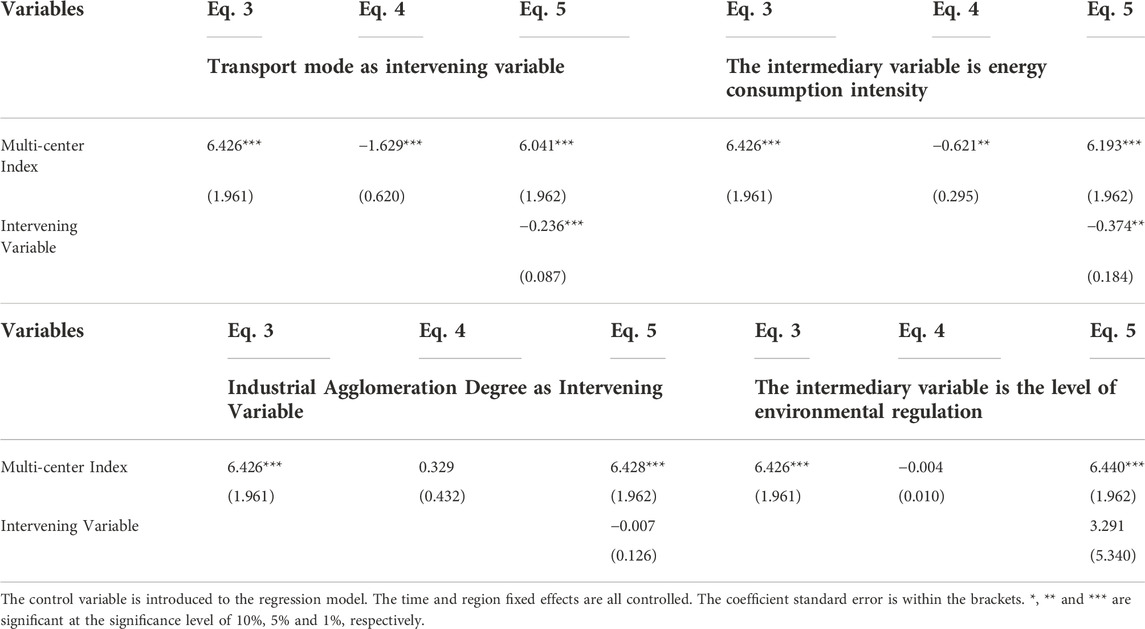
TABLE 7. Mechanism test of the influence of multi-center development on smog pollution.
6 Conclusion and policy implications
This study uses panel data of Chinese cities from 2012 to 2017 as research samples. Meanwhile, the urban multi-center spatial development index is built based on the global night light data. The satellite-monitored PM2.5 concentration is then used to represent the smog pollution. Based on the above research conditions, the influence of multi-center development on smog pollution and its mechanism of action are empirically examined. Results found that an inverted-U shape does not govern the influence of urban multi-center spatial development on regional smog pollution but a significantly positive monotonic correlation. Results of the interaction items show that in regions with backward economic development, multi-center spatial development can exert a more significant influence on smog pollution. Regional research samples indicate that an inverted U-shaped correlation governs the eastern region’s multi-center development and smog pollution. This can help shed light on that aggravation of smog pollution is only a periodical phenomenon of urban multi-center development, which can enter a turning point through some paths. Analysis of the mechanism of action implies that transport mode and energy consumption intensity are paths for urban multi-center development to affect regional smog pollution. But the mediating effect of the degree of industrial agglomeration and the environmental regulation level is insignificant.
Combining the research above findings, this paper provides the following three policy implications.
First, under the background that urban problems, such as traffic jams and environmental pollution, keep popping up, the concept of multi-center spatial development has found extensive applications in guiding urban planning. Most scholars and decision-makers believe that multi-center spatial development is an important spatial, strategic means for China’s urban pollution treatment. On the contrary, this paper’s empirical research reveals that blindly encouraging cities to implement the multi-center development strategy at China’s municipal level might aggravate regional smog pollution. Currently, most Chinese cities have not yet arrived at the turning point of the resource agglomeration effect, which necessitates continuous efforts to consolidate the dominating role of central cities.
Second, particularly in regions with backward economic development, more efforts should be made to encourage elements to gather in central regions. Local governments should pay attention to transport infrastructures, with more funds invested in improving the regional and cross-regional public transport network and promoting the full flow of regional green transport and elements. Meanwhile, governments should draw up strict environmental standards, resist the entry of high-energy-consumption and high-pollution industries, stick to sustainable development, and strictly fight against the wrong development mode of “development comes before smog treatment”.
Third, the eastern region’s multi-center development and smog pollution features an inverted U-shaped correlation. In other words, the aggravation of smog pollution is not an inevitable outcome but a periodical reflection of urban multi-center spatial development. When the agglomeration of resources has exceeded the regional environmental bearing, agglomeration can negatively influence the environment. Therefore, the future “saturated cities” development direction should be shifted to multi-center spatial development. To reduce the losses of the agglomeration effect caused by the diffusion of elements, local governments should emphasize constructing infrastructures for regional connection. The reciprocal borrowing model and the comparative advantages of specialization and collaboration can ensure efficient energy utilization, thus reducing pollution emissions. At the same time, local governments should increase investments in regional public transport and efficiently ensure the intensity of environmental regulation. By doing so, local governments can fully play the role of multi-center development in reducing smog pollution while also avoiding its negative influence on environmental protection.
Data availability statement
The original contributions presented in the study are included in the article/Supplementary Material, further inquiries can be directed to the corresponding author.
Author contributions
HQ proposed the main research idea, grasped the research direction, and have written the first draft of article. YC and YL contributed to the data analysis, editing, and revising the manuscript. QY contributed to empirical analysis.
Conflict of interest
The authors declare that the research was conducted in the absence of any commercial or financial relationships that could be construed as a potential conflict of interest.
Publisher’s note
All claims expressed in this article are solely those of the authors and do not necessarily represent those of their affiliated organizations, or those of the publisher, the editors and the reviewers. Any product that may be evaluated in this article, or claim that may be made by its manufacturer, is not guaranteed or endorsed by the publisher.
Footnotes
1This data are generally consistent with the Notice on Implementing Standards for Ambient Air Quality Standards issued by the Ministry of Environmental Protection on smog pollution in China, so the data are highly reliable.
References
Abbas, A., Waseem, M., Ahmad, R., Zhao, C., and Zhu, J. (2022). Sensitivity analysis of greenhouse gas emissions at farm level: Case study of grain and cash crops. Environ. Sci. Pollut. Res. 29, 82559–82573. doi:10.1007/s11356-022-21560-9
Abbas, A., Waseem, M., and Yang, M. (2020). An ensemble approach for assessment of energy efficiency of agriculture system in Pakistan|. Energy Effic. 13, 683–696. doi:10.1007/s12053-020-09845-9
Abbott, L. (2017). Can green walls help tackle pollution health Risks?Air pollution, the world's biggest environmental health risk, requires a fresh approach. Hortic. Week 6-6.
Andreoni, J., and Levinson, A. (1998). The simple analytics of the environmental kuznets curve. J. Public Econ. 80, 269–286. doi:10.1016/s0047-2727(00)00110-9
Bao, Y., and Yao, L. (2016). Empirical investigation on the degree of influence of industrial structure and urbanization on haze pollution in China. Nat. Environ. Pollut. Technol. (15-1)277-283.
Baron, R. M., and Kenny, D. A. (1986). The moderator-mediator variable distinction in social psychological research: Conceptual, strategic, and statistical considerations. J. Personality Soc. Psychol. 51 (6), 1173–1182. doi:10.1037/0022-3514.51.6.1173
Castells-Quintana, D., Dienesch, E., and Krause, M. (2021). Air pollution in an urban world: A global view on density, cities and emissions. Ecol. Econ. 189, 107153. doi:10.1016/j.ecolecon.2021.107153
Cheng, Z. H., Li, L. S., and Liu, J. (2017). Identifying the spatial effects and driving factors of urban PM2.5 pollution in China. Ecol. Indic. 82, 61–75. doi:10.1016/j.ecolind.2017.06.043
Clark, L. P., Millet, D. B., and Marshall, J. D. (2011). Air quality and urban form in US urban areas: Evidence from regulatory monitors. Environ. Sci. Technol. 45 (16), 7028–7035. doi:10.1021/es2006786
Day, J., Chen, Y., Ellis, P., and Roberts, M. (2017). A free, open-source tool for identifying urban agglomerations using polygon data. Environ. Syst. Decis. 37 (1), 68–87. doi:10.1007/s10669-017-9623-z
Dong, F., Zhang, S., Li, Y., Li, J., and Zhang, J. (2020). Examining environmental regulation efficiency of haze control and driving mechanism: Evidence from China. Environ. Sci. Pollut. Res. 27 (3), 29171–29190. doi:10.1007/s11356-020-09100-9
Dong, F., Zhang, S. N., Long, R. Y., Zhang, X. Y., and Sun, Z. Y. (2019). Determinants of haze pollution: An analysis from the perspective of spatiotemporal heterogeneity. J. Clean. Prod. 222, 768–783. doi:10.1016/j.jclepro.2019.03.105
Elahi, E., and Khalid, Z. (2022). Estimating smart energy inputs packages using hybrid optimisation technique to mitigate environmental emissions of commercial fish farms. Appl. Energy 326, 119602. doi:10.1016/j.apenergy.2022.119602
Elahi, E., Khalid, Z., Tauni, M. Z., Zhang, H., and Lirong, X. (2021). Extreme weather events risk to crop production and the adaptation of innovative management strategies to mitigate the risk: A retrospective survey of rural Punjab, Pakistan. Technovation 117, 102255. doi:10.1016/j.technovation.2021.102255
Elahi, E., Khalid, Z., and Zhang, Z. (2022). Understanding farmers’ intention and willingness to install renewable energy technology: A solution to reduce the environmental emissions of agriculture. Appl. Energy 309, 118459. doi:10.1016/j.apenergy.2021.118459
Fang, J. (2021). Impacts of high-speed rail on urban smog pollution in China: A spatial difference-in-difference approach. Sci. Total Environ. 777, 146153. doi:10.1016/j.scitotenv.2021.146153
Gan, T., Yang, H. C., Liang, W., and Liao, X. C. (2021). Do economic development and population agglomeration inevitably aggravate haze pollution in China? New evidence from spatial econometric analysis. Environ. Sci. Pollut. Res. 28 (5), 5063–5079. doi:10.1007/s11356-020-10847-4
Gebremariam, G. H., Gebremedhin, T. G., Schaeffer, P. V., Phipps, T. T., and Jackson, R. W. (2012). Employment, income, migration and public services: A simultaneous spatial panel data model of regional growth. Pap. Regional Sci. 91 (2). doi:10.1111/j.1435-5957.2011.00388.x
Han, S., Sun, B., and Zhang, T. (2020). Mono- and polycentric urban spatial structure and PM2.5 concentrations: Regarding the dependence on population density. Habitat Int. 104, 102257. doi:10.1016/j.habitatint.2020.102257
Hao, Y., and Liu, Y. (2016). The influential factors of urban PM2.5 concentrations in China: A spatial econometric analysis. J. Clean. Prod. 112, 1443–1453. doi:10.1016/j.jclepro.2015.05.005
Leeuwen, S. V. (2004). Auditing international environmental agreements: The role of supreme audit institutions. Environmentalist 24 (2), 93–99. doi:10.1007/s10669-004-4800-2
Li, F. (2019). Manufacturing clusters and firm innovation. Econ. Dev. Q. 33 (1), 6–18. doi:10.1177/0891242418800770
Li, J., and Ye, S. (2021). Regional policy synergy and haze governance-empirical evidence from 281 prefecture-level cities in China. Environ. Sci. Pollut. Res. 28 (9), 10763–10779. doi:10.1007/s11356-020-11251-8
Li, W., Sun, B., and Zhang, T. (2019). Spatial structure and labour productivity: Evidence from prefectures in China. Urban Stud. 56 (8), 1516–1532. doi:10.1177/0042098018770077
Li, X. S., Zhou, M., Zhang, W. Y., Yu, K. W., and Meng, X. (2022). Study on the mechanism of haze pollution affected by urban population agglomeration. Atmosphere 13 (2), 278. doi:10.3390/atmos13020278
Liao, S. M., Wang, D., Liang, Z. J., Xia, C. Y., Guo, H., and Zhao, W. J. (2020). Spatial spillover effect and sources of city-level haze pollution in China: A case study of guangdong provinces. Pol. J. Environ. Stud. 29 (5), 3213–3223. doi:10.15244/pjoes/113466
Liu, D. Y., He, Y. D., and Wang, Q. R. (2021). Urban spatial structure evolution and smog management in China: A Re-examination using nonparametric panel model. J. Clean. Prod. 285, 124847. doi:10.1016/j.jclepro.2020.124847
Liu, Y., Chen, X., and Liu, D. (2020). How does urban spatial structure affect economic growth? Evidence from landsat data in China. J. Econ. Issues 54, 798–812. doi:10.1080/00213624.2020.1787062
Meijers, E. J., and Burger, M. J. (2010). Spatial structure and productivity in US metropolitan areas. Environ. Plan. A 42 (6), 1383–1402. doi:10.1068/a42151
Tang, D. L., Xu, H., and Yang, Y. H. (2018). Mutual influence of energy consumption and foreign direct investment on haze pollution in China: A spatial econometric approach. Pol. J. Environ. Stud. 27 (4), 1743–1752. doi:10.15244/pjoes/78046
Xie, Q., Xu, X., and Liu, X. (2019). Is there an EKC between economic growth and smog pollution in China? New evidence from semiparametric spatial autoregressive models. J. Clean. Prod. 220 (20), 873–883. doi:10.1016/j.jclepro.2019.02.166
Yang, J., Dong, J., Sun, Y., Zhu, J., Huang, Y., and Yang, S. (2022). A constraint-based approach for identifying the urban-rural fringe of polycentric cities using multi-sourced data. Int. J. Geogr. Inf. Sci. 36 (1), 114–136. doi:10.1080/13658816.2021.1876236
Yu, X., Shen, M., Shen, W., and Zhang, X. (2020). Effects of land urbanization on smog pollution in China: Estimation of spatial autoregressive panel data models. LAND 9 (9), 337. doi:10.3390/land9090337
Yuan, M., Song, Y., Huang, Y. P., Hong, S. J., and Huang, L. J. (2018). Exploring the association between urban form and air quality in China. J. Plan. Educ. Res. 38 (4), 413–426. doi:10.1177/0739456x17711516
Keywords: multi-center development, urban spatial structure, smog pollution, night light data, inverted-U shape
Citation: Qie H, Chao Y, Yang Q and Lu Y (2022) Urban spatial structure and regional smog management for environmental sustainability. Front. Environ. Sci. 10:1053077. doi: 10.3389/fenvs.2022.1053077
Received: 25 September 2022; Accepted: 31 October 2022;
Published: 17 November 2022.
Edited by:
Arshian Sharif, Sunway University, MalaysiaReviewed by:
Mahmood Ahmad, University of International Business and Economics, ChinaAdnan Abbas, Nanjing University of Information Science and Technology, China
Copyright © 2022 Qie, Chao, Yang and Lu. This is an open-access article distributed under the terms of the Creative Commons Attribution License (CC BY). The use, distribution or reproduction in other forums is permitted, provided the original author(s) and the copyright owner(s) are credited and that the original publication in this journal is cited, in accordance with accepted academic practice. No use, distribution or reproduction is permitted which does not comply with these terms.
*Correspondence: Yong Lu, bHV5b25nQG5qYXUuZWR1LmNu