
94% of researchers rate our articles as excellent or good
Learn more about the work of our research integrity team to safeguard the quality of each article we publish.
Find out more
ORIGINAL RESEARCH article
Front. Environ. Sci., 04 January 2023
Sec. Atmosphere and Climate
Volume 10 - 2022 | https://doi.org/10.3389/fenvs.2022.1051610
This article is part of the Research TopicAir Pollution, Deposition, and Source Identification in South AsiaView all 5 articles
 Xuefeng Yao1
 Baozhu Ge1*
 Aibing Li2Guanjun Chen3Fan Fan4Danhui Xu5Yuge Wang2Xiao Tang1Lei Kong1Zifa Wang1,6,7
Due to the differences in topographic features, water vapor distribution and emission structures between the north and south of Xinjiang Uygur Autonomous Region (hereinafter Xinjiang), the air pollution exhibits remarkable spatial heterogeneity in this region. In this study, Xinjiang is divided into four regions from north to south at the municipality scale based on the data from air quality monitoring sites recorded from 2013–2019, namely, the clean area in the north of northern Xinjiang (region I), the heavily polluted area of the Urumqi-Changji-Shihezi region (region Ⅲ), the moderately polluted area in the north of southern Xinjiang (region Ⅱ), and the severely polluted area in the south of southern Xinjiang (region Ⅳ). For highly polluted regions in northern and southern Xinjiang, regions Ⅲ and Ⅳ are compared with those typical polluted regions in central and eastern China, and the spatio-temporal variation characteristics and the causes of PM2.5 pollution in each sub-region are discussed. The results show that the region Ⅲ is a typical area with anthropogenic air pollution source, where the occurrence frequency of PM2.5 pollution with the intensity of moderate level or above (18%) is higher than the most heavily polluted area in central and eastern China (16%, regions from the south of North China to the west of Huang-Huai). The region IV is a typical area affected by dust weather, where the pollution frequency being about 52% is much higher than that in other typical polluted regions. In addition, under the combined effects of anthropogenic sources and dust aerosols, the pollution duration in region II is prolonged. Therefore, in contrast to the remarkable improvement of air quality in central and eastern China, the air pollution in typical regions of Xinjiang has become relatively more severe in recent years. Moreover, as Xinjiang is in the upstream of the central and eastern China in the mid-latitude westerlies, the heavy pollution due to sand and dust, anthropogenic sources and their mixing effects has a far-reaching impact on the downstream areas, further highlighting the growing importance of pollution prevention and control in Xinjiang.
The Xinjiang Uygur Autonomous Region (hereinafter referred to as Xinjiang) is located in the northwest border of China. It is the provincial-level administrative region with the largest land area and shoulders the dual missions of ensuring the national energy security and the economic and social development of the autonomous region. In recent years, the problem of regional air pollution caused by resource exploitation, urban construction and economic development has become increasingly noticeable (Jiang et al., 2020). Since the Action Plan on Air Pollution Prevention and Control was issued in 2013, the overall concentration level of air pollutants in central and eastern China shows a decreasing trend. In 2017, the NO2 concentrations in the Beijing-Tianjin-Hebei region, Yangtze River Delta and Sichuan Basin respectively decreased by 74.1%, 45.1%, and 33.2% compared with that in 2012 (Zhang et al., 2012; Ma et al., 2016a; He et al., 2021). However, the contribution of air pollutant emissions in Xinjiang to the whole country has increased year by year1 (Shen et al., 2016). Since 2016, due to the adjustment of energy structure in some cities of Xinjiang, the air quality has improved somewhat. However, as affected by urban expansion and the increase in motor vehicle ownership, these cities are still at poor levels in the annual ranking of air quality among national key cities (You 2018).
Recently, the research on the spatio-temporal distribution of air pollution and its influencing factors in Xinjiang has gradually attracted attention (Tang et al., 2016; Turap et al., 2019; Wang et al., 2020), which provides scientific evidence for analyzing the types and variation trends of regional air pollutants. However, the current researches on air quality change in Xinjiang mainly focus on local regions or key cities (Gu et al., 2020; Liu et al., 2021), and lack comparative analysis among key urban agglomerations from a national perspective, which are unable to highlight the differences in the spatial distribution pattern and air pollution level between the eastern and western regions of China. Moreover, the study periods in these studies are too short to reveal the variation characteristics of air pollution in recent years (Zhao et al., 2019).
In addition, the desert in Xinjiang is one of the main dust sources in Asia (Guo et al., 2017). On the one hand, the mixing effect of dust with aerosols from anthropogenic sources has a great impact on the pollution level of local particulates (Li 2009). On the other hand, because Xinjiang is located in the upstream of the central and eastern China in the mid-latitude westerlies, the high-concentration particulate matter in Xinjiang will also be transported by the air flow, which has a serious impact on the air quality in central and eastern China and downwind countries, as well as global biogeochemical cycles (Manktelow et al., 2010; Sun et al., 2010; Kim et al., 2012). In future, a shift of precipitation toward more frequent heavy events due to the global climate change contributes to weakened wet removal fluxes, which will increase the concentration of particulate matter (Xu and Lamarque 2018). The meteorological environment in winter in Asia will be conducive to more extreme particulate pollution events as a result of the changing boreal cryosphere (Zou et al., 2017). Therefore, as the air pollution in central and eastern China has been effectively controlled, the proportion of pollution transported from the western regions has become increasingly noticeable for these regions.
At the same time, the complex and diverse geography and climate lead to a larger spatial heterogeneity in the distribution of air pollution in Xinjiang than in other regions (Jiang et al., 2020). Many studies have shown that the southern Xinjiang basin centered on Minfeng and Hotan is the high-frequency center of dusty weather in China (Wang et al., 2003; Qiu et al., 2018), while the air pollution in northern Xinjiang is mainly resulted from the emissions by human activities because of high vegetation coverage and relatively high concentrations of cities, energy exploitation and deep processing industries (Jiang et al., 2020). Therefore, it is necessary to carry out the researches on air pollution in sub-regions of Xinjiang.
Since 2013, Xinjiang has begun to build air quality monitoring stations covering the whole province, providing data support for the assessment of regional air pollution level (Dong et al., 2020). Using the data from national air quality monitoring stations from 2013 to 2019, combined with the differences of geographical characteristics, this study discusses the spatio-temporal distribution characteristics of air pollution in different regions of Xinjiang. Based on the zoning results, the typical polluted regions in Xinjiang are compared with the key polluted regions in the central and eastern China, and the differences and variation trends of air pollution in the eastern and western China are analyzed. The research can provide data support for decision-making and cross-regional management in nationwide air pollution prevention and control.
The remainder of this paper is organized as follows. Section 2 introduces the data and research methods. The zoning results and the characteristics of pollution in four sub-regions of Xinjiang with different temporal scales are shown in Section 3, where the causes of pollution are also analyzed. Finally, the conclusions and discussion are given in Section 4.
Xinjiang is located in the heartland of the Eurasian continent with complex terrain, where mountains are intermixed with basins. There are three west-east oriented mountains in Xinjiang, which are the Altai Mountains, Tianshan Mountains and Kunlun Mountains from north to south. Junggar Basin and Tarim Basin are sandwiched between the three mountains. The Qinghai Tibet Plateau is located to the south side of Kunlun Mountains. Xinjiang is divided into northern Xinjiang and southern Xinjiang by the Tianshan Mountains (Figure 1A). Affected by the factors of steep terrain, complex boundary layer processes and water vapor transport, the climate in the northern Xinjiang is much wetter than that in the southern Xinjiang (Yang and Liu 2018). In addition, in terms of the structure of emission sources, coal bases and petrochemical bases are mainly located in the northern Xinjiang (Figure 1A), while deserts are widely distributed in the central and east parts of southern Xinjiang.
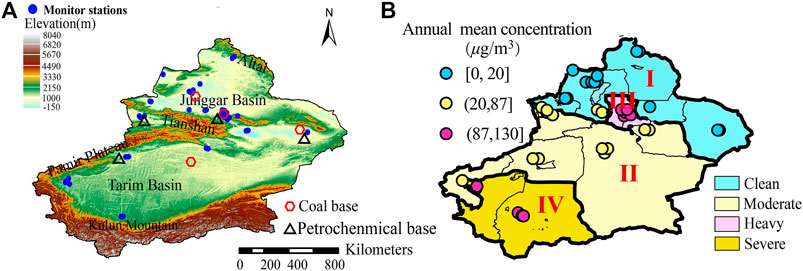
FIGURE 1. (A) Distributions of terrain, air quality monitoring stations, coal bases and petrochemical bases in Xinjiang. (B) Administrative zoning map of PM2.5 in Xinjiang and distribution of stations with three different air quality levels (The blue dots represent clean stations, the yellow dots represent moderately polluted stations and red dots represent heavily polluted stations).
This study adopts the hourly air quality data observed at the state-level stations from China National Environmental Monitoring Centre in 2013–2019, including six types of air pollutants, namely PM2.5, PM10, NO2, SO2, and CO. As shown in Figure 1A, there are a total of 41 stations in Xinjiang. The meteorological data used in this paper comprise the observation data of 10-m wind speed, visibility, weather phenomena, etc., which are derived from the representative meteorological stations in Xinjiang, with their temporal resolutions being 3 h from 2013 to 2019. Particularly, the observed air temperature data covers the period from 1951 to 2019. Besides, the fifth-generation European Centre for Medium-Range Weather Forecasts (ECMWF) reanalysis (ERA5) data during 2013–2019 is also used, with the spatial resolution being 0.25 × 0.25 and the temporal resolution being 1 h.
According to the annual mean concentration of PM2.5, the air quality observation stations in Xinjiang are ordered and preliminarily classified by using the natural break classification method (Jenks 1967). As a result, the stations with similar concentration values are divided into the same class. The method given by Yao et al. (2020) is further adopted to solve the problem of geographical discontinuity for stations in the same class. Finally, the administrative zoning map of PM2.5 in Xinjiang is given after the adjustment of boundaries according to the administrative division.
The relatively heavily polluted regions in Xinjiang are selected based on the above zoning result, and meanwhile, the typical polluted regions in central and eastern China are also selected based on the administrative zoning of PM2.5 in China (Yao et al., 2020). On this basis, the PM2.5 pollution level and variation trends in these regions are compared and analyzed.
The spatio-temporal variations of the hourly, monthly and annual mean concentrations of PM2.5 in sub-regions of Xinjiang are analyzed. The daily mean value in this study refers to the arithmetic mean of hourly concentration values at 24 h in a natural day, and the monthly (annual) mean value is defined as the arithmetic mean of the daily mean concentration in a month (year). In addition, the Pearson correlation analysis with two-tail t-test is used to validate the significance of the data, and the least squares method is adopted to estimate the linear trend value of the data.
Supplementary Figure S1 shows the annual mean PM2.5 concentrations at 41 stations in Xinjiang in descending order. By taking the breakpoint value as the boundary, the stations are divided into three classes, which are 12 clean stations with the annual mean concentration less than 37 μg·m−3, 12 moderately polluted stations with the concentration being 37–80 μg·m−3, and 17 heavily polluted stations with the concentrations over 80 μg·m−3. As shown in Figure 1B, the heavily polluted stations are located in Urumqi urban agglomeration and southern Xinjiang. Meanwhile, there are isolated stations with geographical discontinuities around the Urumqi urban agglomeration. To obtain zoning results with geographical continuity along the boundaries, the zoning correction algorithm based on geographical distance proposed by Yao et al. (2020) is adopted. As the basic unit for the construction of air quality monitoring stations and the implementation of air pollution control strategies, the prefecture-level city is taken as a zoning unit, and the administrative zoning map of PM2.5 pollution in Xinjiang is obtained (Figure 1B), Xinjiang is divided into four sub-regions, namely the clean region located in the north of northern Xinjiang (region I), moderately polluted region in the north of southern Xinjiang (region Ⅱ), heavily polluted region in Urumqi urban agglomeration including Urumqi, Changji and Shihezi (region Ⅲ, hereinafter Urumqi-Changji-Shihezi region), and severely polluted region in the south of southern Xinjiang (region Ⅳ). It should be noted that although the annual mean concentration of pollutants in region Ⅲ approximates to that in region Ⅳ, they are divided into different classes due to the differences in geographical locations.
As shown in Figure 2, from 2013 to 2019, the PM2.5 concentration in Xinjiang generally shows a decreasing trend; with the annual means in regions I–Ⅳ in 2019 respectively decrease by 36.75%, 18.74%, 35.4% and 23.98% compared with those in 2013, and the SO2 concentration is steadily falling, with the regional annual means reduce to about 10 μg m−3 by 2019. Besides, the CO concentration showed a downward trend in the regions I and Ⅲ, but maintained stable levels in the remaining two regions. For NO2, the concentration remained stable and even increased in some regions. Specifically, the annual mean concentrations of PM2.5 in regions I, Ⅱ and Ⅳ display a linear decreasing trend at a decreasing rate greater than 1.91 μg·m−3·yr−1. While for region Ⅲ, the annual variation of PM2.5 concentration can be divided into three stages (Figure 2C). First is the remarkable decreasing stage in 2013–2014. Before 2012, dust from coal-burning was the main source of PM2.5 during the heating season in region Ⅲ (Li et al., 2009). After 2012, the local government adjusted the structure of heating energy and carried out the coal-to-gas project, which has reduced the coal-burning pollution (Abudumutailifu et al., 2018). At the same time, the observation data has also witnessed a significant decline in pollutants such as CO and NO2. Second is the increasing stage in 2014–2017. The increasing trend at this stage is consistent with the results of many studies (You 2018; Dong et al., 2020). As the coal-to-gas project has not achieved full coverage, the decline in SO2 concentration is limited. At the same time, affected by urban expansion and the increasing population and industrial emissions, NO2 emissions increase, and heavily polluted weather occurs frequently in winter (Zou et al., 2017). Third is the slowly decreasing stage in 2017–2019. Under the control measures such as the readjustment of regional energy structure, the implementation of denitration devices in power stations, and the upgrading of vehicle fuels (Ma et al., 2016b; Su et al., 2021)., the concentrations of various air pollutants show a decreasing trend.
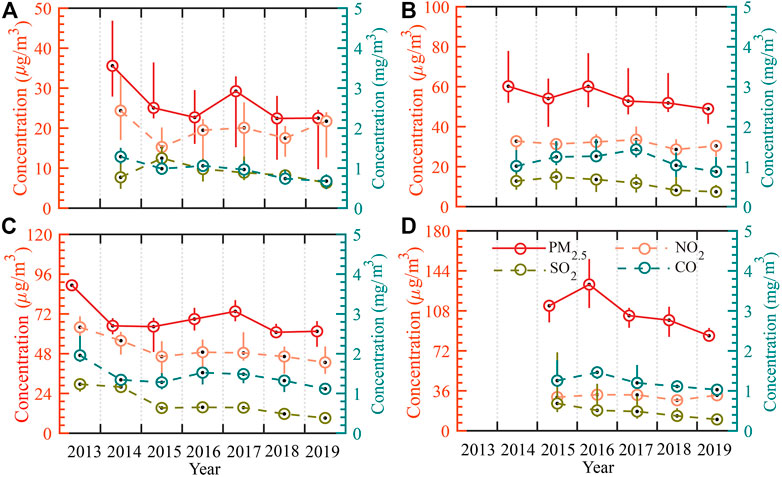
FIGURE 2. Box plots of annual average PM2.5, NO2, SO2, CO concentrations in (A) region I, (B) region Ⅱ, (C) region Ⅲ and (D) region Ⅳ of Xinjiang from 2013 to 2019.
In June of 2018, the State Council issued a notice about the 3-years plan on defending the blue sky2, known as the blue sky action plan, which took the Beijing-Tianjin-Hebei and surrounding areas, the Fenhe and Weihe Plain, and the Yangtze River Delta as key areas for joint prevention and control of air pollution. Based on the air quality monitoring data from 2013 to 2018, Yao et al. (2020) divided China into 17 regions by taking prefecture-level city as unit according to the regional collaborative change. Moreover, the key areas involved in the blue sky action plan were divided into four regions, in which the whole of Xinjiang was considered as one region. The annual mean concentrations of PM2.5 in the above regions from high to low are 85.47 μg·m−3 in the south of North China to the west of Huang-Huai Region, 69.22 μg·m−3 in the Fenhe and Weihe Plain, 69.17 μg·m−3 in the north of North China, 65.97 μg·m−3 in Xinjiang, and 58 μg·m−3 in the Yangtze River Delta. Specially, the air pollution level in regions from the south of North China to the west of Huang-Huai Region is the highest in China. However, due to the unique geography and climate in Xinjiang, Wang et al. (2015) pointed out that Xinjiang should be divided into two regions of the northern and southern parts with respect to the spatial distribution characteristics of PM2.5 concentration. In this study, regions Ⅲ and Ⅳ refer to the heavily polluted regions in northern and southern Xinjiang respectively. In order to investigate the difference of PM2.5 pollution level in representative regions between the eastern and western China, the variations of PM2.5 pollution frequency in the above four typical regions in central and eastern China and in regions Ⅲ and Ⅳ in Xinjiang are compared, as shown in Figure 3.
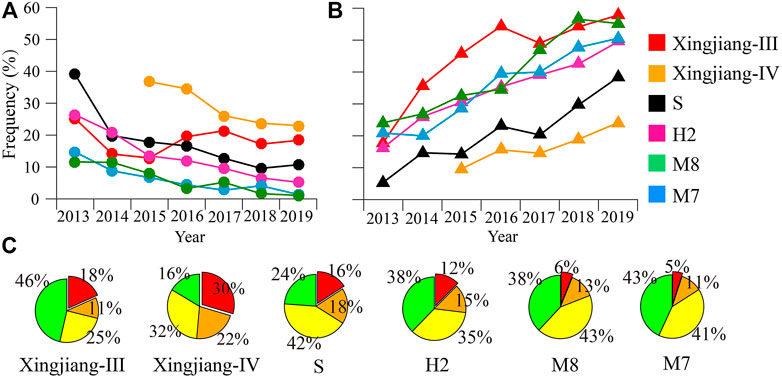
FIGURE 3. Occurrence frequencies of air quality (A) above the moderately polluted level and (B) the excellent rates in the Urumqi-Changji-Shihezi region (Xingjiang-Ⅲ, red), southern Xingjiang (Xinjiang-Ⅳ, orange), the south of North China to the west of Huang-Huai Region (S, black), the Fenhe and Weihe Plain (H2, pink), the north of North China (M8, green) and the Yangtze River Delta (M7, blue) from 2013 to 2019. (C) Average occurrence frequencies of the air quality at the good level (green, daily PM2.5 concentration between 0 and 35 μg·m−3), moderate level (yellow, 35–75 μg·m−3), lightly polluted level (orange, 75–115 μg·m−3) and above moderately polluted level (red, greater than 115 μg·m−3) in each region from 2013 to 2019.
The annual variation shows that compared with the consistent improvement trend in central and eastern China, the reduction of pollution level in typical regions of Xinjiang is limited. (Figures 3A,B). Specifically, the occurrence frequency of PM2.5 concentration above the moderately polluted level in the region Ⅲ exhibits a steady increasing trend since 2016, and even exceeds that in the most heavily polluted regions in central and eastern China, namely, the south of North China to the west of Huang-Huai Region. Meanwhile, the pollution in the region Ⅳ remains high level. The frequency of PM2.5 concentration above the moderately polluted level decreases by 7.9% from 2013 to 2019, which is much lower than 20.9% in the four regions of central and eastern China. The 7-years average displays that the selected regions of Xinjiang present high pollution frequency (Figure 3C). Specially, the region III shows the characteristics of high excellent rate along with high pollution rate. The excellent rate in this region reaches 46%, which is the highest among the six selected regions. Meanwhile, the frequency of pollution above the moderately polluted level is 18%, higher than that in the four regions of central and eastern China (<16%). In the region Ⅳ, the frequency is characterized by low excellent rate and high pollution rate. The excellent rate is only 16%, while the frequency of pollution above the lightly polluted level reaches 52%, which is much higher than that in other representative regions.
For a detailed variance analysis of the long-term trend of PM2.5, the daily PM2.5 data were binned into a series of datasets, where the time intervals with different lengths (“timescales”) ranging from 1 day to 3 years (Rohrer and Berresheim, 2006). Figure 4 displays the variation of PM2.5 concentration variances at different timescales in each region of Xinjiang. It can be seen that the variation of PM2.5 concentration in each region is dominated by seasonal variation and synoptic-scale variation (between 1 and 7 days), with the average variance contributions over Xinjiang being about 50% and 15% respectively. With the increase of regional PM2.5 concentration, the proportion of diurnal variation and synoptic-scale variation is gradually increasing. Specifically, the seasonal variation in region I plays a dominant role, with its proportion being greater than 65%. In region II and III, the proportion of seasonal variation is about 40%, and the proportion of synoptic-scale variation increases to about 15%. In region Ⅳ, the proportion of synoptic-scale variation is about 25% and is close to that of the seasonal variation (about 30%), and the proportion of diurnal variation also increases to about 20%.
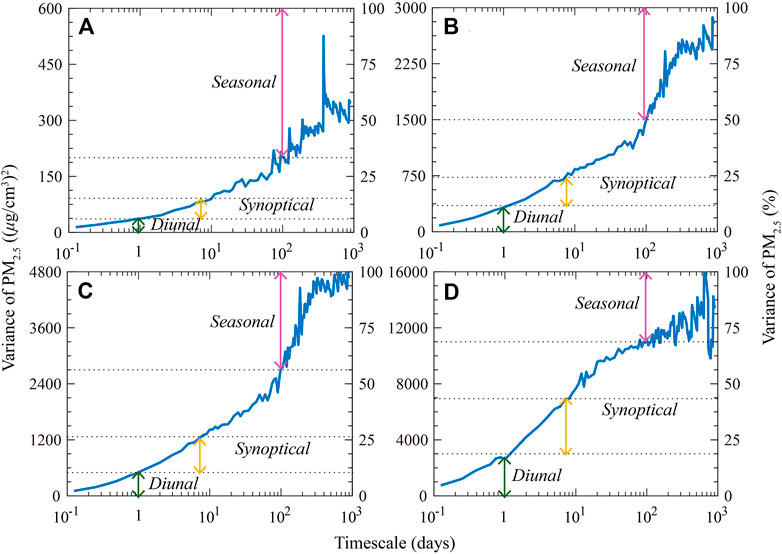
FIGURE 4. Variations (μg∙m−3)2 and proportions (%) of PM2.5 concentration variance at different timescales in (A) region I, (B) region Ⅱ, (C) region Ⅲ and (D) region Ⅳ of Xinjiang from 2013 to 2019.
The seasonal variation of monthly average PM2.5 concentration in each region of Xinjiang is shown in Figure 5. Specifically, the variation characteristics in region I and region III are similar, exhibiting high concentration in winter (October to March of the next year) and low concentration in summer (April to September). The pollution in region Ⅲ is prominent in autumn and winter, with the average concentration increasing from 28.04 μg·m−3 in summer to 101.96 μg·m−3 in winter. In region Ⅳ, the peak of PM2.5 concentration appears in March, which may be caused by the dust weather process in spring. Affected by factors of alternative freezing and thawing of soil, scarce precipitation and frequent cold air activities, the number of days of dust weather in March is the highest in the whole year (Wang et al., 2019). In addition, the secondary peak of PM2.5 concentration is found in July, which may be related to the development of thermal low and the stable maintenance of high pressure gradient in the southern Xinjiang basin in summer. Cyclonic circulation and southwesterly transport the dust aerosol from the hinterland of the upstream desert to region Ⅳ (Figure 6). Qiu et al. (2018) pointed out that the increase in southwesterly wind speed is well related to the summer dust pollution in the south of southern Xinjiang. In region II, although overall characteristics are similar to the region III, the boxplot represents a high concentration bias in May and April, and meteorological observations show that this is related to several dust processes in spring, indicating that the anthropogenic sources and sand-dust both have a certain impact on the PM2.5 concentration in this region.
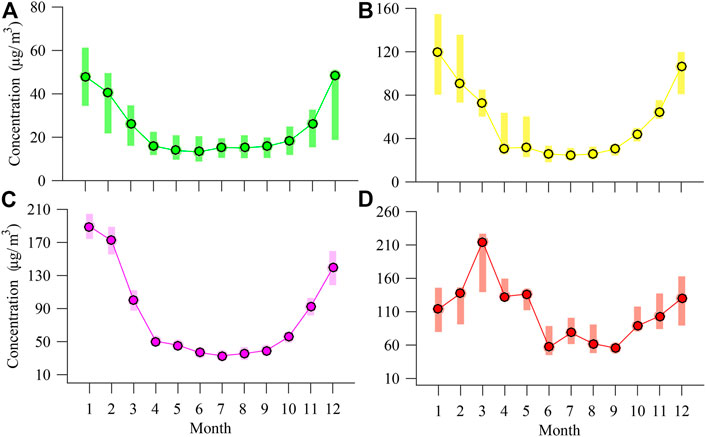
FIGURE 5. Box plots of monthly average PM2.5 concentrations in (A) region I, (B) region Ⅱ, (C) region Ⅲ and (D) region Ⅳ of Xinjiang from 2013 to 2019.
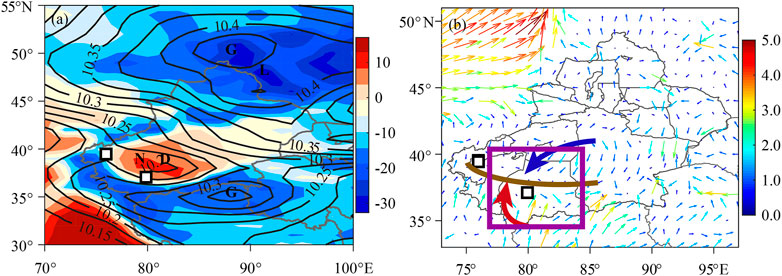
FIGURE 6. (A) Average sea level pressure (black contour, 103 Pa) and 2-m temperature (shaded, °C), and (B) average 10-m wind field (colored vector, m∙s−1) in March from 2013 to 2019. G is the center of high pressure, D is the center of low pressure, L is the center of cold air and N is the center of warm air. Brown thick line, blue and red vector indicate the location of surface convergence line, northerly wind and southerly wind, respectively. White squares indicate the monitoring stations in region Ⅳ.
As shown in Supplementary Figure S2, the diurnal variation of PM2.5 concentration in Xinjiang presents a bimodal structure. The diurnal variation amplitude of PM2.5 concentration tends to weaken from 2013 to 2019, which may be related to the overall decreasing trend of the annual mean pollutant concentration in all four regions. From the perspective of regional differences, the variation amplitude in region I is the smallest, which is consistent with the result of variance analysis, while region II (I) and region IV (III) show similar variation characteristics. Therefore, the following analysis focuses on the diurnal variation characteristics in region III and region IV.
The peak (valley) values of PM2.5 concentration in region III appear around 1600 BJT (0900 BJT, Beijing Time) and 0100 BJT (2100 BJT), which may be related to the distribution of industrial emission sources, human activities and diurnal variation of wind direction (Li 2013). The meteorological data shows that in region III, the northerly wind is dominant during the daytime, and the wind speed reaches the maximum around 1500 BJT. In this case, the prevailing wind direction is conducive to the southward transportation of pollutants from the northern industrial area. In the evening, the pollutant transport is decreased due to the change of wind direction to southerly and the reduction of industrial emissions, and thus the PM2.5 concentration falls to a valley value. Due to the decrease in the boundary layer thickness and the increase in pollutants from coal burning in the winter evening, the PM2.5 concentration increases to a maximum in the early morning.
The maximum (minimum) values in region IV appear at 1400 BJT (0900 BJT) and around 0200 BJT (2000 BJT), which may be related to the distribution of dust sources and the diurnal variation of local wind field. According to the statistics of the frequency of surface wind direction from 2013 to 2019 in Hotan, a representative station in southern Xinjiang, the northeasterly wind prevails in the daytime and the southwesterly wind is dominant in the nighttime. Based on the meteorological data with a 3-h interval, the PM2.5 concentrations in different wind directions are calculated, as shown in Figure 7D. After nightfall, the PM2.5 concentration in southwesterly wind direction increases, reaching the maximum at 0600–0900 BJT, while the concentrations in northeasterly wind direction peak at 1200–1500 BJT in the daytime. In order to eliminate the influences of inter-annual, seasonal and synoptic-scale variations, January and July are selected as the representative months of winter half year and summer half year respectively, and the average surface wind field at typical time in Hotan is calculated (Figures 7A–C; the calculation process of wind field in summer half year is similar to that in winter half year, and the figures are omitted). In combination with the terrain and surface meteorological field, the diurnal variation of dust transport is comprehensively analyzed. Hotan is adjacent to the Kunlun Mountains in the south, and to the Taklamakan desert in the northeast (Figure 1A). During the daytime, the thermal low in the basin develops, extends southward and reaches to the strongest in the afternoon. Affected by the valley breeze which manifests as northeasterly that blows from the basin to the mountains, the northeasterly wind speed reaches maximum in the afternoon, corresponding to the peak of PM2.5 concentration related to the daytime dust transport (Figures 6,7C). After nightfall, the thermal low shrinks northward, and the valley breeze changes to mountain breeze featured by southwesterly wind blowing from the mountains to the basin. The transition of valley breeze to mountain breeze and the movement of the convergence zone from south to north result in the peak of PM2.5 concentration before dawn (Figure 7A). However, as the upstream of the southwesterly wind is the relatively clean area (the Kunlun Mountains), when southwesterly wind prevails and the convergence zone moves out, the concentration of pollutants in this region decreases after midnight (Figure 7B).
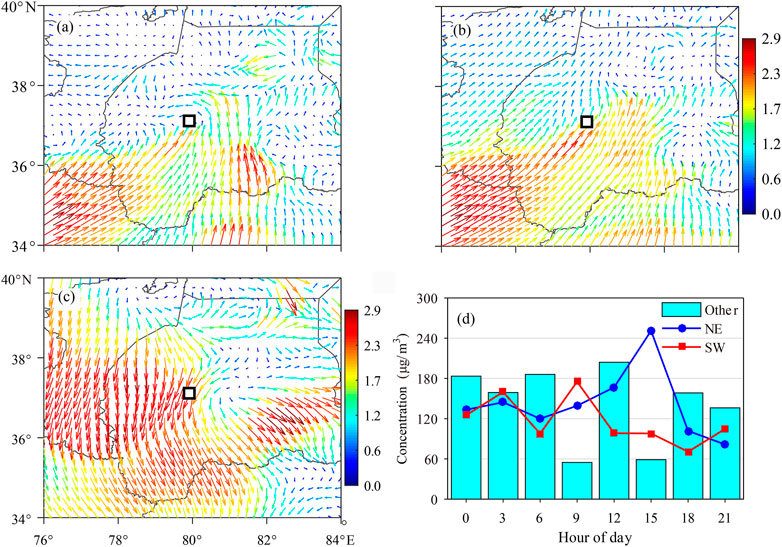
FIGURE 7. Average 10-m wind fields (m∙s−1) at (A) 0200 BJT (Beijing Time), (B) 0800 BJT and (C) 1400 BJT in Hotan area in January of 2013–2019. (D) Diurnal variations of average PM2.5 concentration in southwesterly wind direction (red line), northeasterly wind direction (blue line) and other wind directions (cyan histogram).
Statistics on the proportion of PM2.5 in regional particulate pollution is an important method to analyze the causes of regional pollution. Based on the daily mean concentration of PM2.5 and PM10, box plots of PM2.5 are drawn within a certain range of PM10 concentrations, which are 10, 40, 25, and 80 μg·m−3 in regions I–IV respectively (Figure 8). It can be seen that there is a significant positive linear correlation relationship between PM2.5 and PM10 in terms of their concentrations in each region. However, this linear relationship is non-significant in high concentration sections of each region, which may be related to the small sample sizes within these sections. Especially for high concentration section in region I, the relationship fluctuates remarkably with the increase in concentration.
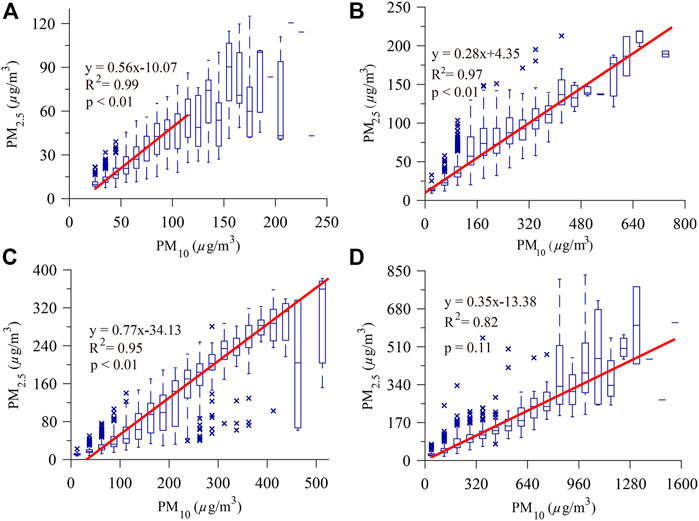
FIGURE 8. Box plots of daily average PM2.5 concentration based on PM10 concentration in (A) region I, (B) region II, (C) region Ⅲ and (D) region Ⅳ of Xinjiang from 2013 to 2019. Red line shows the variation trend of median value.
The linear fitting coefficient of the median value can be regarded as the average condition of PM2.5 and PM10 in a certain region. It is found that PM2.5 contributes more to particulate pollution in northern Xinjiang (regions I and III) with the slope being greater than 0.56. Especially in region III, the slope is greater than 0.75, which is close to the average value in winter of China and the annual average value in Beijing from 2015 to 2019 (Dong et al., 2020). Moreover, there are outliers with high PM2.5 concentration and low PM10 concentration in region III, and the proportion of PM2.5/PM10 greater than 0.75 gradually increases with the PM2.5 concentration. Southern Xinjiang (regions II and IV) shows more obvious characteristics of dust impact, with the linear fitting slope of median values being less than or equal to 0.35. Moreover, the particle concentration in region IV is much higher than that in region II. The upstream of region IV is the Taklimakan desert, where the combined effect of average wind and terrain transports dust aerosol southwestward to region IV and forms a convergence (Figure 6). Using the Goddard Chemistry Aerosol Radiation and Transport model with satellite data in 2000–2007, Guo et al. (2017) revealed that the aerosol divergence in southern Xinjiang is mainly affected by aerosol advection, while there is a strong convergence center of dust aerosols in the west of Tarim Basin and the north of Tibet Plateau, whose location basically coincides with region IV in this study. The monitoring stations in region II are mainly located in the upwind direction of the sand source and the strong divergence area, so the influence of sand and dust is lower than that in region IV.
Xinjiang has a vast territory. Affected by geography, climate, energy exploitation, urban development, and wide distribution of sand sources, the contributions of anthropogenic sources and sand-dust sources to PM2.5 pollution in different regions have remarkable differences.
In region I, the station-averaged occurrence frequency of days with the good level (daily PM2.5 concentration less than 75 μg·m−3) exceeds 96%. The pollution mainly appears in winter with the major pollutant of PM2.5, while the proportion of days with the ratio of PM2.5 to PM10 less than 0.4 is only 8.7%. As the industrial emission sources are mainly located in the south of region I (Figure 1A), attention should be paid to the pollution caused by local emissions and pollutants transported from the east and south of northern Xinjiang in winter.
In region III, which is also the core area of urban and industrial development in Xinjiang, where there are great differences in the pollution levels between winter and summer. The proportion of days with the ratio of PM2.5 to PM10 less than 0.4 is 4.54%, that is, the major pollutant in this region is PM2.5, and the pollution source has been changed from coal-burning to complex sources (Ma et al., 2016a). Therefore, it is necessary to strengthen the control of fine particulate pollutant emissions in winter. In the daily refined prevention and control stage, we should consider the impact of northern industrial emissions on downstream area under the influence of canyon topography and diurnal variation of wind.
In region II, there are coal and petrochemical bases in the north and middle of the region, and deserts in its east and south (Figure 1A). Affected by both anthropogenic sources and sand-dust sources, the pollution level is high in winter and spring, and the proportion of days with the ratio of PM2.5 to PM10 less than 0.4 is 34.28%. Figures 9A,B show the daily variations of air pollution in Turpan from January to March in 2016 and 2019, respectively. The variation of particulate pollution in 2016 shows remarkable stage characteristics (Figure 9A). PM2.5 is the major pollutant in January with the ratio of PM2.5 to PM10 being greater than 0.6. Dust concentration increases after the middle of February and the ratio of PM2.5 to PM10 drops below 0.4. In March, both the duration and intensity of PM2.5 pollution related to dust increase (marked by the black dotted rectangle). Compared with January 2016 (red dashed box in Figure 9A), although the overall pollution level was lower in January 2019 (red solid box in Figure 9B), the duration of pollution was significantly increased (29 days). Observations clearly reveal that, a dust weather around the turn of 2018–2019 led to a sharper rise in the concentration of PM10. The pollution level of PM10 decreased after the dust weather, but PM2.5 pollution continued to the end of January. The ratio of PM2.5 to PM10 also clearly reveals the transition of this pollution process (Figure 9B). This indicates that the mixing effect of dust weather and PM2.5 pollution in winter may be one of the important reasons for the increase of PM2.5 pollution duration in region II. Zhou et al. (2021) showed that the dust pollution in the hinterland of the desert area in Xinjiang and its surrounding areas is not rare in winter, where Turpan Basin and the Kumta desert in its southeast are one of the main source areas (Peng 2020). Cold air and the accompanying gale are the direct inducements of sand and dust. It is considered that the diurnal variation of air temperature can reflect the cold air activities on the synoptic-scale, and the temperature anomaly in a long period can reflect short-term climate anomalies. Thus, the winter average temperature of Turpan from 1951 to 2019 is analyzed, where the winter of a certain year refers to the period from November to the next January. It can be seen from Figure 9C that the winter temperature in this area shows a linear upward trend with the increase rate being 6.6°C per 100 a specially, the winter of 2015 is much warmer, while the winter of 2018 is colder. The daily temperature variations in the winter of 2015 and 2018 are further compared with the 68-years mean temperature in winter from 1951 to 2019. Focusing on the temperature variation in January (marked by green solid rectangle) shown in Figure 9D, it is found that there is an extreme high temperature value in the early and middle 10 days of January in 2016, which is 3.62°C higher than the same period in history, corresponding to the continuous PM2.5 pollution in the same period. In 2019, the temperature exhibits an obvious rising trend after a cold air process at the beginning of January, corresponding to the pollution process dominated by PM10 and PM2.5 alternately in the same period. Supplementary Figure S3 shows the annual variations of winter mean temperature and the duration of the longest pollution process in region II. It can be seen that the winter of 2018 is relatively cold, and the longest pollution duration interrupts the downward trend since 2016, with an average extension of 11.5 days compared with 2017. Besides, in January 2019, the mixed pollution of PM10 and PM2.5 appear in more than 90% of the stations (10/11) in region II, and are accompanied by a temperature conversion from cold to warm. This indicates that under the background of climate change, the temperature variation in winter of warm years is relatively gentle, and the stable weather leads to continuous PM2.5 pollution. However, in cold years, the temperature variation is intense, the mixing efficiency of sand-dust and anthropogenic pollutants increases, and the duration of pollution processes is prolonged under the alternative effects of dust and PM2.5 during the cold-warm transition period.
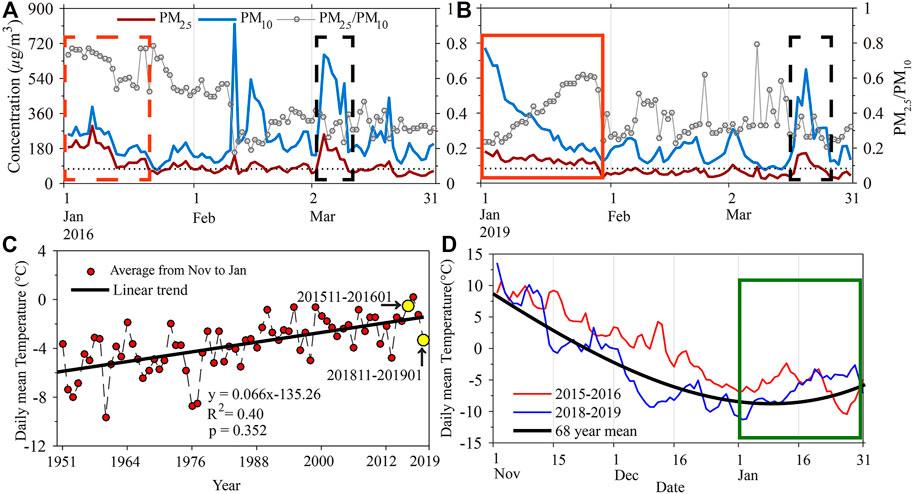
FIGURE 9. Variations of daily mean concentrations of PM2.5 (brown line), PM10 (blue line) and the ratio of PM2.5 to PM10 (gray circle) in Turpan from January to March in (A) 2016 and (B) 2019. (C) The variation of average temperature (red circle) and its linear trend (black line) in winter (November to January of the next year) in Turpan from 1951 to 2019. (D) The variation of daily temperature in winter of 2015 (red line), 2018 (blue line) and 68-years mean from 1951 to 2019 (black line). The dotted lines in (A) and (B) represent the concentration level of 75 μg·m−3, which is the threshold for air pollution. (The red dashed box shows the process of PM2.5 pollution in January 2016; the black dashed box shows the dust process in March; the solid red box shows the mixed pollution process of PM10 and PM2.5 in January 2019; the solid green box shows the transition process of cold to warm in January 2019 and its comparison with the average climate state).
In region IV, where the regional annual mean concentration reaches as high as 105.74 μg·m−3, dust pollution is dominant and the proportion of days with the ratio of PM2.5 to PM10 less than 0.4 is 57.84%. Dust weather may occur in all four seasons in this region, especially in spring. On the one hand, the wide-range dust weather under the influence of cold air activities in spring has an important impact on the transportation in northern Xinjiang and central and eastern China in the downstream (Wang et al., 2003; Li et al., 2009). On the other hand, due to the influence of large terrain and surface thermal properties, the PM2.5 concentration exhibits an obvious diurnal variation in this region. It is necessary to notice the impacts of advection and the location variation of convergence area on regional pollution.
In a word, considering different emission structures in the north and the south of Xinjiang, it is necessary to further control the growth of pollution in autumn and winter in the core polluted area generated by anthropogenic sources. In the transition area with pollution caused by anthropogenic sources and dust sources, it is also needed to pay attention to the impact of dust weather processes besides reducing relevant pollution emissions, and carry out the early warning and prevention in advance, thus reducing the impact of anthropogenic sources mixing with dust aerosol on the local pollution and the long-range transport to the downstream area.
Based on the hourly observation data at air quality monitoring stations from 2013 to 2019, Xinjiang is divided into four regions under the comprehensive consideration of PM2.5 concentration, geography, climate and administrative divisions by taking prefecture-level city as a unit. The typical pollution regions in Xinjiang are selected and compared with the typical regions in the central and eastern of China. Combined with the analysis of variance, the seasonal and diurnal variation characteristics of PM2.5 concentration in the four regions are discussed. Finally, the causes of pollution in each region are analyzed, and corresponding prevention and control suggestions are also given. The main conclusions are as follows.
The PM2.5 pollution regions in Xinjiang from north to south are clean area in the north of northern Xinjiang (region I), heavily polluted area of the Urumqi-Changji-Shihezi region (region III), moderately polluted region in the north of southern Xinjiang (region II), and severely polluted region in the south of southern Xinjiang (region Ⅳ). The regional-averaged PM2.5 concentration increases from region I to region Ⅳ. Except region III, the concentrations of PM2.5 in other regions show a decreasing trend year by year.
As highly polluted regions in northern and southern Xinjiang, the pollution situation in regions IV and III deserves more attention. Compared with the typical polluted regions in the central and eastern China, the occurrence frequency of PM2.5 pollution above the moderately polluted level in autumn and winter in region III increases since 2015 and is higher than those in the regions of eastern China. As a region with the lowest excellent rate and highest pollution rate, region Ⅳ becomes the region with most severe PM2.5 pollution among the typical regions in eastern and western China.
Combined with the variance analysis of PM2.5 concentration variations at different timescales and the ratio of PM2.5 to PM10, the spatio-temporal variation characteristics of PM2.5 pollution and the causes in each region of Xinjiang are explored. Region Ⅲ is a typical area affected by anthropogenic sources, where the seasonal variation plays a dominant role, and the PM2.5 concentration shows the characteristics of higher in autumn and winter and lower in spring and summer. Seasonal heating, industrial distribution and urban domestic emissions play a vital role in PM2.5 pollution. Region Ⅳ is a typical area affected by sand and dust. The weather process, seasonal and diurnal variations all play an important part in regional pollution processes. The large-scale topography, the distribution of sand sources and the surface thermal properties exert great impacts on the advection of particulate matter. Regions I and II exhibit the transitional characteristics. Specifically, region II is affected by the mixing effect of anthropogenic sources and dust sources, resulting the continuous pollution process dominated by PM10 and PM2.5 alternately in winter.
Although the overall pollution level in Xinjiang is lower than that in the traditional polluted regions in central and eastern China, the pollution level of PM2.5 in region Ⅳ and in autumn and winter of region III are higher than that in the most severely polluted regions in eastern China. In addition, affected by the mixing effect of anthropogenic sources and dust sources, the pollution duration is prolonged remarkably in the north of southern Xinjiang in some periods. In the mid-latitude westerlies, Xinjiang is in the upstream of the central and eastern China, and the change of pollution situation in this region will have a far-reaching impact on the prevention and control of PM2.5 in central and eastern China and even further downstream areas. Therefore, the pollution prevention and control work should be attached greater importance, and differentiated measures in the prevention and control of PM2.5 pollution should be taken in different regions and periods.
The raw data supporting the conclusion of this article will be made available by the authors, without undue reservation.
XY: Data curation and visualization; methodology; writing original draft. BG: Conceptualization; design of methodology; ensuring that the descriptions are accurate and agreed by all authors. AL: Evolution of overarching research goals; investigation. GC: Data collation and analysis. FF: Data analysis and visualization. DX: Visualization; writing reviewing and editing. YW: Visualization; Writing editing. XT: Data analysis and validation. LK: Writing reviewing and editing. ZW: Supervision.
This work is supported by the National Key R&D Program of China (Grant No. 2022YFC3702002) and National Natural Science Foundation of China (Grant No. 41877313) and the Strategic Priority Research Program (A) of the Chinese Academy of Sciences (Grant XDA19040204), and the National Key Scientific and Technological Infrastructure project “Earth System Science Numerical Simulator Facility” (EarthLab).
We appreciate CNEMC for providing the observation data over all of China.
Author FF was employed by the company 3Clear Technology Co., Ltd.
The remaining authors declare that the research was conducted in the absence of any commercial or financial relationships that could be construed as a potential conflict of interest.
All claims expressed in this article are solely those of the authors and do not necessarily represent those of their affiliated organizations, or those of the publisher, the editors and the reviewers. Any product that may be evaluated in this article, or claim that may be made by its manufacturer, is not guaranteed or endorsed by the publisher.
The Supplementary Material for this article can be found online at: https://www.frontiersin.org/articles/10.3389/fenvs.2022.1051610/full#supplementary-material
1National Bureau of Statistics (2021) http://www.stats.gov.cn/.
2The State Council, (2018) http://www.gov.cn/zhengce/content/2018-07/03/content_5303158.htm.
Abudumutailifu, M., Halik, Ü., Aishan, T. J., Keyimu, M. D., Nasirdin, N., and Ainiwaer, A. (2018). Variation characteristics of the main atmospheric pollutant concentration in Urumqi. Ecol. Environ. Sci. (in Chinese) 27 (3), 533–541. doi:10.16258/j.cnki.1674-5906.2018.03.018
Dong, J. D., Chen, X. L., Cai, X. B., Xu, Q. Q., Guan, T. Y., Li, T. H., et al. (2020). Analysis of the temporal and spatial variation of atmospheric quality from 2015 to 2019 based on China atmospheric environment monitoring station. Journal of Geo-information Science (in Chinese) 22 (10), 1983–1995. doi:10.12082/dqxxkx.2020.200212
Gu, K., Zhou, Y., Sun, H., Dong, F., and Zhao, L. (2020). Spatial distribution and determinants of PM2.5 in China's cities: fresh evidence from IDW and GWR. Environ. Monit. Assess. 193 (1), 15. doi:10.1007/s10661-020-08749-6
Guo, J., Yin, Y., Wang, Y. W., Kang, H. Q., Xiao, H., Chen, K., et al. (2017). Numerical study of the dust distribution, source and sink, and transport features over East Asia. China Environmental Science (in Chinese) 37 (3), 801–812. doi:10.3969/j.issn.1000-6923.2017.03.001
He, Q. Q., Zhang, M., Song, Y. M., and Huang, B. (2021). Spatiotemporal assessment of PM2.5 concentrations and exposure in China from 2013 to 2017 using satellite-derived data. Journal of Cleaner Production 286, 124965. doi:10.1016/j.jclepro.2020.124965
Jiang, P., Pan, X. M., Peng, Y. M., and Xu, T. T. (2020). Analysis of spatio-temporal distribution characteristics of air quality in Xinjiang region. Geospatial Information. (in Chinese) 18 (7), 85–86. doi:10.3969/j.issn.1672−4623
Kim, W., Doh, S. J., and Yu, J. (2012). Asian dust storm as conveyance media of anthropogenic pollutants. Atmospheric Environment 49, 41–50. doi:10.1016/j.atmosenv.2011.12.034
Li, J. (2009). Characteristics, sources, long-range transport of dust aerosol over central Asia and its potential effect on global change, 3−5. China: Fudan Universtiy.
Li, J., Zhuang, G. S., Huang, K., Lin, Y. F., Wang, Q. Z., Guo, J. H., et al. (2009). The chemistry of heavy haze over Urumqi, central Asia. J. Atmos. Chem. 61, 57–72. doi:10.1007/s10874-009-9124-7
Li, X. (2013). The formation mechanism of air pollution in winter in the gap town of Urumqi (in Chinese). China: University of Chinese Academy of Sciences Library, 12–15.
Liu, Y., Teng, Y., Liang, S., Li, X., Zhao, J., Shan, M., et al. (2021). Establishment of PM10 and PM2.5 emission inventories from wind erosion source and simulation of its environmental impact based on WEPS-Models3 in southern Xinjiang, China. Atmospheric Environment 248, 118222. doi:10.1016/j.atmosenv.2021.118222
Ma, Z., Deng, J. G., Li, Z., Li, Q., Zhao, P., Wang, L. G., et al. (2016a). Characteristics of NOx emission from Chinese coal-fired power plants equipped with new technologies. Atmospheric Environment 131, 164–170. doi:10.1016/j.atmosenv.2016.02.006
Ma, Z., Hu, X. F., Sayer, A. M., Levy, R., Zhang, Q., Xue, Y. G., et al. (2016b). Satellite−based spatiotemporal trends in PM2.5 concentrations: China, 2004−2013. Environmental Health Perspectives 124 (2), 184–192. doi:10.1289/ehp.1409481
Manktelow, P. T., Carslaw, K. S., Mann, G. W., and Spracklen, D. V. (2010). The impact of dust on sulfate aerosol, CN and CCN during an East Asian dust storm. Atmos. Chem. Phys. 10 (2), 365–382. doi:10.5194/acp-10-365-2010
Peng, L. (2020). Numerical simulation of sand and dust weather in different seasons in Northwest China and the transport and source of dust aerosols (in Chinese). China: Lanzhou University, 23–37.
Qiu, H. M., Zhou, C. L., Yang, F., Ma, K., Ye, X. T., and Zhou, X. Y. (2018). Analysis of a typical regional sand-dust event over the eastern Tarim Basin. Journal of Meteorology and Environment 34 (2), 19–27. doi:10.3969/j.issn.1673-503X.2018.02.003
Rohrer, F., and Berresheim, H. (2006). Strong correlation between levels of tropospheric hydroxyl radicals and solar ultraviolet radiation. Nature 442 (13), 184–187. doi:10.1038/nature04924
Shen, Y. J., Zhang, X. D., Brook, J. R., Huang, T., Zhao, Y., Gao, H., et al. (2016). Satellite remote sensing of air quality in the energy golden triangle in northwest China. Environ. Sci. Technol. Lett. 3, 275–279. doi:10.1021/acs.estlett.6b00182
Su, J. T., Zhang, C. X., Hu, Q. H., Liu, H. R., and Liu, J. G. (2021). Analysis of spatial and temporal change trend of Xinjiang NO2 in 2007-2017 based on satellite hyperspectral remote sensing. Spectroscopy and Spectral Analysis (in Chinese) 41 (5), 1631–1638. doi:10.3964/j.issn.1000-0593(2021)05-1631-08
Sun, Y. L., Zhuang, G. S., Huang, K., Li, J., Wang, Q. Z., Wang, Y., et al. (2010). Asian dust over northern China and its impact on the downstream aerosol chemistry in 2004. J. Geophys. Res. 115, D00K09. doi:10.1029/2009JD012757
Tang, X. L., Lv, X., and Ouyang, Y. (2016). Spatial and temporal variations of extreme climate events in Xinjiang, China during 1961-2010. American Journal of Climate Change 5 (3), 360–372. doi:10.4236/ajcc.2016.53027
Turap, Y., Talifu, D., Wang, X., Abulizi, A., Maihemuti, M., Tursun, Y., et al. (2019). Temporal distribution and source apportionment of PM2.5 chemical composition in Xinjiang NW-China. Atmospheric Research 218, 257–268. doi:10.1016/j.atmosres.2018.12.010
Wang, S. G., Wang, J. Y., Zhou, Z. J., Shang, K. Z., Yang, D. B., and Zhao, Z. S. (2003). Acta Geographica Sinica (in Chinese) 58 (2), 193–200. doi:10.11821/xb200302005
Wang, S., Li, G. G., Gong, Z. Y., Du, Li., Zhou, Q. T., Meng, X. Y., et al. (2015). Spatial distribution, seasonal variation and regionalization of PM2.5 concentrations in China. Sci. China Chem. 58 (9), 1435–1443. doi:10.1007/s11426-015-5468-9
Wang, S., Wang, X. J., Chen, D. D., Ji, C. R., Jiang, Y. A., and Liu, J. J. (2019). The spatial and temporal variation characteristics and influencing factors of dust weather in the southern Xinxiang from 1961 to 2017. Journal of Arid Land Resources and Environment 33 (9), 82–85. (in Chinese). doi:10.13448/j.cnki.jalre.2019.269
Wang, W., Samat, A., Abuduwaili, J., and Ge, Y. (2020). Spatio-temporal variations of satellite-based PM2.5 concentrations and its determinants in Xinjiang, northwest of China. Int J Environ Res Public Health 17 (6), 2157. doi:10.3390/ijerph17062157
Xu, Y. Y., and Lamarque, J. F. (2018). Isolating the meteorological impact of 21st century GHG warming on the removal and atmospheric loading of anthropogenic fine particulate matter pollution at global scale. Earth's. Future 6 (3), 428–440. doi:10.1002/2017ef000684
Yang, L. M., Liu, J., Ran, L. K., and Zhang, Y. L. (2018). Simulation of a torrential rainstorm in Xinjiang and gravity wave analysis. Chinese Phys. B 27 (02), 059201–059213. doi:10.1088/1674-1056/27/5/059201
Yao, X. F., Ge, B. Z., Yang, W. Y., Li, J. J., Xu, D. H., Wang, W., et al. (2020). Affinity zone identification approach for joint control of PM2.5 pollution over China. Environmental Pollution 265 (9), 115086–121443. doi:10.1016/j.envpol.2020.115086
You, C. (2018). Temporal and spatial variation characteristicsof PM2.5 and PM10 concentrations in Urumqi. China: Xingjiang University, 3–5.
Zhang, Q., Geng, G. N., Wang, S. W., Pichter, A., and He, K. B. (2012). Satellite remote sensing of changes in NOx emissions over China during 1996-2010. Chin. Sci. Bull. 57 (16), 2857–2864. doi:10.1007/s11434-012-5015-4
Zhao, X., Zhou, W., Han, L., and Locke, D. (2019). Spatiotemporal variation in PM2.5 concentrations and their relationship with socioeconomic factors in China's major cities. Environment International 133 (A), 105145. doi:10.1016/j.envint.2019.105145
Zhou, H. J., Liu, X., Liu, Q., Chen, Y. H., and Liu, P. P. (2021). Vertical distribution and potential sources of polluted aerosols over the hinterland of Taklimakan Desert. Acta Scientiae Circumstantiae (in Chinese) 41 (9), 3725–3734. doi:10.13671/j.hjkxxb.2021.0134
Keywords: PM2.5, PM10, Xinjiang, zoning, spatio-temporal variations, comparative analysis
Citation: Yao X, Ge B, Li A, Chen G, Fan F, Xu D, Wang Y, Tang X, Kong L and Wang Z (2023) Spatio-temporal variation of PM2.5 pollution in Xinjiang and its causes: The growing importance in air pollution situation in China. Front. Environ. Sci. 10:1051610. doi: 10.3389/fenvs.2022.1051610
Received: 23 September 2022; Accepted: 07 December 2022;
Published: 04 January 2023.
Edited by:
Jun Zhao, Sun Yat-Sen University, ChinaReviewed by:
Guicai Ning, The Chinese University of Hong Kong, ChinaCopyright © 2023 Yao, Ge, Li, Chen, Fan, Xu, Wang, Tang, Kong and Wang. This is an open-access article distributed under the terms of the Creative Commons Attribution License (CC BY). The use, distribution or reproduction in other forums is permitted, provided the original author(s) and the copyright owner(s) are credited and that the original publication in this journal is cited, in accordance with accepted academic practice. No use, distribution or reproduction is permitted which does not comply with these terms.
*Correspondence: Baozhu Ge, Z2ViekBtYWlsLmlhcC5hYy5jbg==
Disclaimer: All claims expressed in this article are solely those of the authors and do not necessarily represent those of their affiliated organizations, or those of the publisher, the editors and the reviewers. Any product that may be evaluated in this article or claim that may be made by its manufacturer is not guaranteed or endorsed by the publisher.
Research integrity at Frontiers
Learn more about the work of our research integrity team to safeguard the quality of each article we publish.