 Huiqun Liu
 Lixin Chen
94% of researchers rate our articles as excellent or good
Learn more about the work of our research integrity team to safeguard the quality of each article we publish.
Find out more
ORIGINAL RESEARCH article
Front. Environ. Sci. , 20 October 2022
Sec. Environmental Economics and Management
Volume 10 - 2022 | https://doi.org/10.3389/fenvs.2022.1051015
This article is part of the Research Topic Global Excellence: Environmental Issues and Global Value Chain in Asia View all 24 articles
The increasing international division of production and stringent environmental policies coexist, which lets people focus more on the research on the relationship between environmental regulation and the global value chain (GVC). Based on the characteristics of service sectors, this study proposes hypotheses of how environmental regulation affects GVC position in service sectors and empirically investigates it by using panel data of the GVC position index in service sectors and the environmental performance index (EPI) from selected 41 major economies during 2006–2014. Our empirical study found the following: first, environmental regulation has significantly promoted the increase of GVC position in service sectors, which obviously can verify the validity of the Porter hypothesis. Second, environmental health has a greater effect on GVC position in service sectors than on ecosystem vitality. Third, the influence of environmental regulation on GVC position in service sectors is heterogeneous under different quantiles. The higher per capita income, the more stringent their environmental regulation and the stronger their impact on GVC position in service sectors. In general, this study will contribute to a better understanding of the relationship between environmental regulation and GVC.
Over the past 3 decades, the trend of dividing production into multiple specialized links in order to exploit the different comparative advantages in factor endowments and efficiencies across countries is becoming more and more obvious. With the rise of the global production networks, a global value chain (GVC) has been gradually formed. In the era of the GVC, which has dramatically changed the patterns of production and trade across countries, the offshoring production is becoming more and more popular. Countries undertake upstream or downstream activities in the GVC according to their comparative advantage and thus get different profit gains (Hummels et al., 2001; Antras et al., 2012). Specifically, upstream activities such as design and research and development (R&D) are always involved with high value-added, high-tech, and low-carbon production links, where countries can get substantial profits. In contrast, downstream activities of the GVC, such as raw materials and intermediate inputs, are always related with low value-added low-tech, high-energy-consumption links, where countries engaged in can only obtain lower profits (Wang et al., 2017; Del et al., 2018; Mouanda, 2019; Wang J. C. et al., 2021).
The remarkable improvement of living standards has enhanced people’s awareness of environmental protection and sustainable development. The concept of sustainable development has been widely accepted. Industrial upgradation and international production cooperation have an important impact on the global environment. The industrial structures of developing countries such as China and India face the dilemma of “low-end locking” when participating in the GVC, intensifying pressure on reducing carbon emissions domestically (Wang et al., 2022). Therefore, governments around the world have strengthened policies, which implicitly or explicitly increase the production cost, meeting the Millennium Development Goals (MDGs). The environment becomes an input factor of production and, hence, can change comparative advantages across countries (Hamamoto, 2006; Arouri et al., 2012; Albrizio et al., 2017).
The increasing international division of production and the stringent environmental policies coexist, which lets people focus more on the research on the relationship between environmental regulation and the GVC. Numerous studies have shown that environmental regulation policies have various impacts on enterprise innovation, productivity, upgrading of industrial structure, FDI, and so on, but few on the GVC. In addition, prior studies mainly focus the impact of environmental regulation on the manufacturing industry of a country or region. The expansion of the GVC in services has been stimulated recently by transnational corporations. Although the service sectors are “smoke-free” industries relative to the manufacturing sectors, the impact of environmental regulation on the GVC position in service sectors need to be further tested and analyzed.
Based on the aforementioned theoretical and practical background, this study attempts to answer the following questions: 1) what is the impact of environmental regulation on GVC position in service sectors and what is the theoretical mechanism of the impact? 2) What is the heterogeneity of this impact across countries with different economic development level?
The major contributions of this study lie in the following three aspects: first, we theoretically analyze the mechanism on how the environmental regulation affects the GVC position in service sectors, which is a new research perspective on GVC. Second, we use the latest value-added decomposition method to measure the GVC position in service sectors and get the GVC position index in service sectors from selected 41 major economies, which add the data of the service industry’s value chain position for GVC research. Third, we find that environmental regulation has significantly promoted the increase of GVC position in service sectors, which obviously can verify the validity of the Porter hypothesis.
The article is organized as follows. Section 2 puts forward the research hypothesis after reviewing the literature. Section 3 measures the indicator used in the empirical analysis. Section 4 describes the construction of an econometric model and describes the variables and data source. Section 5 presents estimation results with corresponding interpretation, and numerous robustness tests are applied. Section 6 concludes and discusses policy implications. Some detailed summary of descriptions and results are provided in appendices.
The literatures focus on the impact of environmental regulation in a country or region, mainly on the macro factors such as total factor productivity, industry development, trade flow, international competitiveness, and so on. The mechanisms mainly revolve around the Porter hypothesis and the pollution haven hypothesis (PHH).
According to neoclassical economics, environmental regulation will increase private production costs and reduce the competitiveness of enterprises, thus offsetting the positive effects of environmental regulation on society and producing negative effects on economic growth. Jaffe et al. (1995) pointed out that the reason why the U.S. economy has experienced a trade deficit for more than a decade is the environmental regulation policy implemented by the U.S. government in recent years. Environmental protection leads to high economic costs, which seriously hinders the productivity growth of manufacturers and their competitiveness in the international market. However, Porter, Linde, and other scholars believed that the relationship between environmental regulation and economic development cannot be simply divided into two opposites. They believe that appropriate environmental regulation can promote enterprises to carry out more innovation activities, which will improve the productivity of enterprises, offset the costs brought by environmental protection, and enhance the profitability of enterprises in the market. This is Porter’s hypothesis (Michael, 1991; Michael and Claas, 1995). The Porter hypothesis holds that the main way for environmental protection policies to have an impact on the economy is to promote enterprises to carry out technological innovation or adopt innovative technologies. Although it may increase costs in the short term, it can improve enterprise production efficiency, increase enterprise competitiveness, and promote economic growth in the long term, which we call “innovation offsets”. The Porter hypothesis also affirms the role of the government in coordinating the relationship between economic growth and environmental protection policies. First, it is difficult for enterprises to have sufficient information on innovation technology related with environmental regulation, whereas the government has a natural advantage in obtaining relevant information. Second, the government should design appropriate mechanisms and make use of market forces to guide enterprises to implement environmental regulation.
Since the Porter hypothesis was put forward in 1991, whether environmental regulation can improve the competitiveness of enterprises has become an academic debate. On one hand, the view that environmental regulation will enhance competitiveness is highly supported (Michael and Claas, 1995; Murty and Kumar, 2003; Hamamoto, 2006; Bohringer et al., 2012). For example, Wang S. et al. (2021) found that there exists a positive effect of environmental regulation on China’s industrial sector position in the GVC, which means that environmental regulation has significantly upgraded the GVC position. Chen et al. (2022) found that environmental regulation have significantly increased the markups of export products, which indicated that environmental regulation improved the firms’ export competitiveness. On the other hand, some previous studies do not support the Porter hypothesis. For example, Van and Cees, 1997 analyzed the relevant data of OECD countries using the gravity model and concluded that the stringent the environmental regulation will lead, the higher the environmental cost, thus reducing export competitiveness. Wang and Zhang (2022) found that some Chinese firms had to cut production and went bankrupt finally because of the increasing production cost caused by environmental regulation. Hancevic (2016) found that environmental regulations had a negative effect on the productivity of electricity generation in the American power industry, whereas Stoever and Weche (2018) drew a conclusion that water taxes had reduced the overall competitiveness of firms in Germany. Domazlicky and Weber (2004) did not find that environmental regulation would inevitably reduce the production efficiency in the empirical analysis of the American chemical industry.
The standard trade theory holds that trade liberalization will make the polluting industries of developed countries with strict environmental regulation migrate to developing countries with loose environmental standards, which make the developing countries become “pollution havens” for specialized production of polluting products. The process of offshoring production to developing countries caused by environmental regulation is known as PHH. The hypothesis holds that under other conditions unchanged, industries with high energy consumption and high pollution will flow from countries with strict environmental protection policies to countries with relatively loose policies (Copeland and Taylor, 1994; Batabyal, 1998). Since the 1960s and 1970s, the global industrial structure began to shift. First, labor-intensive industries flowed from Europe and the United States to Japan and then to South Korea, Singapore, Taiwan, China, and Hong Kong. In the 1980s, with the implementation of opening-up policies in some countries in Asia and Latin America, industrialization extended to these regions. Although the transfer of global industrial structure is the result of multiple factors, it is not unrelated to the environmental policy. PHH has been extensively discussed for more than 30 years. The outward transfer of carbon-intensive industrial activities is undoubtedly a beggar-my-neighbor policy (Brunnermeier et al., 2004; Raspiller and Riedinge, 2005; Levinson and Taylo, 2008; Kalamova and Johnstone, 2012; Kahouli et al., 2014; Zhong et al., 2021; Qi et al., 2022; Wang and Zhang, 2022).
The validity of the PHH has also been mixed. In recent years, economists from Norway, Germany, and the United States have analyzed the carbon emissions from economic sectors and confirmed the existence of a “pollution paradise”. For example, Tomasz and Christina (2016) found that developed countries use international trade to transfer the pressure of emissions to the outside while stabilizing or reducing their carbon emissions. Duan et al. (2021) used the multi-country input–output model to test the PHH in the context of the GVC and found that PHH was also valid in value-added trade. Zhao et al. (2013) empirically tested the PHH in combination with China’s trade model, and the empirical result supported this hypothesis. However, Nathaniel et al. (2020) studied the impact of FDI on the ecological environment of countries along the Mediterranean coast and found that the PHH is not tenable in this region. Hu et al. (2021) found that the rise of the GVC position significantly promotes the green technology innovation efficiency. Wang S. et al. (2021) studied the relationships among the degree of participation in the GVC, technological progress, and environmental pollution from the perspective of industries in developing countries and found that the GVC reaches a certain level, and technology can reduce pollution.
Although the GVC approach is originally developed for goods production, the ever-changing communication and information technology makes it possible for many services that could not be provided across borders. Transnational companies take advantage of the low-cost and skilled labor force in developing countries to integrate the middle- and low-end activities of some service sectors, such as customer service center, business process, and non-core parts of accounting services, to further reduce their operating costs and expand profit margins. A major part of the growth in world trade in services is explained by the development of the GVC in service sectors. Some developing countries with the earliest export outsourcing services, such as India and the Philippines, have begun to turn to outsourcing services with higher added value, such as R&D, financial analysis, and legal analysis (Apte and Richard, 1995; Gereffi and Fernandez, 2011). For the developing countries, the opportunities for exporting services are, therefore, largely tied to the insertion they can achieve within the GVC, either in specifically service chains (e.g., banking services, audiovisual materials, advertising, health services, etc.) or in service linkages in manufacturing chains (e.g., logistic services, R&D, business, etc.) (Lopez et al., 2011).
The characteristics of the GVC in service sectors determine that the effect of environmental regulation on it is different from that on the manufacturing industry. First, the implementation of strict environmental regulation will increase the service cost and decrease the service supply of pollution-intensive service sectors. In order to avoid losses, some service supplies will spontaneously be transferred to countries with loose environmental regulation. The clean intensive service sectors will increase their share and realize the adjustment of industrial structure. Second, the service industry itself is a clean industry, and its cost is not easily affected by environmental policies. Thus, the implementation of environmental regulation will lead to increase in the relative cost of manufacturing sectors to the service industry. Based on the rational decision-making of consumers, services will replace commodities to realize the optimization and upgradation of the service sectors. Third, the implementation of strict environmental regulations can improve the ecological environment and produce positive external benefits, which will make the service sectors more profitable and further promote the development of local transportation, accommodation, catering sectors, and so on.
Based on the characteristics of the GVC in service sectors and aforementioned analysis, this study proposes the following hypotheses:
Hypothesis 1. The implementation of environmental regulation can promote the GVC position in service sectors.When a country implements strict environmental regulation policies, service sectors have to pay extra environmental costs; thus, the service costs get higher. Based on the assumption of economic rationality, enterprises will carry out innovation and R&D activities to reduce costs. Environmental regulation forces enterprises to make technological progress and enhance their international competitiveness and then improve the GVC position.
Hypothesis 2. The influence of environmental regulation on GVC position in service sectors is heterogeneous.On one hand, there are differences in the intensity of environmental regulation across countries. Generally speaking, countries with high per capita income are more inclined to formulate and implement stringent environmental regulation than countries with low per capita income. The higher the intensity of environmental regulation, the more effective it will be in promoting the GVC position. On the other hand, countries with different levels of development have different effects of environmental regulation on GVC position in service sectors.
Referring to the method proposed by Lu (2009) and Chakraborty and Mukherjee (2013), this study uses the environmental performance index (EPI) as an indicator for environmental regulations. The EPI provides a powerful policy tool to reflect the government’s implementation of environmental goals, which can help countries identify problems and formulate better environmental policies to support the efforts to achieve the United Nations sustainable development goals and promote society toward a sustainable future.
EPI scores and ranks countries or regions according to 32 performance indicators into 11 issue categories, including environmental health and ecosystem vitality. Table 1 shows the composition and weight decomposition of the EPI (Yale Center for Environmental Law and Policy, 2022).
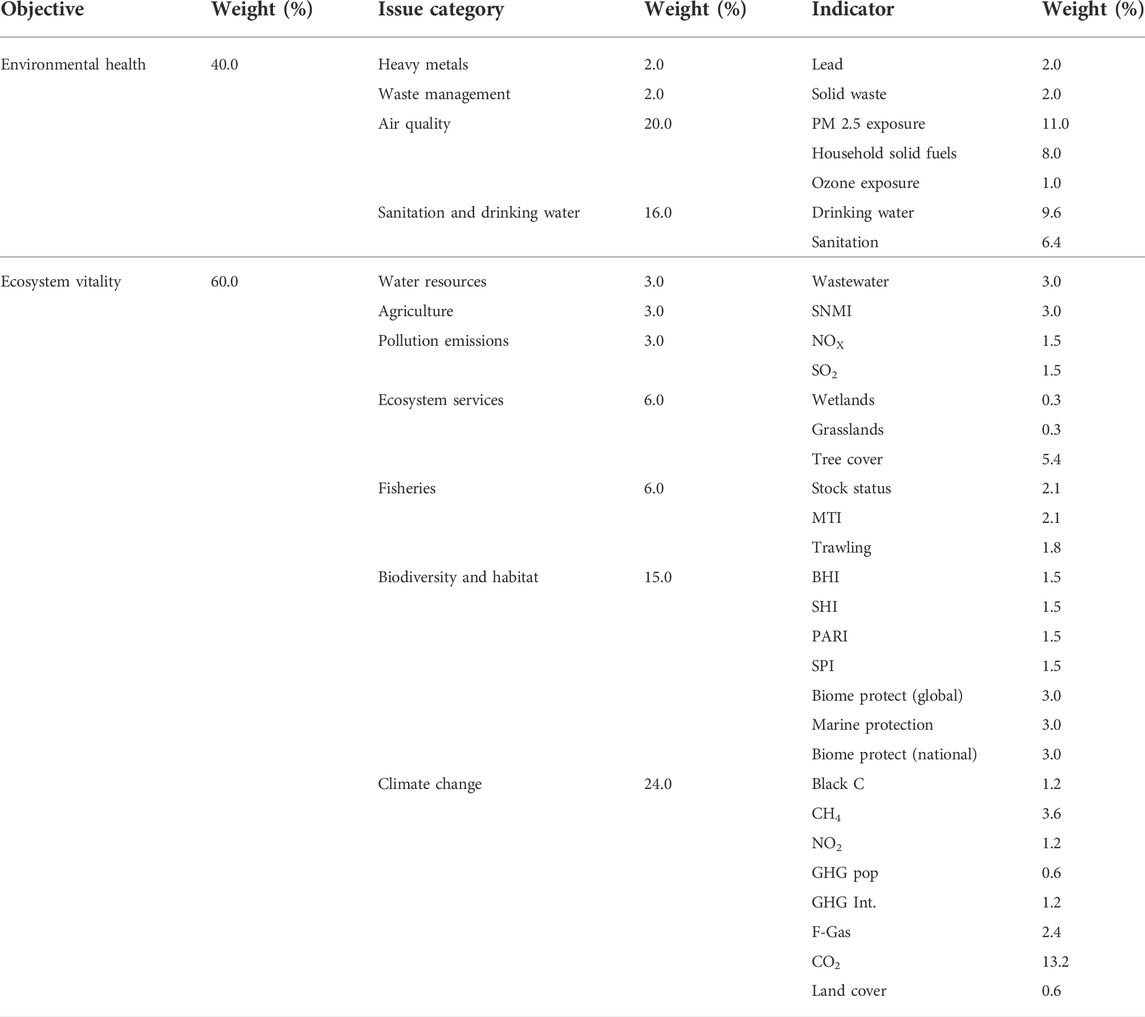
TABLE 1. Composition and weight decomposition of the EPI.
In order to get in line with the GVC position index, this study analyzes the EPI of the selected 41 sample countries during the even years of 2006–2014, including 33 high-income countries (Australia, Austria, Belgium, Canada, Croatia, Cyprus, Czech Republic, Denmark, Estonia, Finland, France, Germany, Greece, Hungary, Ireland, Italy, Japan, Latvia, Lithuania, Luxembourg, Malta, the Netherlands, Norway, Poland, Portugal, Slovakia, Slovenia, South Korea, Spain, Sweden, Switzerland, the United Kingdom, and the United States) and eight middle-income countries (Brazil, Bulgaria, China, India, Mexico, Romania, Russia, and Turkey). The division of high-income countries and middle-income countries is based on the identification of the national income level in the Asian Bank Database (ABD).
Figure 1shows the trend of the EPI in high-income countries. Overall, the countries with high scorers formulate and implement the long-term environmental protective policies and plans to defend public health, preserve natural resources, and decrease greenhouse gas emissions. With its outstanding performance in climate change, agriculture, fisheries, forests, water sources, air pollution and environmental burden, Switzerland once again ranked first in 2014. While high-income countries are commendable in many aspects, such as expanding the coverage of safe drinking water and sanitation facilities and reducing child mortality, trends in other areas are worrying, such as fishing, wastewater treatment, and air quality. Sweden and Norway follow closely, and Luxembourg, the United Kingdom, and Finland also have high levels of environmental regulation. Malta’s EPI has the largest fluctuation range, increasing from 47 to 67. The United States, the largest economy in the world, is at a low level among high-income countries in terms of the EPI.
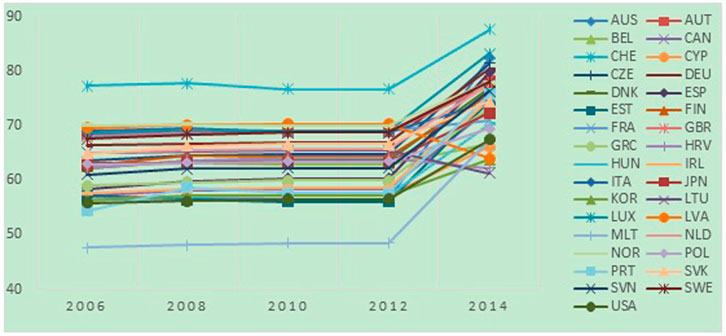
FIGURE 1. Trend of the EPI in high-income countries.
Compared with the group of high-income countries, the EPI of middle-income countries is generally lower. Figure 2 shows the trend of EPI in middle-income countries. Among the eight middle-income countries, India’s EPI is often at the lowest level compared with other countries in the same period, with the lowest value of 31 and the highest value of 52. From 2006 to 2014, Brazil’s EPI decreased from 61 to 53, indicating that Brazil is gradually deregulating. The EPIs of Mexico and Russia have roughly the same trend. The EPI of China ranges from 40 to 45, which is only higher than that of India in some years. Surprisingly, China’s performance in carbon reduction is very eye-catching. In the past 10 years, China is the only developing country that has achieved the same rate of carbon reduction and greenhouse gas increase. On the whole, some middle-income countries are gradually attaching importance to environmental problems and trying to solve the increasingly serious environmental problems, causing the EPI to increase.
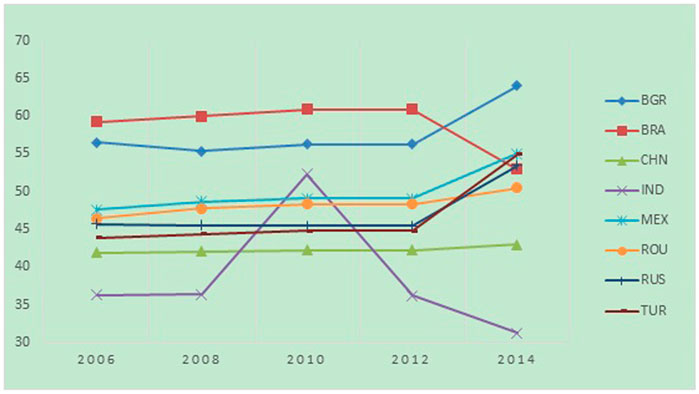
FIGURE 2. Trend of the EPI in middle-income countries.
In addition, if we compare the EPI between the group of high-income countries and the group of middle-income countries, we can find that the standard deviation of the EPI in middle-income countries is larger (see Supplementary Appendix Table SA1), indicating that the EPI fluctuates more violently. There is still an obvious gap in the EPI between high-income countries and middle-income countries, which provide convenience that countries with high per capita income are more inclined to formulate and implement stringent environmental regulation than countries with low per capita income.
Since 2001, scholars have carried out significant research on the GVC. In view of the heterogeneity of industrial attributes, the systematicness of data sources, the differences in the scope of application of indicators, and the measurement results of various industries embedded in the GVC are different. How to quantify the specific embedded position of a country or industry in the GVC has not yet formed a unified measurement standard. The representative methods to measure the status of the GVC in the existing research mainly include the vertical specialization index, export product price index, export technology complexity index, GVC status index, and upstream index (Michaely, 1984; Hummels et al., 2001; Schott, 2004; Koopman et al., 2010).
Koopman et al. (2010) first proposed the GVC status index to measure a country’s GVC position in a specific sector. They believed that even if the two countries participate in the international division of labor to the same extent, the division of labor status reflected in the value chain would be different. Therefore, based on the input–output method, they proposed a macro measurement method to reflect the status of a country in the GVC. Specifically, the GVC status index reflects the difference between the logarithm of intermediate goods exported by an industry of a country to other countries and the logarithm of imported intermediate goods included in the exports of that industry. This study uses Koopman’s method to measure the GVC position index in service sectors. The specific formula is as follows.
In Eq. 1, the subscripts
When participating in the division of labor in the GVC, a country plays two roles: the supplier of intermediate inputs (measured by the value added of exports) and the demander (measured by indirect value-added exports). If it plays a more supplier role, it means that the country is in the upstream of the GVC. The greater the GVC status index, the closer it is to the upstream of the GVC, and the higher the international division of labor. In contrast, the smaller the GVC status index, the closer it is to the downstream of the GVC, and the lower the division of labor status (Qu et al., 2020). Regarding the classification standard of the service industry, this study selects 32 service sectors (see Supplementary Appendix Table SA2) based on the classification standard of the World Input–Output Database (WIOD).
Using the world input–output table provided by WIOD (Timmer et al., 2015), this study calculates the
On the basis of the previous theoretical analysis and hypothesis, this study explores the effect of environmental regulation on the GVC position in the service sectors and constructs a fixed-effect panel data econometric model, as shown in Eq. 2:
In Eq. 2, the subscripts
In this study,
(1) Capital stock (
(2) Intensity of R&D (
(3) Intensity of utilization of foreign capital (
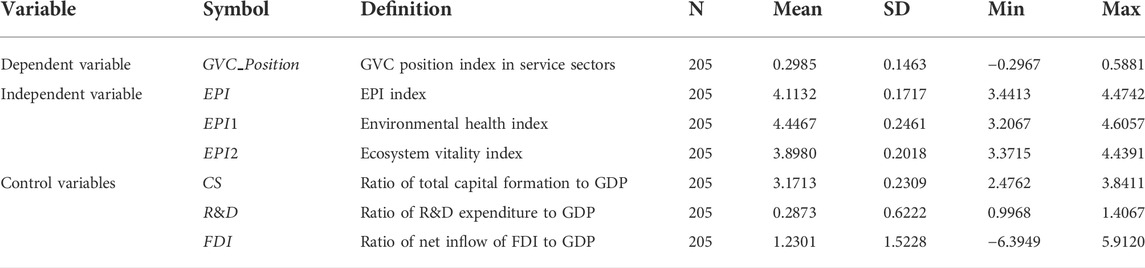
TABLE 2. Descriptive statistics of variables.
The data required to calculate the
The sample data need to be tested for stationarity before panel data regression in order to ensure the reliability and the accuracy. In this study, LLC, IPS, HT, ADF-Fisher, and Hardy LM test methods are selected to carry out the unit root test. Table 3 shows that all the tests reject the original hypothesis at the level of the 1% unit root test, that is, no unit root is found in the model. Therefore, we can assume that the variables in the model are one-order, single-integral stable variables.
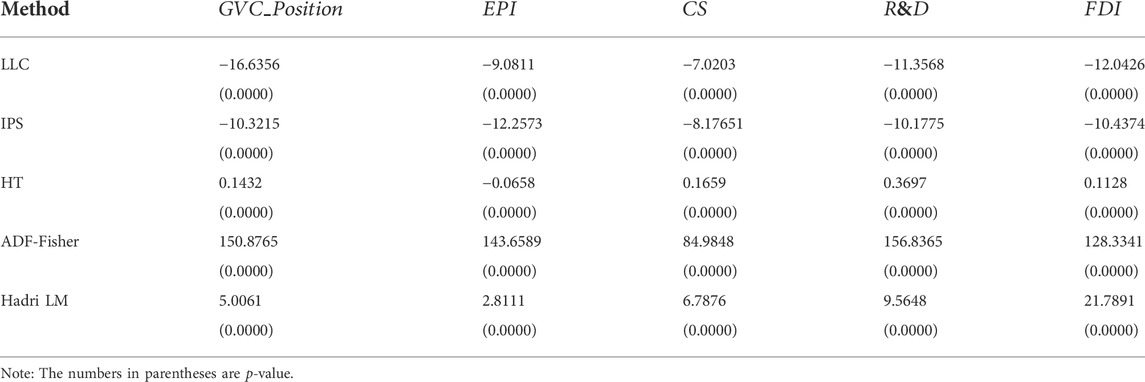
TABLE 3. Results of unit root test for primary variables.
In order to further test whether there is a long-term stable equilibrium relationship between variables, the Pedroni and Kao cointegration test is used in this study to avoid false regression, and the results are shown in Table 4. Pedroni and Kao tests reject the original hypothesis at the level of the 1% cointegration relationship, which means there is a long-term stable equilibrium relationship between variables in the model, and the regression residuals of the model are stationary.
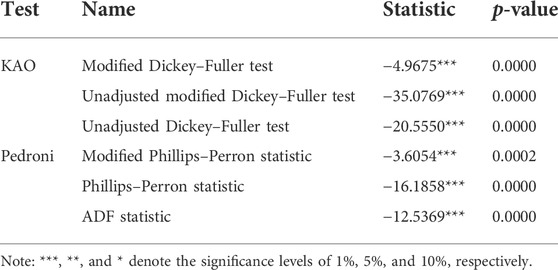
TABLE 4. Cointegration test results.
According to Eq. 2, we empirically analyze the effect of environmental regulation on the GVC position in service sectors and perform panel regression on the sample variables. The model regression is carried out with STATA16.0 software. The regression results are shown in Table 5.
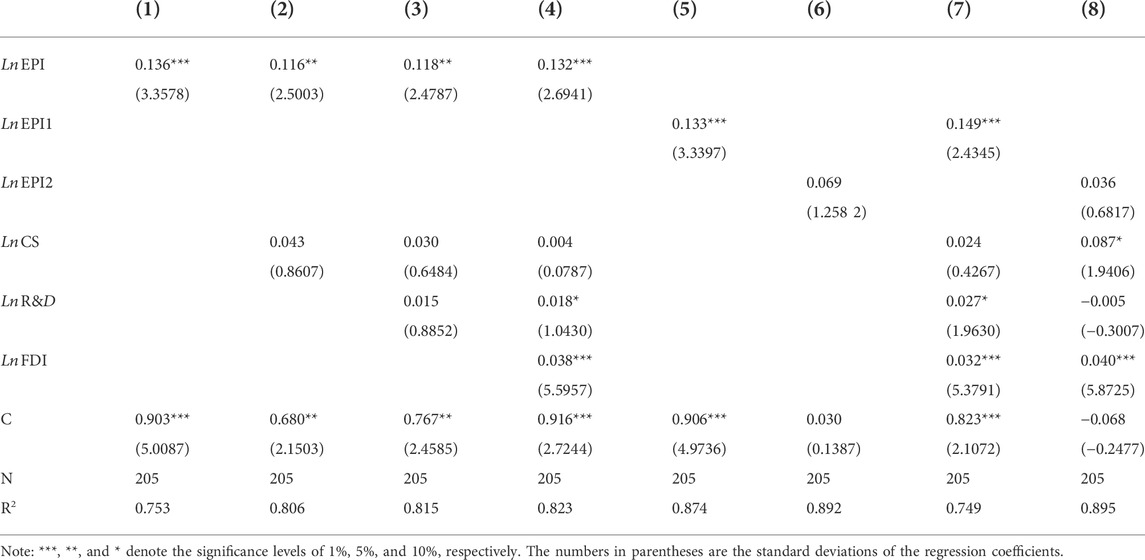
TABLE 5. Effects of EPI on the GVC position in service sectors for 41 major economies.
Columns (1)–(4) in Table 5 are the regression results by adding control variables one by one. As Table 5 shows, the regression coefficient of
Columns (5)–(8) in Table 5 are the regression results of EPI decomposition. The regression coefficient of
Generally speaking, the result of traditional regression analysis only shows an overall average effect of the explanatory variables. The different effects of the independent variables on the dependent variables under different quantiles have not been explained (Koenker, 2005; Yang and He, 2010). In order to accurately describe the overall effect of the conditional distribution of the EPI on the GVC position in service sectors, this study uses the conditional quantile regression.
Table 6 reports the results based on the quantile regression model. Columns (1) and (2) of Table 6 present the empirical results based on the median of
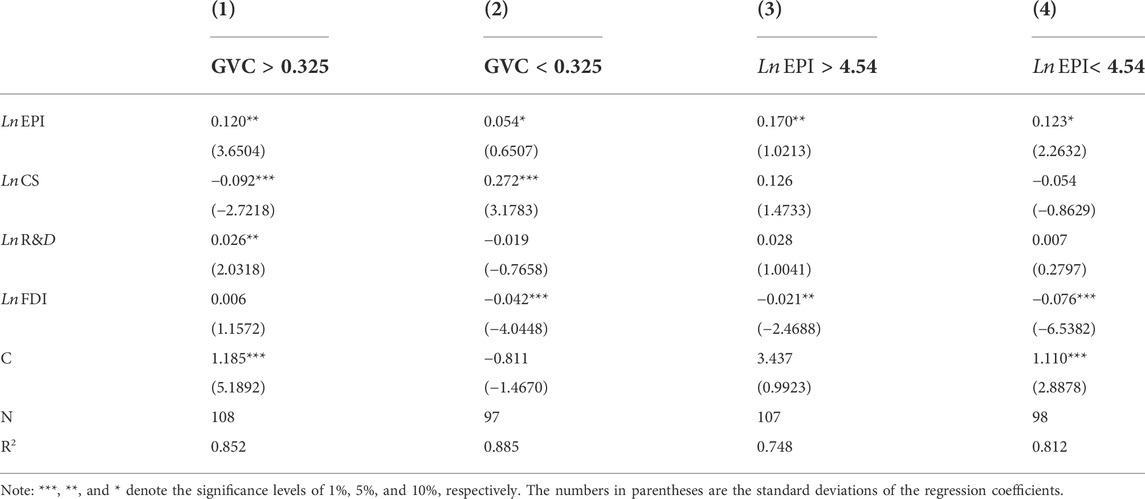
TABLE 6. Quantile regression results.
From a worldwide perspective, countries with a high level of service industry development also have a strong comprehensive national strength and a first mover advantage in the process of industrial upgrading. They have transferred some high pollution and high energy consumption production departments to countries with a low level of development by looking for pollution shelters. This is consistent with the north–south trade model (Chichilnisky, 1994). Therefore, for countries with a high degree of development of the service industry, strict environmental regulation can significantly promote the GVC position in service sectors.
Columns (3) and (4) of Table 6 present the empirical results based on the median of the EPI. When
Prior studies found that endogenous issues consist of reverse causality, omitted variable, and measuring error, which might be caused by the bias and inconsistency in the estimation results (Bound et al., 1995; Klette and Griliches, 1996). This study adopts 2SLS estimation to avoid the possible endogenous problems of our econometric models. Considering that the causal relationship between environmental regulation and GVC position in service sectors may be bidirectional (Zhao et al., 2018; Wang et al., 2020), we use the first-order and second-order lag of
Columns (1) and (2) in Table 7 show the results of the 2SLS estimations.
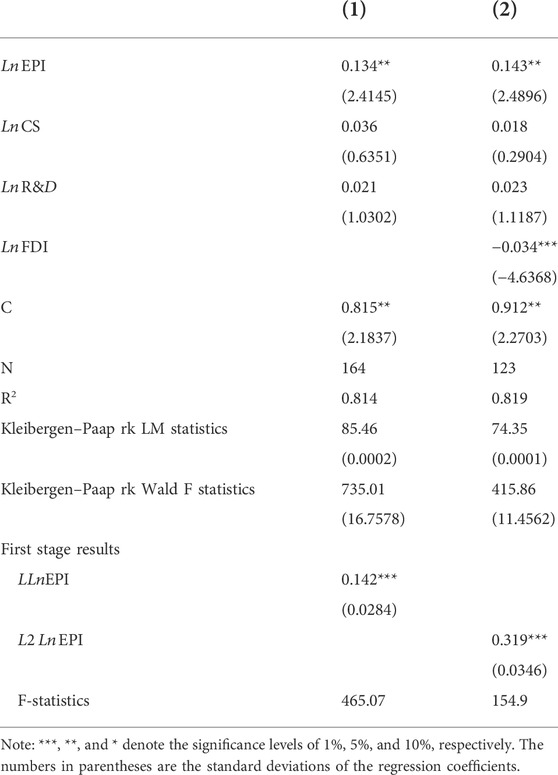
TABLE 7. Results of the 2SLS estimations for 41 major economies.
Additionally, by comparison with the OLS regression results in Table 5, we find that the estimated coefficients of
In general, this study studies how the environmental regulation affects the GVC position in service sectors on the basis of theoretical derivation and empirical research in a comprehensive way. It will contribute to a better understanding of the relationship between environmental regulation and GVC. The key findings of this research are as follows: 1) from the sample as a whole, the EPI of 41 countries has not changed much during 2006–2014. The EPI in middle-income countries is generally lower than that in high-income countries. The GVC position in service sectors is also relatively stable with a small fluctuation range. 2) Environmental regulation has a significant positive effect on the GVC position in service sectors, which verifies the validity of the Porter hypothesis. That is, the GVC position in service sectors can be promoted by the implementation of stringent environmental regulation. 3) The important impact channel which environmental regulation affects the GVC position in service sectors is the increasing environmental health, rather than ecosystem vitality. Environmental health can more effectively enhance the GVC position in the service sectors. 4) There is heterogeneity in the role of environmental regulation in promoting GVC position in service sectors. The higher the per capita income, the stringent their environmental regulation, and the stronger their impact on GVC position in service sectors are.
Based on aforementioned conclusions, the following policy recommendations on how the government handles with the relationship between environmental regulation and the GVC position in service sectors are proposed in the end of study.
First, the government should promote the unification of environmental regulation and GVC promotion objectives. Many national environmental regulations are formulated for a single goal, focusing on how to achieve environmental governance and environmental construction, and have not been considered as a whole with other policy goals. For example, some environmental regulations blindly emphasize the emission reduction and lack of coordination with development goals. Meanwhile, there is often a lack of overall design of environmental policies in the process of formulating the regional economic development strategy. Therefore, environmental regulation should be integrated into the national strategic planning.
Second, middle-income countries still need to adjust environmental regulation policies to narrow the gap with high-income countries and enhance the relative GVC position in the service sectors under the low-carbon economy. Meanwhile, the government should improve the service level of the manufacturing industry. In the process of upgrading the value chain, the manufacturing industry will have a great demand for productive services in R&D, design, marketing, management, and logistics.
Third, countries, especially developing countries, need to actively participate in the division of labor in the global value chain of the service industry, improve the level of technological development, and achieve green and sustainable development. The government needs to optimize the business environment and attract high-quality foreign investment. The governments should further open up the service market and encourage foreign enterprises to invest in service sectors and increase the proportion of foreign direct investment on green technological innovation.
The last enlightenment is that in order to realize the common development of environmental and economic development, the government should deepen communication and coordination with service enterprises, timely convey accurate trade policy information to the market, and encourage them to participate in the GVC and enhance their competitiveness. Meanwhile, environmental regulation policy can solve the problem of market failure, and the negative externalities related to environmental pollution can be restrained by adopting measures such as regulation and taxation.
The raw data supporting the conclusion of this article will be made available by the authors, without undue reservation.
Supervision, formal analysis, and writing—review and editing: HL; methodology and writing—original draft preparation: LC; conceptualization: YS.
The authors declare that the research was conducted in the absence of any commercial or financial relationships that could be construed as a potential conflict of interest.
All claims expressed in this article are solely those of the authors and do not necessarily represent those of their affiliated organizations, or those of the publisher, the editors, and the reviewers. Any product that may be evaluated in this article, or claim that may be made by its manufacturer, is not guaranteed or endorsed by the publisher.
The Supplementary Material for this article can be found online at: https://www.frontiersin.org/articles/10.3389/fenvs.2022.1051015/full#supplementary-material
Albrizio, S., Kozluk, T., and Zipperer, V. (2017). Environmental policies and productivity growth: Evidence across industries and firms. J. Environ. Econ. Manage. 81, 209–226. doi:10.1016/j.jeem.2016.06.002
Antras, P., Chor, D., Fally, T., and Hillberry, R. (2012). Measuring the upstreamness of production and trade flows. Am. Econ. Rev. 102, 412–416. doi:10.1257/aer.102.3.412
Apte, U., and Richard, M. (1995). Global disaggregation of information intensive services. Manag. Sci. 41 (7), 1250–1262. doi:10.1287/mnsc.41.7.1250
Arouri, M. E. H., Caporale, G. M., Rault, C., Sova, R., and Sova, A. (2012). Environmental regulation and competitiveness: Evidence from Romania. Ecol. Econ. 81, 130–139. doi:10.1016/j.ecolecon.2012.07.001
Batabyal, A. (1998). Environmental policy in developing countries: A dynamic analysis. Rev. Dev. Econ. 2 (3), 293–304. doi:10.1111/1467-9361.00043
Bohringer, C., Moslener, U., Oberndorfer, U., and Ziegler, A. (2012). Clean and productive? Empirical evidence from the German manufacturing industry. Res. Policy 41 (2), 442–451. doi:10.1016/j.respol.2011.10.004
Bound, J., Jaeger, D. A., and Baker, R. M. (1995). Problems with instrumental variables estimation when the correlation between the instruments and the endogenous explanatory variable is weak. J. Am. Stat. Assoc. 90 (430), 443–450. doi:10.1080/01621459.1995.10476536
Brunnermeier, S., and Levinson, A. (2004). Examining the evidence on environmental regulations and industry location. J. Environ. Dev. 13 (1), 6–41. doi:10.1177/1070496503256500
Chakraborty, D., and Mukherjee, S. (2013). How do trade and investment flows affect environmental sustainability? Evidence from panel data. Environ. Dev. 6, 34–47. doi:10.1016/j.envdev.2013.02.005
Chen, X., He, J. X., and Qiao, L. (2022). Does environmental regulation affect the export competitiveness of Chinese firms? J. Environ. Manag. 317, 115199. doi:10.1016/j.jenvman.2022.115199
Chichilnisky, G. (1994). North-south trade and the global environment. Am. Econ. Rev. 84 (4), 851–874.
Copeland, B. R., and Taylor, M. S. (1994). North-south trade and the environment. Q. J. Econ. 109 (3), 755–787. doi:10.2307/2118421
Del Prete, P. D., Giovannetti, G., and Marvasi, E. (2018). Global value chains: New evidence for north africa. Int. Econ. 153, 42–54. doi:10.1016/j.inteco.2017.03.002
Domazlicky, B. R., and Weber, W. L. (2004). Does environmental protection lead to slower productivity growth in the chemical industry? Environ. Resour. Econ. 28 (3), 301–324. doi:10.1023/b:eare.0000031056.93333.3a
Duan, Y., Ji, T., and Yu, T. (2021). Reassessing pollution haven effect in global value chains. J. Clean. Prod. 2, 124705–125145. doi:10.1016/j.jclepro.2020.124705
Gereffi, G., and Fernandez-Stark, K. (2011). The offshore services global value chain. Stark 15 (2), 247–278. doi:10.1504/IJTLID.2011.041905
Hamamoto, M. (2006). Environmental regulation and the productivity of Japanese manufacturing industries. Resour. Energy Econ. 28 (4), 299–312. doi:10.1016/j.reseneeco.2005.11.001
Hancevic, P. I. (2016). Environmental regulation and productivity: The case of electricity generation under the CAAA-1990. Energy Econ. 60, 131–143. doi:10.1016/j.eneco.2016.09.022
Hu, D. X., Jiao, J. L., Tang, Y. S., Han, X. F., and Sun, H. P. (2021). The effect of global value chain position on green technology innovation efficiency: From the perspective of environmental regulation. Ecol. Indic. 121, 107195. doi:10.1016/j.ecolind.2020.107195
Hummels, D., Ishii, J., and Yi, K. M. (2001). The nature and growth of vertical specialization in world trade. J. Int. Econ. 54 (1), 75–96. doi:10.1016/s0022-1996(00)00093-3
Jaffe, A. B., Peterson, S. R., Portney, P. R., and Stavins, R. N. (1995). Environmental regulation and the competitiveness of U.S. manufacturing. What does the evidence tell us? J. Econ. Literature 25 (1), 132–163.
Kahouli, B., Omri, A., and Chaibi, A. (2014). Environmental regulations and foreign direct investment: Evidence from gravity equations. Prais: IPAG Business School.
Kalamova, M., and Johnstone, N. (2012). Environmental policy stringency and foreign direct investment. Chapters 5, 253–268.doi:10.4337/9781849805773.00011
Klette, T. J., and Griliches, Z. (1996). The inconsistency of common scale estimators when output prices are unobserved and endogenous. J. Appl. Econ. Chichester. Engl. 11 (4), 343–361. doi:10.1002/(sici)1099-1255(199607)11:4<343:aid-jae404>3.0.co;2-4
Koopman, R., Powers, W., Wang, Z., and Wei, S. J. (2010). Give credit where credit is due: Tracing value added in global production chains. AvaliableAt: https://www.nber.org/system/files/working_papers/w16426/w16426.pdf (Accessed July 15, 2022).
Levinson, A., and Taylor, M. S. (2008). Unmasking the pollution haven effect. Int. Econ. Rev. Phila. 49 (1), 223–254. doi:10.1111/j.1468-2354.2008.00478.x
Lopez, A., Niembro, A., and Daniela, R. (2011). Global value chains in the services sector. Bus. strategies Lat. Am. insertion 7, 110–124. doi:10.1787/06420077-en
Lu, M. (2009). Does environmental regulation affect the trade comparative advantage of pollution intensive commodities? Econ. Res. 44 (04), 28–40. doi:10.1007/s11459-010-0014-3
Michael, E. P., and Claas, V. D. L. (1995). Toward a new conception of the environment-competitiveness relationship. J. Econ. Perspect. 9 (4), 97–118. doi:10.1257/jep.9.4.97
Mouanda, G. (2019). Global value chains participation for African countries: An overview from UIBE GVC index system. Open J. Bus. Manag. 7, 941–962. doi:10.4236/ojbm.2019.72064
Murty, M. N., and Kumar, S. (2003). Win-win opportunities and environmental regulation: Testing of porter hypothesis for Indian manufacturing industries. J. Environ. Manage. 67 (2), 139–144. doi:10.1016/s0301-4797(02)00203-7
Nathaniel, S., Aguegboh, E., Iheonu, C., Sharma, G., and Shah, M. (2020). Energy consumption, FDI, and urbanization linkage in coastal mediterranean countries: Reassessing the pollution haven hypothesis. Environ. Sci. Pollut. Res. 27 (28), 35474–35487. doi:10.1007/s11356-020-09521-6
Qi, P., Shang, Y., and Han, F. (2022). The effects of environmental regulation on investment efficiency-An empirical analysis of manufacturing firms in the Beijing-Tianjin-Hebei region, China. Sustainability 14, 6371. doi:10.3390/su14106371
Qu, C. Y., Shao, J., and Cheng, Z. H. (2020). Can embedding in global value chain drive green growth in China’s manufacturing industry? J. Clean. Prod. 268 (12), 121962–62. doi:10.1016/j.jclepro.2020.121962
Raspiller, S., and Riedinger, N. (2005). Les differences de sévérité environnementale entre pays ifluencentelles les compartments de localizations des groups français? ecop. 169, 197–210. doi:10.3406/ecop.2005.7019
Schott, P. (2004). Across-product versus within-product specialization in international trade. Q. J. Econ. 119 (2), 647–678. doi:10.1162/0033553041382201
Stoever, J., and Weche, J. P. (2018). Environmental regulation and sustainable competitiveness: Evaluating the role of firm-level green investments in the context of the porter hypothesis. Environ. Resour. Econ. (Dordr). 70, 429–455. doi:10.1007/s10640-017-0128-5
Timmer, M. P., Dietzenbacher, E., Los, B., Stehre, R., and de Vries, G. J. (2015). An illustrated user guide to the world input-output database: The case of global automotive production. Rev. Int. Econ. 23, 575–605. doi:10.1111/roie.12178
Tomasz, K., and Christina, T. (2016). Do environmental policies affect global value chains? A new perspective on the pollution haven hypothesis. Prais: OECD. doi:10.1787/5jm2hh7nf3wd-en
Van, B. C., and Cees, (1997). An empirical multi country analysis of the impact of environmental regulations on foreign trade flows. Kyklos 50 (1), 29–46. doi:10.1111/1467-6435.00002
Wang, C., and Zhang, Y. J. (2022). The effect of environmental regulation and skill premium on the inflow of FDI: Evidence from Chinese industrial sectors. Int. Rev. Econ. Finance 81, 227–242. doi:10.1016/j.iref.2022.05.011
Wang, J. C., Jin, Z. D., Yang, M., and Sameen, N. (2021). Does strict environmental regulation enhance the global value chains position of China's industrial sector? Petroleum Sci. 18, 1899–1909. doi:10.1016/j.petsci.2021.09.023
Wang, S., He, Y., and Song, M. (2021). Global value chains, technological progress, and environmental pollution: Inequality towards developing countries. J. Environ. Manag. 277, 110999. doi:10.1016/j.jenvman.2020.110999
Wang, S., Wang, X., and Chen, S. (2022). Global value chains and carbon emission reduction in developing countries: Does industrial upgrading matter? Environ. Impact Assess. Rev. 97, 106895. doi:10.1016/j.eiar.2022.106895
Wang, S., Wang, X., and Tang, Y. (2020). Drivers of carbon emission transfer in China-an analysis of international trade from 2004 to 2011. Sci. Total Environ. 709, 135924. doi:10.1016/j.scitotenv.2019.135924
Wang, Z., Wei, S., Yu, X., and Zhu, K. (2017). Measures of participation in global value chain and global business cycles. AvaliableAt: https://www.nber.org/system/files/working_papers/w23222/w23222.pdf (Accessed July 15, 2022).
Xie, B ., Jia, X., and Yi, Z. H. (2018). The impact of environment regulation on the global value chain in service sectors. Mod. Econ. Res. 5, 70–77.
Yale Center for Environmental Law & Policy, (2022). Yale center for environmental Law & policy. AvaliableAt: https://www.epi.yale.edu (Accessed July 15, 2022).
Yang, Y., and He, X. (2010). Bayesian empirical likelihood for quantile regression. Ann. Stat. 40 (2), 1102–1131. doi:10.1214/12-aos1005
Zhao, X. M., Liu, C. J., and Yang, M. (2018). The effects of environmental regulation on China's total factor productivity: An empirical study of carbon-intensive industries. J. Clean. Prod. 179 (4), 325–334. doi:10.1016/j.jclepro.2018.01.100
Zhao, Z. X., Wang, R., and Yan, F. Y. (2013). Trade implied carbon and pollution paradise hypothesis: Reinterpretation of the causes of environmental kuznets curve. Int. Trade Issues 7, 95–103.
Keywords: global value chain, environmental regulation, service sectors, environmental performance index, environmental policies
Citation: Liu H, Chen L and Shan Y (2022) Does environmental regulation affect global value chain position in service sectors? Evidence from 41 major economies. Front. Environ. Sci. 10:1051015. doi: 10.3389/fenvs.2022.1051015
Received: 22 September 2022; Accepted: 03 October 2022;
Published: 20 October 2022.
Edited by:
Shuhong Wang, Shandong University of Finance and Economics, ChinaReviewed by:
Yuanxiang Zhou, Anhui University of Finance and Economics, ChinaCopyright © 2022 Liu, Chen and Shan. This is an open-access article distributed under the terms of the Creative Commons Attribution License (CC BY). The use, distribution or reproduction in other forums is permitted, provided the original author(s) and the copyright owner(s) are credited and that the original publication in this journal is cited, in accordance with accepted academic practice. No use, distribution or reproduction is permitted which does not comply with these terms.
*Correspondence: Huiqun Liu, aHVpcXVubGl1QHRqY3UuZWR1LmNu
Disclaimer: All claims expressed in this article are solely those of the authors and do not necessarily represent those of their affiliated organizations, or those of the publisher, the editors and the reviewers. Any product that may be evaluated in this article or claim that may be made by its manufacturer is not guaranteed or endorsed by the publisher.
Research integrity at Frontiers
Learn more about the work of our research integrity team to safeguard the quality of each article we publish.