 Kai Li
 Hongliang Yu2
94% of researchers rate our articles as excellent or good
Learn more about the work of our research integrity team to safeguard the quality of each article we publish.
Find out more
ORIGINAL RESEARCH article
Front. Environ. Sci., 08 December 2022
Sec. Environmental Informatics and Remote Sensing
Volume 10 - 2022 | https://doi.org/10.3389/fenvs.2022.1049880
This article is part of the Research TopicAdvanced Methods for Interpreting Geological and Geophysical DataView all 36 articles
Accurate reconnaissance of Marine oil spill is very important for emergency management of Marine oil spill accidents. Unmanned aerial vehicles (UAV) is a suitable carrier for offshore oil spill reconnaissance because of its fast deployment speed and low cost. Aiming at the identification accuracy of small oil spill accident in offshore port area and the problem of day and night reconnaissance, this study takes thermal infrared remote sensing images of oil leakage captured by UAV as the research object and proposes an oil spill detection method based on a Gray Level Co-occurrence Matrix (GLCM) and Support Vector Machine (SVM) method. Firstly, the extraction steps of image GLCM feature and the basic principle of SVM classification are studied. Then, the thermal infrared image data collected by UAV is preprocessed, including image filtering, clipping and rotation, and the sample database is generated. Subsequently, GLCM features of the samples were extracted, and the energy and correlation in GLCM were selected as classification features and sent to the SVM classifier to complete the oil spill detection of real-time thermal infrared images. The experimental results show that, compared with Classification and Regression Tree algorithm (CART) and Random Forests of Decision Trees (RF) algorithm, the detection accuracy of the method proposed in this paper reaches 95%, which were 10 and 2 percentage points higher than them respectively. The proposed method in this paper has fast recognition speed and high accuracy, and can provide all-weather recognition of oil spills for the detection of small oil spills in the offshore port area.
With the rapid development of marine transportation and offshore oil and gas industries, the marine economic industry is given new vitality. However, it brings negative effects which led to the frequent occurrence of marine oil spills. The causes of oil spills at sea are complex, and numerous situations may cause oil spill pollution, such as industrial emissions from coastal factories, seabed oil and gas leakage, ships or tankers hitting reefs during port berthing, collisions causing cargo oil spills, oil spills from sunken ships, and mining oil spills in offshore oil fields and during transportation. As a hub for maritime transport trade, the port may cause serious ecological damage in the event of oil spills. In the past few years, more than 3,000 traffic accidents on maritime transport ships occurred, causing more than 40,000 tons of spilled oil (Bella et al., 2021). A large number of these accidents occurred offshore or even in ports, resulting in a large number of accidents. Oil leakage into the sea caused serious pollution to the marine environment and huge economic losses. Given the suddenness and unpredictability of oil spill accidents and the rapid spread of oil after an accident, the identification and containment of oil spills remain difficult. Hence, methods to identify oil spills, detect oil spill areas, and extract relevant oil spill information quickly to make subsequent cleanup work more accurate and efficient and prevent the secondary spread of oil spills are a major issue that must be solved, with far-reaching research significance.
In order to deal with the oil spill incident scientifically, it is necessary to determine the oil spill information accurately so as to clean up the pollution in time, and several researchers are concerned with how to eliminate or reduce the impact of oil spills [ (Tamis et al., 2012; Helm et al., 2015; Thompson et al., 2015; Bejarano and Michel, 2016; Feng et al., 2017; Raimondi et al., 2017; Bhushan, 2019; Tayeb et al., 2020; Wegeberg et al., 2021)]. However, little research is conducted on the rapid detection of oil spills and the improvement of the real-time performance of oil spill detection. At present, remote sensing monitoring becomes the main technical means for marine oil spill monitoring. Compared with traditional direct monitoring methods, remote sensing monitoring avoids the direct entry of monitors into the oil spill area, thereby reducing the risk of oil spill monitoring. Moreover, it can achieve large-area, real-time monitoring of oil spills, greatly improving the monitoring efficiency. Remote sensing monitoring of oil spills usually uses satellites, airplanes, unmanned aerial vehicles (UAVs), and other aviation equipment to carry optical, infrared, ultraviolet, microwave, and other sensors to collect image and spectrum data. Raimondi et al. (Xu et al., 2021) measured the oil spills in the laboratory by using the laser radar attached to the UAV, and proposed a method for oil identification, but did not indicate the accuracy and speed of detection. However, this method is tested only in the laboratory and did not indicate the accuracy and speed of detection. Taking shipborne radar monitoring data as the object, Xu et al. (Frate et al., 1999) proposed an oil spill detection method based on LBP texture feature and K-means algorithm, which can automatically detect the shipboard radar image of indoor oil spill, providing a guarantee for real-time monitoring of oil spill accidents. However, this means of inspection costs high, and the manned ship needs regular inspection. Indregard et al. (Fiscella et al., 2000) used the constant false alarm rate algorithm to identify spots in an oil spill SAR image, clustered the identified results, and used the Hough transform algorithm to extract linear oil spill edges. Although this method can detect oil spills, edge extraction requires a significant amount of time. Fiscella et al. (Brekke and Solberg, 2008) established a semi-automatic recognition algorithm to extract black spots in the image to determine whether an oil spill exists. Brekke and Solberg (Singha et al., 2013) developed an improved two-step classification procedure for oil spill detection in SAR images, including a regularized statistical classifier and automatic confidence estimation of the detected slick. Singha et al. (Xu et al., 2014) successively implemented the classification of objects as oil spills or similar objects by adopting two different artificial neural networks (ANN). Xu et al. (Andrea et al., 2015) used RADARSAT-1 images to compare classification techniques, such as support vector machines, artificial neural networks, tree-based ensemble classifiers, generalized additive models, and penalized linear discriminant analysis. Pisano et al. (DavidBolon-Canedo and Cotos, 2017) designed an oil spill satellite image recognition method based on the reflective pixel characteristics of the oil and non-oil spill areas. They realized the preliminary recognition of the oil spill satellite image but did not consider the accuracy of the recognition. Wan et al. took the SAR data gathered in the Gulf of Mexico as the object, and completed the detection of the offshore oil slick by preprocessing the image, detecting and analyzing the black spots and combining with the algorithm of support vector machine. However, the accuracy of detection was not considered. Based on SAR remote sensing images, Mera et al. (Tong et al., 2019) proposed a general and systematic method to select a group of concise and related features to improve the accuracy of oil spill detection based on the feature selection method. Their experimental results show that the 6-input finite element vector trained classifier proposed by SVM-RFE achieves the best accuracy. However, the above remote sensing detection method is mainly suitable for the detection of large sea oil spills and the real-time detection is not strong. Tong et al. (Aghaei et al.) proposed an ocean oil spill detection method based on multi-feature polarized SAR data using the random forest method to classify image data. This method combines self-similar parameters and seven other polarization characteristics to distinguish between slick and similar objects. Aghaei et al. (Taravat et al., 2014) put forward a new SAR image segmentation method based on the level set method with application to oil spill detection from the synthetic aperture radar imagery. Compared with other segmentation methods, the method are obtained with high accuracy, less repetition, and less computational volume. As a popular research direction in recent years, deep learning is widely used in numerous fields, and several cases on oil spill detection are produced [ (Nassim et al., 2017; Abpeykar and Ghatee, 2019; Jiao et al., 2019; Wang et al., 2021a; Nieto-Hidalgo et al., 2018; Shaban et al., 2021a; Li et al., 2018; Wu et al., 2018; Xh et al.)]. Huang et al. (Wang et al., 2022) presented a novel deep learning method for marine oil spill detection from SAR imagery based on a Faster Region-based Convolutional Neural Network (Faster R-CNN) model, which enables fast and accurate oil spill detection. An improved deep learning-based oil spill detection model for oil spill detection was proposed from SAR images in the study of Wang et al. (IzemHamoucheneSalihaAouat, 2014). The model has strong general adaptability and robustness, and has high accuracy in identifying oil products. However, the accuracy and rapidity of the oil spill detection method based on deep learning proposed by researchers largely depends on the quantity and quality of the data sets. If the number of samples is not sufficient, the training model does not reach the required complexity, which may easily lead to errors in the results. This study proposed a new method to detect oil spills automatically and evaluate their accuracy by using UAV as an oil spill detection tool, which can robustly manage different lighting intensities and camera angles. If the accuracy of the automatic detection of oil spill images can be improved, the use of UAVs to patrol specific routes and the automatic detection of marine oil spills may be more effective than the manual detection of vessel cruises. The contributions of this study are summarized as follows:
(1) We approached the following research progress of current offshore oil spills monitoring methods, and proposed an automatic detection method of oil spills day and night by using UAV, which deals with the early monitoring of marine oil spill emergency management.
(2) We discussed the use of digital image processing through GLCM to extract features from the thermal infrared remote sensing images. After GLCM features based on statistical parameters were extracted from remote sensing images, the SVM classification method was selected to establish an oil film detection model to automatically detect oil leakage.
(3) The proposed automatic oil spill detection method was more convenient than the traditional manual cruise monitoring method, and the proposed oil spill detection algorithm had higher accuracy than Classification and Regression tree algorithm (CART) and Random Forests of Decision Trees (RF) algorithm.
The rest of this paper is structured as follows: Section 2 introduces the detailed method, including the description of the algorithm, technical route, image pre-processing, feature extraction, gray-scale compression, and SVM classification. Section 3 discusses the development and results of the experiment. Section 4 presents the results, and the conclusions are discussed in Section 5.
Sensors used for remote sensing monitoring of marine oil spills primarily include optical, laser, and scattered wave sensors. Optical sensors include visible light, infrared, near-infrared, and ultraviolet sensors; microwave sensors include radiometers and radars. At present, the cost of oil spill monitoring equipment is an important factor for users to consider. Owing to the low price of infrared cameras and the ability to distinguish oil films on the sea during the day and night, this study chose a UAV equipped with thermal infrared sensors to collect data during flight. Infrared sensors are activated by thermal radiation. The oil in the sea water absorbs solar radiation and emits part of it along with the solar radiation. As the thermal energy is primarily concentrated in the infrared hot zone (8–14 μm), the emissivity of oil in the thermal infrared zone is lower than that of water. Thus, the oil film on the surface of sea water can be identified. The experimental process lasted for 5 days, from December 20 to 25 December 2021. We conducted an oil spill simulation test in an experimental tank by the beach. During the experiment, the weather conditions were good, and there was no rain or sea fog, and the oil spill experiment was carried out alternately during the day and night. As shown in Figure 1, the location of the experiment is located on the beach in the sea area of Zhanjiang Bay, Zhanjiang City, China. About 15 m to the east of the tank is Zhanjiang Bay, which is convenient to extract the seawater required for each experiment. After each experiment was completed, the waste oil was recovered and treated with linoleum felt, as shown in Figure 2.
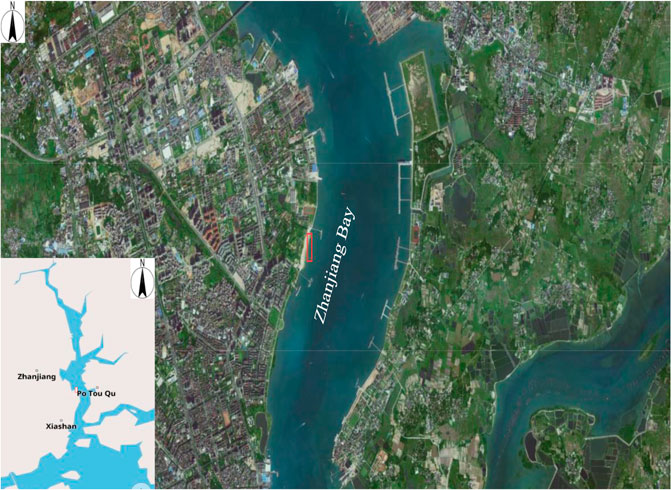
FIGURE 1. Location of the experimental site.
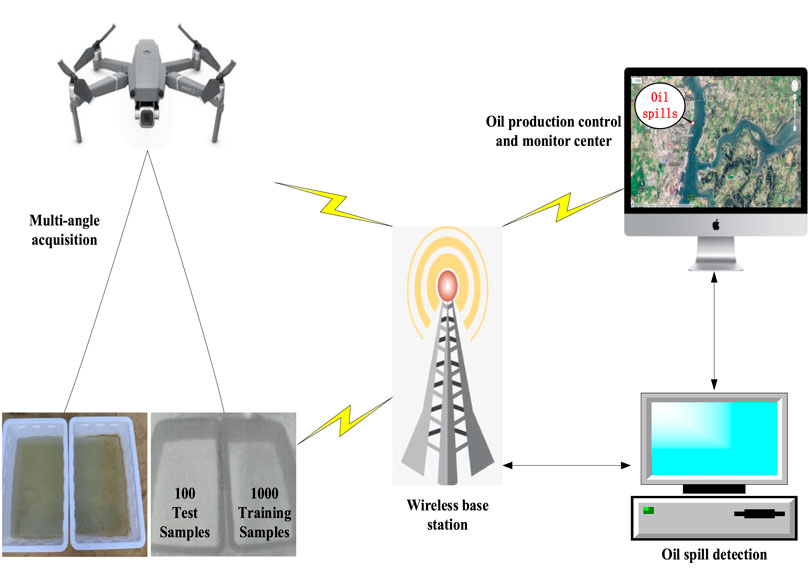
FIGURE 2. Collection process of oil spill data.
The experimental equipment was photographed by DJI industry-grade UAV. The maximum flight speeds of the UAV under automatic flight and manual operation are 6 ml and 5 m/s, respectively. It is equipped with advanced dual light cameras, including 48-million-pixel visible light and thermal infrared cameras with 640 × 512 resolution, which can complete point and temperature measurements in the temperature area, supporting 16 × zoom and one key switching of visible light, infrared, and split screen. During image shooting, we select the infrared sensor, set the flight altitude of the UAV as 6 m, the ground sample distance as 0.53 cm/pixel, and the Pan/Tilt/Zoom shooting angle as vertical to the ground; the heading overlap rate is 80%, and the lateral overlap rate is 70%. In this study, UAV carrying an infrared camera is used for observation. The principle of infrared imaging is to transform invisible infrared radiation into visible thermal image based on the principle of thermal radiation. Different objects, or even different parts of the same object, have different radiative capacities and their ability to reflect infrared rays. Using the radiation difference between the object and the background environment as well as the radiation difference between each part of the scene itself, the characteristics of the scene are displayed. Because the black tank absorbs heat, it radiates a brighter image, which interferes with the experimental study. In order to reduce the interference of oil film observation, white water tank was used for observation during each experiment. After sprinkling diesel oil and waste lubricating oil in the experimental tank, the UAV was used to perform multi-angle and different altitude cruise shooting to obtain image data, which were collected repeatedly during the day and night.
This section proposes a technical route for UAV-based oil spill detection. As shown in Figure 3, the main steps of the method have two stages: data preparation and data detection. Data preparation includes data collection and preprocessing, while data detection includes the process of building detection models and evaluating results. When making the dataset, image preprocessing is performed on the collected data to eliminate bad data in the sample and obtain more sample data. SVM classification methods are particularly attractive in the field of remote sensing because they have good generalization. Even if the training samples are limited, they can achieve good recognition. In this study, we used the SVM classification algorithm to detect oil spills. After obtaining the preprocessed remote sensing image, the texture feature GLCM of the image was extracted and used to construct the SVM classification model. After preprocessing the image to be detected from the cruise, the sent SVM classifier was compared with the template library. After the oil film image was recognized, the recognition result was saved, and the accuracy was analyzed. The parameters of the SVM classifier were set to obtain the highest possible accuracy.
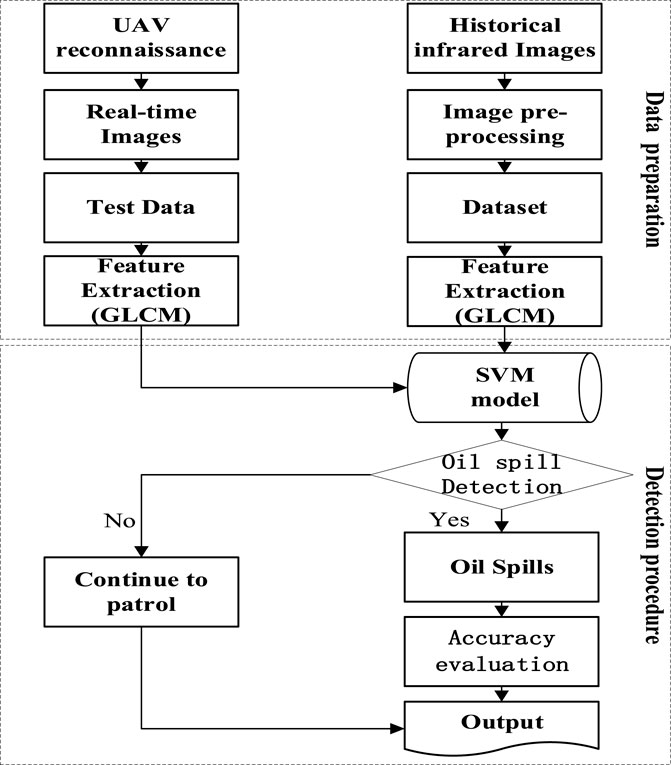
FIGURE 3. The technical route of the study.
To improve the accuracy of oil spill detection, the aerial image data collected by the UAV cruise were preprocessed, including image translation, flip, rotation, correction, and filtering, to produce more usable sample data. Image preprocessing is an important step in the identification of marine targets, and it is also a common technique to improve the robustness of SVM classification. Given the phenomenon of noise points and inconspicuous edge boundaries in remote sensing, images can interfere with the subsequent oil spill identification process. Therefore, the image must be preprocessed, and image enhancement algorithms must be used to strengthen the edges of the target and background. Particle noise may be generated owing to the global impact of image enhancement in certain cases. To reduce the distribution of particle noise, filtering and denoising processing were adopted for remote sensing images, allowing the image to filter out noise while retaining the sharpness.
The nature of image texture is defined as changing the intensity of gray in the image, and this change is calculated based on the distance between two pixels. The main theme of texture analysis is the performance of the background to present the features of the texture in the simplest format: accurate and powerful object segmentation and classification. GLCM is a well-known texture feature analysis technique (Lerski et al., 1993; Hamouchene et al., 2014). In image recognition, texture features play an important role owing to their simple structure and rapid calculation. In the method proposed in this study, GLCM is applied to extract various statistical features from thermal infrared remote sensing images. The statistical methods of texture features are mainly divided into three categories: first-, second-, and high-order statistics. The second-order statistics are currently the most popular statistical method. With this method, GLCM has been used in various studies in recent years. The idea of GLCM is to calculate the phantom θ of two pixels (Pi, Pj) separated by a distance d and characterized by a direction (Strzelecki, 1996; Dong et al., 2019; Souza et al., 2020). The matrix
where L represents the gray level of the image, i and j represent the gray level of the pixel, 0 ≤ i, and j ≤ L-1.
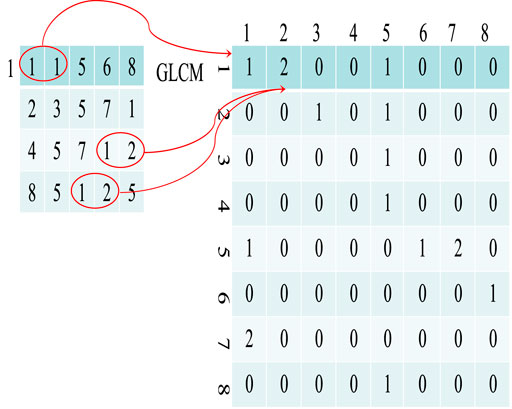
FIGURE 4. Calculation of the GLCM from a grayscale image (distance = 1, orientations = 0°).
According to this formula, parameters d and θ of the co-occurrence matrix are very important, and they greatly affect the quality of the results. For the extraction of texture feature images, we must process the calculation results of the GLCM properly. The simplest method takes the offset parameters of different squares (0°, 45°, 90°, and 135°), obtains the characteristic parameters of the GLCM, respectively, and then calculates the mean and variance of these characteristic indexes. Thus, the direction component is suppressed, and the obtained texture feature is independent of the direction (Hu et al., 2020a; Hu et al., 2020b; Shaban et al., 2021b).
The GLCM can be used to analyze the local features and arrangement rules of the image. To describe the texture condition with the GLCM more intuitively, the obtained co-occurrence matrix is generally not used directly (Haralick et al., 1973; Alruzouq et al., 2020). However, the secondary statistics are obtained based on GLCM. Haralick et al. (Conceio et al., 2021) defined 14 characteristic parameters of GLCM for texture analysis: second-order moment, contrast, correlation, difference moment, inverse difference moment, sum average, sum variance, sum entropy, difference variance, difference entropy, correlation measure 1, correlation measure 2, and maximum correlation coefficient. Researchers found that among the 14 texture features based on GLCM, four feature parameters are relevant. These features are easy to calculate and can provide high classification accuracy.
The first step for calculating image texture features is to convert remote sensing images into grayscale images. In practical applications, the grayscale level of an image is 256 levels. When calculating the texture features derived from the grayscale co-occurrence matrix, the gray level of the image must be less than 256 because the calculation amount of GLCM is determined by the gray level and size of the image. For example, assuming that image I has L gray levels and the image size is M rows and N columns, the calculation amount is approximately M × N × L. Based on the general situation of M = 512, N = 512, and L = 256, the basic calculation must be at least 1.718 × 100 times. Taking the calculation speed of the current microcomputer 200 million times per second as an example, calculating the GLCM of the above-mentioned image takes at least 85 s. Such a long time for image recognition is not practical. The solution is to reduce the resolution of the image while keeping the original shape of the image and the number of grayscale values as much as possible. Therefore, when calculating the GLCM, the gray level is often compressed to a smaller range without affecting the texture characteristics (Liu et al., 2019; Wang et al., 2021b; Li et al., 2021). This study uses 16 levels to reduce the size of the co-occurrence matrix. Given that the grayscale is usually distributed in a narrow range, if the grayscale is directly divided by 16 and rounded, the sharpness of the image decreases. Therefore, when performing grayscale compression on an image, the image must first be histogram equalized to increase the dynamic range of the grayscale value, which subsequently increases the overall contrast effect of the image. Figure 5 shows the effect comparison of a remote sensing image before and after histogram equalization.
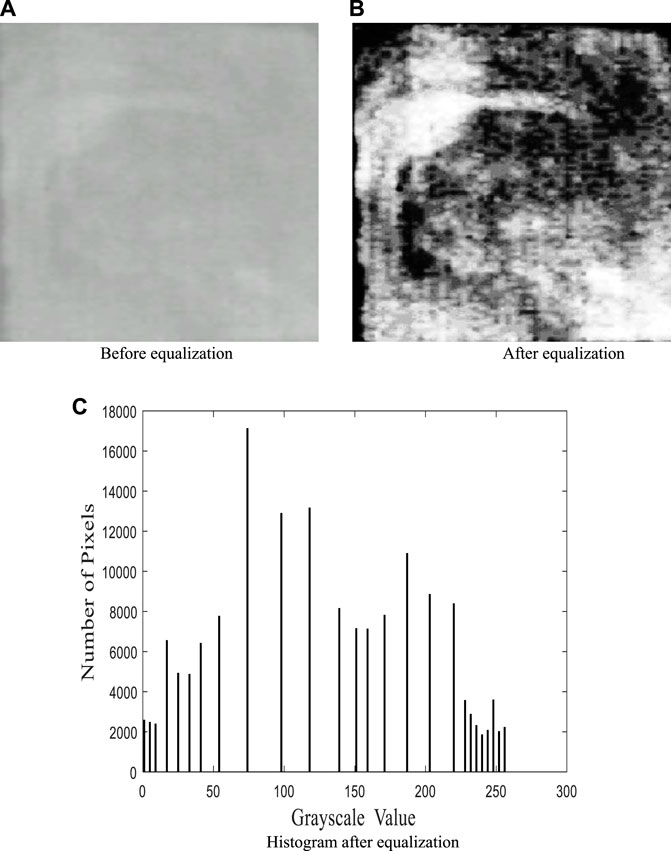
FIGURE 5. Image histogram equalization. (A) Before equalization (B) After equalization (C) Histogram after equalization.
SVM is a machine learning method proposed in the late 20th century. This method transforms classification and regression into quadratic optimization, and its decision boundary is the maximum boundary distance hyperplane that solves the training set data under the condition of linear separability. It has good classification effect for small samples and multi-class classification. The linear sample classification problem of SVM can be transformed into a problem of finding the optimal solution:
In the above formula, yi is the label of the sample, w represents the weight vector, and b represents the class threshold. The optimal solution can be found by using Lagrange’s theorem. Although no further description is given in this study, the problem can be solved by the formula
Not every training point must be used. Only the support vector is required, and the coefficient of non-support vector α is 0. <xi, x > represents the inner product operation.
The previous method is feasible for linearly separable samples. However, it cannot be applied to linearly inseparable samples. If a low-dimensional linearly inseparable sample set can be mapped to a high-dimensional set and made linearly separable, then the SVM can be used to make it functional. If the mapping function is φ(‧), then the spatial classification function after mapping becomes:
However, if the low-dimensional data are directly mapped to the high-dimensional data, the number of dimensions increases exponentially. For this reason, the kernel function is introduced. The kernel function is used to find a function that makes the result of the operation < xi, x> in the low-dimensional space the same as the result of the inner product mapped to the high-dimensional space. Thus, the classification function becomes:
Given the difficulty of determining a suitable mapping from an arbitrary dataset, it is typically selected from a commonly used kernel function.
In order to clarify the classification results of UAV oil spill detection and evaluate the accuracy of the classification model, the classification accuracy of oil spill remote sensing images is defined as:
where TP represents true positives, TN represents true negatives, FP represents false positives, and FN represents false negatives.
After obtaining the original dataset, if the detection model is directly composed of the original aerial image, the accuracy and stability of the model may be low because the original image consists of the light intensity captured by the camera under the same angle and similar environment. To stabilize the model and eliminate the influence of the camera angle and the lighting intensity, we adopted a method of enriching the data types of the training set (Li et al., 2020). In order to ensure the effectiveness of the image data set, the UAV takes intermittent shots of the study area during aerial photography. To produce more training sample data, image preprocessing is performed on the data set obtained by shooting, and at the same time, every two images are sampled, and the images with poor quality in the samples are eliminated. Finally, a total of 200 infrared images are obtained. In order to improve the detection accuracy, each image in the training set is randomly cropped to a fixed size region, and the training data set is expanded to 2000 images by salt and pepper noise noise, mirror transformation, brightness change, and translation transformation, as shown in Figure 6. After image processing, 1,000 images with improved quality are selected as the training set from the expanded sample database and 100 images are randomly sampled as test set from the UAV reconnaissance database.
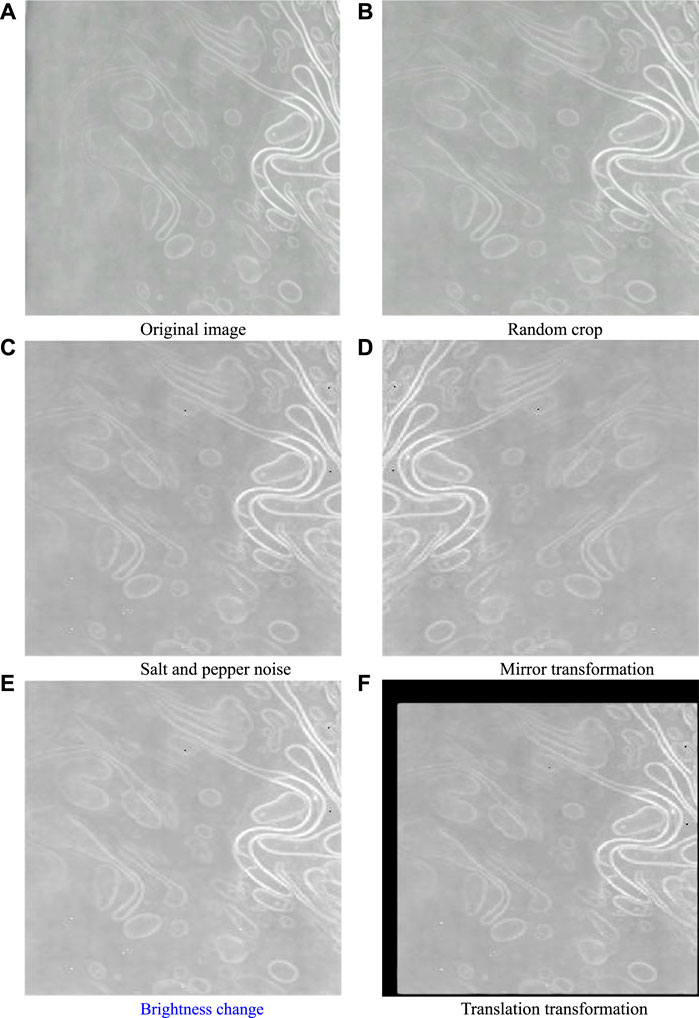
FIGURE 6. Image preprocessing. (A) Original image (B) Random crop (C) Salt and pepper noise (D) Mirror transformation (E) Brightness change (F) Translation transformation.
This study designed a detection system with the goal of detecting oil spills. To obtain a more ideal result, the given picture size is small. The purpose of this decision is to increase the running speed and have a more accurate grasp of the recognition results under ideal conditions. Given the large volume of thermal infrared data, the gray scale conversion of the target image was conducted, reducing the requirements for design complexity and operating efficiency. Although the gray scale conversion can effectively reduce the size of the picture, the 256 gray scale picture still requires significant time consumption. Thus, the gray scale must be reduced greatly while keeping the original image information unchanged. By performing histogram equalization processing on the image, the dynamic range of the gray value is increased, thereby increasing the overall contrast effect of the image (Spanhol et al., 2015). In general, the characteristic parameters must be calculated in each scanning direction as a trade-off to integrate the influencing factors better. This study calculated the characteristic parameters of each direction and averaged them. Then, it used this comprehensive index as a basis for testing. The GLCM has abundant characteristic parameters, which can describe the texture in detail from different angles. This study conducted the following three kinds of sea surface experiments, as shown in Figure 7.
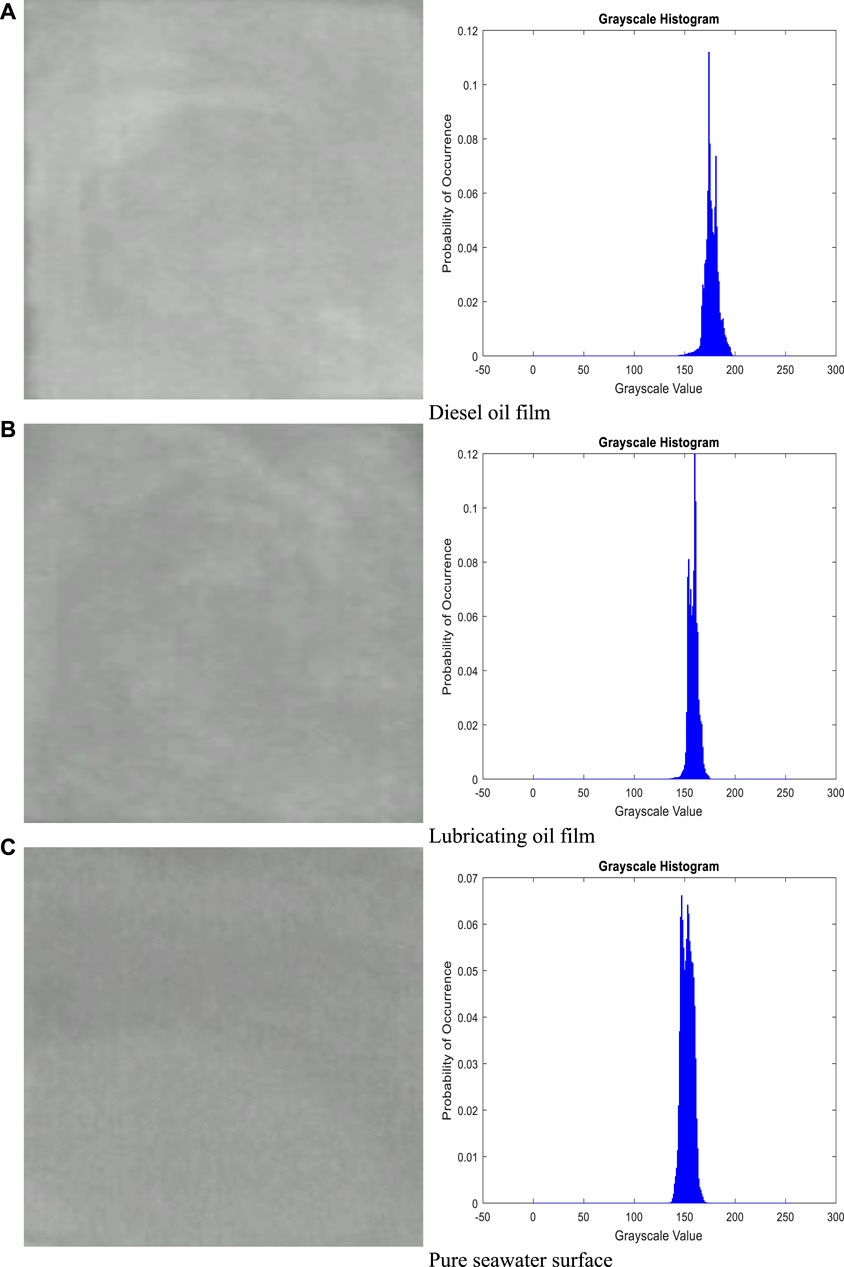
FIGURE 7. Remote sensing images of different types of oil film. (A) Diesel oil film (B) Lubricating oil film (C) Pure seawater surface.
The GLCM was calculated in four directions, and the distance between pixels was set as 1. Then, the five texture feature quantities required by the GLCM were calculated to obtain the five characteristic parameters of the three sea surfaces. The feature value results in Figure 8 demonstrate that different types of road texture feature parameters have evident differences. Given that these parameters represent the properties of a certain aspect of the image texture feature, the comparison of these parameters can reflect the difference of various image texture features. In the comparison of the differences of various parameters, classifying and recognizing the texture of the seawater surface is feasible, thus, realizing the automatic judgment of the oil spill phenomenon.
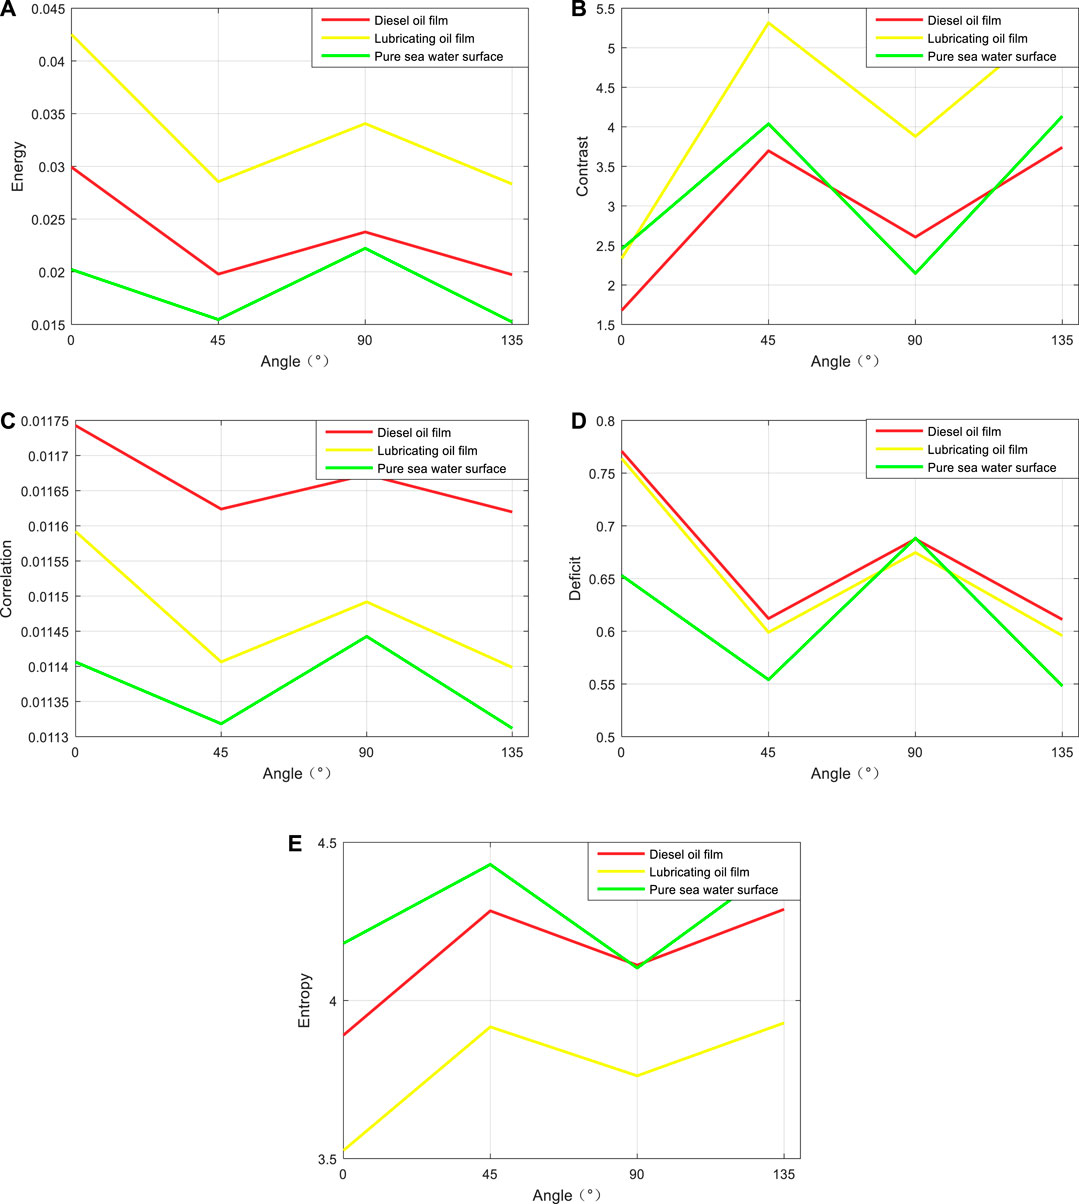
FIGURE 8. The GLCM eigenvalues of oil film observation images.
The distribution diagram of the energy characteristic value and the correlation characteristic value demonstrate that the distances of the three curves representing diesel and lubricating oil spills, and pure sea water have significant differences. Thus, we can distinguish between the second-order distance oil spills and no oil spills. In the graphs of contrast, entropy, and moment of inertia, the three curves overlap. In addition, the occurrence of oil spills is difficult to determine. To detect whether oil spills have occurred, the data of the samples are concentrated into two categories: oil spills and pure sea surfaces. Then, they are imported into the SVM model for classification. Then, the energy and correlation were used as the sample for training the classifier. After many experimental tests, the SVM classification model in this study has the best classification effect when the parameter C and parameter gama are set as 0.01 and 1, respectively. The recognition accuracy of the detection model for the samples to be classified in the experiment was 95%, which is defined as the ratio of the number of samples correctly classified by the classifier to the total number of samples in a given data set. As shown in Figure 9, the positive and negative samples are basically evenly distributed on both sides of the hyperplane, with strong generalization ability and no overfitting phenomenon occurred. The model is ideal for the classification and detection of oil film and non-oil film, and is finally determined as the classification model of this study. Taking an offshore oil spill accident as an example, then selecting their energy and correlation as eigenvalues and send them to the classification model of this study, the results obtained after testing the test samples are shown in Figure 10. The method proposed in this study can achieve fast and accurate identification of oil films and non-oil films. Since the SVM classification method is not suitable for directly processing large data sets, it cannot effectively identify the types of oil films.
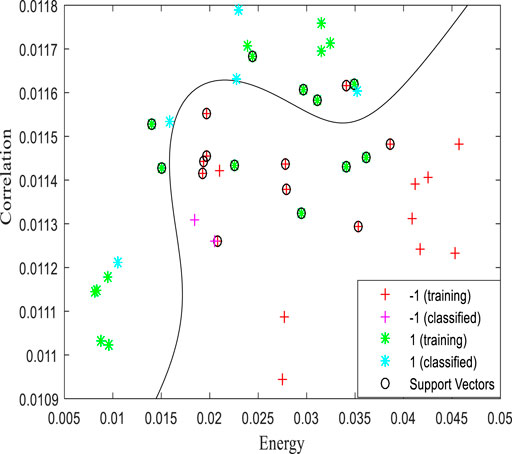
FIGURE 9. Classification effect of oil spills detection.
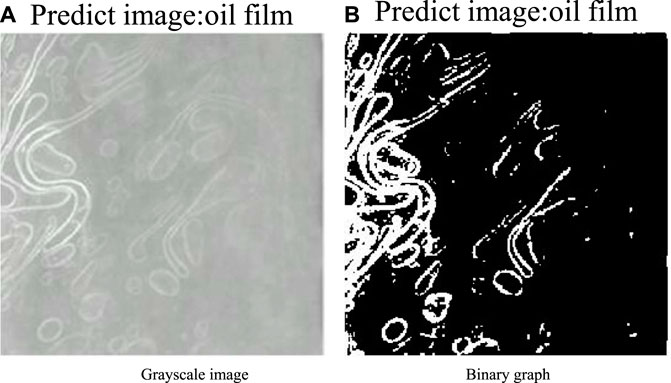
FIGURE 10. Detection results of oil spills. (A) Grayscale image (B) Binary graph.
The proposed detection method has been tested and compared with three other detection methods. The results are shown in Table 1. The proposed method is found to be more technical when compared with different methods from the classification accuracy achieved in Table 1. Table 1 also shows that the accuracy of methods proposed by other researchers is 85% and 93% respectively, while our proposed method can achieve an accuracy of 95%, indicating that it has important practical significance. Notably, when using this research method for oil spill detection, the following points must be given attention:
(1) Three variables should be considered when calculating the gray level co-occurrence matrix: image gray level, direction, and distance.
(2) For the selection of the gray level z, the gray level determines the calculation scale of the GLCM. Reducing the gray level can increase the calculation speed and reduce the storage space requirements. Appropriately reducing the gray level can also reduce the effect of noise on the image. However, gray levels that are too small can destroy the useful texture components.
(3) For the selection of distance d, the co-occurrence matrix changes rapidly with the distance in fine texture while changing slowly with the distance in rough texture. Using a larger distance for smooth textures and a smaller distance for rough textures will achieve better results. For the selection of direction 0, generally four values (0°, 45°, 90°, and 135°) exist to examine different textures through different 0 s, and the co-occurrence matrix generated by different 0 s contains different texture information. When considering the directions, the texture feature values determined by the gray-level co-occurrence matrices in the four directions are often calculated separately. Then, the average value of the feature values in each direction is used as the final texture component.
(4) SVM classification method is simple and efficient. Kernel function can be used to map to high-dimensional space and solve non-linear classification problems. However, it should be pointed out that SVM algorithm is difficult to implement large-scale training samples, sensitive to the selection of missing data samples and kernel functions, and has difficulties in solving multi-classification problems. When using SVM for classification, the selection of samples and the selection of kernel function are an important factor influencing whether the classifier is good. Therefore, for a good classifier, it is necessary to fully consider various influencing factors after repeated debugging, and finally select an optimal scheme to achieve the optimal classification effect.
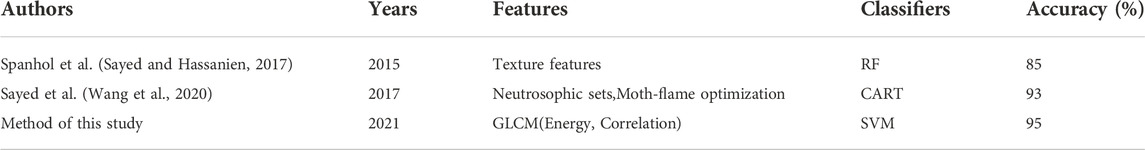
TABLE 1. Comparison with other detection methods.
In this study, by using a new marine environment cruise detection method combined with UAV and infrared sensors, a method based on the combination of GLCM and SVM was proposed to realize the detection of small oil spill accidents. In remote sensing image data processing, the image was first processed, including image enhancement, filtering, and image rotation. Then, the GLCM of the remote sensing image was calculated and used for feature extraction. Based on the collected texture feature values, energy and correlation were selected as distinguishing indicators, and the SVM classification model was constructed. After repeated experiments and debugging, the parameters of the SVM model were determined. Finally, the detection of oil spill phenomenon was completed, and the recognition accuracy reached 95%.
Compared with other methods, this method optimizes the efficiency of image feature extraction. Moreover, the recognition speed is fast, the efficiency is high, and the detection result is equivalent to human visual interpretation. The proposed method is highly suitable for the initial detection of small oil spills because these oil spills are likely to be ignored by the marine environment supervision department. The application of this method can realize the all-weather detection of small oil spill accidents, which can not only save manpower and material resources, but also find and track offshore oil spill pollution accidents and ensure the safety of patrol personnel at night; making it of great significance to marine environment supervision. It should be indicated that the proposed method is primarily applicable to the detection of diesel and lubricating oil spills and not ideal for the detection effect of crude oil spills is.
Future research includes the following: First, oil spill sample images must be collected over a longer period to improve model stability. Second, when the training set is sufficient, a large training network is required for building a detection model that can perform better than existing models. Third, as the experiment performed in this study simulated oil spill images under calm sea surface conditions in a water tank by the beach, which did not consider that the oil spill accident is affected by sea conditions such as waves and currents, the experimental conditions must be further improved in the follow-up research.
The original contributions presented in the study are included in the article/Supplementary Material; further inquiries can be directed to the corresponding authors.
KL is responsible for experimental design, XL is responsible for data analysis, HY is responsible for providing overall ideas, and YX is responsible for the whole process of guidance.
This study was supported by Zhanjiang City Science and Technology Development Special Fund Competitive Allocation Project (NO. 2021A05034) and PhD project initiated by Guangdong Ocean University (060302032109).
The authors declare that the research was conducted in the absence of any commercial or financial relationships that could be construed as a potential conflict of interest.
All claims expressed in this article are solely those of the authors and do not necessarily represent those of their affiliated organizations, or those of the publisher, the editors and the reviewers. Any product that may be evaluated in this article, or claim that may be made by its manufacturer, is not guaranteed or endorsed by the publisher.
Abpeykar, S., and Ghatee, M. (2019). An ensemble of RBF neural networks in decision tree structure with knowledge transferring to accelerate multi-classification. Neural computing & applications, 31, 7131–7151. doi:10.1007/s00521-018-3543-9
Aghaei, N., Akbarizadeh, G., and Kosarian, A. GreyWolfLSM: An accurate oil spill detection method based on level set method from synthetic aperture radar imagery.
Alruzouq, R., Gibril, M., Shanableh, A., Kais, A., Hamed, O., Almansoori, S., et al. (2020). Sensors, features, and machine learning for oil spill detection and monitoring: A review. Remote Sens. 12 (20), 3338. doi:10.3390/rs12203338
Andrea, P., Francesco, B., and Rosalia, S. (2015). Oil spill detection in glint-contaminated near-infrared modis imagery. Remote Sens. 7 (1), 1112–1134. doi:10.3390/rs70101112
Bejarano, A. C., and Michel, J. (2016). Oil spills and their impacts on sand beach invertebrate communities: A literature review. Environ. Pollut. 218, 709–722. doi:10.1016/j.envpol.2016.07.065
Bella, S., Belalem, G., Belbachir, A., and Benfriha, H. (2021). Hmdcs-uv: A concept study of hybrid monitoring, detection and cleaning system for unmanned vehicles. J. Intell. Robot. Syst. 102, 44. doi:10.1007/s10846-021-01372-8
Bhushan, B. (2019). Bioinspired oil–water separation approaches for oil spill clean-up and water purification. Phil. Trans. R. Soc. A 377 (2150), 20190120. doi:10.1098/rsta.2019.0120
Brekke, C., and Solberg, A. (2008). Classifiers and confidence estimation for oil spill detection in envisat asar images. IEEE Geosci. Remote Sens. Lett. 5 (1), 65–69. doi:10.1109/lgrs.2007.907174
Conceio, M., Mendona, L., Lentini, C., Lima, A., and Porsani, M. J. (2021). Sar oil spill detection system through random forest classifiers. Remote SensingAdvances Oil Spill Remote Sens. 131.
Dong, Z., Men, Y., Li, Z., Zou, Q., and Ji, J. (2019). Chlorophyll fluorescence imaging as a tool for analyzing the effects of chilling injury on tomato seedlings. Sci. Hortic. 246, 490–497. doi:10.1016/j.scienta.2018.11.019
Feng, Y., Wang, Y., Wang, Y., and Yao, J. (2017). Furfuryl alcohol modified melamine sponge for highly efficient oil spill clean-up and recovery. J. Mat. Chem. A 5 (41), 21893–21897. doi:10.1039/c7ta06966a
Fiscella, B., Giancaspro, A., Nirchio, F., Pavese, P., and Trivero, P. (2000). Oil spill detection using marine sar images. Int. J. Remote Sens. 21 (18), 3561–3566. doi:10.1080/014311600750037589
Frate, F. D., Petrocchi, A., Lichtenegger, J., and Calabresi, G. (1999). Neural networks for oil spill detection using ers-sar data. Geoscience Remote Sens. IEEE Trans.38 (5), 2282–2287.
Hamouchene, I., Aouat, S., and Lacheheb, H. (2014). Texture segmentation and matching using LBP operator and GLCM matrix. Springer International Publishing.
Haralick, R. M., Shanmugam, K., and Dinstein, I. (1973). Textural features for image classification. IEEE Trans. Syst. Man. Cybern. 3 (6), 610–621. doi:10.1109/tsmc.1973.4309314
Helm, R. C., Carter, H. R., Ford, R. G., Fry, D. M., and Tseng, F. S. (2015). Overview of efforts to document and reduce impacts of oil spills on seabirds.
Hu, S., Wang, X., Wu, H., Luan, X., He, W., Lin, Y., et al. (2020). Unified diagnosis framework for automated nuclear cataract grading based on smartphone slit-lamp images. IEEE Access 8, 174169–174178. doi:10.1109/access.2020.3025346
Hu, S., Wang, X., Wu, H., Luan, X., He, W., Lin, Y., et al. (2020). Unified diagnosis framework for automated nuclear cataract grading based on smartphone slit-lamp images. IEEE Access 8, 174169–174178. doi:10.1109/access.2020.3025346
Hamouchene, I., and Aouat, S. (2014). Overview of texture analysis. Int. J. Comput. Vis. Image Process. 4 (2), 32–51. doi:10.4018/ijcvip.2014040103
Jiao, Z., Jia, G., and Cai, Y. (2019). A new approach to oil spill detection that combines deep learning with unmanned aerial vehicles. Comput. Industrial Eng. 135, 1300–1311. doi:10.1016/j.cie.2018.11.008
Lerski, R. A., Straughan, K., Schad, L. R., Boyce, D. S. Blüml, and Zuna, I. (1993). Viii. Mr image texture analysis—an approach to tissue characterization. Magn. Reson. Imaging 11 (6), 873–887. doi:10.1016/0730-725x(93)90205-r
Li, G., Li, Y., Hou, Y., Wang, X., and Wang, L. (2021). Marine oil slick detection using improved polarimetric feature parameters based on polarimetric synthetic aperture radar data. Remote Sens. 13 (9), 1607. doi:10.3390/rs13091607
Li, K., Yu, H., Yan, J., and Liao, J. (2020). Analysis of offshore oil spill pollution treatment technology. IOP Conf. Ser. Earth Environ. Sci. 510, 042011. doi:10.1088/1755-1315/510/4/042011
Li, Y. (2018). Detection of oil spill through fully convolutional network, in Geo-Spatial Knowledge and Intelligence. GSKI 2017. Communications in Computer and Information Science. Editor H. Yuan, J. Geng, C. Liu, F. Bian, and T. Surapunt. (Singapore: Springer), 848, 353–362.
Liu, P., Li, Y., Liu, B., Chen, P., and Xu, A. J. (2019). Semi-automatic oil spill detection on x-band marine radar images using texture analysis, machine learning, and adaptive thresholding. Remote Sens. 11 (7), 756. doi:10.3390/rs11070756
David, Mera, Bolon-Canedo, Veronica, and Cotos, J. M. (2017). On the use of feature selection to improve the detection of sea oil spills in sar images. Comput. Geosciences 100, 166–178. doi:10.1016/j.cageo.2016.12.013
Nassim, A., Haikel, A., Yakoub, B., Bilel, B., Naif, A., and Mansour, Z. (2017). Deep learning approach for car detection in uav imagery. Remote Sens. 9 (4), 312. doi:10.3390/rs9040312
Nieto-Hidalgo, M., Gallego, A. J., Gil, P., and Pertusa, A. (2018). Automatic ship classification from optical aerial images with convolutional neural networks. Remote Sens. (Basel). 10, 511–514. doi:10.3390/rs10040511
Raimondi, V., Palombi, L., Lognoli, D., Masini, A., and Simeone, E. (2017). Experimental tests and radiometric calculations for the feasibility of fluorescence lidar-based discrimination of oil spills from uav. Int. J. Appl. Earth Observation Geoinformation 61, 46–54. doi:10.1016/j.jag.2017.04.012
Sayed, G. I., and Hassanien, A. E. (2017). Moth-flame swarm optimization with neutrosophic sets for automatic mitosis detection in breast cancer histology images. Applied Intelligence, 47 (2), 397–408.
Shaban, M., Salim, R., Khalifeh, H. A., Khelifi, A., El-Baz, A., El-Mashad, S., et al. (2021). A deep-learning framework for the detection of oil spills from sar data. Sensors 21 (7), 2351. doi:10.3390/s21072351
Shaban, M., Salim, R., Khalifeh, H. A., Khelifi, A., El-Baz, A., El-Mashad, S., et al. (2021). A deep-learning framework for the detection of oil spills from sar data. Sensors 21 (7), 2351. doi:10.3390/s21072351
Singha, S., Bellerby, T. J., and Trieschmann, O. (2013). Satellite oil spill detection using artificial neural networks. IEEE J. Sel. Top. Appl. Earth Obs. Remote Sens. 6 (6), 2355–2363. doi:10.1109/jstars.2013.2251864
Souza, A. C., Silva, G. C., Caldeira, L., Nogueira, F., Aguiar, E., and de Aguiar, E. P. (2020). An enhanced method for the identification of ferritic morphologies in welded fusion zones based on gray-level co-occurrence matrix: A computational intelligence approach. Proc. Institution Mech. Eng. Part C J. Mech. Eng. Sci. 203-210, 1228–1240. doi:10.1177/0954406220942268
Spanhol, F. A., Oliveira, L. S., Petitjean, C., and Heutte, L. (2015). A dataset for breast cancer histopathological image classification. IEEE Trans. Biomed. Eng. 63, 1455–1462. doi:10.1109/tbme.2015.2496264
Strzelecki, M. (1996). IEEE symposium on computer applications & industrial electronics. IEEE.Segmentation of biomedical textured images using neural networks
Tamis, J. E., Jongbloed, R. H., Karman, C. C., Koops, W., and Murk, A. J. (2012). Rational application of chemicals in response to oil spills may reduce environmental damage. Integr. Environ. Assess. Manag. 8, 231–241. doi:10.1002/ieam.273
Taravat, A., Latini, D., and Frate, F. Del (2014). Fully automatic dark-spot detection from sar imagery with the combination of nonadaptive weibull multiplicative model and pulse-coupled neural networks. IEEE Trans. Geosci. Remote Sens. 52 (5), 2427–2435. doi:10.1109/tgrs.2013.2261076
Tayeb, A. M., Farouq, R., Mohamed, O. A., and Tony, M. A. (2020). Oil spill clean-up using combined sorbents: A comparative investigation and design aspects. Int. J. Environ. Anal. Chem. 100 (3), 311–323. doi:10.1080/03067319.2019.1636976
Thompson, K. M., Kalkowska, D. A., and Tebbens, R. J. D. (2015). Managing population immunity to reduce or eliminate the risks of circulation following the importation of polioviruses. Vaccine, 33 (13), 1568–1577.
Tong, S., Liu, X., Chen, Q., Zhang, Z., and Xie, G. (2019). Multi-feature based ocean oil spill detection for polarimetric sar data using random forest and the self-similarity parameter. Remote Sens. 11 (4), 451. doi:10.3390/rs11040451
Wang, B., Shao, Q., Song, D., Li, Z., Wang, M., Yang, C., et al. (2021). A spectral-spatial features integrated network for hyperspectral detection of marine oil spill. Remote Sens. 13 (8), 1568. doi:10.3390/rs13081568
Wang, B., Shao, Q., Song, D., Li, Z., Wang, M., Yang, C., et al. (2021). A spectral-spatial features integrated network for hyperspectral detection of marine oil spill. Remote Sens. 13 (8), 1568. doi:10.3390/rs13081568
Wang, D., Wan, J., Liu, S., Chen, Y., Yasir, M., Xu, M., et al. (2022). BO-DRNet: An improved deep learning model for oil spill detection by polarimetric features from SAR images. Remote Sens. 14 (2), 264. doi:10.3390/rs14020264
Wang, X. Z., Liu, D., Cheng, G., Huang, Y. D., and Yurong, H. E. (2020). Solar heating assisted rapid cleanup of viscous crude oil spills using reduced graphene oxide-coated sponges.
Wegeberg, S., Fritt-Rasmussen, J., Geertz-Hansen, O., Wiktor, J., Bogo-Wilms, L., Larsen, M. B., et al. (2021). Coastline in-situ burning of oil spills in the arctic. studies of the environmental impacts on the littoral zone community. Mar. Pollut. Bull., 173.
Wu, S., Zhong, S., and Liu, Y. (2018). Deep residual learning for image steganalysis. Multimedia Tools and Applications, 77 (9), 10437–10453.
Xh, A., Bzab, C., Wp, C., Yl, D., and Chen, W. A. A novel deep learning method for marine oil spill detection from satellite synthetic aperture radar imagery. Mar. Pollut. Bull. 179.
Xu, J., Pan, X., Jia, B., Wu, X., Liu, P., and Li, B. (2021). Oil spill detection using LBP feature and K-means clustering in shipborne radar image. J. Mar. Sci. Eng. 9 (1), 65. doi:10.3390/jmse9010065
Keywords: oil spills, infrared image, oil spill identification, gray level co-occurrence matrix, suppo rt vector machine
Citation: Li K, Yu H, Xu Y and Luo X (2022) Detection of oil spills based on gray level co-occurrence matrix and support vector machine. Front. Environ. Sci. 10:1049880. doi: 10.3389/fenvs.2022.1049880
Received: 21 September 2022; Accepted: 23 November 2022;
Published: 08 December 2022.
Edited by:
Ahmed M. Eldosouky, Suez University, EgyptReviewed by:
Milad Janalipour, Ministry of Science, Research, and Technology, IranCopyright © 2022 Li, Yu, Xu and Luo. This is an open-access article distributed under the terms of the Creative Commons Attribution License (CC BY). The use, distribution or reproduction in other forums is permitted, provided the original author(s) and the copyright owner(s) are credited and that the original publication in this journal is cited, in accordance with accepted academic practice. No use, distribution or reproduction is permitted which does not comply with these terms.
*Correspondence: Xiaoqing Luo, Z2RvdWx4cUAxNjMuY29t
Disclaimer: All claims expressed in this article are solely those of the authors and do not necessarily represent those of their affiliated organizations, or those of the publisher, the editors and the reviewers. Any product that may be evaluated in this article or claim that may be made by its manufacturer is not guaranteed or endorsed by the publisher.
Research integrity at Frontiers
Learn more about the work of our research integrity team to safeguard the quality of each article we publish.