 Baoqi Chen1
 Xiaotong Xu
94% of researchers rate our articles as excellent or good
Learn more about the work of our research integrity team to safeguard the quality of each article we publish.
Find out more
ORIGINAL RESEARCH article
Front. Environ. Sci. , 18 November 2022
Sec. Environmental Economics and Management
Volume 10 - 2022 | https://doi.org/10.3389/fenvs.2022.1049827
The service industry has become the driving force of Chinese economic development. Promoting the green and high-quality development of the service industry is of great significance to the realization of the “dual carbon” goal. The current studies use the DEA-Malmquist index method to measure the green total factor productivity of the service industry in 31 provinces and cities in China from 2009 to 2019. The spatial correlation characteristics and contributing factors to the green development of the service industry are analyzed through the social network analysis method. Our results show that the added value of the service industry accounts for a high proportion of GDP. However, the service industries are not green enough due to their large low added value and high energy consumption sections. The green development of the service industry shows complex spatial correlation characteristics, and the service industry in the eastern province is the core of the spatial network. The bridge mediating effect of green development of the service industry in the southern region is significant. The green development of the service sector has a significant spatial spillover effect, and no region can be good alone in green development. Provinces should cooperate to promote green development in the service industry.
The 14th Five-Year Plan points out the construction of a green development policy system, and strengthens the legal and policy guarantee of green development; China will strengthen energy conservation and environmental protection, clean production, clean energy, the ecological environment, and infrastructure upgrading. The added value of the Chinese service industry was 6.097 billion Yuan, accounting for 53.31% of the GDP in 2021. It can be seen that the service economy has become the driving force of Chinese economic development. Green development is a new development mode that takes the ecological environment and resource-carrying capacity as constraints to achieve sustainable economic development. Green development is a way of economic growth with the goal of harmony, efficiency, and sustainability. Green development is also a way of social development in which people and nature live in harmony. Green development can coordinate the relationship between economic development and ecological environment protection. Green development has become an important global development trend. The green development of the service industry refers to the clean development of the service industry by optimizing the internal structure of the service industry while considering environmental protection. Many countries regard the development of green industries as an important measure to promote economic restructuring. The rapid growth of the Chinese service industry has brought serious problems such as resource waste and environmental degradation. Under the guidance of current policies, green development of the service industry can promote the low-carbon transformation of the economy. Research on green development of the service industry is of great significance to realize the goal of “carbon neutralization and carbon peak” in China.
The 13th Five-Year Plan proposes to focus on promoting supply-side reform. China should actively cultivate green service enterprises and promote the transformation and upgrading of green development of the service industry. Under the guidance of the policy, scholars have carried out abundant research on service productivity. The development of service differs in different areas and industries. The early research mainly focused on service industry productivity, green economy development, and the role of service industry productivity in promoting the transformation and upgrading of the manufacturing industry (Wang et al., 2016). Scholars used data envelopment analysis (DEA) (Yang and Wu, 2017) and stochastic Frontier analysis (SFA) (Cui and Zhao, 2018; Yang and Yuan, 2019) to measure total factor productivity (TFP) in the service industry. It is concluded that collaborative industrial agglomeration will affect the industrial scale, technological progress, and economic structure (Yang, 2015). Synergistic industrial agglomeration will also produce the interaction of positive and negative externalities (Nanere et al., 2007; Lin and Tan, 2019). Industrial agglomeration has a positive correlation with green production efficiency (Li and Zhang, 2013). The traditional manufacturing industry belongs to the extensive development industry with high energy consumption and high emission. While the service industry was regarded as a green industry with low energy consumption and low pollution. So local governments at all levels developed the service industry as a key way to promote the development of the green economy. However, early studies only considered the “good” output of the service industry, ignoring the “bad” output such as environmental pollution generated in the development of the service industry. Early research showed that the efficiency of the service industry was in the rising range. The productivity of the service industry significantly promoted the development of the manufacturing industry (Wang and Hu, 2012). When considering unexpected outputs such as energy consumption and environmental pollution to measure the efficiency of the service industry, the development of the service industry is not green (Pang and Wang, 2016), and the service industry is no more green than the manufacturing industry (Bai and Meng, 2017). After taking environmental factors into account, the technological progress growth rate of the service industry is low and the technical efficiency declines rapidly. The total factor productivity growth rate of Chinese service industry segments has declined to various degrees. The environmental pollution caused by the development of the service industry has become increasingly serious, which cannot be ignored (Pang, 2014). The service sector is an important contributor to energy consumption and carbon emissions in China. Ignoring environmental factors will seriously affect the efficiency evaluation of the service sector, which will not only overestimate the growth rate of total factor productivity in the service sector but also lead to wrong guidance in the formulation of policy recommendations (Hailu and Veeman, 2000). Only the service productivity measured with accurate consideration of environmental factors can be reliable. Otherwise, there will be a deviation between the measured productivity and the actual productivity (Nanere et al., 2007).
Existing studies on the development of the service industry mainly focus on the productivity of the service industry and the promotion relationship between the service industry and the manufacturing industry (Yang et al., 2015). The existing research has not considered the regional difference and spatial correlation of green development in the service industry. When the added value of the service sector accounts for more than 50% of GDP, it will significantly increase the total energy consumption and pollution emission of the service sector. However, existing studies have not included the development scale of the service sector in the contributing factors of the green development of the service industry. Based on the existing research, this paper analyzes the following aspects: 1) Taking the development scale of the service industry into account, this paper investigates whether the development of the service industry is green when the proportion of the service industry is increasing. 2) Based on the green development of the service industry in provinces, the regional differences and heterogeneity are studied, to provide a basis for the development of the green service industry in different regions. 3) From the perspective of spatial correlation, the current study put forward policy suggestions for the coordinated linkage of provinces and regions to jointly promote the green development of the service industry.
The rising proportion of high-value-added and efficient service industries will improve the level of green development of the service industry, otherwise, the rising proportion of high-energy consumption service industries will reduce it. In recent years, the top five industries in the development of the service industry are wholesale and retail, finance, real estate, transportation, warehousing, postal services, and education. Although the financial industry and real estate industries are low energy consumption and low pollution industries. Chinese financial volume is large and the operation efficiency is low. Also, there is a foam in the development of the real estate market, resulting in low green total factor productivity (Pang and Wang, 2016). Domestic consumption, transportation, warehousing and postal industry, wholesale and retail industry are high energy-consuming service industries. The energy consumption of domestic consumption is only second to the manufacturing industry, black financial smelting, and rolling processing industry. The rapid development of the transportation, warehousing, and postal industry, wholesale and retail industry has led to the rapid growth of its energy consumption and pollution emissions, and the energy consumption problem of the service industry has become increasingly prominent. Therefore, when considering environmental factors, the green total factor productivity of the Chinese service industry will tend to decline as the proportion of the high energy consumption service industry increases.
The combination and allocation of production factors and resources determine the mode of economic growth. Extensive growth depends on the input of various production factors and resources, pursues quantity and speed unilaterally, and ignores quality and efficiency. Intensive growth promotes economic growth by improving technology and resource allocation efficiency. In recent years, the added value of the Chinese service industry has accounted for more than 50% of the country’s GDP. However, due to government intervention, urban industrialization, and other policies, Chinese service enterprises have developed a pattern of low-quality repeated development. The homogeneous structure of service industry development has led to the smaller scale of service industry segments, repeated construction at low-level, resource mismatch, and other serious problems. Therefore, the development of the Chinese service industry is still in the extensive growth stage. The phenomenon of high energy consumption and high pollution emissions in the service industry is prominent. When considering environmental factors, the low-quality and repeated development of the service industry will reduce the green total factor productivity of the service industry.
The productive service industry is characterized by knowledge-intensive, low pollution, low energy consumption, high output, and high employment. Productive services provide intermediate products for the manufacturing industry. Productive services include transportation, warehousing, and postal services, information transmission and computer services, software, finance, leasing, and commercial services, scientific research, technical services, and geological survey. Among them, transportation, warehousing, and postal services belong to low-end productive services with high total energy consumption (Xuan and Yu, 2017), while other industries belong to low energy consumption sections. When the proportion of producer services increases, it will reduce energy consumption, improving the green total factor productivity of the service industry (Gu, 2010). Producer service industry cluster refers to the concentration of a large number of producer service enterprises in a region. The agglomeration of producer services is conducive to attracting high-level talents and forming a good collective learning atmosphere in the region (Keeble and Nachum, 2002). The flow of human capital plays a positive role in the optimization of the industrial structure by promoting scientific and technological innovation (Squicciarini and Voigtlander, 2015). Producer service industry clusters can produce economies of scale, reduce transaction costs (Glaeser et al., 1992), promote social exchanges, and promote industrial optimization and upgrading (Lanaspa et al., 2016). Giving play to the agglomeration role of producer services is of great significance to improving the efficiency of resource allocation and promoting economic growth. The refined and specialized division of labor in the high-end manufacturing industry promotes the agglomeration of producer services. The deep integration of producer services and the high-end manufacturing industry forms a large-scale and intensive industrial system (de Berardino and Onesti, 2021), thus promoting the development of the service industry. The agglomeration of producer services can be divided into professional agglomeration and diversified agglomeration. Diversified agglomeration focuses on the coordinated operation of multiple service industries, forming a diversified development pattern; Specialized agglomeration can promote technology spillover, and realize fine division of labor. Diversified agglomeration can accelerate technology integration, promote knowledge spillover sharing, and promote industrial structure optimization. Form a network pattern with reasonable cooperation and good order through diversified agglomeration of producer services. In a smaller area, the demand for producer services is single, and the service industry is suitable for the development of specialized agglomeration. The industrial system in the large-scale area is perfect, and the total demand for producer services is large (Han et al., 2015). The demand for producer services is diversified, promoting the diversified agglomeration of producer services (Xi et al., 2015). The effective matching between the cluster mode of producer services and the regional scale will help reduce carbon emissions, thus improving the green total factor productivity of the service industry.
The agglomeration of producer services produces spatial spillover effects through related industries (Ke et al., 2014). Spillover effects will not only affect local areas, but also other regions (Krugman, 1991). Environmental pollution will spread among different regions and spread in the spatial scope along with factor flowing, enterprise investment, and industrial transfer, so environmental pollution will show strong spatial relevance (Han and Xie, 2017). Pollution emissions have a significant spatial spillover effect (Su et al., 2009). The green production mode within the region can form a good demonstration effect on the surrounding areas and guide the collaborative improvement of the production efficiency of the surrounding areas (Xuan and Yu, 2017). The environmental effects brought by economic agglomeration are not limited to the agglomeration areas, but also have significant spillover effects on the environment of surrounding areas (Drucker and Feser, 2012; Liu et al., 2018). The internal structure development of the provincial service industry does not match the local resources, resulting in the demand for service industry elements being realized through the surrounding areas (Wang et al., 2015). The green development of the service industry in the surrounding areas is affected, so the green development of the service industry is spatially related.
The development of the manufacturing industry in eastern China has formed a relatively stable industrial pattern. The integration of the manufacturing industry and the service industry is high. The industrial chain and value chain are constantly improving. The high value-added and low energy consumption service industries account for a high proportion of the overall service industry. The sub-industries achieve coordinated promotion through resource sharing, forming economies of scale, and promoting the green development of the service industry. However, the industrial structure in the central and western regions is simple. The development of the high-end productive service industry in central and western China is weak, the proportion of the high energy consumption service industry is high, and the green development level of the service industry is low. Existing studies focus more on the East-West differences in economic development. In recent years, with the increase of the North-South economic gap, some scholars began to study the North-South gap in economic development. Based on the existing research results, this paper increases the analysis of the North-South gap in the green development of the service industry, which has important practical significance for promoting the high-quality development of China’s service industry. Taking the Qinling Mountains Huaihe River as the dividing line, this paper divides the Chinese Mainland into the north and the south (Wu, 2001). The rapid development of the manufacturing industry in the North has led to the rise of the agglomeration level of producer services, so the green development level of the service industry in the north is higher than that in the South. However, in recent years, due to the lagging transformation and upgrading of the manufacturing industry in the northern region, the gap between the North and the South in the service industry is narrowing. There are regional differences in the green development of the service industry between the North-South regions, but the gap will continue to narrow with the economic development of the South.
The green development of the service industry has the characteristics of spatial correlation and spillover. The existing researches mostly use spatial weight matrix, Gini coefficient, Moran index, gravity matrix, and social network analysis methods to calculate spatial correlation indicators. Social network analysis methods are widely used to measure the spatial network correlation characteristics of regional innovation systems (Hoekman et al., 2009), regional economic growth (Lin and Ting, 2017), housing prices (Ding and Ni, 2015), productive services (Chen, 2022), etc.
The spatial econometric model can be used to study the spillover effect of producer services agglomeration on regional economic growth (Huang and Guo, 2020), environmental quality (Han et al., 2021b), and industrial optimization (Chen, 2022); Spatial econometric model can be used to study the spillover effect of industrial collaborative agglomeration on regional innovation efficiency (Yuan and Gao, 2020); Spatial econometric model can also be used to study the impact of land resource mismatch on haze pollution. (Han et al., 2021a). Spatial econometric models are widely used in the study of spillover effects.
This paper uses the social network analysis method to take 31 provinces and cities as the main body of the network relationship. Based on the linear correlation coefficient of the green total factor productivity of the service industry, the paper uses mathematical statistics and other methods to describe the correlation between the green total factor productivity of the service industry. The spatial correlation network structure is divided into the analysis of overall characteristics and individual characteristics (Burt, 1976). The current study uses the network density, network correlation degree, network grade degree, and network efficiency of green total factor productivity to describe the overall characteristics (Li and Niu, 2017). Proximity centrality, degree centrality, and intermediate centrality are used to measure individual characteristics. Network density is an important indicator to measure the spatial correlation of green development of the service industry in each province. The greater the density, the closer the spatial relationship of green development of the service industry in each province and city (Liu, 2004). The network correlation degree measures the robustness of the spatial correlation of the green development of the service industry in each province and city. When the correlation degree is 1, it means that all provinces and cities are in the spatial correlation network, and the spatial network robustness of the green development of the service industry is strong (Huang, 2018).
Environmental pollution will spread in space with production factors and economic activities, so the green development of the service industry will show strong spatial relevance. Factors such as the concentration level of producer services not only affect the green development of local services but also affect the green development of services in surrounding provinces. To analyze the impact of spatial factors on the green development of the service industry, a spatial econometric model is built (Elhorst, 2012):
TFPit refers to the green productivity of the service industry. PSit refers to the concentration level of productive services. Xit represents the control variables that affect the productivity of the service industry, including urbanization rate, service industry development scale, trade dependence, marketization degree, and birth rate. The subscripts i and t represent the province and year respectively.
This paper selects the annual data of 31 provinces and cities from 2008 to 2019 as the research sample. The data mainly comes from the Chinese statistical yearbook, provincial statistical yearbooks, and the Guotai’an database.
This paper takes the green development of the Chinese service industry as the research object. Single-factor productivity and total-factor productivity can be used to measure the development of the service industry. Single-factor productivity often includes labor productivity and capital productivity. Single-factor productivity can only reflect the output corresponding to a single factor. Total factor productivity can comprehensively measure the corresponding output of labor, capital, technology, etc. total-factor productivity can more accurately measure the development status of the service industry than single-factor productivity (Hulten, 2000; Coelli et al., 2005; Syverson, 2011). Green total factor productivity covers labor, capital, and other input factors, taking into account expected value-added output and unexpected environmental output (Chen, 2018). Green total factor productivity can accurately measure environmental pollution in the process of service industry development. This paper uses the green total factor productivity of the service industry to represent the green development level of the service industry.
This paper uses data envelopment analysis (DEA Malmquist index) to measure the green total factor productivity of the service industry (Farrell, 1957; Charnes et al., 1978; Shen, 2013) as the explained variable of the study (Last and Wetzel, 2011; Evangelinos, 2012; Pang, 2014; Wang and Teng, 2015; Yang, 2015). DEA Malmquist index method does not need to set the production function, to avoid the error of setting the function form and affecting the accuracy of the results. The input parameters include labor and capital, and the output parameters include service industry output value and environmental pollution (Fare et al., 2007). The output value of the service industry is measured by the added value of the tertiary industry of each province and city from 2008 to 2019 (unit: 100 million yuan), and the data is adjusted to the constant price in 2008. Both carbon dioxide and sulfur dioxide can represent environmental pollution. Based on existing research, this paper takes sulfur dioxide as the environmental output variable. Considering the availability of data, the environmental output data is measured by the sulfur dioxide emissions of each province (unit: 10,000 tons) (Pang and Wang, 2016). The labor input is measured by the number of urban unit employees (unit: 10,000 people) in each province, district, and city in the same period by industry.
According to the total investment in fixed assets of the whole society (unit: 100 million yuan) minus the corresponding data of agriculture, forestry, animal husbandry, fishery, mining, manufacturing, electricity, gas, and water production, the data of fixed asset investment in the service industry is obtained. The capital depreciation rate is set as 4% (Lee and Hong, 2012; Barro and Lee, 2013). The capital stock in the base year is calculated based on the steady-state analysis method, and the capital stock of each province and city is estimated using the perpetual inventory method. According to the input-output variables, the green total factor productivity data of the service industry in 31 provinces and urban areas under variable returns to scale are calculated using the DEA method.
The existing literature studies the development level of the service industry around the urbanization level (moroto Sanchez and Cuadrado Roura, 2009), system construction (Zhuang et al., 2009), transportation infrastructure (Liu, B et al., 2010), fiscal expenditure, and other factors (Kendrick, 1961; Denision, 1962). This paper introduces the corresponding explanatory variables to measure the factors that contribute to the green development of the service industry. The results of the study provide the basis for local governments at all levels to comprehensively develop the green service industry.
With the expansion of the service industry, the proportion of the high-energy consuming service industry is rising, which will hinder the green development of the service industry. To study the relationship between the scale and the green total factor productivity of the service industry, the proportion of the added value of the service industry in the GDP of each province is used to measure the service industry development scale (service) (Francois, 1990); Productive service industry will affect the green development level of the service industry through specialized and diversified agglomeration. This paper uses location entropy to measure the level of productive service industry agglomeration. Location entropy can eliminate the factors of regional spatial scale differences, and can truly reflect the spatial distribution of geographical elements (Liang, 2018). The existing researches mostly use location entropy and the Gini coefficient to measure the level of industrial spatial agglomeration. However, many scholars use location entropy to measure the concentration level of producer services. Based on the existing research, this paper introduces location entropy to measure the agglomeration level of producer services. In this paper, the number of employees in five major industries including transportation, warehousing, postal services, information transmission and computer services, software industry, finance, leasing and commercial services, scientific research, technical services, and geological exploration is taken as the basic indicator. The provincial productive service industry agglomeration level (PS) is characterized by measuring the location entropy (Liu, J et al., 2010; Yang, 2015):
The location entropy (
The level of urbanization will increase the demand for services. The change in the degree of marketization will affect the efficiency of industrial development. The trade dependence measure of regional trade development can study the green development of the service industry from the perspective of regional economic development. Based on the existing research, this paper introduces the corresponding control variables for empirical analysis. The urbanization rate (city) is an important influencing factor to measure the development level of the service industry. The proportion of the urban population in the total population (Xuan and Yu, 2014; Liu et al., 2017) is used to measure the impact of the urbanization level on the green development of the service industry. Degree of marketization (Market) measures the contribution of property right system reform and marketization reform to green total factor productivity of the service industry. The degree of marketization is measured by subtracting the ratio of the total wages of state-owned urban unit employees from the total wages of urban employees by 1 (Zhang et al., 2018). Trade dependence is measured by the proportion of total imports and exports in GDP. Since the import and export data is in US dollars, it is converted into RMB according to the average exchange rate from 2009 to 2019. Trade dependence can measure the impact of export-oriented economic development on the green total factor productivity of the service industry (Shen and Geng, 2001; Lu et al., 2015). The birth rate of the population is measured by the birth rate of each province at the end of the year. The descriptive statistics of each variable are shown in Table 1.
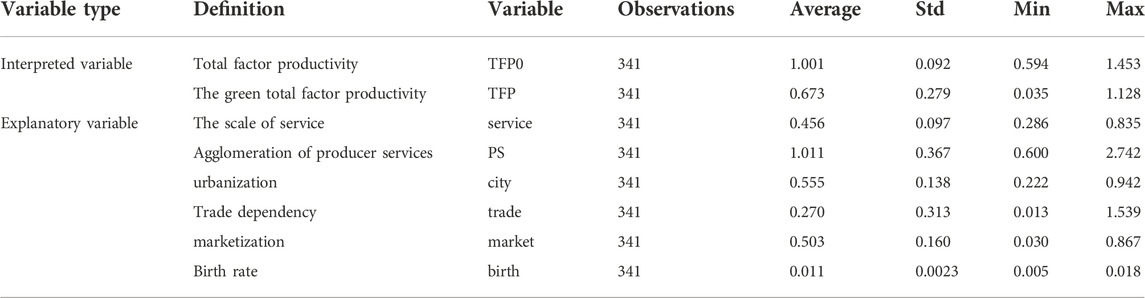
TABLE 1. Descriptive statistics of variables.
It can be seen from Table 1 that when environmental factors are considered, the average total factor productivity of the service industry decreases from 1.001 to 0.673. The maximum and minimum total factor productivity of the service industry also decreases significantly, which indicates that the total factor productivity of the service industry will be overestimated if environmental factors are not considered. The standard deviation of green total factor productivity in the service industry is high, indicating that there is a large gap in the green development level of the service industry in 31 provinces and cities. The average development scale of the service industry is 0.456. The scale of the service industry in Beijing is higher than 0.7, far higher than the average level. The Service industry accounts for a small proportion of Henan, Qinghai, and Anhui. The service industry has become the main force to boost economic development, but the development of the service industry in different provinces is quite different. The standard deviation of producer services agglomeration level is high, which indicates that the agglomeration level of producer services in 31 provinces and cities is different, and the geographical distribution of producer services is unbalanced.
This paper uses the DEA Malmquist index method to measure the growth of the green total factor productivity, efficiency change, and technological progress of the service industry in 31 provinces and regions of China. Table 2 shows the change in green total factor productivity of the service industry in 31 provinces and regions from 2009 to 2019. It can be seen that the green total factor productivity of the service industry in all provinces and regions is generally declining. The average green total factor productivity of the service industry in Liaoning, Inner Mongolia, Tibet, Jilin, Hebei, Beijing, and other regions is high. The service industry with high added value and low energy consumption in these regions accounts for a high proportion of the total service industry. A productive service industry with a fine division of labor drives the green development of the service industry. The green total factor productivity of the service industry in Guizhou, Guangxi, Henan, Gansu, and other regions is low. The service industry in these areas is mainly a low-end service industry with high energy consumption and high pollution. Significant environmental pollution has led to low green total factor productivity in the service industry.
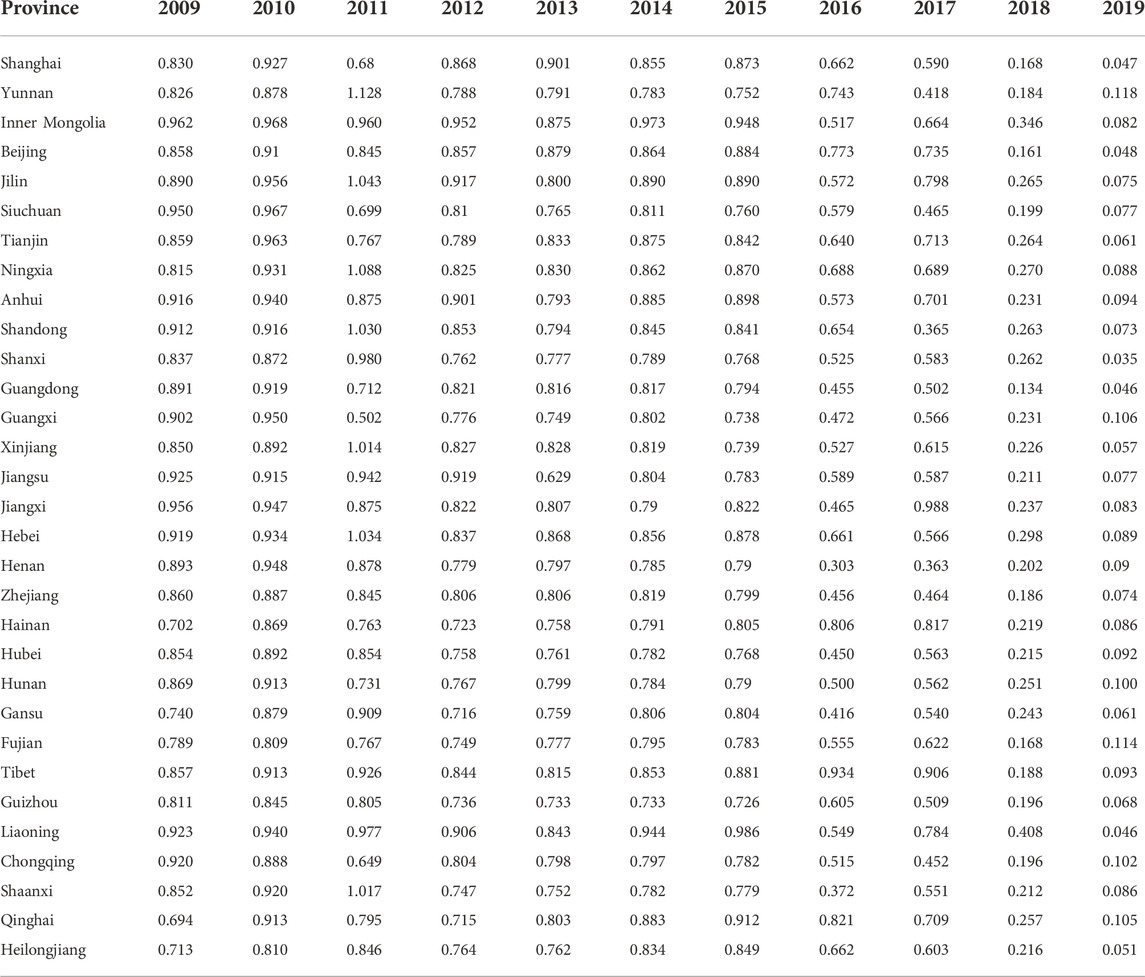
TABLE 2. Changes in green total factor productivity of the service industry.
Figure 1 shows the total factor productivity of the service industry without considering environmental factors. When environmental factors were not taken into account, the total factor productivity of the service industry showed a temporary downward trend due to the slowdown of economic growth from 2010 to 2013. However, with the stimulus of national supply-side reform, real estate de-stocking, and other policies, the total factor productivity of the service industry experienced a callback in 2014. The total factor productivity of the service industry did not fluctuate significantly from 2015 to 2019. It can be seen from Figure 1 that changes in the total productivity of the service industry are mainly caused by changes in technological progress. It can be seen from Figure 1 that the change in total factor productivity in China’s service industry is mainly affected by technological progress. In 2013, with the slowdown of China’s economic growth, the total factor productivity of the service industry showed a temporary downward trend. However, with the impact of supply-side reform, replacing business tax with value-added tax, real estate de-stocking, and other measures, the total factor productivity of China’s service industry tends to be normal. China’s provinces should increase technology investment and introduce a digital economy to improve the green development of the service industry.
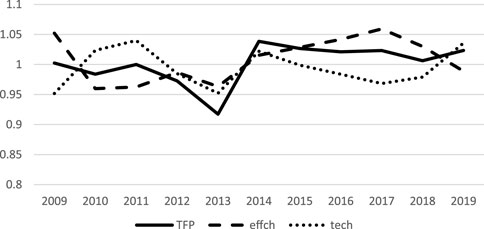
FIGURE 1. Change trend of total productivityin service industry.
Figure 2 shows the green total factor productivity of the service industry after taking the environment as an unexpected output in 31 provinces and regions. From 2009 to 2015, the green total factor productivity and technological progress level of the Chinese service industry remained unchanged, while technological efficiency continued to rise; The proportion of the added value of the service industry has been rising, and the rapid development of transportation, warehousing, and postal services, wholesale and retail industries has led to the rapid growth of its energy consumption and pollution emissions. The energy consumption problem of the service industry was gradually highlighted from 2016 to 2019. With the significant expansion of the service industry, the green total factor productivity of the service industry showed a downward trend. The efficiency of green technology remains unchanged, while the progress of green technology continues to decline. The repeated and homogeneous construction of the service industry leads to resource mismatch and environmental waste, which leads to the fact that the development of the Chinese service industry is not green.
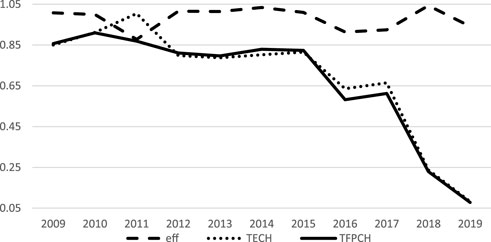
FIGURE 2. Green total factor productivity in service industry.
Since 2015, the added value of the service industry has accounted for more than 50% of the national GDP, which is in a rising trend; The service economy has become the driving force of Chinese economic development, but the increase in the proportion of the added value of the service industry has reduced the green total factor productivity of the service industry. High-end services with high added value and low energy consumption account for a low proportion of the service industry. Low-end services with high energy consumption and high pollution account for a high proportion of the service industry, such as consumer services, transportation, warehousing, postal services, wholesale and retail industries. The proportion of the low-end service industry has been rising, which has brought about increasingly prominent environmental pollution problems. As a result, the green total factor productivity of the service industry has declined with the increase of the proportion of the service industry. Inadequate progress in green technology in the service industry has led to repeated and homogeneous construction of the service industry, a mismatch of resources in the service industry, and low-quality development. The internal structure of the service industry needs to be further optimized. At the same time, the technical level of the service industry should be improved to improve the efficiency of resource utilization and reduce environmental pollution.
In this paper, 31 provinces and cities are divided into north and south regions by the Qinling Huaihe Line. Qinling Huaihe Line is short for Qinling Mountains Huaihe River Line. Qinling Mountains Huaihe River Line is the geographic boundary between northern and southern China. This paper takes the Qinling Huaihe Line as the north-south boundary of China. The northern region includes 15 provinces and cities, including Beijing, Tianjin, Hebei, Shandong, Henan, Shanxi, Inner Mongolia, Heilongjiang, Jilin, Liaoning, Shaanxi, Gansu, Qinghai, Ningxia, and Xinjiang. The southern region includes 16 provinces and cities, including Shanghai, Jiangsu, Zhejiang, Anhui, Fujian, Jiangxi, Hubei, Hunan, Guangdong, Guangxi, Hainan, Chongqing, Sichuan, Guizhou, Yunnan Tibet (excluding Hong Kong, Macao, and Taiwan). Figure 3 shows the contrast between north and south differences in green development of the service industry. The declining trend of green total factor productivity of the service industry in different regions remains unchanged, but the green development of the service industry in different regions is different. The green total factor productivity of the service industry in the north was higher than that in the south from 2008 to 2017. But the green total factor productivity of the service industry in the south exceeded that in the north from 2018 to 2019. From 2008 to 2017, the northern region benefited from the development of an extensive manufacturing industry with high energy consumption and high emissions, promoting the coordinated development of producer services. The northern region realized the diversified agglomeration of producer services. The green development of the service industry in the northern region, although in a downward trend, had a leading advantage over the southern region. Due to the differences in resource endowments, the disappearance of the “demographic dividend” and other reasons, the transformation and upgrading of the manufacturing industry in the northern region lags. The southern region took the lead in promoting the optimization of industrial structure and used economic technology as an input factor to achieve rapid economic transformation. The high-end service industry in the south developed rapidly. The green development of the service industry in the north has gradually lost its leading edge, and the green development of the service industry in the north has been lower than that in the south since 2018. The southern region has benefited from technological progress, industrial structure optimization, economic transformation, and other reasons. The service industry development level in the southern region is gradually higher than that in the northern region. If the northern region does not actively carry out industrial optimization and upgrading, the gap will expand.
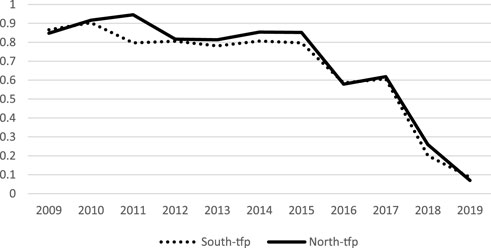
FIGURE 3. North south difference in the development of service industry.
Figure 4 shows the contrast between the east, west, and middle regions in the green development of the service industry. The green total factor productivity of the service industry in the eastern region was the highest from 2008 to 2017, followed by the central region and the western region. In 2017, the green total factor productivity in the central region exceeded that in the western and eastern regions. The eastern region has a high degree of integration of the manufacturing industry and service industry. The service industry with high added value and low energy consumption accounts for a high proportion of the overall service industry in the eastern area, forming economies of scale and promoting the green development of the service industry. Due to the preferential government policies and the improvement of transportation infrastructure, the proportion of high value-added and low energy consumption service industries in the central region has been rising. The gap between the eastern and central regions of green development in the service industry has narrowed, and the downward trend of green total factor productivity in the service industry has eased. With the improvement of transportation infrastructure, the development of digital technology, and the support of government policies, the green development level of the service industry in the central and western regions continues to improve. However, due to the regional advantages, the eastern region has formed industrial economies of scale, so the eastern region will still be in the leading position in the green development of the service industry.
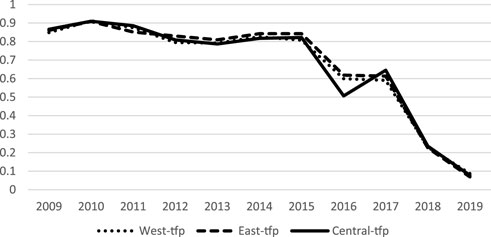
FIGURE 4. The level difference of green industry development.
Figure 5 shows the distribution of national green total factor productivity in 2015. It can be seen that the green total factor productivity in most provinces is greater than 0.6. The green total factor productivity in the north is higher than that in the south as a whole. The green total factor productivity of Jiangxi and Anhui is better in the south, while other regions in the south are under 0.8. The manufacturing industry in the northern region drives the development of the service industry, especially the production service industry with low energy consumption. The green total factor productivity in most northern provinces is higher than that in the south in 2015.
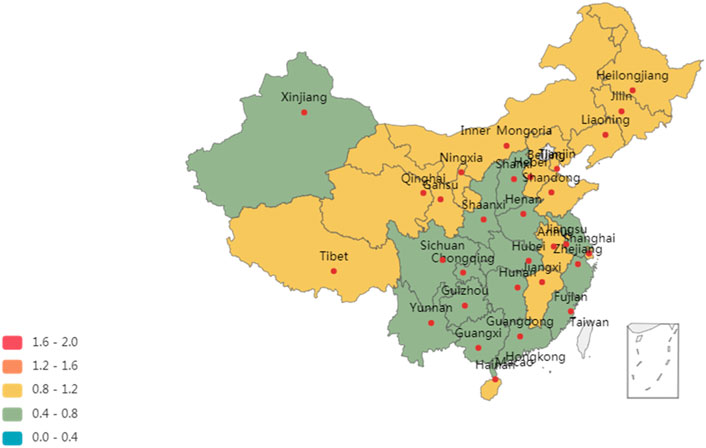
FIGURE 5. National green total factor productivity of service industry in 2015.
Figure 6 shows the distribution of national green total factor productivity in 2019. Compared with 2015, the green total factor productivity level of the national service industry in 2019 decreased significantly. In recent years, the proportion of the high energy-consuming service industry has been rising. With the rising proportion of the service industry, the green development level of the service industry has shown a downward trend. Due to the lagging industrial transformation, the disappearance of the demographic dividend, and the slowing economic growth, the green total factor productivity in the north has declined more than that in the south. The gap between the green development of the service industry in North and South China is gradually emerging. It is of great practical and theoretical significance to study the North-South gap in the green development of the service industry.
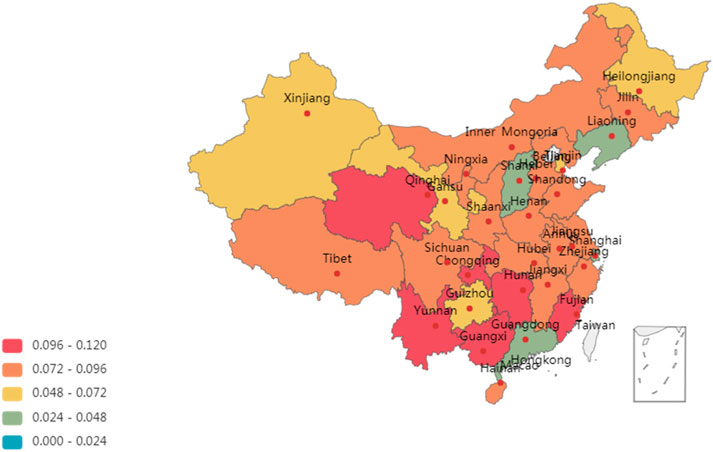
FIGURE 6. National green total factor productivity of service industry in 2019.
Figure 7 shows the spatial correlation network of green total factor productivity in the Chinese service industry. This paper depicts the spatial network characteristics based on the correlation coefficients of green total factor productivity in 31 provinces and regions. The spatial correlation of green total factor productivity in the service industry in China is characterized by networking. The local green total factor productivity in the service industry is not only affected by local factors, but also by the green development of the service industry in other regions. There is also a spatial correlation between provinces that are not adjacent in space.
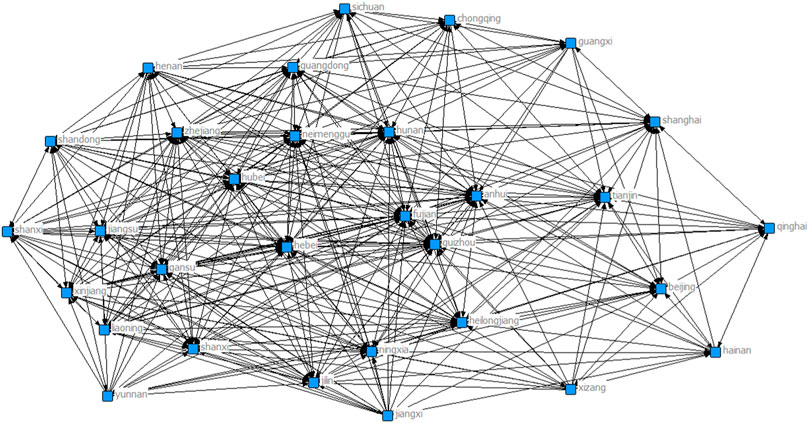
FIGURE 7. Spatial correlation network characteristic of green total factor productivity in service industry.
The spatial network density of green total factor productivity of the service industry is 0.566, which shows that green total factor productivity has a significant spatial spillover effect. The network correlation degree is 1. The green total factor productivity of the service industry in all provinces and regions has a spatial linkage effect, and there is no isolated province. No province can be independent in environmental governance. Nongreen development of any province will have an impact on other provinces.
Figure 8 shows the results of the spatial network of green total factor productivity of the Chinese service industry relating to the characteristics of each province. The average degree centrality of provinces as nodes is 69.247. The degree of centrality of eastern provinces is high. The output is higher than the input in Shanghai, Shandong, Jiangsu, and other regions. The impact of green total factor productivity of the service industry in these provinces on other regions is higher than that of other provinces on themselves. The provinces with a high degree of centrality are Fujian, Guizhou, Anhui, Hubei, and Zhejiang, which shows that these provinces are at the core of the spatial network in the green development of the service industry.
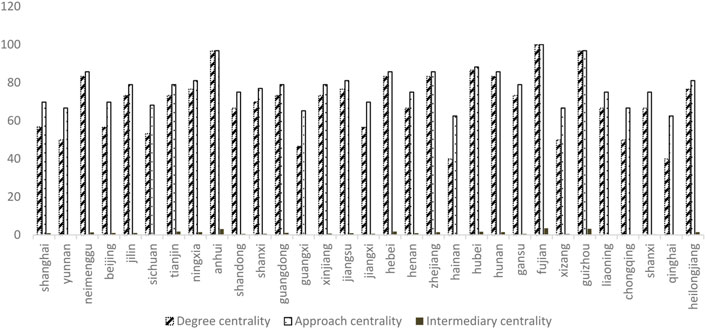
FIGURE 8. Module analysis of spatial assosiation network of green total factor productivity in service industry.
The average closeness to the centrality of each node is 77.653, indicating that the green service industry in each province has a high spatial correlation degree. Fujian, Anhui, Guizhou, Hubei, and Inner Mongolia have a high closeness to centrality. These provinces have a close network connection with other provinces, which can drive the improvement of green total factor productivity in other provinces. Qinghai, Hainan, Guangxi, Chongqing, and Tibet have a low degree of proximity to the center. These provinces are at the edge of these node networks, and the green service industry in these provinces has little impact on other regions.
The average intermediary centrality is 1.06. The intermediary centrality of Fujian, Guizhou, Anhui, Hebei, Tianjin, Hubei, Hunan, Heilongjiang, Ningxia, Zhejiang, Inner Mongolia, Guangdong, and other regions is greater than 1. These provinces play an intermediary role in the spatial network and have an important bridge intermediary impact on the spatial key network. These provinces are network hubs for the green development of the service industry. The intermediary centrality of Qinghai, Shanxi, and Hainan is low, indicating that these provinces have a low impact on the green service industry in other regions.
Each province should fully tap its advantageous industries and promote the green development of the service industry through the complementary comparative advantages of different provinces. The green development of Shanghai, Shandong, Jiangsu, and other provinces has had a great impact on other provinces. These provinces can drive the green development of surrounding provinces through spillover effects. Qinghai, Hainan, Guangxi, Chongqing, Tibet, and other places are at the edge of the network. These provinces need to actively establish cooperation and contact with other provinces to drive the green development of the local service industry. Fujian, Anhui, Guizhou, Hubei, and Inner Mongolia are closely related to other provinces. These provinces can increase the linkage effect and strengthen inter-provincial cooperation to improve the green development level of their service industries.
The eastern provinces are at the core of the social network and play an important leading role in the path of green development of the service industry, belonging to the net spillover sector. The green development of the service industry in the central and western provinces is weak. Taking the Qinling Huaihe River as the boundary, the southern provinces play a strong role in the spatial network connection. Southern provinces have a strong impact on the spatial network connection of the green development of the entire service industry.
When the adjacency matrix, economic matrix, and distance matrix are used as the weight matrix, the results of the likelihood ratio and Wald test show that the spatial autoregressive model (SAR) should be used. This paper will analyze the spatial spillover effect and contributing factors on the green development level of the service industry based on the spatial autoregressive model. The study controls the space effect and time effect. Table 3 shows the spatial econometric regression results of the impact of each element on the green total factor productivity of the service industry when the adjacency matrix is a weight matrix. Columns (1–3) show the direct, indirect, and total effects of the spatial autoregressive results.
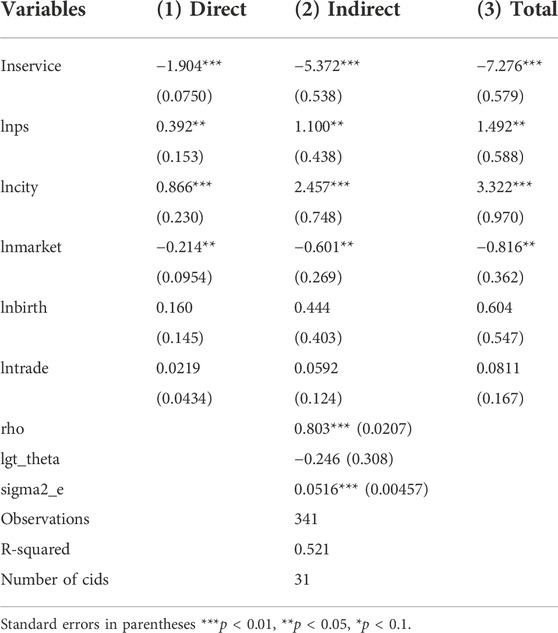
TABLE 3. Spatial econometric regression results of contributing factors.
When the adjacency matrix is used as the spatial weight matrix, the estimated coefficients of producer service industry concentration level and urbanization rate on the green total factor productivity of the service industry are significantly positive. The impact of producer service industry concentration level and urbanization rate on the green development of the service industry not only has a “local” effect but also has a significant spatial spillover effect. They will significantly promote the green development of the service industry in and around the region. The gathering of producer services brings economies of scale, promotes the exchange of production resources and talents, drives service enterprises to obtain resources, and reduces transaction costs. The higher the concentration level of producer services, the higher the proportion of high value-added and low energy consumption sub-sectors. Increasing the agglomeration level of producer services will reduce the energy consumption of the service industry and promote the green development of the service industry. Service industry production has the characteristics of non-storage. Service production and consumption are consistent in time and space. The regions with high urbanization rates have a large demand for service products, driving the green development of local and surrounding service industries.
The estimated coefficients of the development scale of the service industry are significantly negative, indicating that the Chinese service industry is still in extensive development. The added value of the service industry is rising, but the service quality needs to be improved. In recent years, the catering takeout, logistics, and other life service industries have developed rapidly, forming a phenomenon of small but many service enterprises with low resource utilization efficiency. Chinese service enterprises have failed to form a scale advantage. Many homogeneous service enterprises have increased transaction costs and low resource allocation efficiency, thus reducing the green total factor productivity of the service industry. The degree of marketization of the service industry has a significant inhibiting effect on the green development of the service industry. State-owned enterprises pay more attention to environmental governance, pollution reduction, and carbon reduction than private enterprises. State-owned enterprises play an important role in promoting the green development of the service industry. Because of the strong mobility of human capital, the higher the birth rate, the lower the demographic dividend will be with the loss of human capital. Although the birth rate promotes the green development of the service industry, the results are not significant. The degree of trade dependence can promote the green development of the service industry. Because the service industry products cannot be stored. Chinese import and export trade is mainly concentrated in agriculture and manufacturing, while the degree of import and export of service-related products is weak. The effect of trade dependence on the green development of the service industry is not significant.
From the regression results, we can see that the scale of service industry development, the level of productive service industry agglomeration, and the urbanization rate have an important impact on the green development of the service industry. China’s service industry has a large scale of development, but the low-quality homogeneous structure causes a waste of resource allocation, and the concentration level of producer services can significantly promote the green development of the service industry. The higher the urbanization rate is, the greater the demand for the service industry is, which will drive the green development of the service industry. To promote the green development of China’s service industry, provinces can optimize the internal structure of the service industry, improve the concentration level of producer services and promote urbanization.
The existing research mainly discusses the total factor productivity of the service industry from the perspective of the eastern, western, and central regions. This paper joins the north-south differences in green development of the service industry with the Qinling Huaihe Line as the boundary. The spatial autoregressive results of different regions are shown in Table 4:
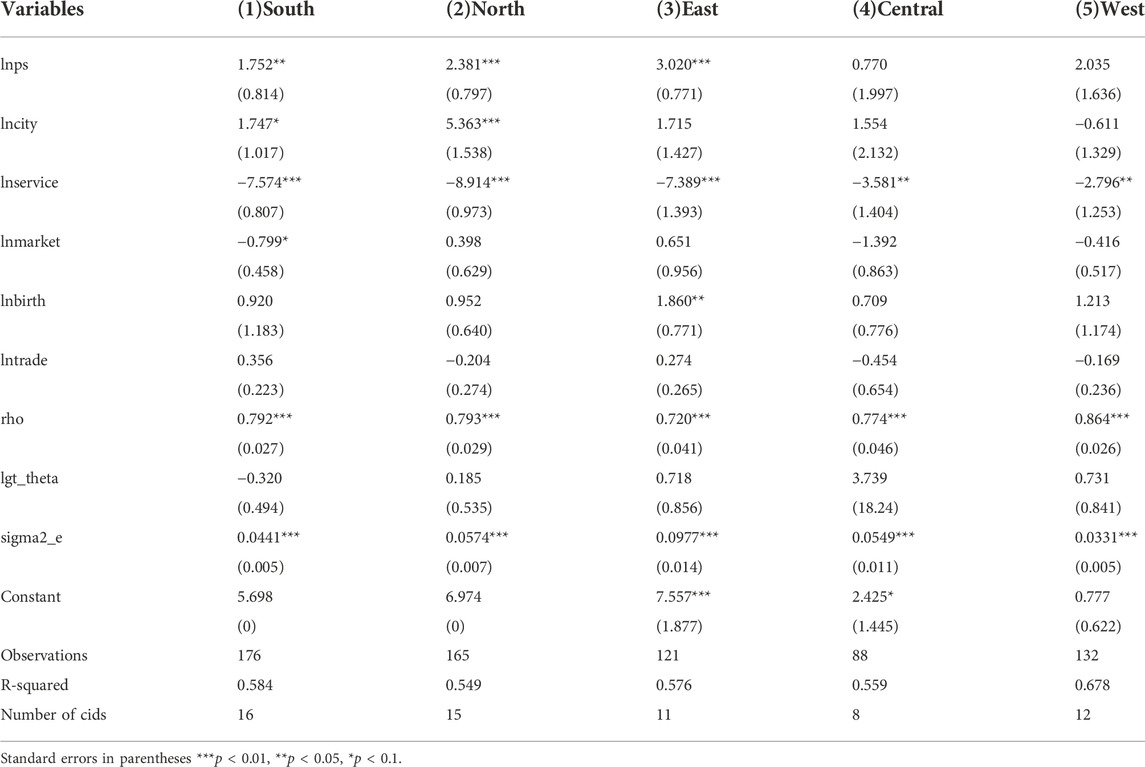
TABLE 4. Spatial econometric regression results in different regions.
From the regression results, the agglomeration level of producer services can promote the green total factor productivity of the service industry, but the promotion effect of different regions is inconsistent. From the north-south perspective, the higher the concentration level of producer services, the more significant the promotion effect on the green development of the service industry in the northern region. The transformation and upgrading of the manufacturing industry in the northern region can significantly drive the development of producer services. The rising concentration level of producer service will significantly promote the green development of the service industry. The level of urbanization plays a significant role in promoting the green development of the service industry in the northern region. The northern region can promote the green development of the service industry by improving the level of urbanization. The larger the scale of the service industry in the north, the stronger the inhibition effect on the green development of the service industry. The low-end industries with high energy consumption and high pollution account for a high proportion of the service industry in the north. The phenomenon of small and many service enterprises is obvious, causing increased environmental pollution, resource mismatch, and reducing the green total factor productivity of the service industry in the north. The level of marketization has a significant inhibitory effect on the green total factor productivity of the service industry in southern China. The reform and opening up drive the joint-stock reform of enterprises in southern China. Non-state-owned enterprises neglect environmental protection in the process of development, resulting in high resource consumption, high environmental pollution, and hindering the green development of the service industry.
From the perspective of the east, central and western regions, the concentration level of producer service plays a strong role in promoting the green development of the service industry in the eastern region, but not a strong role in the central and western regions. The development level of the manufacturing industry in the eastern region is high, which promotes development in coordination with producer service. Due to the lagging development of the secondary industry in the central and western regions, the concentration level of producer service is low. However, with the implementation of the national western development strategy and the improvement of transportation conditions such as European trains, the concentration level of producer service in the central and western regions will gradually increase. It will further promote the green development of the service industry. The inhibition effect of the service industry development scale on the eastern region is significantly higher than that in the central and western regions. The service industry development level in the eastern region is high, and the internal structure of the service industry is unreasonable, resulting in resource mismatch and low resource utilization efficiency. The promotion effect of urbanization rate on green total factor productivity of the service industry in the eastern region is significantly greater than that in the central and western regions. Due to the slow urbanization process, employment-population in the central and western regions is low, so the demand for the service industry is low. The birth rate can promote the green development of the service industry. The import and export trade has a great impact on the eastern and southern regions, which is due to the strong reform and active import and export trade, thus driving the green development of the service industry.
To test the robustness of the research results in this paper, different types of weight matrices are used as spatial matrices for the spatial autoregressive test. The test results are shown in Table 5:
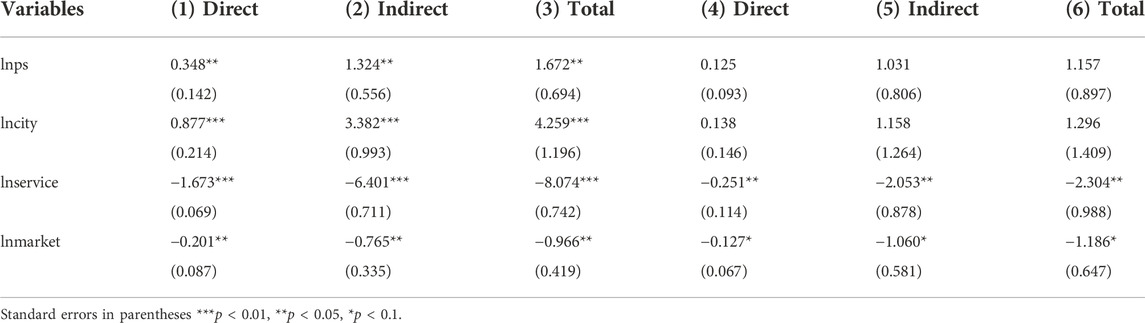
TABLE 5. Spatial econometric regression results of different weight matrices.
In Table 5, columns (1–3) are SAR regression results when the economic matrix is used as the weight matrix, and columns (4–6) are SAR regression results when the distance matrix is used as the weight matrix. The research results of this paper are robust under the economic matrix. The agglomeration level of producer service and urbanization rate will not only promote the green development of local services but also promote the green development of services in surrounding areas. The scale of service industry development and the degree of marketization have a restraining effect on the green development of local and surrounding service industries. When the distance matrix is used as the spatial weight matrix, the scale and marketization degree of the service industry have a significant inhibitory effect on the green development of the service industry. Because the distance matrix uses the large arc distance between provincial capitals to replace the distance between regions, the data in this paper is taken from provincial data. Therefore, the concentration level and urbanization rate of producer service do not significantly promote the service industry. From the regression results, it can be seen that the green development of the service industry has a significant spatial spillover effect, and the impact of various factors on the green total factor productivity of the service industry has certain robustness.
Based on environmental factors, this study discusses the green development of the service industry. The DEA Malmquist index is used to measure the green total factor productivity of the service industry in 31 provinces and regions in China. When considering environmental factors, the green total factor productivity of the service industry shows a downward trend, which verifies that the development of the service industry is not green. Ignoring environmental factors will overestimate the development of the service industry. When using social network analysis and spatial econometric regression methods to measure the green productivity of the service industry, it is found that the green development of the service industry has significant spatial network characteristics and spillover effects. The contributing factors to the green development of the service industry in different regions have different effects. The homogeneous structure of the service industry development has led to a significant number of small service enterprises. Problems such as low-level repetitive construction and resource mismatch have led to the service industry still being in extensive development mode. The proportion of high value-added and low energy consumption productive services is low, and economies of scale have not been formed. The development of the Chinese service industry is not green.
There are few existing studies on the green development of the service industry, and the conclusions are inconsistent. The existing research focuses on the measurement method of green development in the service industry. The existing research does not conduct an in-depth analysis of the development model of the Chinese service industry, nor consider the spatial spillover effect of green development of the service industry. The existing research takes foreign direct investment, urbanization rate, environmental regulation, the internal structure of the service industry, and other factors as the factors contributing to the green development of the service industry. The optimization of the internal structure of the service industry can improve the green development of the service industry, but no empirical analysis has been conducted. This paper uses the level of productive service industry agglomeration as a specific measure of the optimization of the internal structure of the service industry, and empirically obtains its positive promoting effect on the green development of the service industry. The study also obtains that the scale of the service industry development is in the extensive development model, and the green development of the service industry has a significant spatial spillover effect. The results of this study provide an accurate reference for governments at all levels to formulate strategies. This study provides a theoretical basis for the smooth realization of the dual carbon goal. To promote the green development of the service industry, this paper puts forward corresponding policy suggestions for governments from the following aspects.
First, China should improve the concentration level of producer service and optimize the internal structure of the service industry.
The producer services are mostly high value-added and low energy consumption industries. The producer services and manufacturing industries develop in a coordinated way. The local government drives the cluster of producer services by improving the transformation and upgrading of the manufacturing industry; Governments at all levels should, according to the regional characteristics, guide the professional or diversified agglomeration of local producer services in a planned way. By improving the agglomeration level of producer services, economies of scale can be formed, and transaction costs and pollution emissions can be reduced. Manufacturing and producer services can be promoted in a coordinated manner to promote the green development of the service industry and achieve low-carbon economic transformation.
Second, China should promote the digitalization of the service industry and improve the technical level of the service industry.
The Chinese service industry is on large scale, but the enterprises are many and small. The service industry is in an extensive development mode with a large scale but low quality; The repeated and homogeneous structure of local service industries is serious, leading to resource mismatch and low resource utilization efficiency; In this regard, local governments should actively introduce digital and other technical means to promote the digitalization of the service industry and improve the technical level of the service industry. Digital construction can improve the resource utilization rate of service enterprises, reduce repetitive construction and investment, and promote high-quality green development of the service industry.
Third, China should strengthen environmental regulation and give play to the spatial spillover effect of green development in the service industry.
Local governments should implement differentiated strategies for energy conservation and emission reduction. Governments at all levels should give full play to local resource advantages and regional differences in the green development of the service industry. The eastern regions should optimize the internal structure of the service industry according to local characteristics, and improve the concentration level of producer services. The central nods should actively provide knowledge and technology support for the surrounding areas, and give play the leading role of the central nodes. Provinces should form a pattern of division of labor with complementary functions, reduce pollution emissions, and give full play to their comparative advantages. Promoting the green development of the local service industry, they should also affect the green development of other areas through spatial spillover effects. The central and western regions should actively promote the development of the high-end service industry with their comparative advantages, introduce digital technology means, and promote the green development of the local service industry. Local governments at all levels should make overall plans for market efficiency and environmental protection, and give full play to the spatial network transmission characteristics of green development in the service industry. China should achieve energy conservation and emission reduction in the service industry, improve Pareto for green development, and promote low-carbon economic operations.
The original contributions presented in the study are included in the article/supplementary material, further inquiries can be directed to the corresponding author.
BC was responsible for the writing and designing of the paper, XX was responsible for the writing and submission of the paper, YZ was responsible for the modification of the paper, and JW was responsible for the data collection of the paper.
The National Social Science Foundation’s Major Program “Research on the Design and Path Selection of New and Old Kinetic Energy Conversion Mechanism” (Approval No. 18ZDA077). Shandong Social Science Planning and Research Project “Research on Enabling Effect and Improvement of Industrial Internet Platform” (Approval No. 21CGJ17). Scientific Research Planning for Higher Education “Research on the path and Countermeasures of green development of “the Belt and Road” under the goal of “double carbon” (Approval No. 22DL0301). High-level scientific research project cultivation fund project “Research on the high-quality economic development of Shandong province under the background of the digital economy” (Approval No. 2022GSPSJ07).
The authors declare that the research was conducted in the absence of any commercial or financial relationships that could be construed as a potential conflict of interest.
All claims expressed in this article are solely those of the authors and do not necessarily represent those of their affiliated organizations, or those of the publisher, the editors and the reviewers. Any product that may be evaluated in this article, or claim that may be made by its manufacturer, is not guaranteed or endorsed by the publisher.
Bai, X., and Meng, H. (2017). The service industry is greener than the manufacturing industry? Measurement and decomposition based on energy efficiency. Industrial Econ. Res. 03, 1–14. doi:10.13269/j.cnki.ier.2017.03.001
Barro, R. J., and Lee, J. W. (2013). A new data set of educational attainment in the world, 1950-2010. J. Dev. Econ. 104, 184–198. doi:10.1016/j.jdeveco.2012.10.001
Charnes, A., Cooper, W. W., and Rhodes, E. (1978). Measuring the efficiency of decision-making units. Eur. J. operational Res. 2 (06), 429–444. doi:10.1016/0377-2217(78)90138-8
Chen, L. (2022). Research on the optimization effect of industrial structure of producer services spatial correlation: From the perspective of social network analysis. Econ. Rev. (05), 147–164. doi:10.19361/j.er.2022.05.10
Chen, Y. (2018). Spillover effects of manufacturing agglomeration on urban green total factor productivity: From the perspective of city level. Econ. finance trade 29 (01), 1–15. doi:10.19337/j.cnki.34-1093/f.2018.01.001
Coelli, T. J., Rao, D., O’Donnell, C. J., and Battese, G. (2005). An introduction to efficiency and productivity analysis. Second Edition. New York: Springer Science &Business Media Inc.
Cui, M., and Zhao, Z. H. (2018). Research on TFP heterogeneity and its effect on regional service industry development gap, quantitative economy. Technol. Econ. Res. 35 (07), 59–78. doi:10.13653/j.cnki.jqte.2018.07.004
Denision, E. F. (1962). The source of economic growth in the U. S. And the alternatives before us. New York: Committee for Economic Development. doi:10.1017/S0022050700104206
Di Berardino, C., and Onesti, G. (2021). Explaining deindustrialisation from a vertical perspective: Industrial linkages, producer services, and international trade. Econ. Innovation New Technol. 30 (7), 685–706. doi:10.1080/10438599.2020.1763550
Ding, R., and Ni, P. (2015). Regional spatial correlation and spillover effects of urban housing price fluctuations in China: A study based on spatial panel data of 285 cities in China from 2005 to 2012. Econ. finance trade (06), 136–150. doi:10.19795/j.cnki.cn11-1166/f.2015.06.012
Drucker, J., and Feser, E. (2012). Regional industrial structure and agglomeration economies: An analysis of productivity in three manufacturing industries. Regional Sci. urban Econ. 42 (112), 1–14. doi:10.1016/j.regsciurbeco.2011.04.006
Elhorst, J. P. (2012). Matlab software for spatial panels. Int. Regional Sci. Rev. 37 (3), 389–405. doi:10.1177/0160017612452429
Evangelinos, C. (2012). Baumol’s cost disease in the local transit sector: A comparative analysis for Germany and the USA. Int. J. Transp. Econ. 39 (1), 83–102.
Fare, R., Grosskopf, S., and Pasurka, C. A. (2007). Pollution abatement activities and traditional productivity. Ecol. Econ. 62 (34), 673–682. doi:10.1016/j.ecolecon.2006.08.014
Farrell, M. J. (1957). The measurement of productive efficiency. J. R. Stat. Soc. Ser. A 120 (3), 253–290. doi:10.2307/2343100
Francois, J. F. (1990). Producer services, scale, and the division of labor. Oxf. Econ. Pap. 42 (4), 715–729. doi:10.1093/oxfordjournals.oep.a041973
Glaeser, E. L., Kallal, H. D., Scheinkman, J. A., and Shleifer, A. (1992). Growth in cities. J. Political Econ. 100 (6), 1126–1152. doi:10.1086/261856
Gu, N. (2010). The influence and channel of producer Services on industrial Profitability: An empirical study based on urban panel data and SFA model. Chin. Ind. Econ. (05), 48–58. doi:10.19581/j.cnki.ciejournal.2010.05.006
Hailu, A., and Veeman, T. S. (2000). Environmentally sensitive productivity analysis of the Canadian pulp and paper industry, 1959-1994: An input distance function approach. J. Environ. Econ. Manag. 40 (3), 251–274. doi:10.1006/jeem.2000.1124
Han, F., Wang, Z., and Lai, M. (2015). Measuring the agglomeration effect of China's urban productive services. Urban Problems (09), 57–67. doi:10.13239/j.bjsshkxy.cswt.150909
Han, F., and Xie, R. (2017). Has the productive service industry clustered to reduce carbon emissions? spatial econometric analysis of China's urban panel data at and above the prefecture level. Res. Quantitative Econ. Tech. Econ. 34 (03), 40–58. doi:10.13653/j.cnki.jqte.2017.03.003
Han, F., Yan, W., and Wang, Y. (2021a). Agglomeration of producer services and upgrading of urban environmental quality: A study on land market regulation effect. Stat. Stud. 38 (05), 42–54. doi:10.19343/j.cnki.11-1302/c.2021.05.004
Han, F., Yu, Y., and Xie, R. (2021b). How does land resource mismatch affect haze pollution? Spatial econometric analysis based on land market transaction prices and PM 2.5 data. Econ. Sci. (04), 68–83.
Hoekman, J., Frenken, K., and Vanoort, F. (2009). The geography of collaborative knowledge production in europe. Ann. Reg. Sci. 43 (3), 721–738. doi:10.1007/s00168-008-0252-9
Huang, F., and Guo, W. (2020). Agglomeration of producer services and economic growth efficiency of Yangtze River Delta urban agglomeration from the perspective of spatial spillover. Stat. Stud. 37 (07), 66–79. doi:10.19343/j.cnki.11-1302/c.2020.07.006
Huang, J. (2018). Spatial connected network structure of China's energy and environmental efficiency and its influencing factors. Resour. Sci. 40 (04), 759–772.
Hulten, C. R. (2000). Total factor productivity: A short biography. Massachusetts, United States: National bureau od economic research. NBER Working Paper. No. w7471Avilable at: https://ssrn.com/abstract=213430.
Ke, S., He, M., and Yuan, C. (2014). Synergy and Co-agglomeration of producer services and manufacturing: A panel data analysis of Chinese cities. Reg. Stud. 48 (11), 1829–1841. doi:10.1080/00343404.2012.756580
Keeble, D., and Nachum, L. (2002). Why do business service firms cluster? Small consultancies, clustering, and decentralization in london and southern england. Trans. Inst. Br. Geogr. 27 (1), 67–90. doi:10.1111/1475-5661.00042
Kendrick, J. W. (1961). “Productivity changes in the economy. NBER chapters,” in Productivity trends in the United States (Massachusetts, United States: National bureau od economic research).
Krugman, P. (1991). Increasing returns and economic geography. J. Political Econ. 99 (3), 483–499. doi:10.1086/261763
Lanaspa, L., Sanz, F., and Vera, M. (2016). The (strong) interdependence between intermediate producer services’ attributes and manufacturing location. Econ. Model. 57, 1–12. doi:10.1016/j.econmod.2016.04.010
Last, A. K., and Wetzel, H. (2011). Baumol’s cost disease, efficiency, and productivity in the performing arts: An analysis of German public theaters. J. Cult. Econ. 35 (3), 185–201. doi:10.1007/s10824-011-9143-5
Lee, J. W., and Hong, K. (2012). Economic growth in asia: Determinants and prospects. Jpn. World Econ. 24 (2), 101–113. doi:10.1016/j.japwor.2012.01.005
Li, B., Wu, P., and Liu, Y. (2010). Transportation infrastructure and the increase in TFP in China: Spatial econometric analysis provincial panel data. China Ind. Econ. 03, 54–64. doi:10.19581/j.cnki.ciejournal.2010.03.005
Li, L., and Niu, T. (2017). Structural evolution of regional innovation output spatial association network based on SNA. Economic geography 37 (09), 19–25. doi:10.15957/j.cnki.jjdl.2017.09.003
Li, Y., and Zhang, P. (2013). Does industrial agglomeration aggravate China's environmental pollution - empirical evidence from China's provincial perspective. China: Journal of Huazhong University of Science and Technology (Social Science Edition, 97–106. doi:10.19648/j.cnki.jhustss1980.2013.05.017
Liang, H, Y. (2018). Distribution dynamics, differential decomposition and convergence of productive services in Chinese urban agglomerations [J]. Res. Quantitative Tech. Econ. 2018 (12), 40–60. doi:10.13653/j.cnki.jqte.2018.12.003
Lin, B., and Tan, R. (2019). Chinese economic agglomeration and green economic efficiency. Econ. Res. 54 (02), 119–132.
Liu, J., Li, L., and Wang, Z. (2010). Impact of industrial agglomeration on regional innovation and its industrial difference. Sci. Res. Manag. 31 (6), 191–198. doi:10.19571/j.cnki.1000-2995.2010.06.025
Liu, J. (2004). On the study of social network models [J]. Sociol. Res. 2004 (01), 1–12. doi:10.19934/j.cnki.shxyj.2004.01.001
Liu, Y. B., Yang, L. G., and Feng, Y. D. (2018). Spatial spillover and threshold characteristics of production cluster emission reduction effect. Math. Statistics Manag. 37 (02), 224–234. doi:10.13860/j.cnki.sltj.20171131-003
Liu, Y., Xia, J. C., and Li, Y. (2017). The productive service industry gathers in the upgrading of the manufacturing industry [J]. Chin. Ind. Econ. 2017 (07), 24–42. doi:10.19581/j.cnki.ciejournal.2017.07.002
Lu, W., Chang, Y., and Wang, Y. (2015). Outward foreign direct investment, R&D spillover, and the technical progress in China. Sci. Res. Manag. 36 (03), 38–48. doi:10.19571/j.cnki.1000-2995.2015.03.005
Maroto Sanchez, A., and Cuadrado Roura, J. R. (2009). Is the growth of services an obstacle to productivity growth? A comparative analysis. Struct. change Econ. Dyn. 20 (04), 254–265. doi:10.1016/j.strueco.2009.09.002
Nanere, M., Fraser, I., Quazi, A., and D’Souza, C. (2007). Environmentally adjusted productivity measurement: An Australian case study. J. Environ. Manag. 85 (2), 350–362. doi:10.1016/j.jenvman.2006.10.004
Pang, R., and Wang, L. (2016). Is the development of the service industry green? Based on the total factor efficiency analysis of service industry environment. Industrial Econ. Res. (04), 18–28. doi:10.13269/j.cnki.ier.2016.04.003
Shen, K., and Geng, Q. (2001). Foreign direct investment, technical overflow, and endogenous economic growth: An econometric test and empirical analysis of Chinese data. Soc. Sci. China (5), 82–93.
Shen, N. (2013). Local knowledge spillovers and productive service industry clustering: Based on city data spatial econometrics. Sci. Sci. Manag. 34 (5), 61–69.
Squicciarini, M. P., and Voigtländer, N. (2015). Human capital and industrialization: Evidence from the age of enlightenment. Q. J. Econ. 130 (4), 1825–1883. doi:10.1093/qje/qjv025
Su, Z. F., Hu, R. D., and Lin, S. Q. (2009). Spatial econometric analysis of the kuznets relationship between environmental quality and economic growth. Geogr. Res. 28 (02), 303–310.
Wang, S. l., and Hu, Z. B. (2012). A survey of productivity changes and heterogeneity in China's service industries. Econ. Res. (04), 15–27.
Wang, S. l., Wang, S. Q., and Teng, Z. W. (2016). Total factor productivity growth in China's service industry under environmental constraints [J]. Financial Res. 05, 123–134. doi:10.16538/j.cnki.jfe.2016.05.011
Wang, S., and Teng, Z. (2015). FDI inflow, factor reallocation effect and Service Productivity in China: An empirical study based on different industries. J. Int. Trade (04), 167–176. doi:10.13510/j.cnki.jit.2015.04.017
Wang, S., Teng, Z., and Liu, J. (2015). Differential analysis of service productivity changes in China: From the perspective of region and industry. Econ. Res. 50 (08), 73–84.
Wu, T. (2001). Try to discuss the difference between North and South Chinese economy grows. Geogr. Res. (02), 238–246.
Xi, Q. M., Chen, X., and Li, G, P. (2015). Research on the mode selection of China's urban productive service industry - guided by industrial efficiency improvement. Chin. Ind. Econ. (02), 18–30. doi:10.19581/j.cnki.ciejournal.2015.02.003
Xuan, Y., and Yu, Y. (2017). Research on the improvement of total factor productivity of manufacturing enterprises by productive service industry clustering - evidence from 230 urban microenterprises. Res. Quantitative Econ. Tech. Econ. 34 (02), 89–104. doi:10.13653/j.cnki.jqte.2017.02.006
Xuan, Y., and Yu, Y. Z. (2014). The impact of the hierarchical division of productive services on the improvement of manufacturing efficiency - based on the experience of 38 cities in the yangtze river delta. Industrial Econ. Res. (03), 1–10. doi:10.13269/j.cnki.ier.2014.03.001
Yang, C., Yuan, X. N., Shao, Z. Y., Wang, H., Zan, S. T., Zhu, M., et al. (2019). Selenium (Se) does not reduce cadmium (Cd) uptake and translocation in rice (oryza sativa L.) in naturally occurred Se-rich paddy fields with a high geological background of Cd. Bull. Environ. Contam. Toxicol. 103 (05), 127–132. doi:10.1007/s00128-019-02551-y
Yang, R. F. (2015). Can industrial agglomeration improve China's environmental pollution, China's population, resources and environment. J. Quant. Econom. 32 (12), 23–29.
Yang, T. G., and Wu, K. Y. (2017). Change of total factor productivity in the service industry and its driving factors - research based on segmented industries [J]. Stat. Res. 34 (06), 69–78. doi:10.19343/j.cnki.11-1302/c.2017.06.007
Yang, X., Li, X., and Zhou, D. (2015). Differences and convergence of carbon productivity in China's manufacturing industry. Quantitative Tech. Econ. 32 (12), 3–20. doi:10.13653/j.cnki.jqte.2015.12.001
Yuan, Y., and Gao, K. (2020). Industrial agglomeration, spatial knowledge spillover, and regional innovation efficiency. Stud. Sci. Sci. 11, 1966–1975. doi:10.16192/j.cnki.1003-2053.2020.11.006
Zhang, Y., Dong, Q., and Ni, M. (2018). Analysis of the Development of service Industry and "Structural Deceleration" - on the construction of a modern economic system with high-quality development. Economic Perspectives 02, 23–35.
Keywords: green total factor productivity, network association, spillover effect, location entropy, green development
Citation: Chen B, Xu X, Zhang Y and Wang J (2022) The temporal and spatial patterns and contributing factors of green development in the Chinese service industry. Front. Environ. Sci. 10:1049827. doi: 10.3389/fenvs.2022.1049827
Received: 21 September 2022; Accepted: 07 November 2022;
Published: 18 November 2022.
Edited by:
Haider Mahmood, Prince Sattam Bin Abdulaziz University, Saudi ArabiaReviewed by:
Kai Liu, Shandong Normal University, ChinaCopyright © 2022 Chen, Xu, Zhang and Wang. This is an open-access article distributed under the terms of the Creative Commons Attribution License (CC BY). The use, distribution or reproduction in other forums is permitted, provided the original author(s) and the copyright owner(s) are credited and that the original publication in this journal is cited, in accordance with accepted academic practice. No use, distribution or reproduction is permitted which does not comply with these terms.
*Correspondence: Xiaotong Xu, eHV4aWFvdG9uZzg4QDEyNi5jb20=
Disclaimer: All claims expressed in this article are solely those of the authors and do not necessarily represent those of their affiliated organizations, or those of the publisher, the editors and the reviewers. Any product that may be evaluated in this article or claim that may be made by its manufacturer is not guaranteed or endorsed by the publisher.
Research integrity at Frontiers
Learn more about the work of our research integrity team to safeguard the quality of each article we publish.