
95% of researchers rate our articles as excellent or good
Learn more about the work of our research integrity team to safeguard the quality of each article we publish.
Find out more
ORIGINAL RESEARCH article
Front. Environ. Sci. , 16 November 2022
Sec. Atmosphere and Climate
Volume 10 - 2022 | https://doi.org/10.3389/fenvs.2022.1047818
This article is part of the Research Topic Impact of Climate Change on the Human Living Environment View all 24 articles
 Weikang Zhao
 Changqing Jing*
In recent years, drought frequency has gradually increased, which has reduced vegetation growth and development. The response of grassland to meteorological drought is more sensitive than other vegetation types and can differ substantially among grassland types. In this study, the response of vegetation change to meteorological drought at different time scales was evaluated using data from the normalized difference vegetation index (NDVI) and the standardized precipitation evapotranspiration index (SPEI) to analyze the spatial and temporal variation trends and correlations of the NDVI and SPEI of three grassland types in Xinjiang from 1982 to 2015. Over this 34-year period, the NDVI of meadow, steppe, and desert grassland in Xinjiang increased, with growth rates of 0.002, 0.002, and 0.0003 per decade, respectively, although the increase was insignificant (p > 0.05). The most obvious vegetation improvement areas of the three grassland types were mainly distributed in the Tianshan Mountains. The SPEI-12 of meadow, steppe, and desert grassland in Xinjiang indicated an extremely significant drying trend (p < 0.01), with change rates of −0.31, −0.38, and −0.34 per decade, respectively. The overall pattern was the gradual drying from the northwest to southeast, and the degree of aridification was the largest in eastern Xinjiang. On the annual scale, the correlation between the NDVI and SPEI-12 of the three grassland types was significantly different between northern and southern Xinjiang. The degree to which the vegetation of the three grassland types responded to drought was higher in northern Xinjiang than in southern Xinjiang, and most responses were significant. On the monthly scale, the response of meadow to the SPEI-12 was the highest in autumn (September) (r = 0.53; p < 0.05), the response of steppe to the SPEI-3 was the highest in summer (August) (r = 0.49; p < 0.05), and the response of desert grassland to the SPEI-12 was the highest in summer (June) (r = 0.44; p < 0.05). The results can provide a scientific basis for natural grassland drought response, ecological environmental improvement, and disaster prevention and mitigation.
Drought is one of the most serious meteorological disasters, having the characteristics of high frequency, long duration, and large scope (Grayson, 2013). According to the fifth assessment report of the Intergovernmental Panel on Climate Change (IPCC), as the global average temperature continues to rise, the possibility of global drought events increases (IPCC, 2013). The regions most affected by climate change are the middle and high latitudes (Carrer et al., 2019). For example, the rate of temperature increase in the arid area of northwest China is 2.62 times that of the average global rate of the temperature increase (Yao et al., 2013). Because climate change is also the driving factor of vegetation change (Zhang et al., 2011), vegetation is an indicator of response to climate change and a feedback indicator of the impact of drought (Wang et al., 2012). Xinjiang is located in the hinterland of Central Asia; grassland is the most widely distributed vegetation type in Xinjiang (Zhao et al., 2020), which is of great significance in maintaining the ecological environment balance and climate regulation (Zhou et al., 2017). Drought may have many negative impacts on vegetation, such as hindering regreening and vegetation growth and development, which leads to a reduced vegetation coverage and carbon sink capacity. These changes affect the sustainable development of terrestrial ecosystems and the economy. Some studies have shown that the grassland is more sensitive to drought than other vegetation types (Chen et al., 2016; Kong et al., 2016), and the resistance and resilience of different grassland types to climatic drought differ substantially. Therefore, exploring the response of different grassland types to drought is of great significance for the protection and rational use of grassland resources (Liu et al., 2019a).
At present, in the study of drought characteristics and change trends (Su and Li, 2012), the most widely used is the standardized precipitation evapotranspiration index (SPEI) proposed by Vicente Serrano. The SPEI not only considers precipitation and evapotranspiration factors but also combines the advantages of the standardized precipitation index (SPI) and the Palmer drought severity index (PDSI) (Wang et al., 2014). Many scholars use the normalized difference vegetation index (NDVI) to research the response of vegetation to drought at regional scales (Luo et al., 2020), and the NDVI is the most effective and extensive index to reflect vegetation coverage and growth (Liu et al., 2019b). In recent years, there have been studies on the spatial and temporal dynamics of the NDVI in grasslands in China, different vegetation types in northern China, and the response of vegetation changes in northwest China to multi-scale drought (Xu et al., 2018; Zhang et al., 2020; Liu et al., 2022). The NDVI and SPEI have different degrees of correlation due to different vegetation types (Rajpoot and Kumar, 2019; Wang et al., 2020; Qi et al., 2021), and in arid and semi-arid areas, the two show a strong positive correlation (Wang et al., 2016). However, the larger SPEI value is not more conducive to the growth and development of vegetation (Luo et al., 2020). Some studies have also found that in forest areas with abundant precipitation in China, the NDVI of vegetation is negatively correlated with the SPEI, indicating that areas with abundant water are less affected by drought (Kong et al., 2016). The correlation between the NDVI and SPEI at different time scales is also different, and the response between the seasons changes (Liu et al., 2015). In one study, the correlation between the vegetation NDVI and SPEI in the Mediterranean Basin gradually changed from a negative to a positive relationship, and the months corresponding to the correlation coefficients of the SPEI and NDVI between seasons were also very different (Gouveia et al., 2017). Some scholars have also studied the characteristics of temporal and spatial changes in the vegetation in Ningxia and their coupling relationship with the arid climate. They found that the vegetation growth in Ningxia is significantly affected by spring and summer precipitations, while higher summer temperatures further inhibit vegetation growth (Zong and Wang, 2014). Therefore, when studying the response of vegetation to drought, it is necessary to consider the vegetation type and season.
Xinjiang, the location for this study, is in the middle latitudes and is a typical arid and semi-arid region. With the implementation of the national “One Belt, One Road” initiative, Xinjiang has become the core area of the “Silk Road Economic Belt.” Because of the region’s economic importance, changing drought conditions have received extensive attention (Xie et al., 2017; Hu et al., 2019a). The ecological environment in Xinjiang is fragile and sensitive to climate change (Hu et al., 2014; Hu et al., 2017). The shortage of water resources caused by drought is the key factor that affects the ecological balance of the region and restricts the sustainable development of grassland resources. Since 1980, the temperature and precipitation in Xinjiang have trended upward, and the climate in Xinjiang has gradually changed from warm–dry to warm–wet (Shi et al., 2007; Hu et al., 2016). The climate transition in Xinjiang has significantly impacted the local ecosystem and water cycle. Most studies have focused on the spatial and temporal variations of the NDVI in Xinjiang and its relationship with climatic factors (temperature and precipitation), but there is relatively little research on the response of the NDVI in Xinjiang natural grassland to multi-scale drought. In addition, how different grassland types in Xinjiang respond to multi-scale meteorological drought is still unclear (Tao et al., 2014; Luo et al., 2016), and further research is still needed.
Therefore, the following main issues were studied: 1) what were the spatial and temporal characteristics of vegetation and meteorological drought in different grassland types? 2) What was the response relationship between the vegetation of different grassland types and meteorological drought? 3) What was the adaptive capacity of different grassland types to drought at different time scales?
The study area is in the Xinjiang Uygur Autonomous Region (73°32'∼96°21 ′E, 34°22'∼49°33 ′N) (Figure 1). Xinjiang is characterized by “three mountains and two basins:” the Altai Mountains in the north, the Kunlun Mountains in the south, and the Tianshan Mountains in the middle, and the Junggar Basin and the Tarim Basin. Rich and diverse grassland types are formed due to the complex and diverse landforms in the region. Xinjiang is mainly divided into three grassland types: meadow, steppe, and desert grassland (Zhao et al., 2020). Xinjiang has a typical temperate continental arid climate. The average annual temperature is 4–8°C in northern Xinjiang and 10–13°C in southern Xinjiang. The annual precipitation is 100–200 mm in northern Xinjiang and 80–100 mm in southern Xinjiang. The annual evaporation is 1,500–2,300 mm in northern Xinjiang and 2,100–3,400 mm in southern Xinjiang. Xinjiang has a total area of 166.49 × 10⁴ km2, of which 5,725.88×104 hm2 is natural grassland, particularly distributed in mountainous areas, basin margins, and riverbanks. The available grassland area is 4,800.68×104 hm2, the third highest grassland area in China. Meadow, steppe, and desert grassland account for 23.6%, 29%, and 46.9% of the total grassland area and 25.2%, 31.6%, and 42.6% of the available grassland area, respectively. The ecological environment of natural grassland in Xinjiang is affected by climate and terrain and is extremely fragile.
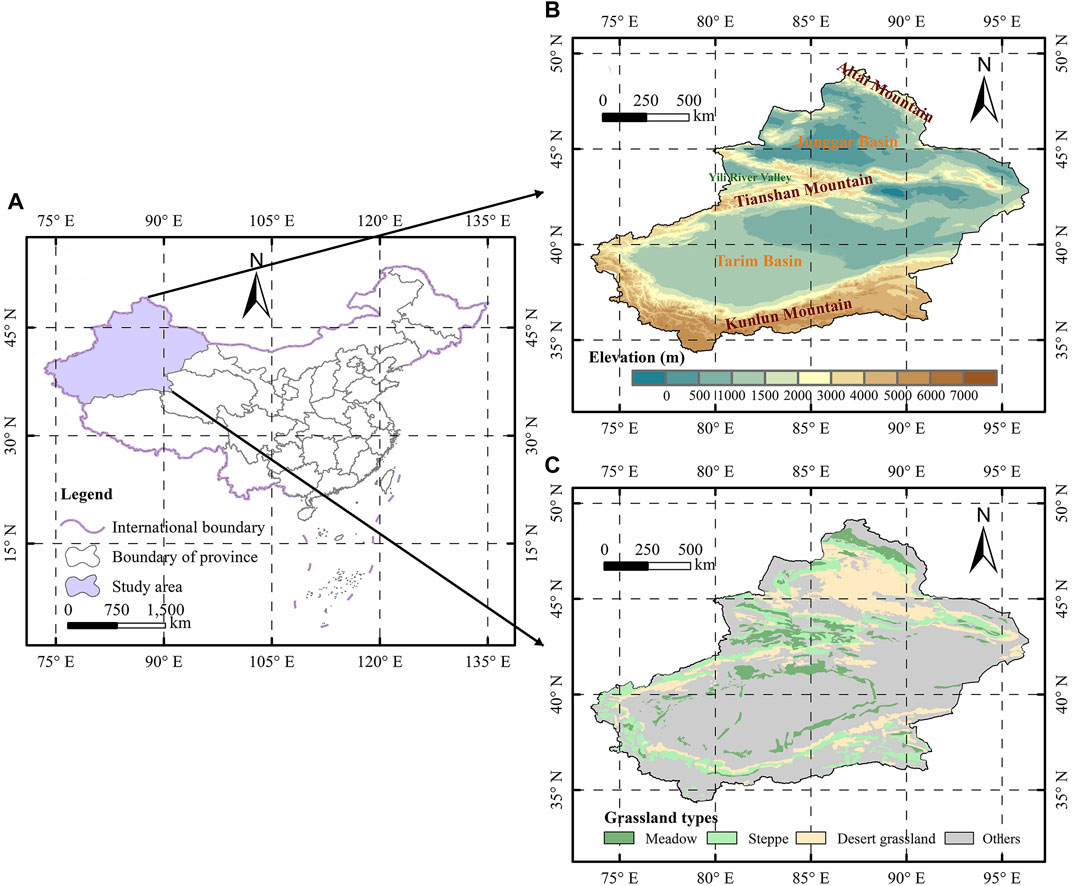
FIGURE 1. Study area information. (A) Location of the study area. (B) Topography. (C) Grassland types.
The NDVI data come from the dataset released by the Global Inventory Monitoring and Modeling Systems (GIMMS) of NASA (https://ecocast.arc.nasa.gov). The time resolution is 15 days, the spatial resolution is 1/12°, and the time span is from January 1982 to December 2015. The data were preprocessed by geometric correction and atmospheric correction to eliminate the influence of volcanic eruption, solar altitude angle, and sensor sensitivity changes with factors such as time. The maximum value composite (MVC) was used to obtain monthly data, and then, annual data and growing season data were obtained. Seasons were classified into the growing season (April–October), spring (April–May), summer (June–August), and autumn (September–October) (Tan et al., 2015). The digital elevation model (DEM) data were obtained from the Data Center for Resources and Environmental Sciences of the Chinese Academy of Sciences (http://www.resdc.cn), with a spatial resolution of 250 m.
The SPEI index was derived from SPEI base v. 2.6 products (https://digital.csic.es/handle/10261/202305) with a time resolution of January, a spatial resolution of 0.5°, and a time span of 1901–2015, including the scale of 1–48 months. In this study, the data from January 1982 to December 2015 were selected.
The Penman–Monteith method recommended by the Food and Agriculture Organization (FAO) of the United Nations was adopted to calculate the potential evapotranspiration (
where
The difference between evapotranspiration and monthly precipitation (
where
To normalize the difference between precipitation and potential evapotranspiration, the log-logistic probability distribution function was used, and the probability density was standardized to calculate the corresponding
The formula for the log-logistic probability distribution function is expressed as follows:
where
The standardized values of
If
If
where
For the climate drought grade (GB/T20481-2006) (General Administration of Quality Supervision, 2006), the SPEI value was divided into grade 8. The dry and wet classification of the SPEI is shown in Table 1.

TABLE 1. Wet and dry classification based on the standardized precipitation evapotranspiration index (SPEI).
Based on unary linear fitting regression analysis, the spatio-temporal change rates of the NDVI and SPEI at a pixel scale were studied (Gang et al., 2018). The calculation formula is expressed as follows:
where
The Mann–Kendall (M–K) test is a non-parametric statistical test that requires the climate series to be stable and randomly independent (Yue et al., 2002; Fensholt et al., 2013). For time series variables
Assuming random independence of time series, the defined statistics are as follows:
where
In the aforementioned formulas,
If the
The spatial analysis of each pixel was conducted to obtain the correlation coefficient between the NDVI and SPEI (Hu et al., 2019b; Zhou et al., 2021). The formula is expressed as follows:
where
According to the interannual variation trend of the NDVI during the study period in Xinjiang, the average NDVI value was the highest for meadow (0.2962), the second highest for steppe (0.2617), and the lowest for desert grassland (0.1833) (Figure 2). Moreover, although the NDVI of meadow, grassland, and desert grassland increased, with a growth rate of 0.002, 0.002, and 0.0003 per decade, respectively, the increase was insignificant (p > 0.05). The M–K test showed that the NDVI of meadow had a significant increasing trend from 1998 to 2005 (p < 0.05) (Figure 2A). As shown in Figure 2B, the NDVI of steppe showed a significant increasing trend from 1999 to 2003 (p < 0.05), while the NDVI of desert grassland showed an increasing trend that was insignificant during the entire study period (Figure 2C). In addition, the average NDVI value of meadow and steppe mutated after 1983 and that of the desert grassland mutated after 1982.
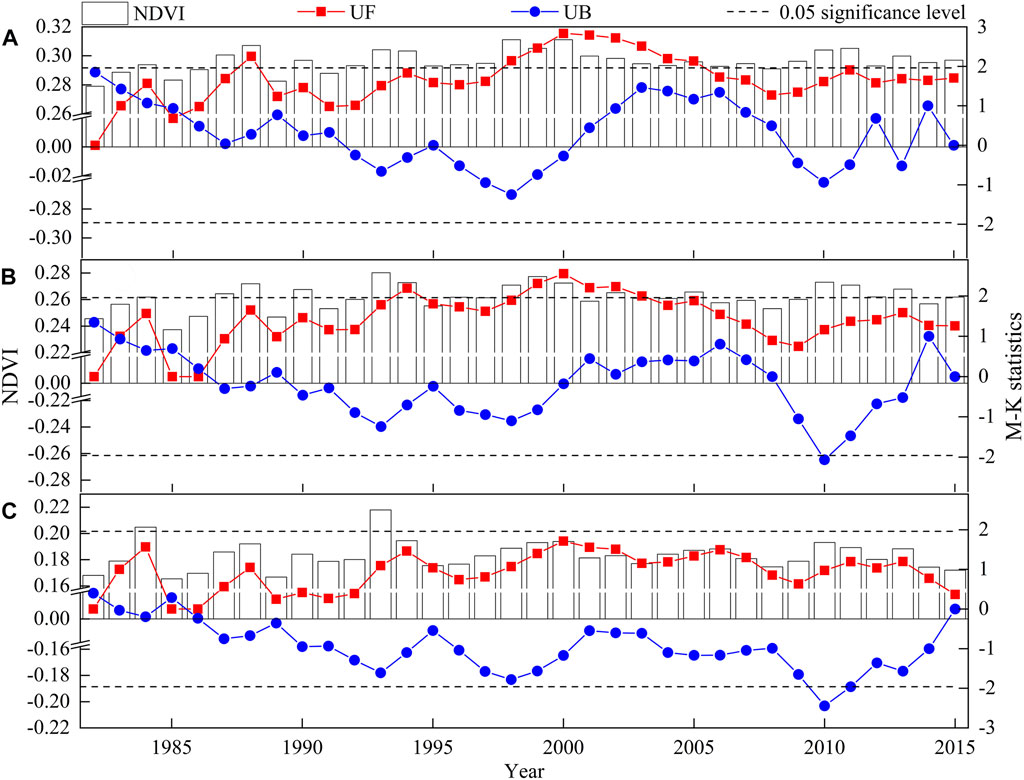
FIGURE 2. Interannual variation trend and the Mann–Kendall test of the NDVI of meadow (A), steppe (B), and desert grassland (C) in Xinjiang. (Note: if the UF value is greater than 0, it indicates that the NDVI sequence has an upward trend; otherwise, it has a downward trend. When UF exceeds the critical line, it indicates that the trend of the sequential NDVI has a significant increase or decrease. When UF and UB intersect at the critical boundary, the point at which the two curves intersect is the point where the mutation begins. The critical line is the 0.05 significant level.)
As shown in the spatial distribution of the meadow NDVI (Figure 3A), the areas where the meadow NDVI averaged greater than 0.4 were mainly distributed in the Yili River Valley, some mountainous areas of the Tianshan Mountains, and some mountainous areas of the Altai Mountains, accounting for about 29.1% of the total meadow area. The vegetation coverage at the margin of the Tarim Basin was extremely low. The average NDVI value in the Yili River Valley and the Tianshan Mountains was generally greater than 0.4 (Figure 3B); the valley and mountains belonged to the high-value NDVI steppe area, accounting for 23.1% of the total steppe area. However, the Pamir Plateau, the Kunlun Mountains, and the Altai Mountains had a poor vegetation coverage and belonged to the low-value steppe NDVI area. Desert grassland was mainly in the Junggar Basin and some mountainous areas of the Tianshan Mountains and the Kunlun Mountains. In terms of spatial distribution, the desert grassland was concentrated in northern Xinjiang (Figure 3C), but it covered a small area. In southern Xinjiang, the desert grassland was scattered, but it covered a large area. From the perspective of spatial change (Figures 3D–F), the areas with an NDVI change rate greater than zero accounted for 58.4%, 63.6%, and 52.9% of the total area of meadow, steppe, and desert grassland, respectively. The areas with an extremely significant increase and significant increase in the meadow NDVI were mainly located in some mountainous areas of the Tianshan Mountains and the southwest margin of the Tarim Basin, accounting for 33.1% of the total meadow area (Figure 3G). The areas with an extremely significant increase and significant increase in the steppe NDVI accounted for 30.2% of the total steppe area and were mainly distributed in some mountainous areas of the Altai Mountains, the Tianshan Mountains, and the Kunlun Mountains (Figure 3H). The areas with extremely significant increase and significant increase in the desert grassland NDVI accounted for 24.9% of the total desert grassland area and mainly occurred in some mountainous areas of the Tianshan Mountains, some mountainous areas of the Kunlun Mountains, and the northern and southern margins of the Junggar Basin (Figure 3I).
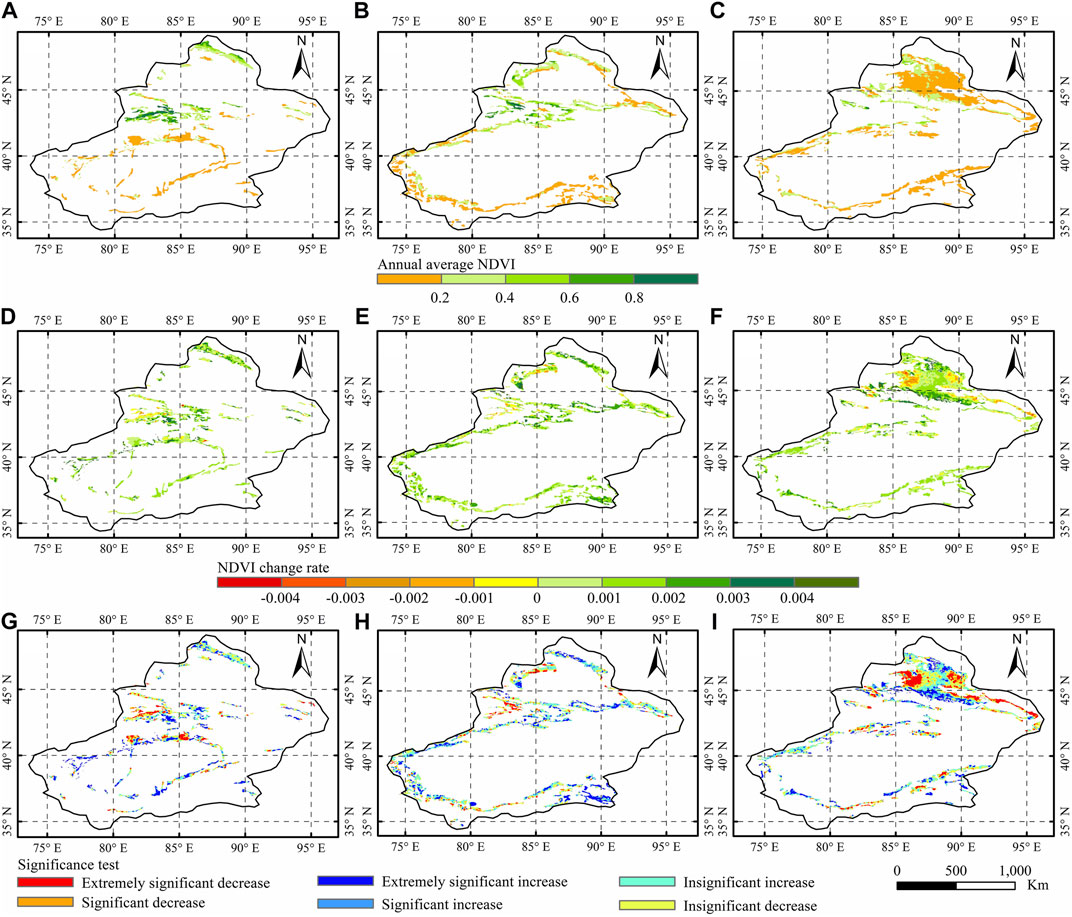
FIGURE 3. Spatial distribution pattern of the annual average NDVI and change rate and significance test of meadow, steppe, and desert grassland in Xinjiang. [Annual average NDVI of meadow (A), steppe (B), and desert grassland (C) in Xinjiang; the NDVI change rate of meadow (D), steppe (E), and desert grassland (F) in Xinjiang; and the significance test of meadow (G), steppe (H), and desert grassland (I) in Xinjiang.]
The change rules and distribution of the SPEI at different time scales were relatively consistent. Taking the change trend of the SPEI-12 as an example (Figure 4), the average value of the SPEI-12 during the study period was as follows: steppe (0.0043) > desert grassland (−0.0580) > meadow (−0.0932). The SPEI-12 of meadow, steppe, and desert grassland all showed an extremely significant drying trend (p < 0.01), and its growth rate per decade was −0.31, −0.38, and −0.34, respectively. During the 34 years of the study period, SPEI-12 of the three grassland types reached the maximum value in 1988, the wettest year, and the minimum value in 2008, the driest year. According to the M–K test, the SPEI-12 of the three grassland types showed a significant drying trend after 2009 (p < 0.05) (Figures 4A–C). In addition, the average SPEI-12 value of meadow and steppe indicated a sudden change in the drought trend after 2001, and the regional climate changed from drought to wetness. However, the regional climate of meadow and steppe reverted from wetness to drought in 2004 and 2005, respectively. The average SPEI-12 value of desert grassland showed a sudden change in the drought trend after 2004, and the regional climate changed from wetness to drought.
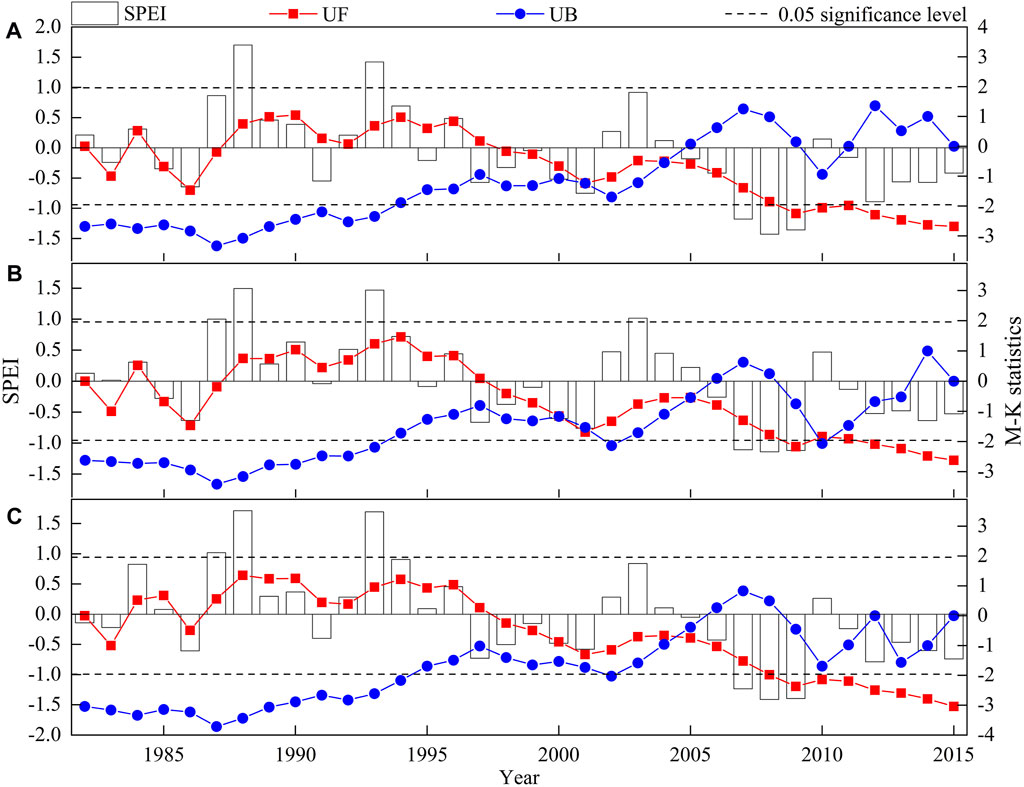
FIGURE 4. Interannual variation trend and Mann–Kendall test of the SPEI-12 of meadow (A), steppe (B), and desert grassland (C) in Xinjiang. (Note: if the UF value is greater than 0, it indicates that the SPEI sequence has an upward trend; otherwise, it has a downward trend. When UF exceeds the critical line, it indicates that the trend of the sequential SPEI has a significant increase or decrease. When UF and UB intersect at the critical boundary, the point at which the two curves intersect is the point where the mutation begins. The critical line is the 0.05 significant level.)
As shown in the spatial distribution of the meadow SPEI-12 (Figure 5A), the areas where the average value of the meadow SPEI-12 was greater than 0.2 were mainly distributed in some mountainous areas of the Tianshan Mountains and the Altai Mountains. The eastern margin of the Tarim Basin had the strongest degree of aridification. In the steppe area (Figure 5B), the average value of the SPEI-12 in some mountainous areas of the Tianshan Mountains and the northern margin of the Junggar Basin was generally greater than 0.2, while the degree of aridification was strong in some mountainous areas of the Kunlun Mountains and the northern margin of the Hami Basin. In the desert grassland area (Figure 5C), some mountainous areas of the Tianshan Mountains and the Kunlun Mountains were relatively dry, and the average of the SPEI-12 was generally less than 0.2. The meadow, steppe, and desert grassland all showed a trend of drying gradually from the northwest to southeast, especially in the eastern part of Xinjiang. From the perspective of spatial change (Figures 5D–F), the areas with an SPEI-12 change rate of less than zero accounted for 98.1%, 93.4%, and 98.6% of the total area of meadow, steppe, and desert grassland, respectively. Among them, the areas with extremely significant drying and significant drying in the meadow SPEI accounted for 49.4% of the total meadow area and were mainly distributed in some mountainous areas of the Tianshan Mountains, some mountainous areas of the Altai Mountains, and the eastern margin of the Tarim Basin (Figure 5G). The areas with extremely significant drying and significant drying in the steppe SPEI accounted for 43.1% of the total steppe area and were mainly distributed in some mountainous areas of the Altai Mountains, the Tianshan Mountains, and the Kunlun Mountains (Figure 5H). The areas with extremely significant drying and significant drying in the desert grassland SPEI accounted for 64.8% of the total desert grassland area and were mainly distributed in some mountainous areas of the Altai Mountains, the Tianshan Mountains, and the Kunlun Mountains, and the eastern margin of the Junggar Basin (Figure 5I).
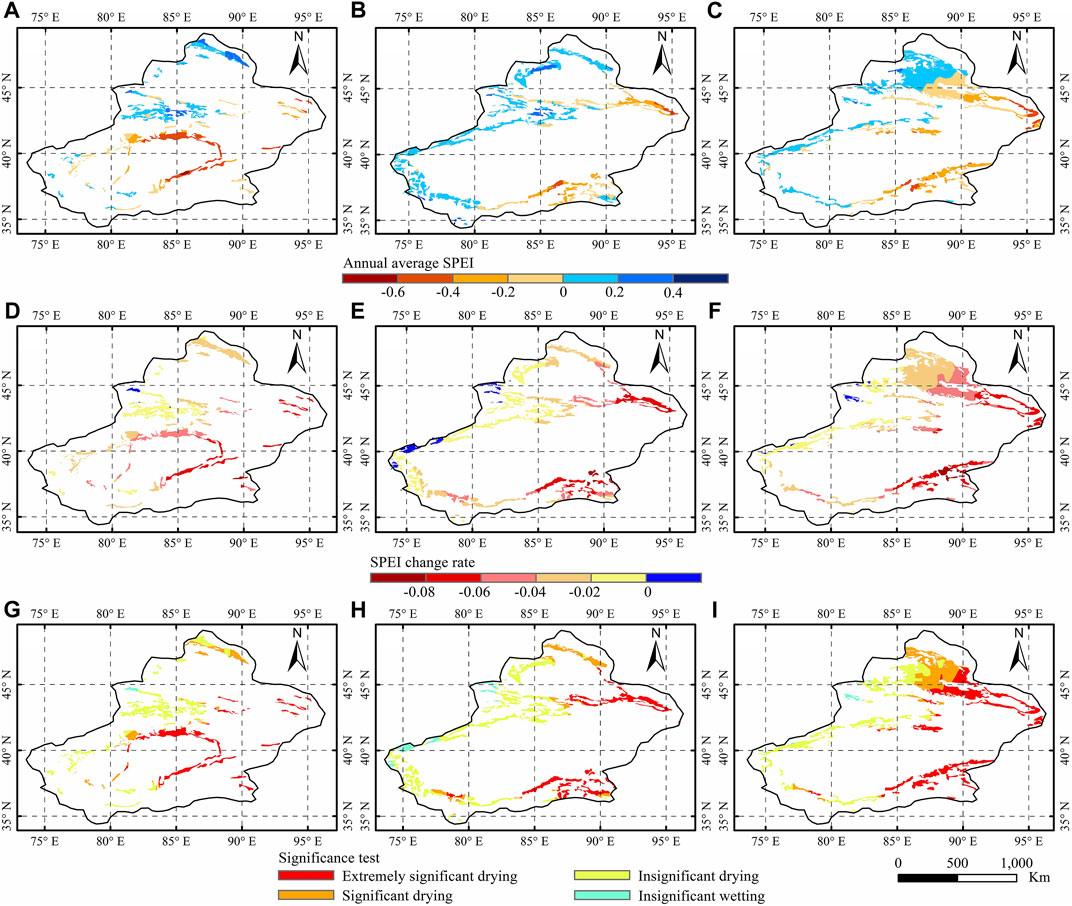
FIGURE 5. Spatial distribution pattern of the annual average SPEI-12 and change rate and significance test of meadow, steppe, and desert grassland in Xinjiang. [The annual average SPEI of meadow (A), steppe (B), and desert grassland (C) in Xinjiang; the SPEI change rate of meadow (D), steppe (E), and desert grassland (F) in Xinjiang; and the significance test of meadow (G), steppe (H), and desert grassland (I) in Xinjiang.]
The SPEI-12 data representing the interannual drought status were selected for analysis; there were significant spatial differences in the correlation between the NDVI and SPEI-12 of different grassland types (Figure 6). In general, the area of positive correlation between the NDVI and SPEI-12 was significantly larger than the area of negative correlation in the three grassland types. The grassland type with the largest proportional area of positive correlation was desert grassland (accounting for 76% of the total desert grassland area), followed by steppe (accounting for 70.1% of the total steppe area). Meadow had the smallest proportional area of positive correlation (accounting for 63.4% of the total meadow area). The proportion of the grassland type with a significant positive correlation was the highest (32.6%) in desert grassland, which was mainly distributed in some mountainous areas of the Tianshan Mountains and the eastern and western margins of the Junggar Basin. The next highest proportion of the significant positive correlation was steppe (21.2%), which was mainly distributed in some mountainous areas of the Tianshan Mountains and the northern margin of the Junggar Basin. The meadow had the smallest proportion of the significant positive correlation area (19.2%), where it was mainly distributed in some areas of the Yili River Valley, some mountainous areas of the Altai Mountains, and the northern margin of the Tarim Basin.
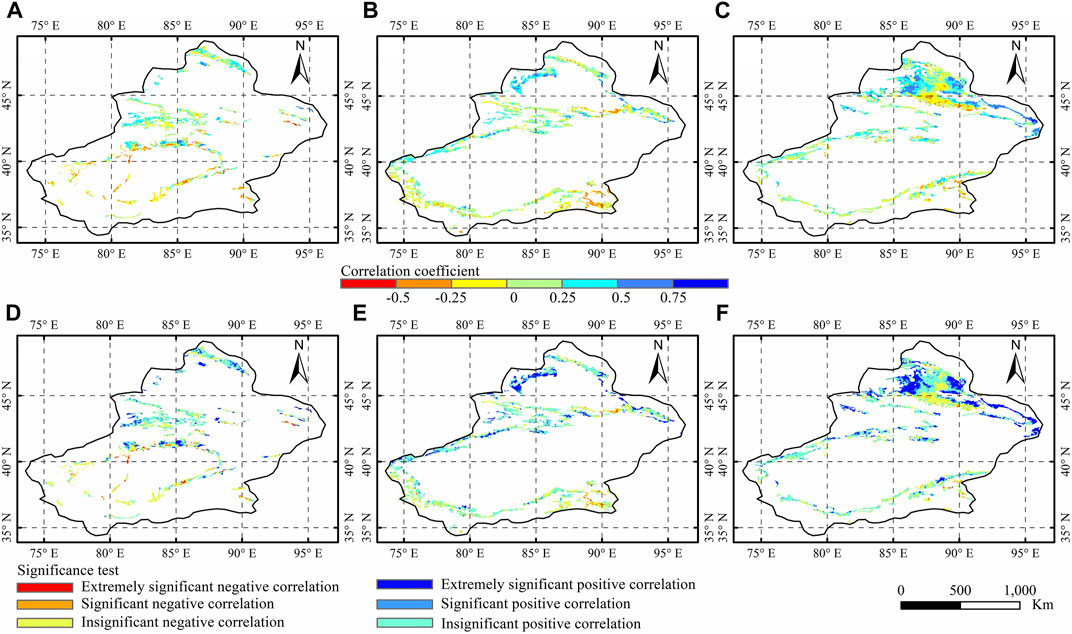
FIGURE 6. Correlation coefficient and significance test between the NDVI and SPEI-12 of meadow, steppe, and desert grassland in Xinjiang. (The correlation coefficient between the NDVI and SPEI-12 of meadow (A), steppe (B), and desert grassland (C) in Xinjiang and the significance test between the NDVI and SPEI-12 of meadow (D), steppe (E), and desert grassland (F) in Xinjiang.)
In different months of the growing season, different grassland types had different responses to meteorological drought. The NDVI was used to characterize the monthly vegetation growth. Based on the monthly scale, the correlation coefficients between the NDVI of the same month and the SPEI of the corresponding pixel at the scale of 1, 3, 6, and 12 months were calculated, respectively, in the growing season from 1982 to 2015. Through calculation, 84 spatial distribution maps of correlation coefficients were obtained. Through statistical analysis (Figure 7), it was found that in spring (April–May), in April, the SPEI of meadow and steppe in each time scale were significantly negatively correlated, of which meadow had the largest negative correlation coefficients, −0.72, −0.74, −0.63, and −0.43. The SPEI of desert grassland was insignificant at all scales; in summer (June–August); the meadow and steppe were not significantly affected by drought in June. There was a significant positive correlation between desert grassland and the SPEI-6 and SPEI-12, and the response to the SPEI-12 was stronger, with a correlation coefficient of 0.44. In August, the SPEI-3, SPEI-6, and SPEI-12 had a significant impact on the NDVI of three grassland types, of which the steppe correlation coefficient was the highest, with correlation coefficients of 0.49, 0.48, and 0.47, respectively. In autumn (September–October), meadow and steppe showed a significant positive correlation in the SPEI-3, SPEI-6, and SPEI-12 in September. The meadow response was stronger, with correlation coefficients of 0.45, 0.50, and 0.53. Desert grassland only showed a significant positive correlation in the SPEI-12 in September–October. In general, the response of meadow to the SPEI-12 was the highest in autumn (September) (r = 0.53; p < 0.05), the response of steppe to the SPEI-3 was the highest in summer (August) (r = 0.49; p < 0.05), and the response of desert grassland to the SPEI-12 was the highest in summer (June) (r = 0.44; p < 0.05).
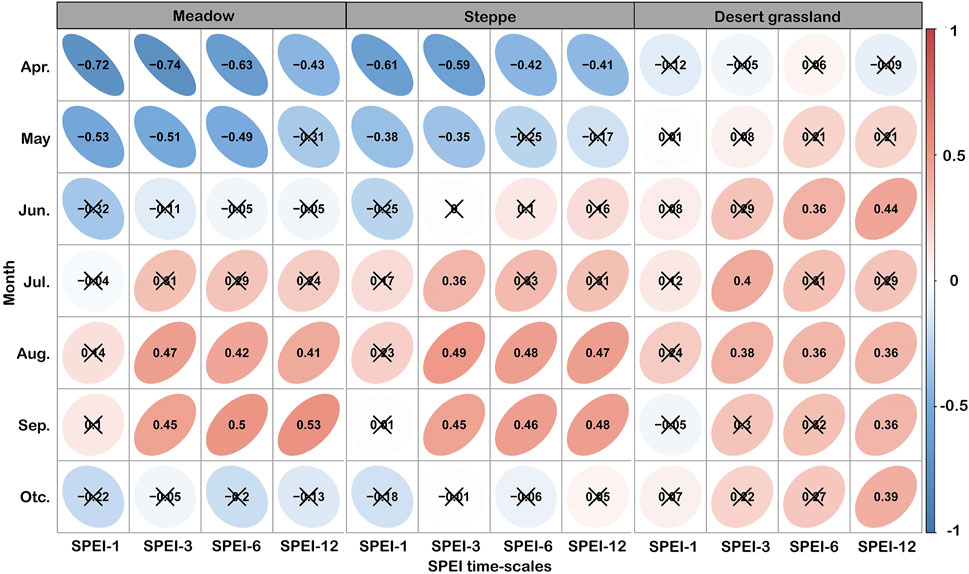
FIGURE 7. Correlation coefficients between the NDVI and SPEI at different time scales of meadow, steppe, and desert grassland in Xinjiang.
Frequent drought strongly impacts the vegetation growth and distribution patterns in grassland ecosystems. Drought occurrence in different grassland types is variable, and the response mechanism of grassland types to drought also differs (Bai and Alatengtuya, 2022). In terms of temporal changes, the NDVI of different grassland types in northern China and the Yili Region of Xinjiang showed a weak increasing trend (Cao et al., 2016; Qin et al., 2021). This study found that the NDVI of meadow, steppe, and desert grassland in Xinjiang also showed a weak increasing trend that was insignificant (p > 0.05); the NDVI growth rate was 0.002 per decade for meadow and steppe and 0.0003 per decade for desert grassland. In terms of spatial change, the NDVI of meadow increased significantly in some mountainous areas of the Tianshan Mountains and the southwest margin of the Tarim Basin. The steppe regions with a significant increase in the NDVI were mainly distributed in some mountainous areas of the Altai Mountains, the Tianshan Mountains, and the Kunlun Mountains. The desert grassland regions with a significant increase in the NDVI were mainly distributed in some mountainous areas of the Tianshan Mountains, some mountains of the Kunlun Mountains, and the northern and southern margins of the Junggar Basin. These results were similar to those of other scholars in China and northern China (He et al., 2020; Geng et al., 2022). The ecological environment of meadow, steppe, and desert grassland in Xinjiang is constantly improving, and the vegetation of different grassland types shows a benign development trend. Since the state initiated the vegetation restoration project of returning farmland to grassland in 1999, Xinjiang has carried out a series of ecological restoration projects such as fence enclosure and grassland improvement, which has improved the grassland growth environment and generally increased the area covered by grassland. In addition, the implementation of the “livestock reduction project” has also played a positive role in grassland restoration (Dong et al., 2009). In the past 34 years, the SPEI-12 of meadow, steppe, and desert grassland in Xinjiang showed an extremely significant drying trend (p < 0.01). The main climate factor affecting the interannual change of the water cycle of the terrestrial ecosystem is precipitation (Hu et al., 2022). Although precipitation has increased in Xinjiang, since it is in an arid and semi-arid region, the rising temperature has led to the strengthening of evapotranspiration, and the climate is still drying (Guo et al., 2019).
The degree of vegetation change in response to meteorological drought differed among grassland types. On an annual scale, the correlation between the NDVI and SPEI-12 of the three grassland types was significantly different between north and south Xinjiang. The response of vegetation to drought was higher and more significant in north Xinjiang than in south Xinjiang. This may be due to the uneven distribution of precipitation in north and south Xinjiang. Unique landforms in the Yili River Valley and the Altai Mountain area in north Xinjiang make humid air flow from the north Atlantic and the Arctic Ocean enter. As a result, vegetation growth is more easily restricted by the water conditions in the three grassland types in northern Xinjiang (Zhang et al., 2009; Wang et al., 2017; Chen et al., 2021). To reduce water loss and adapt to physiological stress during drought, vegetation generally adopts methods such as reducing respiration, photosynthesis, and growth rate (Liu, 2016). Due to different structures and functions across types of vegetation, vegetation’s adaptability to climate change also varies (Vicente-Serrano et al., 2013). Affected by the humid air flow, the temperature in northern Xinjiang was relatively low, the precipitation was higher, and the vegetation was more sensitive to drought stress than southern Xinjiang. Drought reduces the soil water content, which reduces vegetation roots’ capacity to absorb water. Therefore, the grassland vegetation in northern Xinjiang is greatly affected by drought. However, the southern Xinjiang region is obstructed by the Tianshan Mountains. The temperature was relatively high, the precipitation was very low, and the vegetation had a stronger adaptability to drought stress, which improved the water storage capacity during drought. Therefore, the grassland vegetation in southern Xinjiang had a weak response to drought.
On the monthly scale, the response of the three grassland types to the SPEI was the most sensitive in summer, followed by autumn, and the weakest in spring; this pattern was consistent with the research results from the central part of the Inner Mongolia Plateau (Deng et al., 2022). With warming temperatures, the melting of ice and snow increases the soil water content. However, insufficient effective accumulated temperature inhibits the physiological activities of grassland vegetation, and water consumption is limited, reducing the sensitivity of grassland vegetation to drought in the spring (Deng et al., 2022). In summer, most grassland vegetation is in the critical period of growth and development and is extremely vulnerable to drought (Huang et al., 2009). In autumn, grassland vegetation begins to wither and turns yellow, and the impact of water on it is weakened, especially in October. The response of meadow to the SPEI-12 was the highest in autumn (September) (r = 0.53; p < 0.05), the response of steppe to the SPEI-3 was the highest in summer (August) (r = 0.49; p < 0.05), and the response of desert grassland to the SPEI-12 was the highest in summer (June) (r = 0.44; p < 0.05), which indicate that the drought resistance of grassland types differed. When summer drought occurred over a short time scale, steppe was more sensitive to drought changes; however, meadow and desert grassland were sensitive to long-term summer and autumn drought changes; these findings were similar to the research results from northeast China (Luo et al., 2020). This was not only related to the water absorption capacity of the root system of different grassland types but also to the different distribution ratios of soil water in the shallow and middle layers of the soil in the area where the vegetation was located.
In addition, this study assumes that the distribution of different grassland types is stable during the study period, but climate change and human activities will change the distribution of grassland vegetation (Liu and Yu, 2017; Xue et al., 2019). Other factors such as soil humidity and extreme climate will also play a certain role in the growth grassland vegetation growth (Girardin et al., 2016; Li et al., 2018). This study only considers the impact of the SPEI on the grassland vegetation. Because of this limitation, the various factors affecting the NDVI change in grassland vegetation will be incorporated into the next research study to better reflect the response of different grassland vegetation to meteorological drought.
In the past 34 years, the NDVI of meadow, steppe, and desert grassland in Xinjiang has shown an increasing trend that was insignificant (p > 0.05), with a growth rate of 0.002, 0.002, and 0.0003 per decade, respectively. The SPEI-12 has shown an extremely significant drying trend (p < 0.01), with a change rate of −0.31, −0.38, and −0.34 per decade, respectively. The areas with the most obvious vegetation improvement of the three grassland types were mainly distributed in the Tianshan Mountain area. The overall meteorological drought trend was gradually drying from the northwest to southeast, with the degree of aridification in the eastern Xinjiang region being the most obvious. On the annual scale, the response of vegetation of the three grassland types in northern Xinjiang to drought was higher and more significant than that in southern Xinjiang; on the monthly scale, the response of meadow to the SPEI-12 was the highest in autumn (September) (r = 0.53; p < 0.05), the response of steppe to the SPEI-3 was the highest in summer (August) (r = 0.49; p < 0.05), and the response of desert grassland to the SPEI-12 was the highest in summer (June) (r = 0.44; p < 0.05). Thus, when summer drought occurred over a short time scale, steppe was more sensitive to drought changes; however, meadow and desert grassland were sensitive to long-term summer and autumn drought changes.
The original contributions presented in the study are included in the article/supplementary material; further inquiries can be directed to the corresponding author.
WZ conceived and designed this study, carried out the analysis, and drafted the manuscript. CJ administrated the study, gave some constructive suggestions, and applied for funding for this study. All authors have read and agreed to this version of the manuscript.
This research was funded by the National Natural Science Foundation of China (42161024) and the Key Laboratory opening project of the Xinjiang Uygur Autonomous Region (2020D04037).
The authors were very grateful for the Global Inventory Monitoring and Modeling Systems (GIMMS) of NASA (https://ecocast.arc.nasa.gov) for providing NDVI data and the SPEI base v. 2.6 products for providing SPEI data (https://digital.csic.es/handle/10261/202305).
The authors declare that the research was conducted in the absence of any commercial or financial relationships that could be construed as a potential conflict of interest.
All claims expressed in this article are solely those of the authors and do not necessarily represent those of their affiliated organizations, or those of the publisher, the editors, and the reviewers. Any product that may be evaluated in this article, or claim that may be made by its manufacturer, is not guaranteed or endorsed by the publisher.
Allen, R. G., Pereira, L. S., Raes, D., and Smith, M. (1998). Crop evapotranspiration-Guidelines for computing crop water requirements-FAO Irrigation and drainage paper 56. Rome.
Bai, Q. K., and Alatengtuya, (2022). Response of grassland cover change to drought in the Mongolian Plateau from 2001 to 2020. Pratacultural Sci. 39 (3), 443–454. doi:10.11829/j.issn.1001-0629.2021-0505
Cao, M. L., Xiao, J. D., Chen, A. J., Shi, Y., and Liu, J. J. (2016). Relationships between different types of grasslands vegetation index and climatic factors in the Yili region. Desert Oasis Meteorology 10 (6), 73–80. doi:10.3969/j.issn.1002-0799.2016.06.011
Carrer, M., Pellizzari, E., Prendin, A. L., Pividori, M., and Brunetti, M. (2019). Winter precipitation-not summer temperature-is still the main driver for Alpine shrub growth. Sci. Total Environ. 682, 171–179. doi:10.1016/j.scitotenv.2019.05.152
Chen, C., Jing, C. Q., Xing, W. Y., Deng, X. J., Fu, H. Y., and Guo, W. Z. (2021). Desert grassland dynamics in the last 20 years and its response to climate change in Xinjiang. Acta Prataculturae Sin. 30 (3), 1–14. doi:10.11686/cyxb2020143
Chen, Y. Z., Mu, S. J., Sun, Z. G., Gang, C. C., Li, J. L., Padarian, J., et al. (2016). Grassland carbon sequestration ability in China: A new perspective from terrestrial aridity zones. Rangel. Ecol. Manag. 69 (1), 84–94. doi:10.1016/j.rama.2015.09.003
Deng, T. L., Song, Y. F., Wang, M. X., Zhao, Y. P., Wang, Z. H., Liu, D., et al. (2022). Dynamic variatkons of normalized difference vegetation index variations in Otindag Sandland and its spatio-temporal responses to standardized precipitation evapotranspiration index. J. China Inst. Water Resour. Hydropower Res. 20 (3), 221–230. doi:10.13244/j.cnki.jiwhr.20210064
Dong, Y., Jiao, L., Yang, G. H., and Chen, L. (2009). Monitoring of vegetation cover dynamic in Xinjiang based on SPOT-VGT data from 1998 to 2007. Bull. Soil Water Conservation 29 (2), 125–128+2. doi:10.13961/j.cnki.stbctb.2009.02.004
Fensholt, R., Rasmussen, K., Kaspersen, P., Huber, S., Horion, S., and Swinnen, E. (2013). Assessing land degradation/recovery in the african sahel from long-term earth observation based primary productivity and precipitation relationships. Remote Sens. 5 (2), 664–686. doi:10.3390/rs5020664
Gang, C. C., Zhao, W., Zhao, T., Zhang, Y., Gao, X. R., and Wen, Z. M. (2018). The impacts of land conversion and management measures on the grassland net primary productivity over the Loess Plateau, Northern China. Sci. Total Environ. 645, 827–836. doi:10.1016/j.scitotenv.2018.07.161
General Administration of Quality Supervision (2006). “Inspection and quarantine of the people's republic of China, standardization administration of China,” in Climate drought classification (GB/T20481-2006) (Beijing: Standards Press of China).
Geng, Q. L., Chen, X. Q., He, X. H., and Tian, Z. H. (2022). Vegetation dynamics and its response to climate change and human activities based on different vegetation types in China. Acta eco. Sin. 42 (9), 3557–3568. doi:10.5846/stxb202012313335
Girardin, M. P., Hogg, E. H., Bernier, P. Y., Kurz, W. A., Guo, X. J., and Cyr, G. (2016). Negative impacts of high temperatures on growth of black spruce forests intensify with the anticipated climate warming. Glob. Chang. Biol. 22 (2), 627–643. doi:10.1111/gcb.13072
Gouveia, C. M., Trigo, R. M., Beguería, S., and Vicente-Serrano, S. M. (2017). Drought impacts on vegetation activity in the Mediterranean region: An assessment using remote sensing data and multi-scale drought indicators. Glob. Planet. Change 151, 15–27. doi:10.1016/j.gloplacha.2016.06.011
Guo, Y. Y., Hu, Q., Fu, W. D., Wang, S., and Liu, Y. (2019). Drought trend over the grassland in the tianshan mountains, Xinjiang in recent 55 Years based on SPEI. Arid Zone Res. 36 (3), 670–676. doi:10.13866/j.azr.2019.03.18
He, H., Zhang, B., Hou, Q., Li, S., Ma, B., and Ma, S. Q. (2020). Variation characteristic of NDVI and its response to climate change in northern China from 1982 to 2015. J. Ecol. Rural Environ. 36 (1), 70–80. doi:10.19741/j.issn.1673-4831.2019.0115
Hu, Z. Y., Chen, X., Zhou, Q. M., Chen, D. L., and Li, J. F. (2019b). Diso: A rethink of taylor diagram. Int. J. Climatol. 39 (5), 2825–2832. doi:10.1002/joc.5972
Hu, Z. Y., Chen, X., Zhou, Q. M., Yin, G., and Liu, J. (2022). Dynamical variations of the terrestrial water cycle components and the influences of the climate factors over the Aral Sea Basin through multiple datasets. J. Hydrology 604, 127270. doi:10.1016/j.jhydrol.2021.127270
Hu, Z. Y., Li, Q. X., Chen, X., Teng, Z. D., Chen, C. C., Yin, G., et al. (2016). Climate changes in temperature and precipitation extremes in an alpine grassland of Central Asia. Theor. Appl. Climatol. 126, 519–531. doi:10.1007/s00704-015-1568-x
Hu, Z. Y., Zhang, C., Hu, Q., and Tian, H. Q. (2014). Temperature changes in central Asia from 1979 to2011 based on multiple datasets. J. Clim. 27 (3), 1143–1167. doi:10.1175/JCLI-D-13-00064.1
Hu, Z. Y., Zhou, Q. M., Chen, X., Chen, D. L., Li, J. F., Guo, M. Y., et al. (2019a). Groundwater depletion estimated from grace: A challenge of sustainable development in an arid region of central Asia. Remote Sens. 11 (16), 1908. doi:10.3390/rs11161908
Hu, Z. Y., Zhou, Q. M., Chen, X., Qian, C., Wang, S. S., and Li, J. F. (2017). Variations and changes of annual precipitation in Central Asia over the last century. Int. J. Climatol. 37 (S1), 157–170. doi:10.1002/joc.4988
Huang, W. H., Yang, X. G., Qu, H. H., Feng, L. P., Huang, B. X., Wang, J., et al. (2009). Analysis of spatio-temporal characteristic on seasonal drought of spring maize based on crop water deficit index. Trans. Chin. Soc. Agric. Eng. 25 (8), 28–34. doi:10.3969/j.issn.1002-6819.2009.08.006
IPCC (2013). Climate change 2013: The physical science basis. Cambridge: Cambridge University Press.
Kong, D. D., Zhang, Q., Gu, X. H., Wang, Y., and Li, H. Z. (2016). Vegetation responses to drought at different time scales in China. Acta eco. Sin. 36 (24), 7908–7918. doi:10.5846/stxb201506111182
Li, C. L., Filho, W. L., Yin, J., Hu, R., Wang, J., Yang, C. S., et al. (2018). Assessing vegetation response to multi-time-scale drought across inner Mongolia plateau. J. Clean. Prod. 179, 210–216. doi:10.1016/j.jclepro.2018.01.113
Liu, D., and Yu, C. L. (2017). Effects of climate change on the distribution of main vegetation types in Northeast China. Acta eco. Sin. 37 (19), 6511–6522. doi:10.5846/stxb201607071393
Liu, S. L., Tian, Y. Y., An, N. N., Zhao, H. D., and Dong, S. K. (2015). Effects of climate change on normalized difference vegetation index based on the multiple analysis of standardized precipitation evapotranspiration index methods in the lancang river basin. Clim. Environ. Res. 20 (6), 705–714. doi:10.3878/j.issn.1006-9585.2015.14192
Liu, Y. Q. (2016). Impacts of vegetation on drought trends. Chin. J. Atmos. Sci. (in Chinese) 40 (1), 142–156. doi:10.3878/j.issn.1006-9895.1508.15146
Liu, Y. Y., Ren, H. Y., Hu, T. M., Yang, P. Z., Basang, C., Zhang, W., et al. (2022). Spatiotemporal dynamics of NDVI of grassland and its response to multi-scale drought in China. Research of Soil and Water Conservation 29 (1), 153–161+168. doi:10.13869/j.cnki.rswc.2022.01.017
Liu, Y. Y., Wang, Q., Yang, Y., Gang, C. C., Zhang, Z. Y., Tong, L. J., et al. (2019a). Spatial-temporal dynamics of grassland NPP and its driving factors in the Loess Plateau, China. Chinese Journal of Applied Ecology 30 (7), 2309–2319. doi:10.13287/j.1001-9332.201907.002
Liu, Y. Y., Wang, Q., Zhang, Z. Y., Tong, L. J., Wang, Z. Q., and Li, J. L. (2019b). Grassland dynamics in responses to climate variation and human activities in China from 2000 to 2013. Science of The Total Environment 690, 27–39. doi:10.1016/j.scitotenv.2019.06.503
Luo, Q. H., Ning, H. S., and Chen, Q. M. (2016). Trends of surface dry-wet state of ganjiahu in Xinjiang based on humid index. Arid Zone Research 33 (5), 921–926. doi:10.13866/j.azr.2016.05.02
Luo, X. L., Li, Y. G., Yin, H., and Sui, M. (2020). Response of NDVI to SPEI at different temporal scales in Northeast China. Chinese Journal of Ecology 39 (2), 412–421. doi:10.13292/j.1000-4890.202002.025
Qi, G. Z., Bai, H. Y., Zhao, T., Meng, Q., and Zhang, S. H. (2021). Sensitivity and areal differentiation of vegetation responses to hydrothermal dynamics on the southern and northern slopes of the Qinling Mountains in Shaanxi province. Acta Geographica Sinica 76 (1), 44–56. doi:10.11821/dlxb202101004
Qin, G. X., Lu, Q., Meng, Z. Y., Li, Z., Chen, H. Y., Kong, J., et al. (2021). Spatial-temporal dynamics of grassland NDVI and its response to climate change in northern China from 1982 to 2015. Research of Soil and Water Conservation 28 (1), 101–108+117. doi:10.13869/j.cnki.rswc.2021.01.013
Rajpoot, P. S., and Kumar, A. (2019). Impact assessment of meteorological drought on rainfed agriculture using drought index and NDVI modeling: A case study of tikamgarh district. Applied Geomatics, 11, 15–23. doi:10.1007/s12518-018-0230-6
Shi, Y. F., Shen, Y. P., Kang, E., Li, D. L., Ding, Y. J., Zhang, G. W., et al. (2007). Recent and future climate change in northwest China. Climatic Change 80, 379–393. doi:10.1007/s10584-006-9121-7
Su, H. X., and Li, G. Q. (2012). Low-frequency drought variability based on SPEI in association with climate indices in Beijing. Acta Eco. Sin. 32 (17), 5467–5475. doi:10.5846/stxb201111071684
Tan, J. G., Piao, S. L., Chen, A. P., Zeng, Z. Z., Ciais, P., Janssens, I. A., et al. (2015). Seasonally different response of photosynthetic activity to daytime and night-time warming in the Northern Hemisphere. Glob. Chang. Biol. 21 (1), 377–387. doi:10.1111/gcb.12724
Tao, H., Mao, W. Y., Huang, J. L., and Zhai, J. Q. (2014). Drought and wetness variability in the Tarim River basin and possible associations with large scale circulation. Advances in Water Science 25 (1), 45–52. doi:10.14042/j.cnki.32.1309.2014.01.002
Vicente-Serrano, S. M., Beguería, S., and López-Moreno, J. I. (2010). A multiscalar drought index sensitive to global warming: The standardized precipitation evapotranspiration index. J. Clim. 23 (7), 1696–1718. doi:10.1175/2009JCLI2909.1
Vicente-Serrano, S. M., Gouveia, C., Camarero, J. J., Beguería, S., Trigo, R., López-Moreno, J. I., et al. (2013). Response of vegetation to drought time-scales across global land biomes. Proc. Natl. Acad. Sci. U. S. A. 110 (1), 52–57. doi:10.1073/pnas.1207068110
Wang, D., Zhang, B., An, M. L., Zhang, T. F., Ji, D. M., and Ren, P. G. (2014). Temporal and spatial distributions of drought in southwest China over the past 53 years based on standardized precipitation evapotranspiration index. Journal of Natural Resources 29 (6), 1003–1016. doi:10.11849/zrzyxb.2014.06.009
Wang, Q., Chen, Y., Ruan, X. R., Li, X. D., Wang, X. L., Shi, J. Z., et al. (2017). The changes of NDVI in China from 1982 to 2012 and its relationship with climatic factors. Acta Agrestia Sinica 25 (4), 691–700. doi:10.11733/j.issn.1007-0435.2017.04.002
Wang, Q., Zhang, Q. P., and Zhou, W. (2012). Grassland coverage changes and analysis of the driving forces in Maqu county. Physics Procedia 33, 1292–1297. doi:10.1016/j.phpro.2012.05.213
Wang, Y. Q., Zhang, C. F., and Li, X. H. (2020). Response of NDVI to climate change in typical steppes of inner Mongolia. Research of Soil and Water Conservation 27 (4), 201–205. doi:10.13869/j.cnki.rswc.2020.04.026
Wang, Z. L., Huang, Z. Q., Li, J., Zhong, R. D., and Huang, W. W. (2016). Assessing impacts of meteorological drought on vegetation at catchment scale in China based on SPEI and NDVI. Transactions of the Chinese Society of Agricultural Engineering 32 (14), 177–186. doi:10.11975/j.issn.1002-6819.2016.14.024
Xie, P., Gu, Y. L., Zhang, Y. H., and Xiang, L. (2017). Precipitation and drought characteristics in Xinjiang during 1961-2015. Arid Land Geography 40 (2), 332–339. doi:10.13826/j.cnki.cn65-1103/x.2017.02.011
Xu, H. J., Wang, X. P., Zhao, C. Y., and Yang, X. M. (2018). Diverse responses of vegetation growth to meteorological drought across climate zones and land biomes in northern China from 1981 to 2014. Agricultural and Forest Meteorology 262, 1–13. doi:10.1016/j.agrformet.2018.06.027
Xue, B., Xiao, X., Li, J. Z., Xie, X., and Lu, C. P. (2019). Spatio-temporal evolution of water areas and croplands in the three provinces of Northeast China based on remote sensing data. Chinese Journal of Ecology 38 (5), 1444–1452. doi:10.13292/j.1000-4890.201905.002
Yao, J. Q., Yang, Q., Chen, Y. N., Hu, W. F., Liu, Z. H., and Zhao, L. (2013). Climate change in arid areas of Northwest China in past 50 years and its effects on the local ecological environment. Chinese Journal of Ecology 32 (5), 1283–1291. doi:10.13292/j.1000-4890.2013.0221
Yue, S., Pilon, P., and Cavadias, G. (2002). Power of the Mann-Kendall and Spearman's rho tests for detecting monotonic trends in hydrological series. Journal of Hydrology 259 (1-4), 254–271. doi:10.1016/S0022-1694(01)00594-7
Zhang, H., Xu, C. G., and Wang, H. (2020). Response of vegetation change to meteorological drought in northwest China from 2001 to 2018. Scientia Geographica Sinica 40 (6), 1029–1038. doi:10.13249/j.cnki.sgs.2020.06.019
Zhang, S. J., Wang, T., Wang, T. M., Lu, A. G., and Ge, J. P. (2009). The variations in NDVI of different vegetation types in Xinjiang and its relation to climate factors. Pratacultural Science 26 (5), 26–31.
Zhang, Y. D., Zhang, X. H., and Liu, S. R. (2011). Correlation analysis on normalized difference vegetation index (NDVI) of different vegetations and climatic factors in Southwest China. Chinese Journal of Applied Ecology 22 (2), 323–330. doi:10.13287/j.1001-9332.2011.0053
Zhao, P., Chen, T., Wang, Q., and Yu, R. D. (2020). Quantitative analysis of the impact of climate change and human activities on grassland ecosystem NPP in Xinjiang. Journal of University of Chinese Academy of Sciences 37 (1), 51–62. doi:10.7523/j.issn.2095-6134.2020.01.007
Zhou, Q. M., Chen, D. L., Hu, Z. Y., and Chen, X. (2021). Decompositions of Taylor diagram and DISO performance criteria. Int. J. Climatol. 41 (12), 5726–5732. doi:10.1002/joc.7149
Zhou, W., Yang, H., Huang, L., Chen, C., Lin, X. S., Hu, Z. J., et al. (2017). Grassland degradation remote sensing monitoring and driving factors quantitative assessment in China from 1982 to 2010. Ecological Indicators 83, 303–313. doi:10.1016/j.ecolind.2017.08.019
Keywords: natural grassland, grassland types, NDVI, SPEI, Xinjiang
Citation: Zhao W and Jing C (2022) Response of the natural grassland vegetation change to meteorological drought in Xinjiang from 1982 to 2015. Front. Environ. Sci. 10:1047818. doi: 10.3389/fenvs.2022.1047818
Received: 18 September 2022; Accepted: 27 October 2022;
Published: 16 November 2022.
Edited by:
Zengyun Hu, Chinese Academy of Sciences (CAS), ChinaCopyright © 2022 Zhao and Jing. This is an open-access article distributed under the terms of the Creative Commons Attribution License (CC BY). The use, distribution or reproduction in other forums is permitted, provided the original author(s) and the copyright owner(s) are credited and that the original publication in this journal is cited, in accordance with accepted academic practice. No use, distribution or reproduction is permitted which does not comply with these terms.
*Correspondence: Changqing Jing, amluZ2NoYW5ncWluZ0AxMjYuY29t
Disclaimer: All claims expressed in this article are solely those of the authors and do not necessarily represent those of their affiliated organizations, or those of the publisher, the editors and the reviewers. Any product that may be evaluated in this article or claim that may be made by its manufacturer is not guaranteed or endorsed by the publisher.
Research integrity at Frontiers
Learn more about the work of our research integrity team to safeguard the quality of each article we publish.