 Manman Guo
 Cong Li1
 Guangyu Wang
- 1School of Economics and Finance, Xi’an Jiaotong University, Xi’an, China
- 2Faculty of Forestry, University of British Columbia, Vancouver, BC, Canada
Consistent with the 2030 agenda for sustainable development, China has initiated a large-scale anti-poverty relocation and settlement program (the ARSP), aiming to restore ecosystems and lift impoverished populations out of the poverty trap and into sustainable livelihoods. Unlike previous studies that focus on the population issues of the ARSP, we examine the links between livelihood sustainability and environmental protection (“livelihoods–environment”) in the ARSP areas. We found that the links are generally weak, with low levels of both livelihood sustainability and environmental protection. The disorder category is the most common in both the overall and the regional samples, with the mild and borderline disorder categories being the most common subcategories. The results varied regionally, and indicated that environmental problems can be more prominent in regions with fragile environments. Household-level distribution shows significant differences in the strengths of the links among different demographic groups, and regression results show that higher levels of average education, loan amount, and asset holdings, as well as lower proportions of the elderly and non-agricultural activities were associated with stronger links. These household factors influenced the links through different mechanisms.
1 Introduction
Ending poverty in all its forms and dimensions and protecting the environment are important global goals of the 2030 agenda for sustainable development (SDGs). However, the Sustainable Development Goals Report 2021 warns that the world is not on track to achieving full implementation of the 2030 agenda, and progress has been slow (United Nations, 2021). While the COVID-19 pandemic is partly responsible for the delays, there are also serious issues associated with the trade-offs among the SDGs, and these have hindered their simultaneous implementation (Nilsson et al., 2016). In China, the economic growth that has occurred since the economic reforms have been accompanied by serious environmental degradation and environmental crises (Liu and Diamond, 2008). To ensure the sustainable development of the Chinese nation for future generations and to fulfill the commitments of the 2030 agenda, China has tried to resolve the dilemma between human development and environmental protection. As most of the impoverished populations are located in remote and environmentally fragile areas where, according to Li et al. (2021), natural resources are incapable of maintaining the livelihoods of local people, China has initiated several rounds of its poverty resettlement program, in which impoverished people move away from areas with a poor living environment, thereby halting and even reversing environmental destruction while at the same time promoting human development.
The anti-poverty relocation and settlement program (ARSP) implemented since 2016 is the largest resettlement program in the history of China. It has involved 10 million people from 22 provinces who live below the poverty line in steep, mountainous areas or areas prone to natural disasters (National Development and Reform Commission, 2016). By 2020, the ARSP had moved all the targeted people into consolidated settlements, simultaneously lifting them out of poverty.1 The focus of the ARSP has shifted from the slogan “winning the battle of poverty alleviation” to a new goal “doing well to maintain the sustainability of impoverished people.” However, compared with the remarkable achievements in poverty alleviation, environmental protection has made little progress. Progress in restoring and rebuilding the ecological environment in depopulated areas has been slow due to a lack of central guidance. In addition, large-scale resettlement inevitably reshapes the human–environment systems in the resettlement area. In a number of developing countries, such as Brazil and Ethiopia, eco-migration projects have commonly caused environmental disasters and worsened poverty in the resettlement areas (Finco, 2009; Morrissey, 2013). The relationship between humans and the environment has evolved into a coupled complex system in which people and natural components interact with each other and should in principle exist harmoniously (Regen, 1984; Ghai, 1994). Given the large scale of the ARSP, further analysis of the links between livelihood sustainability and environmental protection (“livelihoods–environment”) in the ARSP areas is warranted.
We used household survey data collected in 2021 from Shaanxi province in China to examine the strengths and categories of “livelihoods–environment” links at the overall, regional, and household levels and to explore the impact of different demographic characteristics on the links. Livelihood capabilities (LCs) are an important component of a livelihood (Chambers and Conway, 1992). They shape the use of livelihood assets to achieve certain livelihood outcomes. Considering the important role of LCs in sustaining livelihoods for impoverished people, we used LCs to represent livelihood sustainability. Changes in pro-environmental behaviours (PEBs) remain a high priority for many governments and agencies attempting to protect the environment (Barr et al., 2011). Given that relocated households are the main participants and micro-decision makers in the implementation of the ARSP, and that their actions will lead to environmental responses (Steibl and Laforsch, 2019), we analyzed environmental protection in the ARSP areas from the perspective of the PEBs of relocated households.
2 Background and conceptual framework
2.1 Background
The ARSP was one of China’s critical approaches to ending absolute poverty in the 13th Five-Year Plan period (2016–2020) (Lo et al., 2016; Liu et al., 2020; Rogers et al., 2020). Although the ARSP shares the same ultimate goal as ecological migration (in Chinese policy terms “to pursue harmonious development between man and nature”), the main purpose of the ARSP is poverty alleviation rather than environmental protection. As a result, past studies have concentrated on population issues, namely households’ volition (Wilmsen and Wang, 2015; Lo and Wang, 2018; Gomersall, 2020), the factors influencing the participation of households (Guo et al., 2017; Shi and Zhou, 2018), and the impact on household livelihoods (e.g., livelihood vulnerability, livelihood capital, adaptation strategy, and income levels) (Li et al., 2018; Liu et al., 2018; Liu et al., 2020; Leng et al., 2021). Research on the environmental status of ARSP areas is limited (Zhou et al., 2022), and even fewer studies have combined these two aspects by approaching the resettlement as a process with multiple outcomes (Li et al., 2021). Previous studies on the correlations between livelihoods and the environment have explored the livelihoods and the environmental effect of the ARSP on regional (watershed) to global scales (Li et al., 2015), but such scales may be too broad and ambiguous to make policy recommendations. Our previous study (Li et al., 2021) evaluated the effect of the ARSP on household well-being with an emphasis on ecosystem services. This, however, cannot reflect in detail the links between household livelihoods and environmental protection for each relocated household. Moreover, ‘wellbeing’ cannot measure the capacity of relocated households to sustain livelihoods, a major concern in China following the elimination of absolute poverty. In addition, dependence on ecosystem services is only one dimension of human disturbance to the environment, and much less is known about the systematic impact on the environment of the multidimensional behaviours of relocated households.
Livelihood capabilities (LCs) play important roles in the long-term development of actors (Chambers and Conway, 1992). The systematic analysis of LCs is based on three main theories: vulnerability, sustainable livelihoods and feasible capability. In studies based on the vulnerability theory, LC is generally referred to as adaptive capacity or livelihood resilience, which emphasizes capacities to adjust passively to changes in the external environment (Vogel and O’Brien, 2004; Smit and Wandel, 2006). In studies based on the theory of sustainable livelihoods, LC represents the capacity to cope with and recover from stresses and shocks, which focuses on the capabilities of actors to proactively address and respond to shocks, and continuously exploit and create opportunities (Department for International Development, 1999; Chambers, 2006). In studies based on the feasible capability theory, LC is referred to as a feasible capability, which emphasizes how the social arrangements (structures, institutions and policies) affect the capacity (Sen, 1999). Regardless of the theory on which it is based, quantitative studies generally are measured by adjusting or adding indicators of livelihood assets (Wang W. et al., 2021; Savari and Zhoolideh, 2021). Compared to studies based on other theories, the theory of sustainable livelihoods highlights the internal capacity of the actors, which holds the key to their subsequent development. However, livelihood assets and LCs are not equivalent. The livelihood assets available to individuals constitute their endowments, and it is how these endowments are used to shape livelihood outcomes that are the LCs (Korf and Oughton, 2006). In addition, studies that use livelihood assets to represent LCs treat LCs as a whole and fail to analyze their intrinsic structure.
Pro-environmental behaviours (PEBs) are one of the terminologies that have been used to describe behaviours that seek to protect the environment; they may be called “ecological behaviours,” “environmental behaviours” or other variants (Kurisu, 2015). While the definition of PEBs tend to differ slightly between studies, most constitute behaviours that either mitigate an individual’s impact on the environment or positively impact the environment (Sawitri et al., 2015). In the past, self-reports have mostly been used to measure PEBs, especially in studies that employ surveys, questionnaires, or interviews to evaluate respondents’ subjective estimates of their own behaviours (Hunter, 2000; Barr et al., 2011; Moss et al., 2017). Various organizations and researchers have provided lists of PEBs, which, for example, can be categorized by the place where behaviour can be conducted (e.g., “personal,” “community,” and “public”) (Pfeffer and Stycos, 2002; Takahashi and Selfa, 2015; Moss et al., 2017), by the potential actors who conduct the behaviours (e.g., individuals, households, institutions) (Wolters, 2014; Moss et al., 2017; Halaburda and Bernaciak, 2021), or by the influential field (e.g., water, waste in terms of visual savings) (Wolters, 2014; Wang S. et al., 2021). Although we have a good understanding of the definition and measurement of PEBs, they generally focus on one category of PEB, and this cannot capture the systematic impact on the environment. There have also been few studies of the PEBs of relocated households.
Based on the limitations of previous studies, an objective of this study was to explore the links between household livelihoods and the environment from a micro perspective, placing emphasis on the household capacities for livelihood sustainability and the links between multiple anthropogenic disturbances and environmental protection. The second objective was to improve the measurement of LCs and PEBs to fully capture household capacities of livelihood sustainability and the comprehensive interactions between relocated households and the environment.
2.2 Conceptual framework
To introduce how the measurement of LCs and PEBs could be improved and to explain “livelihoods–environment” links in the ARSP areas, we developed a framework of LCs, PEBs and “livelihoods–environment” links in the ARSP setting (Figure 1).
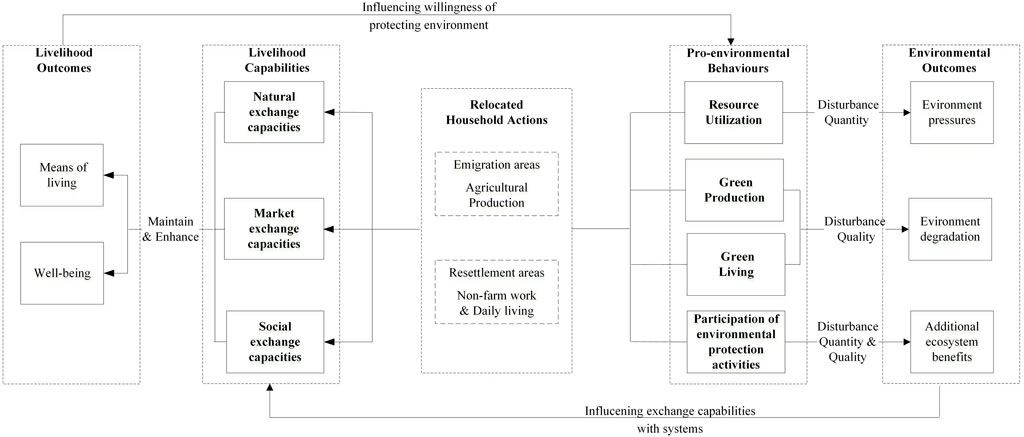
FIGURE 1. The conceptual framework of livelihood capabilities, pro-environmental behaviours and “livelihoods–environment” links in the ARSP setting.
Firstly, the capacities of relocated households to obtain what they want through exchange in emigration and resettlement areas determines the sustainability of their livelihoods. The relocated households have greatly improved living environments in the resettlement site, but face the challenge of adapting to the new environment during the early stages of their relocation, e.g., shortage of natural resources, increased living cost, and broken social networks (Rogers et al., 2020). Sen’s view in “Poverty and Famine” pointed out that “famine” is caused by the failure of exchange entitlements (Sen, 1983). This argument suggests that the key to sustainable livelihoods is the success of exchange entitlements. In the early stages of the relocation, relocated households have difficulties in exchanging their labour in the market system due to their low level of education and lack of vocational skills. They are therefore unable to obtain stable or substantial benefits. To sustain their livelihoods in the resettlement areas, many relocated households return to their original homes to practice agriculture, thereby obtaining benefits from the natural system. This is more common when the resettlement occurs over short distances (Lo et al., 2016). As an event in which the interests of some actors are partly or wholly under the control of others (Coleman, 1990), the exchange entitlements depend not only on the exchange with the natural and market systems, but also on the exchange with the social system. Relocated households can obtain diversified resources by engagement in social exchange with their original and new social networks, and can invest these resources in the natural and market systems to obtain continuous benefits (Wei and Li, 2020). We therefore defined LCs as the combination of natural exchange capacity, market exchange capacity, and social exchange capacity. The three exchange capacities were convertible, and together constituted LCs through their mutual interactions. With the interaction of the three exchange capacities, relocated households can achieve sustainable livelihoods. Specifically, they can generate and maintain their means of living, enhancing their well-being and that of future generations (Titi and Singh, 1994).
Secondly, the behaviours of relocated households in the emigration and resettlement areas generate disturbances to the environment in multidimensional ways. As relocated households may return to their original homes to practice agriculture, their resource utilization and agricultural production behaviours can continue to disturb the environment in the emigration areas. Relocated households are generally non-farm employed in the resettlement areas, and their living behaviours rather than their production behaviors can affect the resettlement environment. Multiple environmental protection activities are conducted in both areas, such as the Sloping Land Conversion Program in emigration areas and community seminars on environmental protection in resettlement areas. These activities are conducted with the purpose of bringing positive impacts to the environment or can actually contribute to environmental protection. To capture the interactions between relocated households and the environment, we therefore studied their PEBs in relation to multiple anthropogenic disturbances, specifically resource utilisation behaviours, green production behaviours, green living behaviours, and behaviours of participation in environmental protection activities. Resource utilisation behaviours reveal the intensity of use and the dependency of relocated households on natural resources for agricultural production and household consumption, decreases in the environmental disturbance caused by households, and reductions in over-exploitation of natural resources. Green production behaviours and green living behaviours reflect the efforts to reduce non-point pollution and carbon emissions from households’ production and living, reducing the impact of human disturbances, and alleviating environmental degradation caused by inappropriate production. Participation in environmental protection activities refers to the active efforts of households to protect the environment, generating additional ecosystem services that both improve environmental quality and release pressure, changing both the quantity and quality of disturbances.
Thirdly, the interactions between household livelihoods and the environment can create new mutually reinforcing or mutually inhibiting cycles in the ARSP areas. A livelihood is perceived to be sustainable only when it does not undermine the natural resource base, and the availability and accessibility of ecological options are one of the essential options that affect the capacity of people to achieve sustainable livelihoods (Chambers and Conway, 1992; Titi and Singh, 1994; Scoones, 1998). The idea of sustainable livelihoods therefore captures the intricate web of interaction between people’s livelihoods and their environment in which people’s quest for generating and maintaining their living can potentially create both environmental and survival problems. In the ARSP setting, relocated households in emigration areas faced significant “poverty–environment traps,” which occurs because marginal environmental conditions ensure that production on these lands is subject to low yields and soil degradation, while lack of access to markets and infrastructure may constrain the ability of poor households to improve their farming systems and livelihoods or restrict off-farm employment opportunities (Barbier and Hochard, 2019). After emigration, a relocated household can develop a new relationship with the environment through their interaction with the resettlement and emigration areas, which can lead to a good cycle or a vicious one. The correlations between immigrant livelihoods and the environment can be explained as follows. The environment has an impact on the success of exchange entitlements with natural, market and social systems. For example, it can influence agricultural output, the development of a local tourism industry and the social relations with local households. Relocated households can regulate their willingness to implement PEBs based on what they get for their livelihoods, which can have an impact on the environment and thus start a new cycle between their livelihoods and the environment. What is the current relationship between livelihood sustainability and environmental protection in the ARSP area, and can this relationship be optimized? To clarify these questions, we examined the overall, regional, and household distribution characteristics of the strengths and categories of “livelihoods-environment” links and explored the impact of different demographic characteristics on these links.
3 Data and methods
3.1 Study area
This study was conducted in Shaanxi Province, which is typical of the environmentally vulnerable areas in Western China that face serious conflicts between conservation and human development. 74 per cent of the population of China that has been classified as “poor”2 is located in ecologically fragile mountainous areas. To avoid disasters, combat poverty, and restore the environment, the provincial government of Shaanxi has implemented a systematic relocation and settlement program, starting in 2011. It was one of the first provinces in China to carry out such a large-scale relocation and settlement program. In the 13th Five-Year Plan period, Shaanxi planned to move 355,000 households and 1.25 million people, the second largest relocation effort in China3.
We chose research sites from the southern, central and northern regions of Shaanxi. These three regions correspond to the Qinba Mountains, the Guanzhong Plain, and the Loess Plateau, respectively. The three regions provide resettlement areas with different external environments. Central Shaanxi has a flat topography and mild climate, and the highest level of economic development. Southern Shaanxi, the core area of the concentrated serial poverty areas of the Qinba Mountains,4 also has areas of ecological importance and is the origin of the middle route of the South-to -North Water Diversion Project.5 Northern Shaanxi is rich in coal resources and has the second highest level of economic development, but has a vulnerable ecological environment and also has National Key Ecological Function Areas where development is restricted.
3.2 Data sources
Household surveys were conducted from July to October 2021. Based on the number of relocated households in each region,6 we sampled two cities in southern Shaanxi (Shangluo and Ankang), one city in central Shaanxi (Weinan) and one city in northern Shaanxi (Yulin). After several pre-survey visits, two counties were selected in each target city, and 1–2 typical resettlement communities were selected in each target county. To avoid the data being affected by “empty shell” communities, the target communities had to satisfy two criteria: an occupancy rate of >90 per cent and relocated households that had been moved to the communities for at least 1 year. The resettlement communities that we investigated were all centralized urban resettlement communities where the resettled households were from remote villages. In each case, large-scale resettlement had started in 2018, with the majority of households relocating in 2018 or 2019. We used simple random sampling to select households in the target communities, and administered questionnaires to interview the household heads7 who were most familiar with family conditions and had primary responsibility for decision-making. The questionnaires consisted of a set of structured questions about households’ demographic characteristics, livelihood assets and activities, income and expenditure, and pro-environmental perceptions and behaviours.
Multiple measures were taken to ensure data quality and reliability. Firstly, we conducted three pre-surveys, and refined the questionnaire based on the results of each pre-survey. Secondly, we conducted several training sessions for investigators on the administration of the questionnaires, and assigned supervisors to monitor and adjust investigators’ operations during survey. Thirdly, we carried out three rounds of data cleaning and logic checks to identify questionnaires with missing values or inconsistent answers. In the end, 1,285 valid questionnaires were collected, including 772 from southern Shaanxi, 221 from central Shaanxi and 292 from northern Shaanxi.
3.3 Variable design and summary statistics
Livelihood capacity. Drawing on the theory of sustainable livelihoods, we defined LC as the internal capacity of relocated households to adjust proactively to changes in the process of embedding them into various environments in the resettlement area. Natural exchange capacity (NEC) was defined as the capacity of households to obtain material returns by investing capital in nature. Indicators for NEC were related to the scale and specialization of agricultural production (Huang et al., 2014; Wang et al., 2016). Market exchange capacity (MEC) was defined as the capacity of households to trade directly or indirectly with various property rights in a market exchange. Indicators for MEC related to the level, diversity, and stability of incomes (Dev et al., 2016; Hu J. et al., 2018). Social exchange capacity (SEC) was defined as the capacity of households to access resources through the use of social support from social networks. Indicators for SEC related to social networks (Shi et al., 2019; Phan et al., 2020). The variables and indicators of the different livelihood exchange capacities are shown in Table 1.
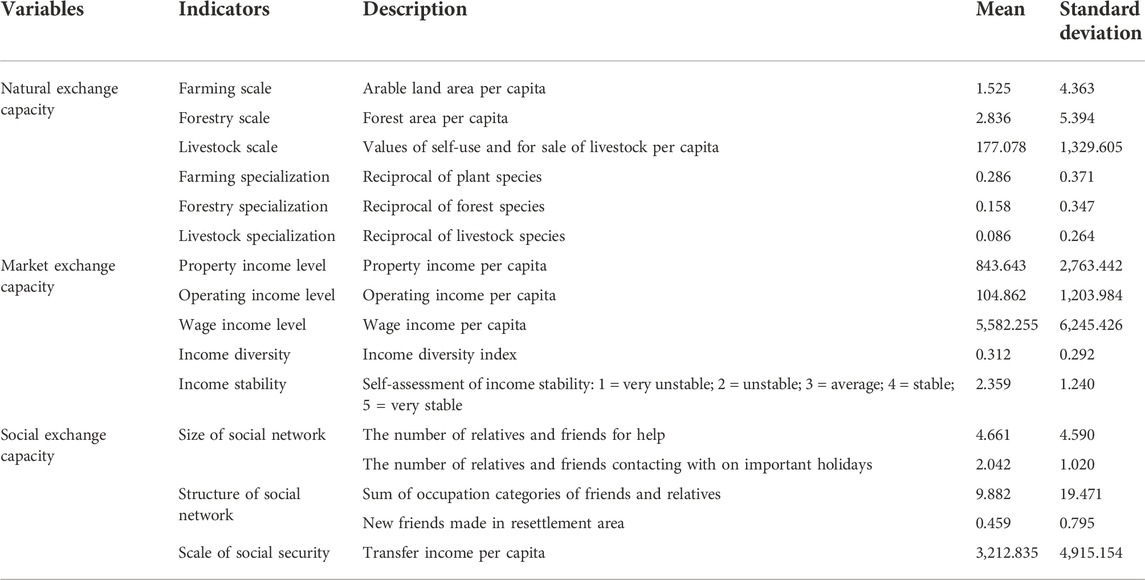
TABLE 1. Variable design and statistics for livelihood exchange capacities.
Pro-environmental behaviour. PEBs in the context of the ARSP include behaviours conducted both in emigration areas and resettlement areas. The variables and indicators of PEBs are shown in Table 2. The indicators for PEBs relate to human–resource interactions (Robinson et al., 2019; Wang et al., 2020), green production (Lange and Dewitte, 2019; Ren et al., 2021), and human disturbances to the urban environment (He and Zhou, 2018; Wang S. et al., 2021).
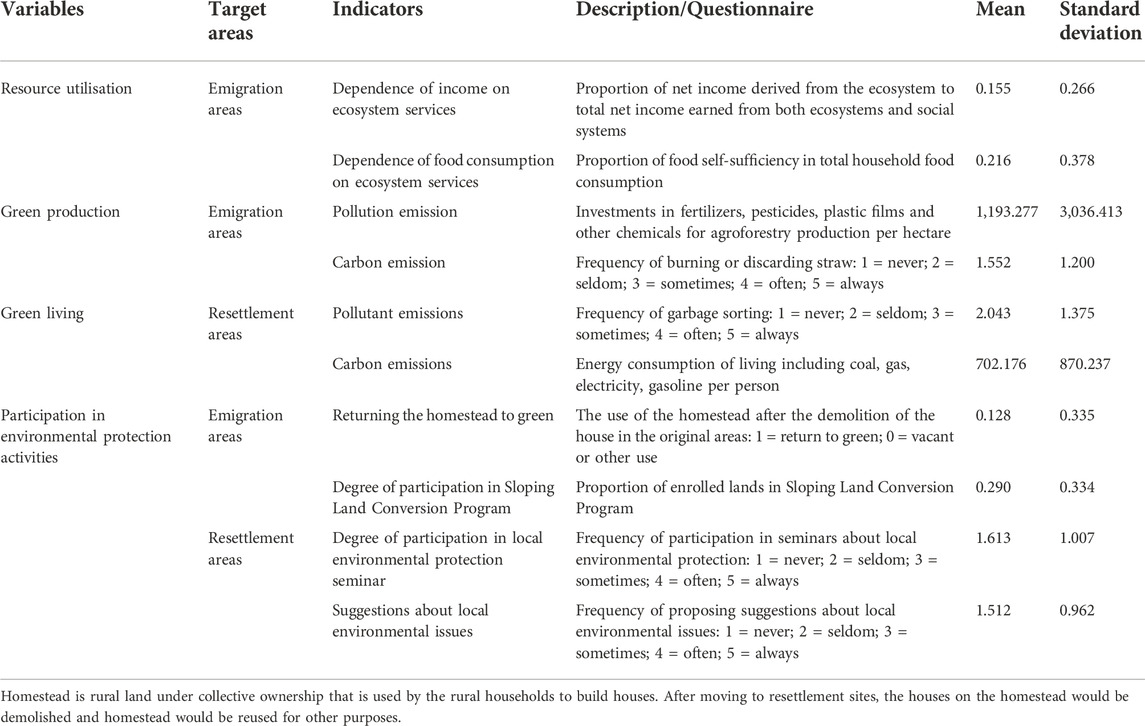
TABLE 2. Variable design and statistics for pro-environmental behaviours.
3.4 Methods
3.4.1 Evaluation method for assessing the strength of the “livelihoods–environment” links
Before calculating the links, LCs and PEBs had to be calculated. PEBs and livelihood exchange capacities were calculated using the entropy method, which can potentially avoid the subjectivity of indicator weighting (Miao and Ding, 2015). For LCs, the convertibility of the three exchange capacities was calculated using the cosine similarity method from the system prediction and decision-making study. Then, LCs were obtained by standardizing the product of the three exchange capacities and convertibility.
We use coupling coordination degree (CCD) to assess the strength of the “livelihoods–environment” links. CCD is an improved indicator of coupling degree (CD). CD can only reflect the degree of interdependence and interaction of different aspects, while CCD can reflect their degree of coordinated development. The calculation method for the CCD was based on the capacity coupling coefficient model in physics. The calculation equations were:
In Eq. 1, C stands for the coupling degree; T stands for the comprehensive index; D stands for the coupling coordination degree; and D∈[0,1] and the larger D is, the stronger the link is between livelihood sustainability and environmental protection. In Eq. 2, LCs stands for livelihood capabilities and PEBs stands for pro-environmental behaviors. In Eq. 3, α and β are the undetermined weights of LCs and PEBs, respectively. LCs and PEBs are considered to be equally important, so α = β = 0.5.
3.4.2 Division methods for the “livelihoods–environment” link categories
In order to reflect different stages of “livelihoods–environment” links, the strengths of the “livelihoods–environment” links were divided into a coordination category and a disorder category according to the value of D, and then divided into 8 sub-categories with 0.1 as the critical distance (Table 3).
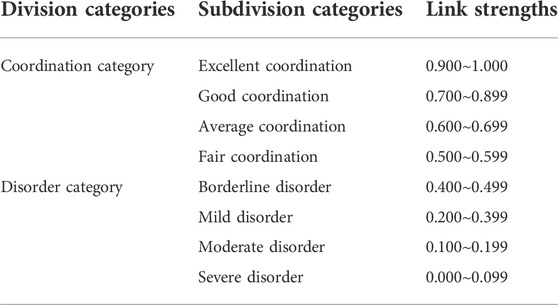
TABLE 3. Divisions of the strength categories of “livelihoods–environment” links.
To compare the differences between the levels of LCs and PEBs under the coordination category and disorder category, six sub-categories were created under the two categories (Table 4). The category of coordinated development of livelihoods and environment is the optimum link category, and the category of deterioration of livelihoods and environment is the worst. With the categories of livelihood priority and environmental degradation, the level of PEBs is lower than the level of LCs. With the categories environmental priority and deterioration of livelihoods categories, the level of LCs is lower than the level of PEBs.
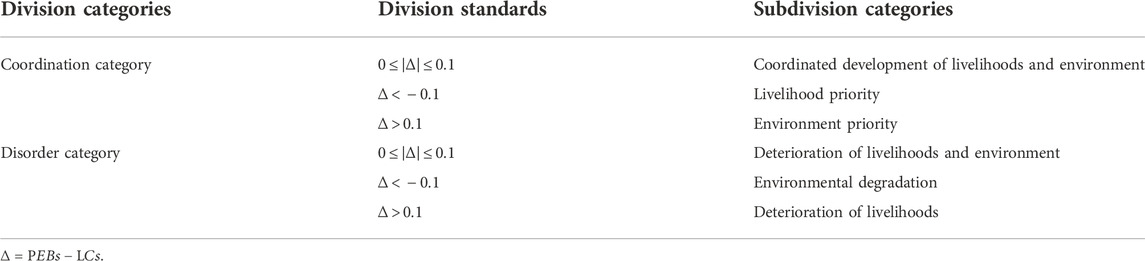
TABLE 4. Divisions of the comparison categories of “livelihoods–environment” links.
3.4.3 Statistical analysis and model assessment
(1) Statistical analysis. Aiming to better understand the overall characteristics of the “livelihoods–environment” links and how they differed between regions, we examined the distribution of the strengths of the “livelihoods–environment” links at the overall and regional levels through violin diagrams, and examined the distribution of strength categories and comparison categories of “livelihoods–environment” links through statistical tables.
To explore how to optimize the “livelihoods–environment” links for vulnerable populations, we tested the differences of means of “livelihoods–environment” link strengths by bivariate correlation tests and examined the distribution of “livelihoods–environment” link strengths of subgroups through box plots. Population groups were divided by the following household characteristics: relocation characteristics, demographic characteristics and livelihood characteristics. We used relocation time to represent the relocation characteristics (Du and Xu, 2016). Demographic characteristics were measured using the level of average education and the proportion of elderly people (Robinson et al., 2019). Livelihood characteristics included loan status, level of asset holdings, and proportion of non-agricultural activities (Robinson et al., 2019; Wang and Wang, 2019).
(2) Model assessment. We conducted several multivariate regression models to see which household factors were significantly associated with “livelihoods–environment” links. These household factors included relocation time, average education level, elderly proportion, the total amount of loans, the level of asset holdings, and the proportion of non-agricultural activities. A dummy region was introduced to all models to control region-level fixed effects (Table 5).
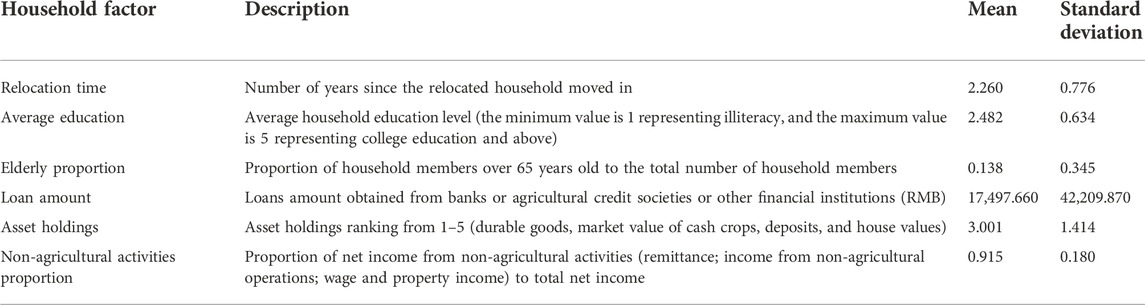
TABLE 5. Description and statistics for household factors.
Multivariate regression models included three models: model I was the baseline regression with the dependent variable being the strengths of the “livelihoods–environment” links; model II was a robustness check of Model I with the dependent variable being the strength categories of “livelihoods–environment” links; and model III was used to investigate the mechanism of the impact of household factors on the “livelihoods–environment” links, in which the comparison categories of “livelihoods–environment” links were the dependent variable. Given that the dependent variables of the three models were respectively a continuous variable, an ordered discrete variable and an unordered discrete variable, we used simple Ordinary Least-Squares (OLS), Ordered Probit (O-probit) and Multinominal Logit (M-logit) to identify the three models, respectively. The three models were expressed as follows8:
To facilitate interpretation of the regression results of model III, we integrated the category of livelihood priority and the category of environmental degradation into the category of lagging environment, and integrated the category of environmental priority and the category of deterioration of livelihoods into the category of lagging livelihoods. We then used the category of deterioration of livelihoods and environment as the regression benchmark for model III.
4 Results
4.1 Distribution of “livelihoods–environment” links for the overall and regional samples
The “livelihoods–environment” links were generally weak in the overall sample. The distribution of the overall sample was in a slender “spindle shape” and the widest part lies below the mean (Figure 2), indicating that relocated households were mainly concentrated below the central level. The extreme values of 0.164 and 0.830 of the overall sample revealed that there was a large dispersion amongst the strengths of the “livelihoods–environment” links. But with a mean value of 0.441 and half of the overall sample between 0.358 and 0.516, the sampled relocated households generally had weak “livelihoods-environment” links.
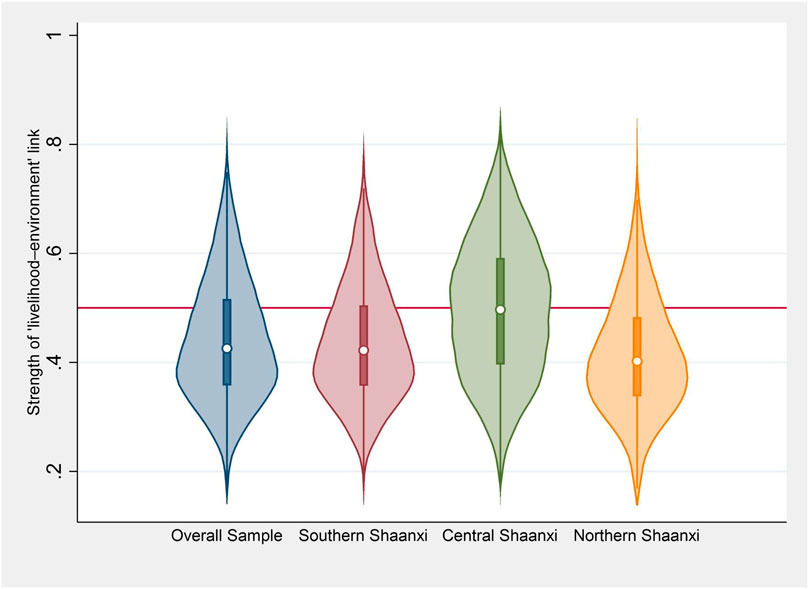
FIGURE 2. The overall and regional distribution of “livelihoods–environment” links. ①Red line represents a link degree of 0.5. ②The differences among three regions are significant at p < 0.01 according to t tests.
The strength of the “livelihoods–environment” links within individual regions were similar to the overall distribution, although central Shaanxi had higher levels than the others. The distributions found in the data from southern Shaanxi, central Shaanxi and northern Shaanxi were also “spindle-shaped,” with a higher density in the middle. The mean values for these three regions were all below 0.5, indicating that the link strengths of regional samples were generally weak, as with the overall sample. The mean value (0.497) in central Shaanxi was higher than that in southern Shaanxi (0.436) and northern Shaanxi (0.414), indicating that central Shaanxi had stronger “livelihoods–environment” links.
4.2 Categories of “livelihoods-environment” links in the overall and regional samples
The overall and regional samples showed that the disorder category was the most common, with the mild and borderline disorder subcategories being the most frequent. The proportion of disorder category in the overall sample was 0.708 (Table 6). The sum of the proportions of severe disorder and moderate disorder categories was 0.007, much smaller than the sum of the proportions of the mild and borderline disorder categories, which was 0.711. At a regional level, in southern Shaanxi, for example, the proportion of disorder category was 0.733, and the sum of the proportions of severe disorder and moderate disorder categories was 0.729, both much higher than the other category/subcategories.

TABLE 6. Proportions of the overall and regional relocated households in strength categories of “livelihoods–environment” links.
The deterioration of livelihoods and environment category was the most frequent category in the overall sample and in southern Shaanxi, indicating that low levels of both livelihood sustainability and environmental protection were most common in the overall sample and in southern Shaanxi. In the overall sample, the category of deterioration of livelihoods and environment was 0.326, much higher than other categories (Table 7). For example, the category of coordinated development of livelihoods and environment was much less frequent, at 0.097. The category of deterioration of livelihoods and environment was 0.387 in southern Shaanxi, which was not only the most common link category in southern Shaanxi, but higher than those in central and northern Shaanxi, at 0.149 and 0.300, respectively. For central and northern Shaanxi, the environmental degradation category was the most frequent category, which shows the most common situation in these two regions was the level of environmental protection was lower than the level of livelihood sustainability. The values for the environmental degradation category were 0.444 and 0.321 in northern and central Shaanxi, respectively, higher than 0.266 for southern Shaanxi.
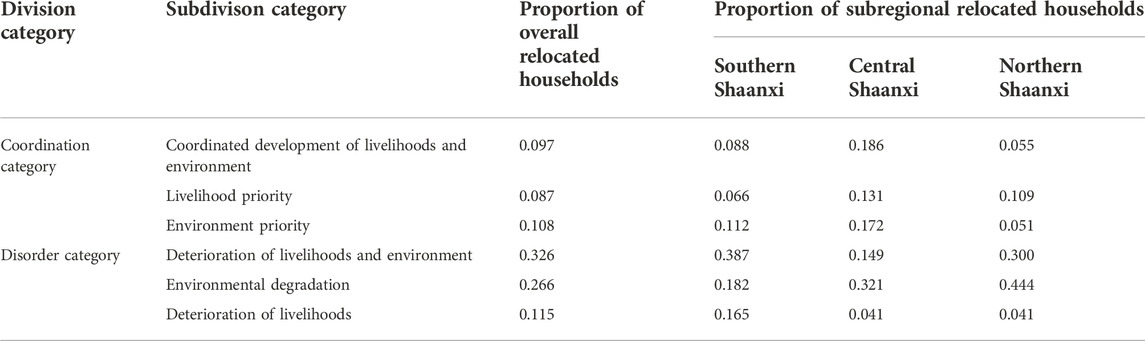
TABLE 7. Proportions of the overall and regional relocated households in comparison categories of “livelihoods–environment” links.
4.3 “Livelihoods–environment” links amongst different household groups
There were significant differences in the strengths of the “livelihoods–environment” link in the different household groups. The means of the “livelihoods–environment” link strengths were significantly higher for households that had been relocated for a longer time, with higher average education and asset holdings, having loans and with lower proportions of the elderly and non-agricultural activities (Figure 3). The result suggests that the levels of relocation time, average education, asset holdings, loan status, proportions of the elderly and non-agricultural activities may be important factors influencing the strength of the “livelihoods–environment” links.
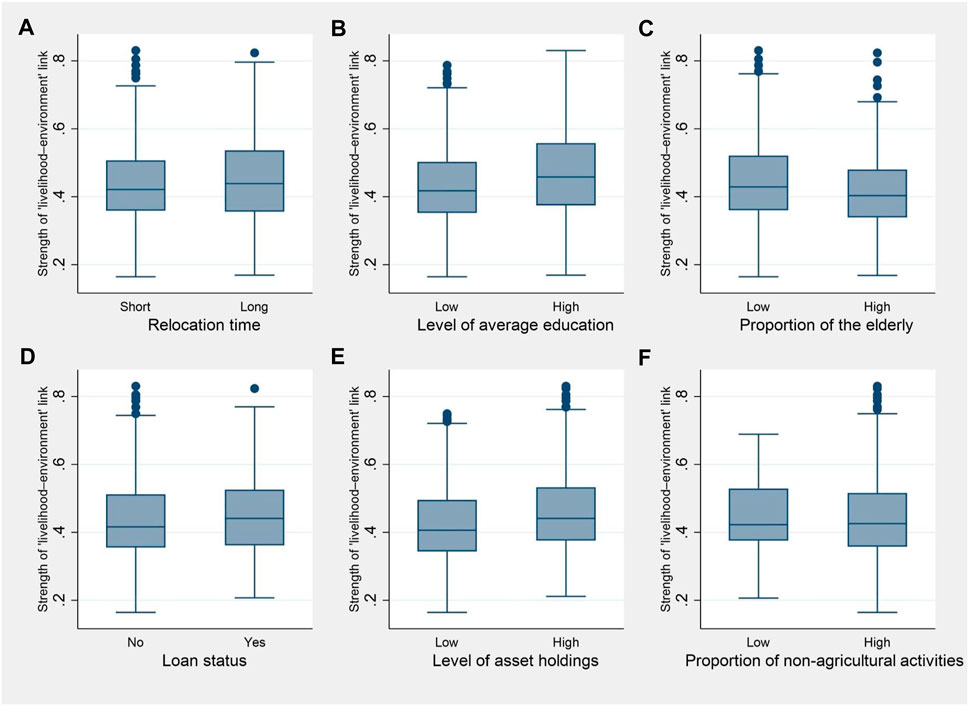
FIGURE 3. Distribution of “livelihoods–environment” links of different household groups (A). Distribution of “livelihoods-environment” links of different relocation time; (B). Distribution of “livelihoods-environment” links of different average education levels; (C). Distribution of “livelihoods-environment” links of different elderly proportions; (D). Distribution of “livelihoods-environment” links of different loan status; (E). Distribution of “livelihoods-environment” links of different levels of asset holdings; (F). Distribution of “livelihoods-environment” links of different proportions of non-agricultural activities. ①Groups of relocation time, average education, asset holdings and non-agriculture activities were divided by means, and the groups of the elderly was divided by 0.5 proportion. ②The means of subgroups were significantly different at p < 0.05 according to a bivariate correlation test.
4.4 Household factors associated with “livelihoods–environment” links
The sign and significance of the independent variables in models I and II were consistent (Table 89), indicating that the results of model I were robust. From the results of model I, all the independent variables except relocation time had significant effects on the strength of the “livelihoods–environment” links. The insignificant effect of relocation time on the strength of the “livelihoods-environment” links may be due to the close proximity of relocation years, with 83.0% of respondents having been relocated in 2018 and 2019. The significant predictors of higher link strengths were higher levels of average education, amount of loan and asset holdings, and lower proportions of the elderly and non-agricultural activities.
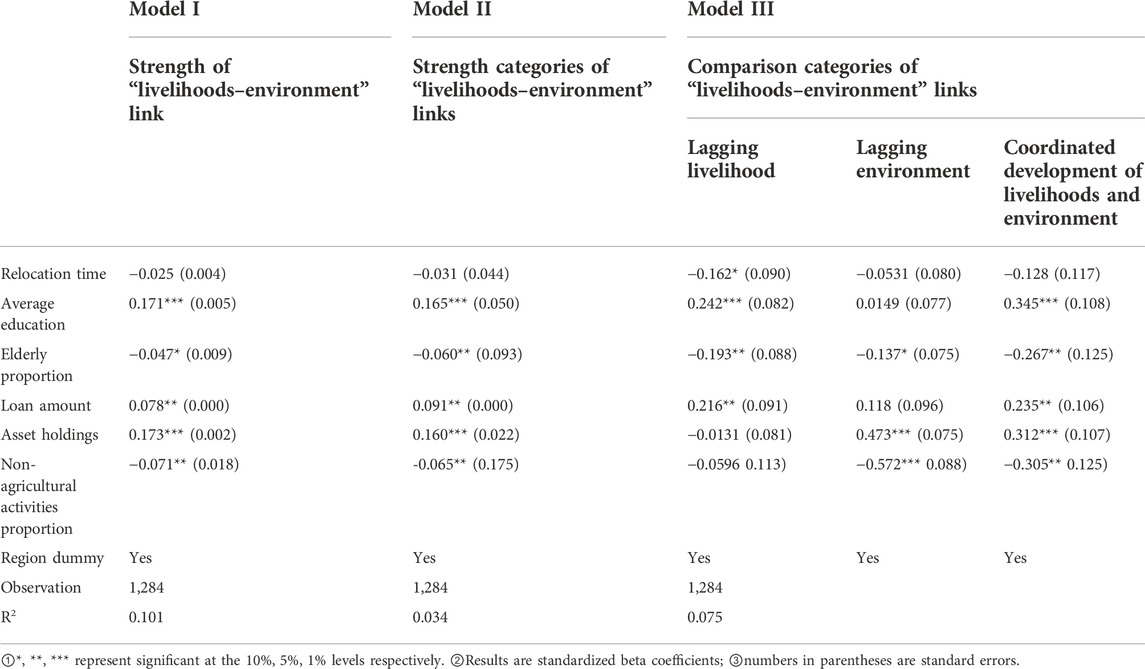
TABLE 8. Household factors associated with “livelihoods–environment” links.
Model III was used to investigate the impact mechanism of household factors on the strength of the “livelihoods–environment” links. The results indicated that the sign and significance of the household factors that resulted in the coordinated development of livelihoods and environment were consistent with Models I and II. For the category of lagging livelihoods, relocation time and the elderly proportion had negative effects, while the level of average education and the amount of loans had positive effects. For lagging environment category, the level of asset holdings had a positive effect, while the elderly proportion and the non-agricultural activities proportion had negative effects.
Putting these results together, average education and loan amount had positive impacts on the strength of the “livelihoods–environment” links through PEBs. Asset holdings had a positive impact and non-agricultural activities proportion had a negative impact on the strength of the links through LCs. The elderly proportion negatively affected link strength through both LCs and PEBs. The positive effect of average education on PEBs may be because a higher level of education leads to greater accessibility to environmental knowledge and a better understanding of the importance of environmental protection, which in turn may lead to a greater interest in improving environmental quality and therefore a greater tendency to implement PEBs (Pothitou et al., 2016). The increase in the amount of loan may reflect the increased financial needs for relocated households engaging in or expanding non- agricultural production activities in urban resettlement sites, as loans specializing in providing small ongoing credit services to impoverished groups are mostly designed to meet their productive needs (e.g., poverty alleviation micro-credit10). Compared to agricultural production activities, non-agricultural activities can reduce the dependence of production and food consumption on ecosystem services, thus reducing pressure on the environment (Kamwi, et al., 2015). The positive effect of asset holdings on LCs illustrated that the higher the level of household socioeconomic status, the greater was the capacity to exchange with nature, markets and social systems, and thus the higher the level of LCs. The negative effect of the non-agricultural activities proportion suggested that the increase in MEC of non-agricultural transition households did not compensate for the loss of NEC, causing a decline in LCs at the overall level. The negative effect of the elderly proportion on both LCs and PEBs may be because elderly people were less interested in acquiring new knowledge and skills than younger people, thus discouraging the development of LCs and the adoption of PEBs.
5 Discussion
We examined the strengths of the “livelihoods–environment” links using LCs and PEBs to highlight household capabilities to sustain livelihoods and the systematic impact of household behaviours on the environment, complementing the micro perspective of the correlations between immigrants’ livelihoods and environmental protection. We have proposed a new evaluation system for LCs, using NEC, MEC, and SEC to construct a full picture of LCs and to make it possible to analyze the changes in LCs from the changes of its intrinsic structure. We also measured PEBs from a multidimensional perspective, namely resource utilisation behaviours, green production behaviours, green living behaviours, and behaviours related to participation in environmental protection activities, to comprehensively reflect the interactions between relocated households and the environment.
For the overall sample, the links were generally weak, with the deterioration of livelihoods and environment category being the most common, which suggests that the low levels of both livelihood sustainability and environmental protection were an important reason for the weakness of the “livelihoods–environment” links. The findings validate concerns expressed in previous studies about the (unintended) negative impacts of resettlement on sustainable livelihoods and environmental protection. Resettlement programs can offer benefits to livelihoods (e.g., livelihood vulnerability reduction, improvements in livelihood security and increase in income) (Liu et al., 2018; Leng et al., 2021; Li et al., 2021), and may result in a better environment (e.g., through reforestation, carbon sequestration and sediment retention) (Raleigh, 2011; Morrissey, 2013; Li et al., 2018), but they also yield (unintended) negative impacts on many aspects of livelihoods (decline in net income due to increased expenditures, lower livelihood resilience and a reduction of social capital) and the environment (pollution of watercourses, pollutant emissions, desertification) (Xue et al., 2013; Yankson et al., 2018; Liu et al., 2020; Yeboah et al., 2020; Hu Y. et al., 2018).
Several aspects hinder the achievement of sustainable livelihoods, including the loss of fertile lands and pastures, constrained employment choices, and breakdown of social support mechanisms. After relocating to urban resettlement sites, some households have abandoned or transferred some or all of their original land due to the distances involved (Li et al., 2021). When they are no longer supported by the land, relocated households have to seek alternative livelihoods, but it is not easy for them to establish a new livelihood in a new location in a short period of time (Li and Wang, 2016). 46.9 per cent immigrants in our survey were unemployed, and 43.9 per cent immigrants relied on welfare jobs (e.g., security, cleaning) or casual labour for cash income11. Such jobs do not require high skill levels and have no age restrictions, but are unstable. With increased expenditure on food, electricity, and healthcare, these jobs may fail to provide a more secure source of income than people’s previous agricultural and off-farm sources. In addition, moving to urban resettlement locations breaks the connections with relatives and friends (Wu et al., 2019), and re-establishing such connections in a new location requires a multi-faceted adaptation process, resulting in lower support from social networks.
The low level of environmental protection may be explained by the competition between agricultural and non- agricultural activities in emigration areas and the lack of adaption to a new life in the resettlement areas. Of the 1,285 respondents to the survey, 741 relocated households (57.7%) returned regularly to the emigration areas to engage in agricultural production. Due to the distances involved, the number of household labourers engaged in agriculture decreased, as those who were previously engaged in agriculture often sought off-farm work opportunities after relocation. Meanwhile, the increasing living cost associated with relocating to towns has put pressure on households to raise incomes. Competition between agricultural and non- agricultural activities for labour and financial inputs may favour more efficient and less time-consuming farming methods and increase the use of pesticides and other agrochemicals (Zhang and Zhao, 2015), leading to soil erosion and land degradation in the emigration areas. In addition to a higher cost of living, moving to towns also requires lifestyle changes. For example, in resettlement communities, household waste has to be sorted and placed in designated bins, but the frequency of waste sorting was low with only 20.2 per cent relocated households of our sample often or always sorting their waste12. On one hand, it was more inconvenient and difficult for relocated households to sort their waste than the simple and casual waste disposal in their original rural areas. On the other hand, there is the possibility that relocated households struggling to earn a living place less emphasis on the public community environment. Relocated households also had low frequencies of participation in local environmental protection seminars and proposals for improving local environmental issues (Table 2). Such actions, which suggest a lack of interest in protecting the environment, are unlikely to lead to environmental protection.
The results of the regional distribution of “livelihoods–environment” links show that the low levels of both livelihood sustainability and environmental protection were most common in southern Shaanxi, and for central and northern Shaanxi, the level of environmental protection was lower than the level of livelihood sustainability. These results indicate that all three regions face little or no environmental protection. As the ecological environment in southern and northern Shaanxi is more fragile than in central Shaanxi, increased environmental pressures and environmental degradation caused by the lack of environmental protection will exacerbate environmental problems, hindering the sustainability of the livelihoods of relocated households. This strongly suggests the need to strengthen “livelihoods–environment” links, especially in environmentally fragile areas.
Based on our findings of an association between household factors and the strength of the “livelihoods–environment” links, we offer the following policy suggestions. For relocated households with a low level of LCs, the local government should develop more employment opportunities to help them achieve re-employment in resettlement areas. Immigrants experiencing difficulty in finding gainful employment (for instance, those with low education levels and facing restrictions because of their age) should be allocated public welfare jobs to guarantee a stable income source. Local governments should explore the possibility of additional subsidies to enable participation in ecological compensation projects and asset income methods, both of which would increase the sources of income for households. This would increase the accumulation of production tools and financial assets, providing basic protection during the process of livelihood transformation. For relocated households that adopt fewer PEBs, the promotion of environmental protection should be expanded through continuing education to increase the knowledge of young and middle-aged immigrants about the importance and role of environmental protection and to raise their awareness of environmental risks. Environmental awareness campaigns for the elderly should be organized in order to draw the attention of more elderly migrants to the community environment. Financial credit should be provided to subsidize green production practices and support their transition to non-farm businesses. For relocated households who have done well both in livelihood sustainability and environmental protection, they should continue to enhance their learning of new technologies and make full use of information, develop green and efficient production methods in agricultural production, and improve their labour skills in non-agricultural employment. These would all help increase their prosperity. Relocated households that perform poorly in livelihood sustainability and environmental protection, should be given greater attention by local government, with stronger support policies for skills training and financial subsidies to reduce their risk of returning to poverty with the consequent risk of a return to the position of livelihood improvement through the destruction of the environment.
We have identified some limitations to our work. First, although the questionnaire was designed with multiple questions that are semantically similar or completely opposite to ensure the reliability of respondents’ answers, there is a possibility that respondents exaggerated their negative experiences (e.g., loss of land, income stability) or underestimated the values of the benefits they have received (e.g., income levels, productive capitals, external support). The questionnaire also did not address the willingness of households to emigrate: whether they chose to or whether they were moved against their will. Another limitation relates to data analysis. In the regression analysis, household factors cannot strongly explain the strength of the “livelihoods–environment” links according to the low value of R-squared. In addition, we examined the strength of the “livelihoods–environment” links from a holistic perspective and we did not analyze the heterogeneity of the links in emigration areas and resettlement areas. Future studies will explore the impact mechanisms of the strength of the “livelihoods–environment” links to find the key influential variables and will examine and compare the links in emigration and resettlement areas to provide more targeted recommendations for its optimisation.
6 Conclusion
This is one of the few studies that attempts to combine livelihood sustainability and environmental protection together from a micro perspective to explore their links in the ARSP setting. We used LCs and PEBs to represent livelihood sustainability and environmental protection respectively. Using Shaanxi as an example, we examined the strengths and categories of links at the overall, regional and household levels and explored the impact of household factors on the links.
The following key conclusions can be drawn. 1) At an overall level, the strengths of the “livelihoods–environment” links were generally weak. The deterioration of livelihoods and environment category was the most frequent subcategory in comparison categories, suggesting that low levels of both livelihood sustainability and environmental protection are important reasons for the weakness of the links. In the different categories, the disorder category was the most common, with the mild and borderline disorder subcategories being the most frequent subcategory. 2) At the regional level, the strength of the “livelihoods–environment” links were generally low in each individual region, with central Shaanxi having stronger “livelihoods–environment” links than others. In the comparison categories, the deterioration of livelihoods and environment category was the most frequent category in southern Shaanxi, and the environmental degradation category was the most frequent category in central and northern Shaanxi, suggesting that all regions face a lack of environmental protection and that environmental problems may be more prominent in ecologically fragile areas. 3) At the household level, different demographic groups have significant differences in the strength of the “livelihoods–environment” links, and higher levels of average education, loan amount and asset holdings, as well as lower proportions of the elderly and non-agricultural activities are associated with stronger “livelihoods–environment” links. At this scale, average education level and the amount of loans have positive impacts on links by affecting PEBs, and asset holdings and the proportion of non-agricultural activities respectively have a positive and a negative impact on links by affecting the LCs. The proportion of elderly household members has a negative impact on the links by affecting both LCs and PEBs. These results may provide a baseline for other developing countries trying to promote the coordinated development of livelihood sustainability and environmental protection. Such coordination is required if the 2030 agenda is to be implemented successfully.
Data availability statement
The data that support the findings of this study are available upon reasonable request.
Author contributions
MG and CL contributed to conception and design of the study, and wrote the first draft of the manuscript. MG, GW, and JI contributed revisions and proofreading. All authors contributed to manuscript revision, read, and approved the submitted version.
Funding
This work was supported by the National Natural Science Foundation of China under Grant 71973104, 72022014; The Youth Innovation Team of Shaanxi Universities State Scholarship Fund of China Scholarship Council under grant 202106280157; and Doctoral Dissertation Scholarship program of China Rural Research Institute, Tsinghua University under Grant 202010.
Conflict of interest
The authors declare that the research was conducted in the absence of any commercial or financial relationships that could be construed as a potential conflict of interest.
Publisher’s note
All claims expressed in this article are solely those of the authors and do not necessarily represent those of their affiliated organizations, or those of the publisher, the editors and the reviewers. Any product that may be evaluated in this article, or claim that may be made by its manufacturer, is not guaranteed or endorsed by the publisher.
Footnotes
1This information is retrieved from the State Council Information Office, http://www.gov.cn/xinwen/2020-12/03/content_5566758.htm
2Households whose annual income does not reach the 2011 constant price of RMB 2,300 are classified as “poor.”
3The data of relocation size comes from Shaanxi “13th Five” [Year Plan] Anti-poverty Relocation and Settlement Plan. http://www.changwu.gov.cn/gk/gk2702/10022.htm
4One of the 11 concentrated serial poverty areas of China.
5This project is designed to deliver high quality water to arid North China.
6These data come from Shaanxi “13th Five” [Year Plan] Anti-poverty Relocation and Settlement Plan. http://zrzyj.hancheng.gov.cn:9003/index.php?c=show&id=1632
7When the nominal head of the household has migrated out, we interviewed the actual head, who has the power to make decisions for the household.
8Since there is no analytic expression for the cumulative distribution function of the standard normal, it was expressed as
9Due to missing values, the regression sample size was 1284. The results were presented as standardized beta coefficients.
10Poverty alleviation micro-credit is a loan that supports poor households with a willingness to borrow for industrial development and cannot be used for daily consumption.
11These percentages were calculated from the three data sets of occupation categories, health status and age in the questionnaire. The percentages are proportions of the labour force that are unemployed, or have welfare jobs and causal jobs, to the total labour force of our survey. The labour force consists of immigrants aged 16 to 59 whose health status enables them to work.
12The proportion is calculated based on the question in the questionnaire about the frequency of sorting waste.
References
Barbier, E., and Hochard, J. (2019). Poverty-environment traps. Environ. Resour. Econ. 74, 1239–1271. doi:10.1007/s10640-019-00366-3
Barr, S., Shaw, G., and Coles, T. (2011). Sustainable lifestyles: Sites, practices, and policy. Environ. Plan. A 43 (12), 3011–3029. doi:10.1068/a43529
Chambers, R., and Conway, G. (1992). Sustainable rural livelihoods: Practical concepts for the 21st century. IDS discussion paper 296. London: Institute of Development Studies.
Chambers, R. (2006). Vulnerability, coping and policy (editorial introduction). IDS Bull. 37 (4), 33–40. doi:10.1111/j.1759-5436.2006.tb00284.x
Coleman, J. (1990). Foundations of social theory. Cambridge: The Belknap Press of Harvard University Press.
Department for International Development (1999). Sustainable livelihood guidance sheet. UK: Department for International Development.
Dev, T., Sultana, N., and Hossain, M. (2016). Analysis of the impact of income diversification strategies on food security status of rural households in Bangladesh: A case study of rajshahi district. Am. J. Theor. Appl. Bus. 2, 46–56. doi:10.11648/j.ajtab.20160204.13
Du, S., and Xu, J. (2016). Study on the sustainable livelihood problems of land-loss farmers from the perspective of endogenous development. Econ. 28 (7), 76–83. doi:10.16158/j.cnki.51-1312/f.2016.07.010
Finco, M. (2009). Poverty-environment trap: A non-linear probit model applied to rural areas in the north of Brazil. American-Eurasian J. Agric. Environ. Sci. 5 (4), 533–539.
Ghai, D. (1994). Environment, livelihood and empowerment. Dev. Change 25, 1–11. doi:10.1111/j.1467-7660.1994.tb00507.x
Gomersall, K. (2020). Imposition to agonism: Voluntary poverty alleviation resettlement in rural China. Polit. Geogr. 82, 102250. doi:10.1016/j.polgeo.2020.102250
Guo, L., Yang, B., and Chi, Y. (2017). Influence factors of farmers’ willingness to poverty alleviation relocation in south Shaanxi province. Asian Agric. Res. 9 (12), 17–22. doi:10.22004/ag.econ.271223
Halaburda, M., and Bernaciak, A. (2020). Environmental protection in the perspective of CSR activities undertaken by polish enterprises of the construction industry. Econ. Environ. 75 (4), 122–133. doi:10.34659/2020/4/37
He, X., and Zhou, K. (2018). Environmental behavior of peasants merging into cities: Empirical evidence from CGSS (2013). J. Dalian Univ. Technol. Soc. Sci. 39 (5), 51–59. doi:10.19525/j.issn1008-407x.2018.05.007
Hu, J., Wen, C., and Fan, Y. (2018a). Livelihood capital, livelihood risk assessment and sustainable livelihood of rural migrants in ethnic minority areas. Econ. Manag. 32 (5), 30–37.
Hu, Y., Zhou, W., and Yuan, T. (2018b). Environmental impact assessment of ecological migration in China: A survey of immigrant resettlement regions. J. Zhejiang Univ. Sci. A 19 (3), 240–254. doi:10.1631/jzus.A1600669
Huang, J., Jiang, J., Wang, J., and Hou, L. (2014). Crop diversification in coping with extreme weather events in China. J. Integr. Agric. 13 (4), 677–686. doi:10.1016/S2095-3119(13)60700-5
Hunter, L. (2000). A comparison of the environmental attitudes, concern, and behaviors of native-born and foreign-born U.S. Residents. Popul. Environ. 21, 565–580. doi:10.1007/BF02436772
Kamwi, J., Chirwa, P., Manda, S., Graz, F., and Christoph, K. (2015). Livelihoods, land use and land cover change in the Zambezi Region, Namibia. Popul. Environ. 37, 207–230. doi:10.1007/s11111-015-0239-2
Korf, B., and Oughton, E. (2006). Rethinking the European countryside—Can we learn from the South? J. Rural Stud. 22 (3), 278–289. doi:10.1016/j.jrurstud.2005.09.005
Lange, F., and Dewitte, S. (2019). Measuring pro-environmental behavior: Review and recommendations. J. Environ. Psychol. 63, 92–100. doi:10.1016/j.jenvp.2019.04.009
Leng, G., Feng, X., and Qiu, H. (2021). Income effects of poverty alleviation relocation program on rural farmers in China. J. Integr. Agric. 20 (4), 891–904. doi:10.1016/S2095-3119(20)63583-3
Li, C., Zheng, H., Li, S., Chen, X., Li, J., Zeng, W., et al. (2015). Impacts of conservation and human development policy across stakeholders and scales. Proc. Natl. Acad. Sci. U. S. A. 112 (24), 7396–7401. doi:10.1073/pnas.1406486112
Li, C., Li, S., Feldman, M., Li, J., Zheng, H., and Daily, G. (2018). The impact on rural livelihoods and ecosystem services of a major relocation and settlement program: A case in Shaanxi, China. Ambio 47 (2), 245–259. doi:10.1007/s13280-017-0941-7
Li, C., Guo, M., Li, S., and Feldman, M. (2021). The impact of the anti-poverty relocation and settlement program on rural households’ well-being and ecosystem dependence: Evidence from Western China. Soc. Nat. Resour. 34 (1), 40–59. doi:10.1080/08941920.2020.1728455
Li, P., and Wang, X. (2016). Ecological migration, development and transformation. Berlin: Springer.
Liu, J., and Diamond, J. (2008). Revolutionizing China’s environmental protection. Science 319 (5859), 37–38. doi:10.1126/science.1150416
Liu, W., Xu, J., and Li, J. (2018). Livelihood vulnerability of rural households under poverty alleviation relocation in southern Shaanxi China. Resour. Sci. 10 (8), 2002–2014. doi:10.18402/resci.2018.10.09
Liu, W., Li, J., and Xu, J. (2020). Impact of the ecological resettlement program in southern Shaanxi province, China on households’ livelihood strategies. For. Policy Econ. 120 (2), 102310. doi:10.1016/j.forpol.2020.102310
Lo, K., and Wang, M. (2018). How voluntary is poverty alleviation resettlement in China? Habitat Int. 73, 34–42. doi:10.1016/j.habitatint.2018.01.002
Lo, K., Xue, L., and Wang, M. (2016). Spatial restructuring through poverty alleviation resettlement in rural China. J. Rural Stud. 47 (B), 496–505. doi:10.1016/j.jrurstud.2016.06.006
Miao, C., and Ding, M. (2015). Social vulnerability assessment of geological hazards based on entropy method in Lushan earthquake-stricken area. Arab. J. Geosci. 8 (12), 10241–10253. doi:10.1007/s12517-015-1945-x
Morrissey, J. (2013). Understanding the relationship between environmental change and migration: The development of an effects framework based on the case of northern Ethiopia. Glob. Environ. Change 23 (6), 1501–1510. doi:10.1016/j.gloenvcha.2013.07.021
Moss, A., Jensen, E., and Gusset, M. (2017). Probing the link between biodiversity-related knowledge and self-reported proconservation behavior in a global survey of zoo visitors. Conserv. Lett. 10 (1), 33–40. doi:10.1111/conl.12233
National Development and Reform Commission (2016). National ‘13th five plan’ year plan anti-poverty relocation and settlement program plan. Avaliable at: http://www.gov.cn/xinwen/2016-10/31/5126509/files/86e8eb65acf44596bf21b2747aec6b48.pdf (accessed August 10, 2022).
Nilsson, M., Griggs, D., and Visbeck, M. (2016). Policy: Map the interactions between sustainable development goals. Nature 534, 320–322. doi:10.1038/534320a
Pfeffer, M., and Stycos, J. (2002). Immigrant environmental behaviors in New York City. Soc. Sci. Q. 83 (1), 64–81. doi:10.1111/1540-6237.00071
Phan, C., Sun, S., Zhou, Z., and Beg, R. (2020). Does microcredit improve rural households' social network? Evidence from vietnam. J. Dev. Stud. 56 (2), 1947–1963. doi:10.1080/00220388.2020.1725485
Pothitou, M., Hanna, R., and Chalvatzis, K. (2016). Environmental knowledge, pro-environmental behaviour and energy savings in households: An empirical study. Appl. Energy 184, 1217–1229. doi:10.1016/j.apenergy.2016.06.017
Raleigh, C. (2011). The search for safety: The effects of conflict, poverty and ecological influences on migration in the developing world. Glob. Environ. Change 21 (S1), S82–S93. doi:10.1016/j.gloenvcha.2011.08.008
Regen, T. (1984). Earthbounk: New introduction essays in environmental ethics. Chicago: Random House.
Ren, L., Li, J., Li, C., and Dang, P. (2021). Can ecotourism contribute to ecosystem? Evidence from local residents’ ecological behaviors. Sci. Total Environ. 757, 143814. doi:10.1016/j.scitotenv.2020.143814
Robinson, B., Zheng, H., and Peng, W. (2019). Disaggregating livelihood dependence on ecosystem services to inform land management. Ecosyst. Serv. 36, 100902. doi:10.1016/j.ecoser.2019.100902
Rogers, S., Li, J., Lo, K., Guo, H., and Li, C. (2020). China’s rapidly evolving practice of poverty resettlement: Moving millions to eliminate poverty. Dev. Policy Rev. 38 (5), 541–554. doi:10.1111/dpr.12435
Savari, M., and Zhoolideh, M. (2021). The role of climate change adaptation of small-scale farmers on the households food security level in the west of Iran. Dev. Pract. 31 (3), 650–664. doi:10.1080/09614524.2021.1911943
Sawitri, D., Hadiyanto, H., and Hadi, S. (2015). Pro-environmental behavior from a social cognitive theory perspective. Procedia Environ. Sci. 23, 27–33. doi:10.1016/j.proenv.2015.01.005
Scoones, I. (1998). Sustainable rural livelihoods: A framework for analysis. IDS working paper 72. Brighton: IDS.
Shi, G., and Zhou, J. (2018). Factors of farmers’ relocation willingness of poverty alleviation in Western mountain areas. J. Hohai Univ. (Philosophical Soc. Sci. Ed. 220 (2), 23–31. doi:10.3876/j.issn.1671-4970.2018.02.004
Shi, H., Zhao, Y., and Wu, H. (2019). Research on the influence of social capital on multidimensional poverty: Evidence from 513 farmer households in Yan’an City. J. Agrotechnical Econ. (1), 88–99. doi:10.13246/j.cnki.jae.2019.01.007
Smit, B., and Wandel, J. (2006). Adaptation, adaptive capacity and vulnerability. Glob. Environ. Change 16 (3), 282–292. doi:10.1016/j.gloenvcha.2006.03.008
Steibl, S., and Laforsch, C. (2019). Disentangling the environmental impact of different human disturbances: A case study on islands. Sci. Rep. 9, 13712. doi:10.1038/s41598-019-49555-6
Takahashi, B., and Selfa, T. (2015). Predictors of pro-environmental behavior in rural American communities. Environ. Behav. 47 (8), 856–876. doi:10.1177/0013916514521208
Titi, V., and Singh, N. (1994). Adaptive strategies of the poor in Arid and Semi-Arid lands: In search of sustainable livelihoods. International Institute for Sustainable Development working Paper. Winnipeg: International Institute for Sustainable Development.
Vogel, C., and O’Brien, K. (2004). Vulnerability and global environmental change: Rhetoric and reality. in Information Bulletin on Global Environmental Change and Human Security, 13. Ottawa: Environmental Change and Security Project and the International Development Research Centre.
Wang, X., Huang, J., and Rozelle, S. (2016). Off-farm employment and agricultural specialization in China. China Econ. Rev. 42 (C), 155–165. doi:10.1016/j.chieco.2016.09.004
Wang, R., Zhao, X., Liu, J., Wang, X., Lan, H., and Xue, B. (2020). Dependence of farmers’ livelihoods on environmental resource in key ecological function area: A case study of gannan plateau, China. Chin. J. Appl. Ecol. 31 (2), 554–562. doi:10.13287/j.1001-9332.202002.016
Wang, W., Zhang, C., Guo, Y., and Xu, D. (2021a). Impact of environmental and health risks on rural households’ sustainable livelihoods: Evidence from China. Int. J. Environ. Res. Public Health 18 (10), 10955. doi:10.3390/ijerph182010955
Wang, S., Zhou, H., Hua, G., and Wu, Q. (2021b). What is the relationship among environmental pollution, environmental behavior, and public health in China? A study based on cgss. Environ. Sci. Pollut. Res. 28 (16), 20299–20312. doi:10.1007/s11356-020-11951-1
Wang, Z., and Wang, L. (2019). Can precise poverty alleviation improve the sustainable livelihoods of rural poor households? Based on the survey of 70 countries in Shaanxi province. Issues Agric. Econ. 30 (4), 71–87. doi:10.13246/j.cnki.iae.2019.04.009
Wei, A., and Li, X. (2020). The study on type comparison and internal differences of resilience construction. J. Central South Univ. Soc. Sci. 26 (5), 177–189.
Wilmsen, B., and Wang, M. (2015). Voluntary and involuntary resettlement in China: A false dichotomy? Dev. Pract. 25 (5), 612–627. doi:10.1080/09614524.2015.1051947
Wolters, E. (2014). Attitude–behavior consistency in household water consumption. Soc. Sci. J. 51 (3), 455–463. doi:10.1016/j.soscij.2013.10.003
Wu, R., Huang, X., Li, Y., Liu, Y., and Liu, Y. (2019). Deciphering the meaning and mechanism of migrants’ and locals’ neighborhood attachment in Chinese cities: Evidence from Guangzhou. Cities Lond. Engl. 85, 187–195. doi:10.1016/j.cities.2018.09.006
Xue, L., Wang, M., and Xue, T. (2013). ‘Voluntary’ poverty alleviation resettlement in China. Dev. Change 44 (5), 1159–1180. doi:10.1111/dech.12054
Yankson, P., Asiedu, A., Owusu, K., Urban, F., and Siciliano, C. (2018). The livelihood challenges of resettled communities of the Bui dam project in Ghana and the role of Chinese dam-builders. Dev. Policy Rev. 36 (S1), O476–O494. doi:10.1111/dpr.12259
Yeboah, A., Baah-Ennumh, T., and Okumah, M. (2020). Understanding the economic, socio-cultural, and environmental impacts of resettlement projects. Afr. Geogr. Rev. 41 (1), 71–92. doi:10.1080/19376812.2020.1850299
Zhang, F., and Zhao, X. (2015). A review of ecological effect of peasant’s livelihood transformation in China. Acta eco. Sin. 35 (10), 3157–3164. doi:10.5846/stxb201406081181
Keywords: livelihood sustainability, environmental protection, anti-poverty, resettlement, China
Citation: Guo M, Li C, Wang G and Innes JL (2022) Examining the links between livelihood sustainability and environmental protection in the anti-poverty relocation and settlement program areas: An empirical analysis of Shaanxi, China. Front. Environ. Sci. 10:1047223. doi: 10.3389/fenvs.2022.1047223
Received: 17 September 2022; Accepted: 17 November 2022;
Published: 02 December 2022.
Edited by:
Zhen Wang, Huazhong Agricultural University, ChinaReviewed by:
Yingya Yang, Anyang Institute of Technology, ChinaRongrong Xiao, Tianjin University of Technology, China
Copyright © 2022 Guo, Li, Wang and Innes. This is an open-access article distributed under the terms of the Creative Commons Attribution License (CC BY). The use, distribution or reproduction in other forums is permitted, provided the original author(s) and the copyright owner(s) are credited and that the original publication in this journal is cited, in accordance with accepted academic practice. No use, distribution or reproduction is permitted which does not comply with these terms.
*Correspondence: Guangyu Wang, Z3Vhbmd5dS53YW5nQHViYy5jYQ==