 Gang Yin
 Zhuo Zhang
 Bojun Zhu
 Qingxiang Li
 Min Mao1
 Zengyun Hu
 Xi Chen
- 1College of Geography and Remote Sensing Sciences, Xinjiang University, Urumqi, China
- 2Xinjiang Key Laboratory of Oasis Ecology, Xinjiang University, Urumqi, China
- 3Meteorological Center of North China Regional Air Traffic Management Bureau of CAAC, Beijing, China
- 4School of Atmospheric Sciences and Key Laboratory of the Tropical Atmosphere-Ocean System, Ministry of Education, Sun Yat-Sen University, Zhuhai, China
- 5Urumqi Meteorological Satellite Ground Station, Urumqi, Xinjiang, China
- 6State Key Laboratory of Desert and Oasis Ecology, Xinjiang Institute of Ecology and Geography, Chinese Academy of Sciences, Urumqi, China
- 7Research Center for Ecology and Environment of Central Asia, Chinese Academy of Sciences, Urumqi, China
- 8College of Resources and Environment, University of Chinese Academy of Sciences, Beijing, China
Owing to global warming, extreme precipitation events in the arid regions of Central Asia have increased, resulting in significant consequences for water resources and ecosystems. Hence, to address the features and corresponding physical mechanisms of these rainstorms, we examined the rainstorm that occurred in Hotan, Xinjiang in June 2021 as a case study. We employed multiple datasets, including meteorological stations, sounding observations, satellite precipitation data, and reanalysis datasets. The results indicate that the Global Precipitation Measurement satellite precipitation product accurately captured the temporal and spatial variations in this rainstorm, as verified against hourly in situ observation data. Some meteorological stations recorded values greater than twice their historical records, such as Luopu, Pishan, Moyu, and Hotan. Moreover, the duration of the precipitation was longer than 2 days. For the physical mechanisms of this rainstorm, the water vapor in this rainstorm is sourced from the 45°–65°N region of the North Atlantic Ocean crosses the Ural Mountains and the West Siberian Plain to southern Xinjiang. The low-pressure levels (e.g., 700 hPa and 850 hPa) have the more water vapor flux and specific humidity than the high-pressure levels. Our findings can aid the understanding of extreme precipitation events in Central Asia and provide a reference for dealing with meteorological disasters, including extreme precipitation, in the context of global climate change.
1 Introduction
Rainstorms are a common weather disaster and often lead to soil erosion and flooding (Wang et al., 2020; Wu et al., 2021), resulting in casualties and property loss. Thus, mechanistic investigations and numerical forecasts regarding rainstorms have received extensive attention over the past few decades. Moreover, owing to global warming, extreme weather phenomena, including severe droughts and heavy precipitation, have occurred more frequently and with greater intensity during the past decade (Kunkel et al., 2013; Duan et al., 2015); furthermore, extreme precipitation has begun to occur in arid and semi-arid areas (Rinat et al., 2019, 2021; Dayan et al., 2021). The arid regions of Central Asia, which are in the hinterland of Eurasia, have complex terrain, geomorphic features, and an arid and semi-arid climate system controlled by westerly circulation (Lioubimtseva and Cole, 2006; Chen and Zhou, 2015; Hu et al., 2018; Hu et al., 2021a). In these regions, moisture fluxes are mainly sourced from the Atlantic and Arctic Oceans (Schiemann et al., 2008; Chen et al., 2018). Evaporation is much higher than precipitation, causing vulnerability in ecosystems and lake water resources, which is exacerbated by changes in temperature and precipitation (Hu et al., 2021b; Hu et al., 2022a).
In recent decades, the temperature has shown a significant positive trend, and precipitation has increased overall (Hu et al., 2014; 2016a, 2017). Variations in precipitation in Central Asia have been proven to significantly impact terrestrial water resources (Hu et al., 2021a; 2021b; 2022a; Zhou et al., 2022) and the spatiotemporal patterns in vegetation coverage and biomass (Yin et al., 2016; Zhang et al., 2016). However, owing to global warming, extreme climate events, including extreme precipitation, are increasing (Tank et al., 2006; Gessner et al., 2014; Hu et al., 2016b). Therefore, investigating the characteristics and factors contributing to extreme precipitation events, including rainstorms, is necessary to gain a better understanding of the water circulation and ecosystems.
Xinjiang Province in China is an important part of the arid regions along the Silk Road in Central Asia (Hu et al., 2019a). It is located inland and far from any oceans, has complex mountains and basins, is adjacent to the Qinghai-Tibet Plateau, and receives minimal precipitation. Southern Xinjiang is particularly dry all year because the potential evaporation is much higher than precipitation (Hu et al., 2021b). Owing to global warming, extreme weather events, including severe droughts and heavy precipitation, have become more frequent and intense during the past decade, and extreme precipitation has begun to occur in arid areas (Zhang et al., 2012; Wang et al., 2013). Yang et al. (2022) examined the characteristics of warm-season rainstorms in southern Xinjiang over the past 60 years, and their results showed increased frequencies, expanded ranges, and strengthened intensities.
In the past decade, approximately 36% of meteorological disasters in Xinjiang were caused by local rainstorms, which annually resulted in as many as 45 flood disasters on average (Xie et al., 2018). In the desert ecosystems of Xinjiang, extreme precipitation primarily increases the above-ground net primary production by increasing the density, rather than the height and species richness, of the ephemeral community (Zang et al., 2021).
Recent studies have explored the characteristics of rainstorms in Xinjiang Province and their corresponding physical mechanisms. Generally speaking, synoptic systems that cause rainstorms in Xinjiang include the “two-ridge-and-one-trough” circulation background in middle and high latitudes (Zhang et al., 2018; Huang et al., 2020) and the “double-high” South Asian High in the upper troposphere (Huang et al., 2019, 2020; Feng et al., 2021; Li et al., 2022), while necessary water vapor primarily originates from the Caspian Sea, Aral Sea, and Lake Balkhash (Zhang et al., 2018; Huang et al., 2019; Xirenayi et al., 2020Li et al., 2022). A study of three different rainstorms (Yang et al., 2012) indicated an non-negligible role played by the low-level easterly jet (LLEJ) blowing from Gansu Province, the coverage and strength of which contributed to various features of those precipitation cases by controlling the horizontal vapor transportation. Similar conclusions were summarized in the comparative analysis of two extreme storms at Kunlun Mountains (Li et al., 2022), as well as in the research of different rainstorms in southern Xinjiang during warm seasons (Yang et al., 2022). In contrast, two events investigated by Zhang et al. (2018) were triggered under the low-level westerly jet (LLWJ) which strengthened the upward vapor transportation on the windward slope, while the easterly jets on low and middle levels enhanced the moist convergence during one of those events. Upper-level jets have also been proved capable of creating dynamically favorable conditions (Zhuang et al., 2022), and their coupling with low-level jets is another interesting mechanism for rainstorm occurrence, where enhanced upper-level atmospheric suction apparently fastens low-level convergence (Feng et al., 2021). Low-level wind shear could dynamically boost moist convergence and convection as well (Huang et al., 2020; Zeng et al., 2020). Xirenayi et al. (2020) also described positive influences of earlier local precipitation that moistened the air and led to stronger vapor exchange. As stated above, however, a comprehensive and systematic analysis of rainstorms in Xinjiang has not been conducted, meanwhile complex topography and underlying surfaces in this province could generate various impacts during different events (Zeng and Yang, 2020).
Therefore, this study comprehensively investigated the characteristics and corresponding physical mechanisms of a rainstorm that occurred in the southern Taklimakan Desert on June 15 and 16, 2021, which covered most of Hotan and parts of Kashgar. The mesoscale synoptic processes leading to this extreme rainstorm were analyzed, including detailed investigations concerning the synoptic features, temporal distribution of the maximum precipitation rate, spatial distribution of precipitation, development of precipitation rate, correspondence between moisture convergence and precipitation, contributions of various isobaric levels, water vapor flux and its convergence at 700 hPa and 500 hPa, and relationships among moisture, temperature, pressure, and heavy rainfall. The remainder of this paper is organized as follows. The second section introduces the study area, datasets, and methodologies. The third section details the characterization of the results and analysis of the rainstorm process, including the corresponding physical mechanisms. In the last section, conclusions are presented.
2 Materials and methods
2.1 Study area
Xinjiang, an important area within Central Asia, has an arid to semi-arid climate. Its complex topography includes three mountain ranges: the Altain Mountains in the north, Tianshan Mountains in the middle, and Kunlun Mountains in the south. Two basins are situated between the mountain ranges which are, from north to south, the Junggar Basin and Tarim Basin (Figure 1, Hu et al., 2021b).
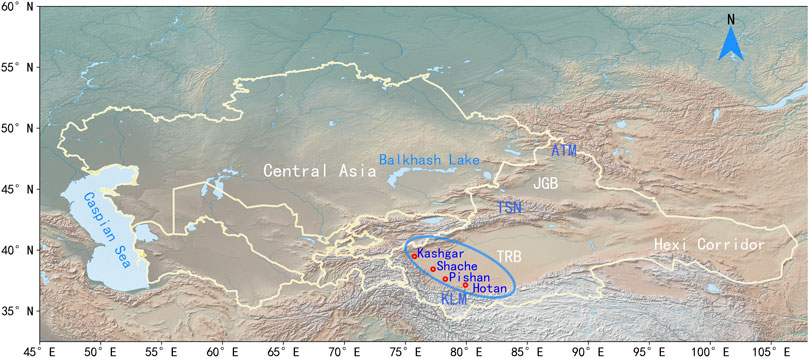
FIGURE 1. Study area, topography, and the major weather stations therein. The mountains and basins are marked as follows: Altain Mountainous (ATM), Junggar Basin (JGB), Tianshan Mountainous (TSM), Tarim Basin (TRB), and Kunlun Mountainous (KLM). The weather stations are marked with red circles and blue text.
The dominant arid and semi-arid climate includes very low precipitation and strong evaporation. The average annual precipitation is less than 200 mm, which accounts for less than 25% of the annual precipitation in China (Chen et al., 2012). Large-scale temporal and spatial distributions of precipitation are notable, specifically, increased precipitation during spring and summer and in mountainous areas. This precipitation has a significantly positive impact on the terrestrial water resources in Xinjiang (Hu et al., 2019b; Zhou et al., 2022). Southern Xinjiang is generally defined as the southern region of the Tianshan Mountains, and the annual precipitation is less than 100 mm with 65% precipitation falling from May to August (Wang and Wang, 2021).
2.2 Datasets and methods
This study used meteorological observations from the Hotan meteorological station, Global Precipitation Measurement (GPM) satellite precipitation products, and the European Centre for Medium-Range Weather Forecasts (ECMWF) Atmospheric Reanalysis 5 (ERA5) to investigate the features of the Hotan rainstorm, including the precipitation intensity, spatial and temporal distributions of precipitation, and development of the related synoptic processes and meteorological elements, as shown in Table 1. Daily precipitation during 2021, together with hourly and daily precipitation from June 15 to 16 June 2021, at the nine national meteorological stations located in the area covered by the Hotan rainstorm, were used to describe its characteristics and provide references for future rainstorm forecasts in Hotan.
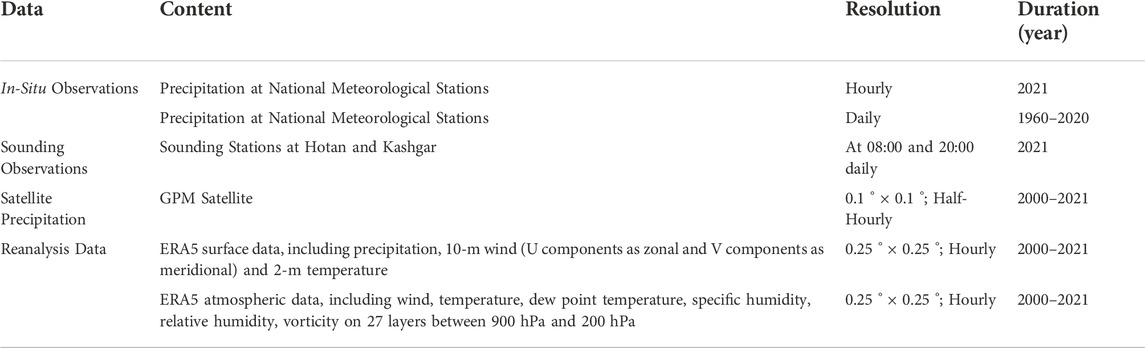
TABLE 1. Datasets used in this study.
The GPM precipitation satellite was developed after the Tropical Rainfall Measuring Mission (TRMM) satellite and has better performance regarding precipitation observations, including higher observation accuracy and higher spatial and temporal resolutions than TRMM. The sensing load in the GPM is extended compared with that in the TRMM and contributes to its improved capabilities. The dual-frequency radar carried by the GPM Core Observatory can detect very weak echoes (Ku band) and use high-sensitivity staggered sampling (Ka band). In addition, the microwave radiometer in the GPM has four more high-frequency bands than that in the TRMM, which enhances its ability to detect minimal and solid precipitation. Thus, compared with TRMM satellites, which focus on observing normal-to-heavy precipitation in the tropics and subtropics, GPM satellites can capture light precipitation (<0.5 mm h−1) and solid precipitation more accurately, both of which are non-negligible components of precipitation in middle and high latitudes. Therefore, GPM observations are critical for studying precipitation in Hotan (Li et al., 2021; Pradhan et al., 2022). In this study, the spatial distribution of hourly GPM precipitation in Hotan was analyzed to investigate the development of precipitation centers and precipitation intensity throughout the rainstorm.
Prior to utilizing the GPM data to describe the rainstorm process, the nine weather stations were used to evaluate its accuracy. The correlation coefficient (CC), absolute error (AE), and root-mean-square error (RMSE) were employed to quantify the accuracy. Previously, we proposed a novel comprehensive index, Distance between Indices of Simulation and Observation (DISO) (Hu et al., 2019c; Zhou et al., 2021; Hu et al., 2022b), which has been widely used (Cui et al., 2020; Hu et al., 2020; Wang et al., 2021). Therefore, in this study, DISO was employed to describe the comprehensive performance of the GPM. The equations for CC, AE, RMSE, and DISO are as follows:
In the DISO equation,
The ERA5 data is the fifth generation ECMWF (European Centre for Medium-Range Weather Forecasts) atmospheric reanalysis of the global climate, which was assimilated multi-source observations with high-resolution. The horizontal and temporal resolutions of the ERA5 products are 0.25 ° × 0.25 ° and 1 h, respectively. The ERA5 products include diverse variables, such as geopotential height, surface pressure, vorticity, and wind, and are commonly used for weather analysis and mechanism research (Hoffmann et al., 2019; Li et al., 2021) This study utilized them to further analyze the features of critical variables related to heavy precipitation in Hotan.
3 Results
3.1 Rainstorm process and corresponding weather conditions
The general distribution of the Hotan rainstorm was determined via in situ observations at various weather stations. The Hotan area, where the heavy precipitation occurred, is located on the northern slope of the Kunlun Mountains and to the south of the Tarim Basin.
Based on observations from the national meteorological weather stations (Table 2 and Figure 2), the heavy precipitation began at 12:00 on June 15 and lasted approximately 12 h (in Beijing time). Table 2 lists nine national meteorological weather stations with a total rainfall of more than 20 mm from June 15 to 16 June 2021; for half of them, the total rainfall exceeded 39 mm. Furthermore, among the nine meteorological stations, the rainfall at two stations, Luopu and Cele, primarily occurred during 19:00–23:00 on June 15, whereas the rainfall at the other stations primarily occurred during 00:00–19:00 on June 16.
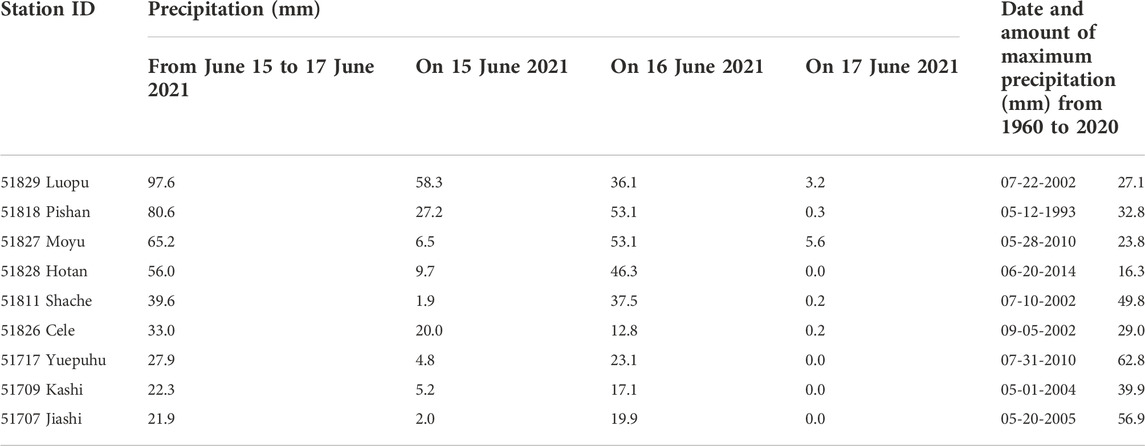
TABLE 2. Precipitation from June 15 to 17 June 2021, at weather stations in Hotan and Kashgar region.
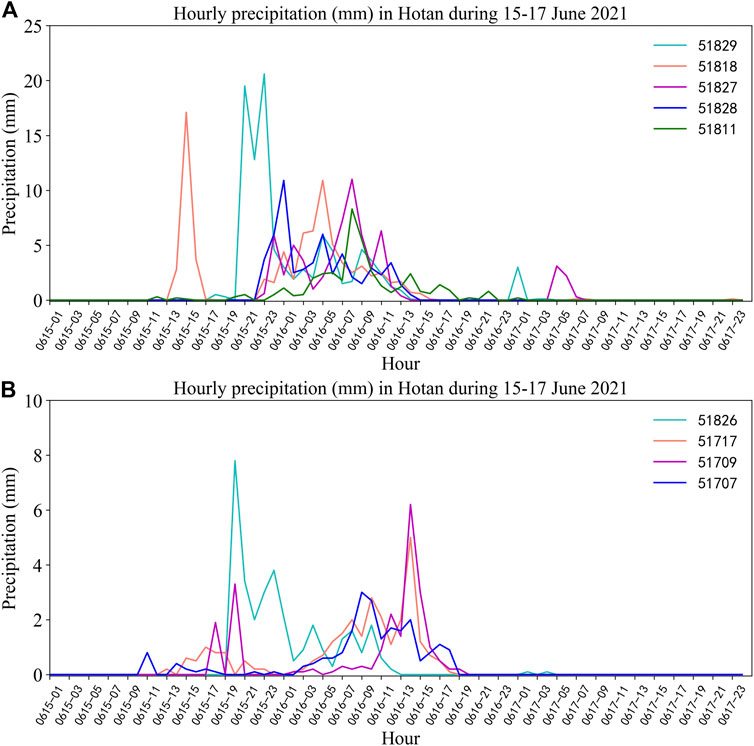
FIGURE 2. Hourly precipitation (mm) in Hotan during June 15–17, 2021 (A)∼(B).
Daily precipitation measurements of 58.3 mm in Luopu weather station on June 15, 53.1 mm in Pishan weather station and Moyu weather station on June 16, and 46.3 mm in Hotan weather station, broke the historical records for largest daily precipitation at these stations and exceeded their annual averages. In particular, the precipitation recorded in Luopu weather station was approximately 1.3 times its annual average (43.5 mm). Moreover, the precipitation in Pishan weather station broke the historical record values for the spring and summer precipitation at that station.
According to the accuracy evaluations, the CC values were larger than 0.6, and the average bias value was 0.2 mm. The average DISO value was 0.79. The smallest DISO value was 0.45 at Cele station, and the largest was 1.11 at Shache station (Table 3). Therefore, the GPM satellite precipitation data accurately reflects the spatial and temporal characteristics of the Hotan rainstorm with high spatial and temporal resolutions.
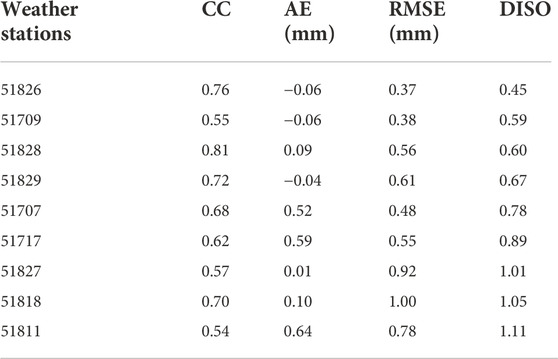
TABLE 3. Distance between Indices of Simulation and Observation (DISO) for GPM data and meteorological station observations.
The half-hourly GPM precipitation data were accumulated to obtain hourly and daily precipitation data. The spatial distribution of the daily precipitation (Figure 3) revealed that the heavy precipitation on June 15 and 16 was concentrated near Hotan and Kashi on the northern slope of the Kunlun Mountains, and it was more concentrated and severe on June 16.

FIGURE 3. Daily precipitation (mm) in Hotan on June 15 (A) and 16 (B) June 2021.
Apparent continuous precipitation at Hotan and Kashgar began at approximately 18:00 on June 15 and gradually strengthened. At 23:00, the intensity and extent expanded significantly. During 02:00–06:00 on June 16, the hourly rate increased to its maximum, exceeding 10 mm h−1 at the center of the precipitation area. Subsequently, the spatial extent increased minimally. However, rainfall intensity continued to vary with time, decreasing rapidly after 07:00 on June 16 and finally falling to nearly 0 mm h−1 at approximately 15:00 on June 16, indicating the end of the rainstorm (Figure 4 and Figure 5).
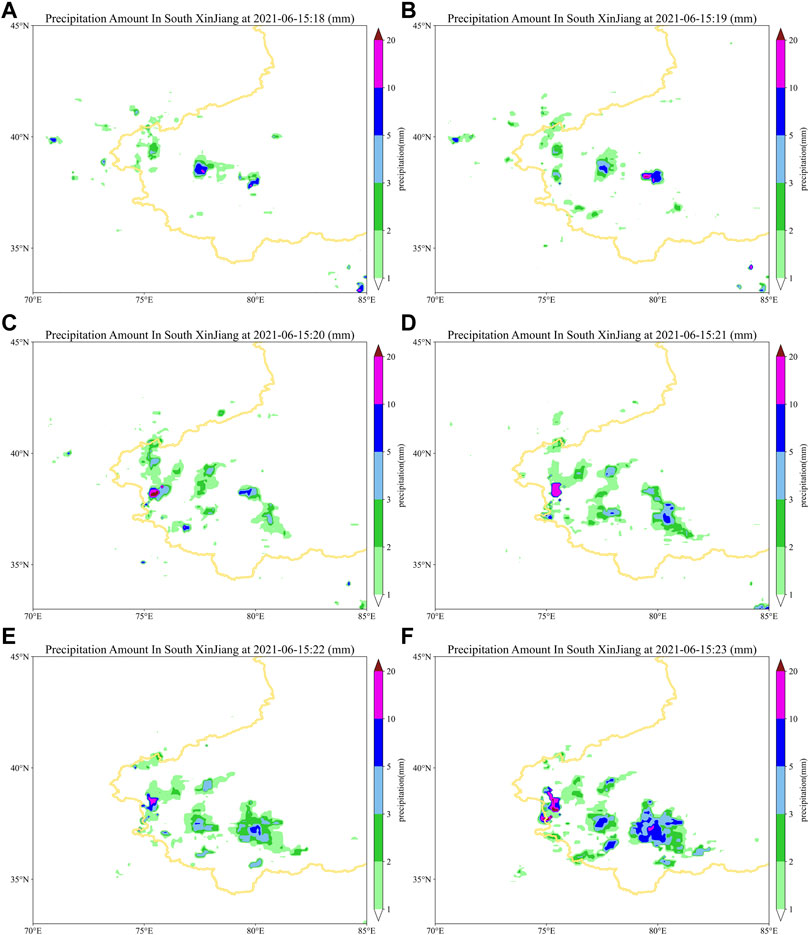
FIGURE 4. Hourly precipitation (mm) from 18:00 to 23:00 (A–F) on 15 June 2021.
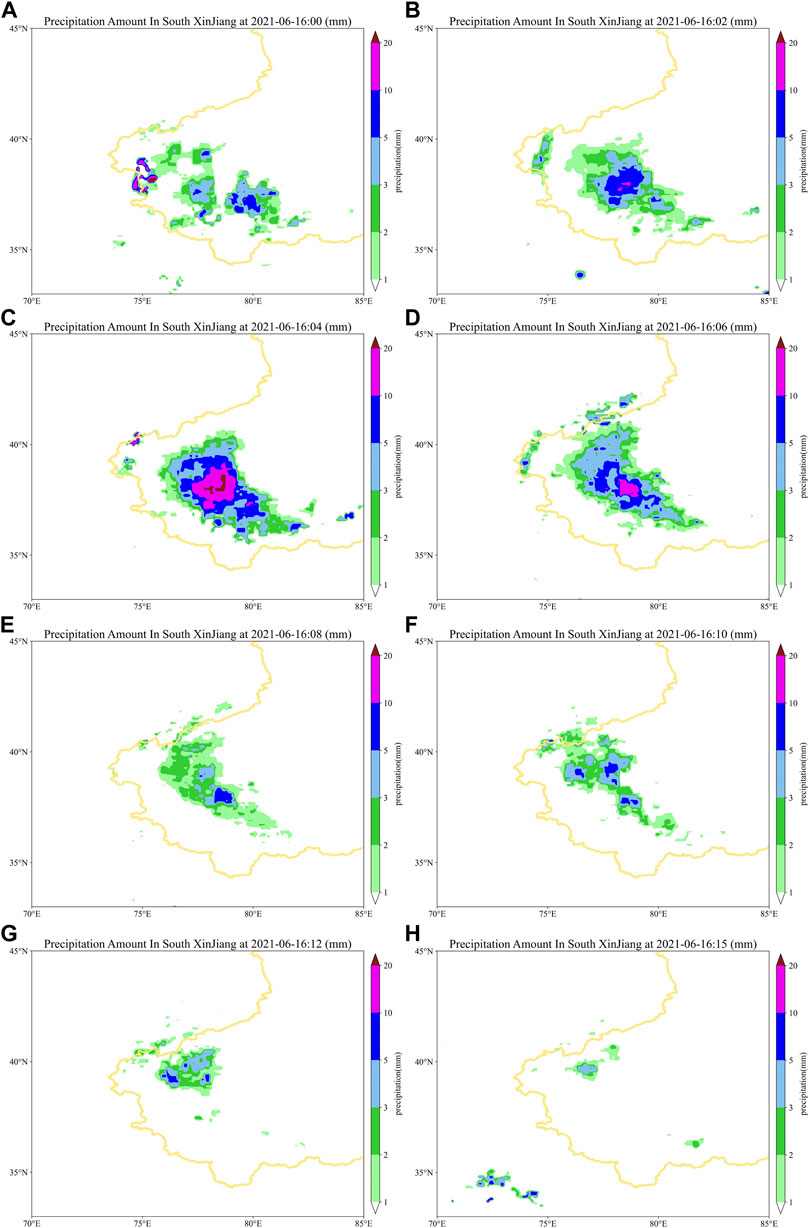
FIGURE 5. Hourly precipitation (mm) from 00:00 to 15:00 (A–H) on 16 June 2021.
3.2 Physical mechanism analyses: Energy variations
Meteorological stations commonly use T-lnP diagrams in meteorology investigations to analyze the vertical distribution of local meteorological elements (such as pressure, temperature, and humidity), to determine the stability of atmospheric stratification, determine the height of the tropopause by analyzing cloud layers, and examine the characteristics of temperature and humidity data. In the T-lnP diagrams in this paper, a dark black solid line (state profile) depicts the variations in temperature with height for an air mass that rises adiabatically. The first intersection of the state profile and the temperature stratification profile is the lifting condensation level, which is defined as the height at which the moist air rising adiabatically will become saturated and begin to condense.
The T-lnP diagram was used to analyze the atmospheric stratification during the rainstorm in Hotan based on twice-daily (08:00–20:00) sounding observations at Hotan and Kashgar on June 15 and 16, 2021. The T-lnP diagrams display the vertical distribution of meteorological elements, such as temperature and humidity. Atmospheric stability directly affects convection strength. The convective available potential energy (CAPE) is the work done by buoyancy on an air mass that rises adiabatically to the level of free convection and is a parameter for basic evaluations of atmospheric instability. CAPE is positively related to the probability and intensity of convection and is therefore an important indicator of convection development. The sounding observations and CAPE calculations at Hotan and Kashgar on June 15 and 16, 2021, show that instability began to increase prior to the precipitation. On June 15, the CAPE values at Hotan and Kashgar were 24 J kg−1 and 57 J kg−1, respectively, at 08:00 and 89 J kg−1 and 18 J kg−1, respectively, at 20:00. At 08:00 on June 16, CAPE had increased to 179 J kg−1 and 23 J kg−1, respectively; however, by 20:00, it had decreased to 113 J kg−1 and 0 J kg−1, respectively, indicating the decay of the unstable energy and convective system and the end of the precipitation (Figure 6 and Figure 7).
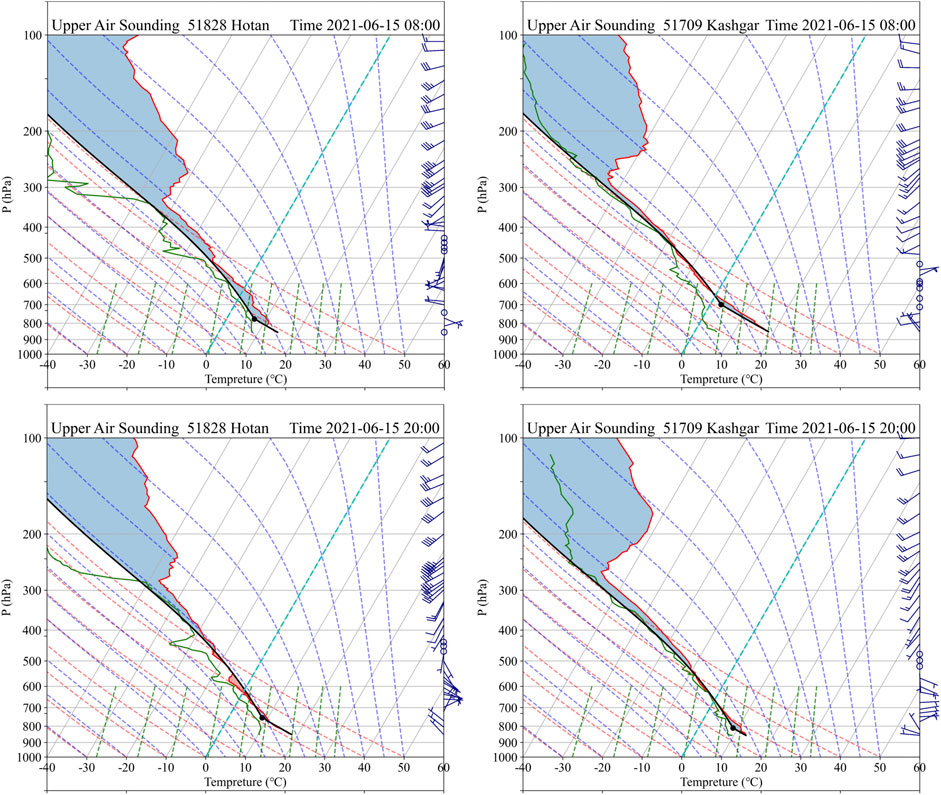
FIGURE 6. The T-lnP diagrams at 08:00 and 22:00 for the sounding stations at (A,C) Hotan (ID 51828) and (B,D) Kashgar (ID 51709) on 15 June 2021. The dark black solid lines indicate state profiles. The red solid lines are temperature stratification profiles. The green solid lines are dew point stratification profiles. The blue dashed lines are wet adiabatic profiles. The orange dashed lines are dry adiabatic profiles. The green dashed lines are iso-saturated specific humidity profiles. The gray sloping solid lines are isothermal profiles.
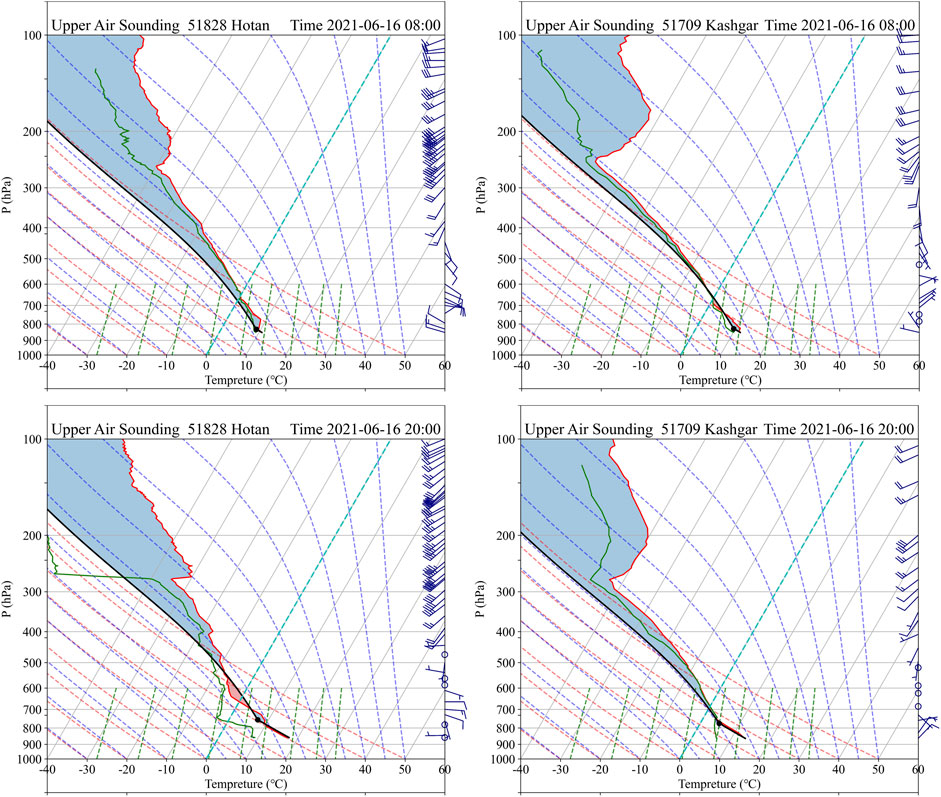
FIGURE 7. The T-lnP diagrams at 08:00 and 22:00 for the sounding stations at (A,C) Hotan (ID 51828) and (B,D) Kashgar (ID 51709) on 16 June 2021. The dark black solid lines indicate state profiles. The red solid lines are temperature stratification profiles. The green solid lines are dew point stratification profiles. The blue dashed lines are wet adiabatic profiles. The orange dashed lines are dry adiabatic profiles. The green dashed lines are iso-saturated specific humidity profiles. The gray sloping solid lines are isothermal profiles.
Figures 6, 7 show that the environmental temperature profile fits well with the dew point profile at 850 hPa, indicating the saturation of low-level atmospheric vapor. Several structures between 900 hPa and 300 hPa indicate that the upper air was drier and, therefore, heavier than the lower air, creating favorable conditions for low-level moist air to rise and release unstable energy, which thereby strengthened the entire convective system. The 200 hPa dew point depression was 5 K at minimum, reflecting generally high moisture, even over 300 hPa. The differences among 850 hPa weak southeasterly, 550 hPa weak westerly, and 300 hPa strong southwesterly winds indicated a generally clockwise vertical shear in the low-level atmosphere, thereby signaling warm advection with high thickness where the unstable energy decreased with height.
3.3 Physical mechanism analyses: Atmosphere circulation
Generally, the atmosphere circulation can describe the water vapor source and water transportation path. In this section, the wind field, geopotential height and specific humidity are discussed in Figures 8–10. Specifically, the wind field variations on 500 h Pa from 12:00 15 June 2021 to 00:00 16 with 4 hours interval June 2021 show the similar transportation paths of the Atlantic Ocean → Ural Mountains → West Siberian Plain → southern Xinjiang (Figure 8), which can illustrate the water vapor source and water transportation of this rainstorm.
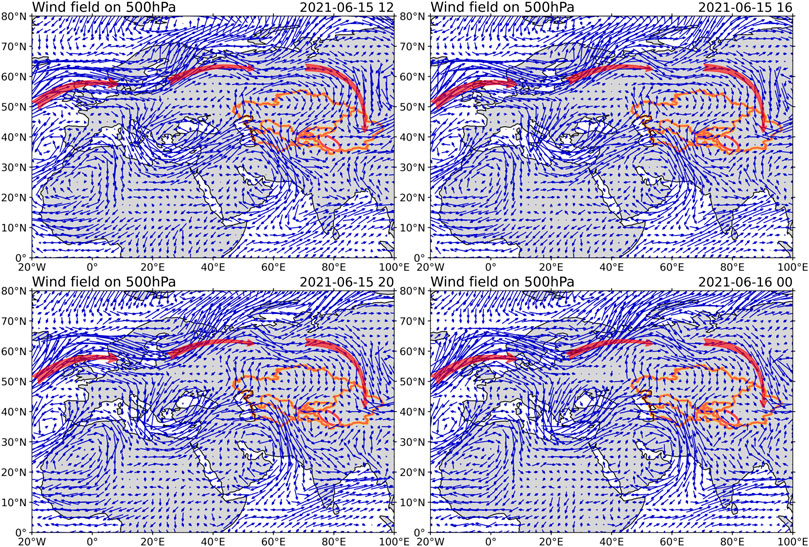
FIGURE 8. Wind field on 500 hPa from 12:00 15 June 2021 to 00:00 16 June 2021 (BJT).
Moreover, the geopotential height, wind field and specific humidity on 500 hPa, 600 hPa, 700 hPa and 850 hPa pressure level at 00:00 16 June 2021 are provided in Figure 9. According to the geopotential height, there are consistent high-pressure center in West Siberian and low-pressure region in southern Xinjiang for the four pressure levels. For the specific humidity, the lower pressure levels have the larger values than the upper pressure levels, which suggest that the water vapor of this rainstorm focus on the lower pressure levels.
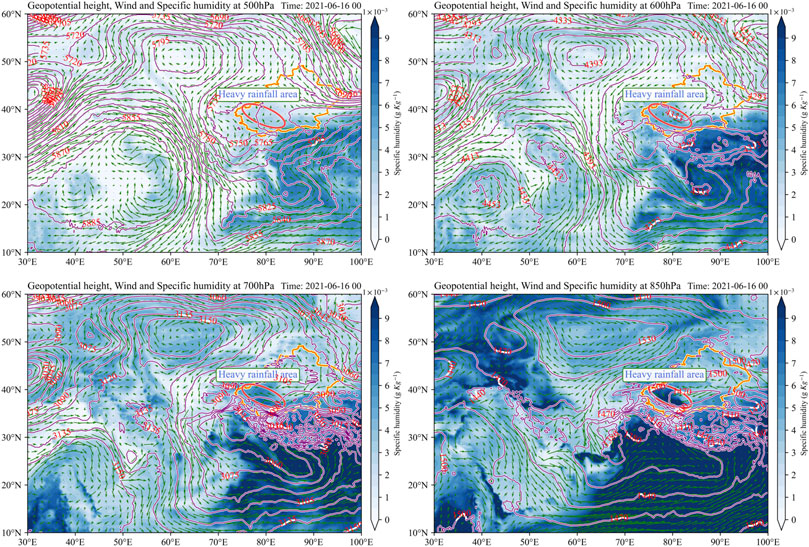
FIGURE 9. Geopotential Height, Wind field and specific humidity on 500 hPa, 600 hPa, 700 hPa and 850 hPa pressure level at 00:00 16 June 2021 (BJT).
3.4 Physical mechanism analyses: Water vapor transformation
A sufficient water vapor supply and strong upward motion are necessary for the occurrence and development of rainstorms. The profiles of the atmospheric moisture and vertical wind during the Hotan rainstorm were analyzed using the ERA5 data to investigate the water vapor flux and its convergence. Specific humidity is the ratio of the mass of water vapor to the total moist air, which remains constant without mass exchange between moist air and the surrounding environment and phase changes of water vapor. It is given in units of g g−1 or g kg−1 and is commonly less than 40 g kg−1. In numerical analysis, downward vertical motion is usually described as positive, and vice versa. If the water vapor content remains unchanged, an air mass can bring low-level water vapor to the upper levels through upward motion. Low-level moist convergence typically corresponds with precipitation; upward transportation from low levels due to low-level heating or upper-level cooling increases water vapor condensation and contributes to heavy rainfall. Additionally, near-surface vertical transportation can extend upward to the tropopause owing to significantly strengthened low-level moist convection.
Water vapor flux, also known as water vapor transport volume, refers to the mass of water vapor along a vertical velocity vector in units of time and cross-sectional area. It indicates the strength and direction of water vapor transport. A region with positive water vapor flux represents outward divergence and is considered a water vapor source; these conditions are unfavorable for precipitation. In contrast, a region with negative flux indicates the convergence of water vapor from the surrounding regions, which is termed a water vapor sink, and is favorable for precipitation. The formula is as follows:
where
Figure 10 shows the height-time cross section of specific humidity (g Kg−1) between 900 hPa and 200 hPa at Hotan from 00:00 on June 15 to 23:00 on June 16, and indicates the variations in atmospheric water vapor content with time. The vapor was primarily concentrated under 500 hPa (approximately 5,500 m above sea level); this was the main water vapor source for the precipitation. In contrast, the humidity above 500 hPa was less than 3 g kg−1 and, therefore, was beyond the focus of this study. The humidity began to increase at 00:00 on June 15 and reached its maximum between 20:00 on June 15 and 03:00 on June 16. It reached a moisture concentration of approximately 10 g kg−1 at 800 hPa, which is consistent with heavy rainfall. The humidity decreased rapidly after 18:00 on June 16, and the precipitation decreased.
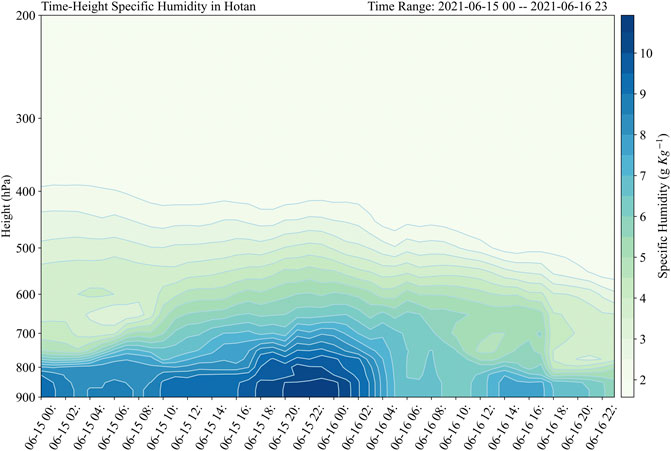
FIGURE 10. Height-time cross section of specific humidity (g kg−1) between 900 hPa and 200 hPa at Hotan from 00:00 on June 15 to 23:00 on 16 June 2021.
Figure 11 shows the height–longitude cross section of the relative humidity (%) and wind vector between 900 hPa and 200 hPa near Hotan (37°N) at 01:00 on June 16. Apparent vertical transportation from low to upper levels was present at 75°E–85°E; this was supplied by westward water vapor transportation from the east, which was induced by downward moisture motion under 500 hPa. Therefore, continuous water vapor convergence provided favorable conditions for the rainstorm.
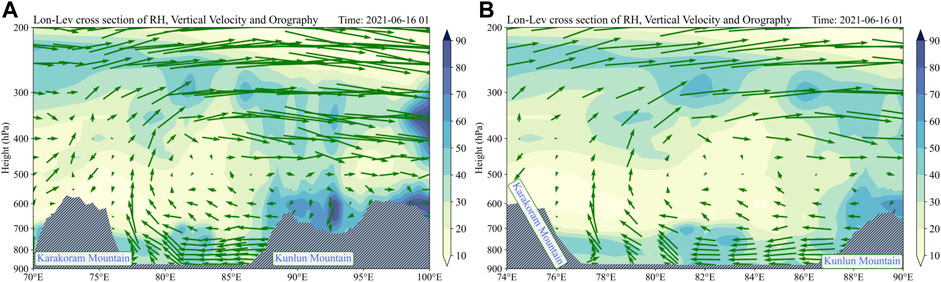
FIGURE 11. Height-longitude cross section of relative humidity (%) and wind vector between 900 hPa and 200 hPa around Hotan (37°N) at 01:00 16 June 2021. (A) (left) has larger longitude range than (B) (right) which mainly covers the heay rainfall area.
Water vapor supply is necessary for rainstorm occurrence; however, local evaporation alone was insufficient to develop such a severe convective system. Thus, the water vapor flux and its divergence were analyzed for convergence, which could have enabled heavy rainfall to occur.
Figure 12 shows the total water vapor flux and its total divergence at 00:00 and 05:00 (Beijing time) on June 16 from 200 hPa to 850 hPa. In particularly, convergence of water vapor occurred along the Kunlun Mountains in a west-east orientation, which continuously provided water vapor for the rainstorm (Figures 12A,B). Moreover, the water vapor flux divergence had reached its maximum, covering central Kashgar and most of Hotan. The direction of the water vapor transportation was consistent with that of the horizontal wind (Figures 12C,D). The total water vapor flux of the rainstorm area at 05:00 are larger than the total water vapor at 00:00, which indicates the rainstorm becomes strong with time (Figures 12C,D and Figure 5). This reflects the source of the water vapor and the intensity of the water vapor transportation and is consistent with the spatial and temporal distributions of the rainfall (Figures 3–5). The increase in water vapor flux indicates increased water vapor convergence and matches the intensity of the rainfall, and the decrease in water vapor flux and its divergence matches the decay of the rainfall.
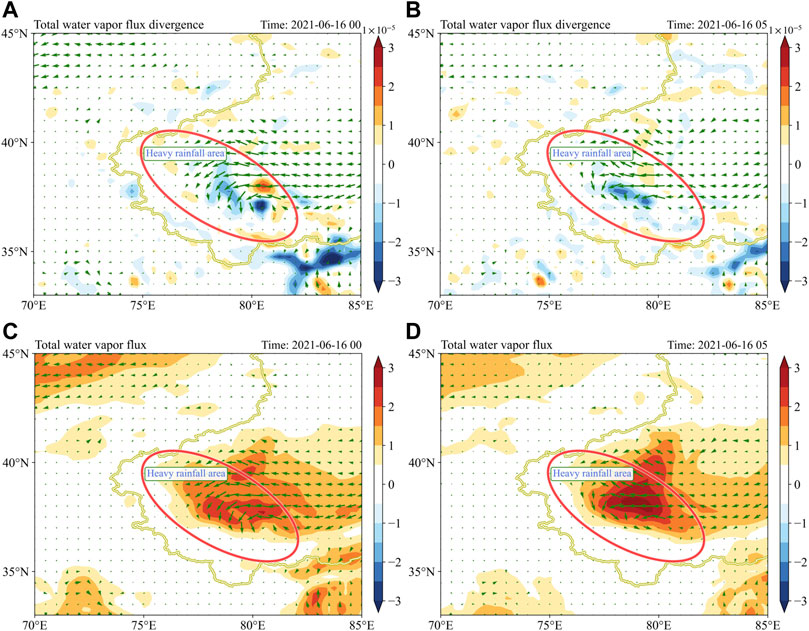
FIGURE 12. Total water vapor flux divergence at 00:00 16 June 2021 (A) and 05:00 16 June 2021 (B) (BJT) and Total water vapor flux at 00:00 16 June 2021 (C) and 05:00 16 June 2021 (D) (BJT).
To have a further investigation the impacts of the water vapor flux divergence and water vapor flux on this rainstorm, we analyze the water vapor flux divergence and water vapor flux at the single pressure level with 500 hPa, 600 hPa, 700 hPa and 850 hPa (Figure 13 and Figure 14). The water vapor convergence mainly occurred on the lower pressure level (e.g., 700 hPa and 850 hPa) (Figures 13C,D), and the corresponding water vapor flux reached the larger magnitude than the upper pressure level (Figure 14C).
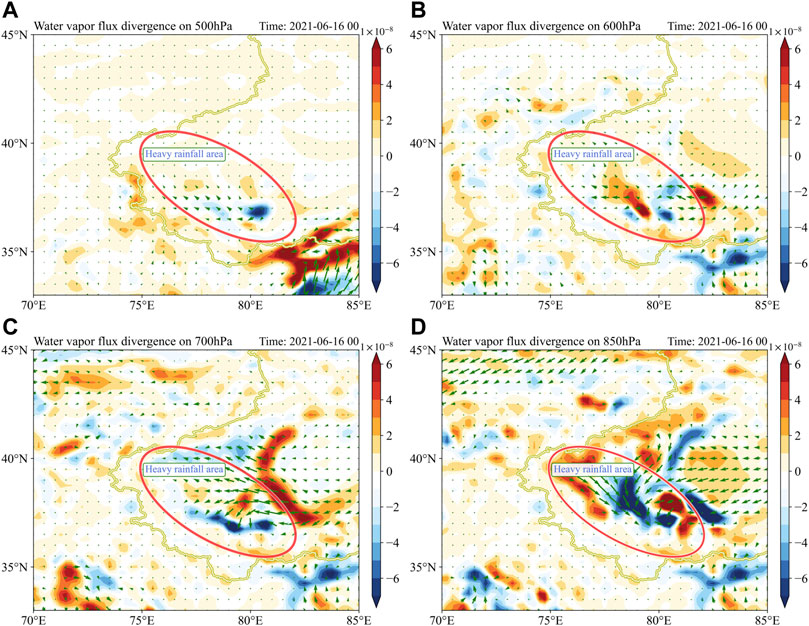
FIGURE 13. Water vapor flux divergence on 500 hPa (A), 600 hPa (B), 700 hPa (C) and 850 hPa (D) pressure level at 00:00 16 June 2021 (BJT).
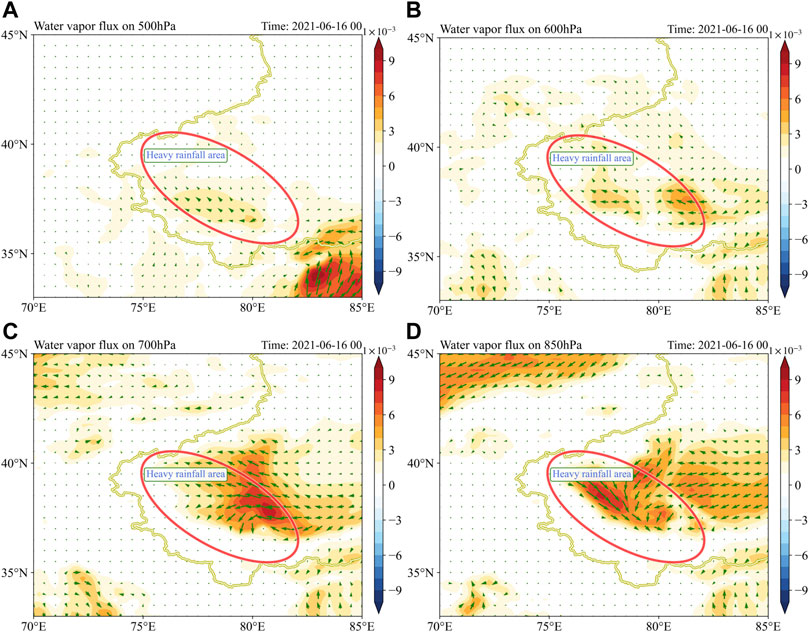
FIGURE 14. Water vapor flux on 500 hPa (A), 600 hPa (B), 700 hPa (C) and 850 hPa (D) pressure level at 00:00 16 June 2021 (BJT).
4 Conclusion
To address the features and physical mechanisms of rainstorms in the arid regions of Central Asia, we comprehensively investigated the temporal and spatial characteristics and corresponding substance and energy variations of a rainstorm that occurred on June 15 and 16, 2021, in the Hotan region of Xinjiang. Multiple datasets were used, including meteorological observations, sounding observations, satellite precipitation data, and reanalysis data. The precipitation amounts, locations, and durations were analyzed using various observation data. The energy variations and water vapor transformations were described to illustrate the physical mechanisms of this rainstorm. Our major findings are as follows.
The GPM satellite precipitation product accurately captured the temporal and spatial variations of this rainstorm compared with the in situ observation data at an hourly scale based on the statistical indexes. This rainstorm had the largest precipitation values among historical extreme precipitation events according to the in situ observations at some meteorological stations. Precipitation amounts were larger than twice the historical values at Luopu, Pishan, Moyu, and Hotan. The precipitation duration of this rainstorm was longer than 2 days, and the precipitation centers, from east to west, were Pishan and Hotan.
The water vapor was primarily concentrated from 700 hPa to 850 hPa, according to the height-longitude cross section. Moreover, from the atmosphere circulation anlysis, we obtain that the water vapor resource of the rainstorm of southern Xinjiang are from the 45°–65°N region of the North Atlantic Ocean. The water vapor transportation path is the Atlantic Ocean → Ural Mountains West Siberian Plain → southern Xinjiang. Sufficient water vapor and favorable thermal and dynamic conditions resulted in this rainstorm. Specifically, clockwise wind shear and the change in wind vectors from weak southeasterly to strong westerly winds in the middle-low atmosphere indicated warm advection, which provided favorable thermal conditions for the development of convective systems and convective instability. Strong divergence at the upper levels and strong convergence at the lower levels contributed to strengthened vertical transportation, which was dynamically favorable for atmospheric convection.
Data availability statement
The original contributions presented in the study are included in the article/Supplementary Material, further inquiries can be directed to the corresponding authors
Author contributions
Study design: ZH, GY, and XC; Conceptualization: ZH, GY, XC, ZZ, and QL; Writing: GY, ZH, BZ, and MM; Review and editing: ZH, XC, and QL. All authors contributed to the article and approved the submitted version.
Funding
This study was supported by the Third Xinjiang Scientific Expedition Program (Grant No. 2021xjkk1300), National Natural Science Foundation of China (Grant Nos 42230708 and E1190301), Western Scholars of the Chinese Academy of Sciences (Grant No. 2020- XBQNXZ-010) and the Alliance of International Science Organizations (Grant No. ANSO-CR-KP- 2021-02).
Conflict of interest
The authors declare that the research was conducted in the absence of any commercial or financial relationships that could be construed as a potential conflict of interest.
The reviewer YY declared a past co-authorship with the author QL to the handling editor.
Publisher’s note
All claims expressed in this article are solely those of the authors and do not necessarily represent those of their affiliated organizations, or those of the publisher, the editors and the reviewers. Any product that may be evaluated in this article, or claim that may be made by its manufacturer, is not guaranteed or endorsed by the publisher.
References
Chen, X., Li, B., Li, Q., Li, J., and Abdulla, S. (2012). Spatio-temporal pattern and changes of evapotranspiration in arid Central Asia and Xinjiang of China. J. Arid Land 4, 105–113. doi:10.3724/sp.j.1227.2012.00105
Chen, X., Wang, S., Hu, Z., Zhou, Q., and Hu, Q. (2018). Spatiotemporal characteristics of seasonal precipitation and their relationships with ENSO in Central Asia during 1901–2013. J. Geogr. Sci. 28, 1341–1368. doi:10.1007/s11442-018-1529-2
Chen, X., and Zhou, Q. (2015). Ecological and environmental remote sensing in arid zone – a case study of central Asia. Beijing, China: Science Press.
Cui, Q., Hu, Z., Li, Y., Han, J., Teng, Z., and Qian, J. (2020). Dynamic variations of the COVID-19 disease at different quarantine strategies in Wuhan and mainland China. J. Infect. Public Health 13, 849–855. doi:10.1016/j.jiph.2020.05.014
Dayan, U., Lensky, I. M., Ziv, B., and Khain, P. (2021). Atmospheric conditions leading to an exceptional fatal flash flood in the Negev Desert, Israel. Nat. Hazards Earth Syst. Sci. 21, 1583–1597. doi:10.5194/nhess-21-1583-2021
Duan, W., He, B., Takara, K., Luo, P., Hu, M., Alias, N. E., et al. (2015). Changes of precipitation amounts and extremes over Japan between 1901 and 2012 and their connection to climate indices. Clim. Dyn. 45, 2273–2292. doi:10.1007/s00382-015-2778-8
Feng, Y., Ayixianmu, N., and Reyila, Y. (2021). Cause analysis of an extreme heavy rainstorm process on July 31 of 2018 in Hami of Xinjiang. J. Arid Meteorol. 39, 426–435. doi:10.11755/j.issn.1006-7639(2021)-03-0426
Gessner, U., Naeimi, V., Klein, I., Kuenzer, C., Klein, D., and Dech, S. (2014). The relationship between precipitation anomalies and satellite-derived vegetation activity in Central Asia. Glob. Planet. Change 110, 74–87. doi:10.1016/j.gloplacha.2012.09.007
Hoffmann, L., Günther, G., Li, D., Stein, O., Wu, X., Griessbach, S., et al. (2019). From ERA-interim to ERA5: The considerable impact of ECMWF's next-generation reanalysis on Lagrangian transport simulations. Atmos. Chem. Phys. 19, 3097–3124. doi:10.5194/acp-19-3097-2019
Hu, Z., Chen, D., and Chen, X. (2022b). CCHZ-DISO: A timely new assessment system for data quality or model performance from da dao zhi jian. Accept: Geophysical Research Letters.
Hu, Z., Chen, X., Chen, D., Li, J., Wang, S., Zhou, Q., et al. (2019a). Dry gets drier, wet gets wetter”: A case study over the arid regions of central Asia. Int. J. Climatol. 39, 1072–1091. doi:10.1002/joc.5863
Hu, Z., Chen, X., Li, Y., Zhou, Q., and Yin, G. (2021b). Temporal and Spatial variations of soil moisture over Xinjiang based on multiple GLDAS datasets. Front. Earth Sci. 9, 654848. doi:10.3389/feart.2021.654848
Hu, Z., Chen, X., Zhou, Q., and Li, J. (2019c). Diso: A rethink of taylor diagram. Int. J. Climatol. 39, 2825–2832. doi:10.1002/joc.5972
Hu, Z., Chen, X., Zhou, Q., Yin, G., and Liu, J. (2022a). Dynamical variations of the terrestrial water cycle components and the influences of the climate factors over the Aral Sea Basin through multiple datasets. J. Hydrology 604, 127270. doi:10.1016/j.jhydrol.2021.127270
Hu, Z., Cui, Q., Han, J., Wang, X., Sha, W. E. I., and Teng, Z. (2020). Evaluation and prediction of the COVID-19 variations at different input population and quarantine strategies, a case study in Guangdong province, China. Int. J. Infect. Dis. 95, 231–240. doi:10.1016/j.ijid.2020.04.010
Hu, Z., Hu, Q., Zhang, C., Chen, X., and Li, Q. (2016a). Evaluation of reanalysis, spatially interpolated and satellite remotely sensed precipitation data sets in central Asia. J. Geophys. Res. Atmos. 121, 5648–5663. doi:10.1002/2016JD024781
Hu, Z., Li, Q., Chen, X., Teng, Z., Chen, C., Yin, G., et al. (2016b). Climate changes in temperature and precipitation extremes in an alpine grassland of Central Asia. Theor. Appl. Climatol. 126, 519–531. doi:10.1007/s00704-015-1568-x
Hu, Z., Zhang, C., Hu, Q., and Tian, H. (2014). Temperature changes in central Asia from 1979 to 2011 based on multiple datasets. J. Clim. 27, 1143–1167. doi:10.1175/jcli-d-13-00064.1
Hu, Z., Zhang, Z., Sang, Y., Qian, J., Feng, W., Chen, X., et al. (2021a). Temporal and spatial variations in the terrestrial water storage across Central Asia based on multiple satellite datasets and global hydrological models. J. Hydrology 596, 126013. doi:10.1016/j.jhydrol.2021.126013
Hu, Z., Zhou, Q., Chen, X., Chen, D., Li, J., Guo, M., et al. (2019b). Groundwater depletion estimated from grace: A challenge of sustainable development in an arid region of central Asia. Remote Sens. 11, 1908. doi:10.3390/rs11161908
Hu, Z., Zhou, Q., Chen, X., Li, J., Li, Q., Chen, D., et al. (2018). Evaluation of three global gridded precipitation data sets in central Asia based on rain gauge observations. Int. J. Climatol. 38, 3475–3493. doi:10.1002/joc.5510
Hu, Z., Zhou, Q., Chen, X., Qian, C., Wang, S., and Li, J. (2017). Variations and changes of annual precipitation in Central Asia over the last century. Int. J. Climatol. 37, 157–170. doi:10.1002/joc.4988
Huang, Q., Fan, R., Zhu, B., and Tao, X. (2019). Analysis of a rainstorm process in changji, Xinjiang. Clim. Change Res. Lett. 8, 65–73. doi:10.12677/ccrl.2019.81008
Huang, X., Zhou, Y. S., Ran, L. K., Kalim, U., and Zeng, Y. (2020). Analysis of environment field and unstable condition on a rainstorm event in Ili Valley of Xinjiang. Chin. J. Atmos. Sci 45, 148–164. (In Chinese). doi:10.3878/j.issn.1006-9895.1912.19219
Kunkel, K. E., Karl, T. R., Brooks, H., Kossin, J., Lawrimore, J. H., Arndt, D., et al. (2013). Monitoring and understanding trends in extreme storms: State of knowledge. Bull. Am. Meteorol. Soc. 94, 499–514. doi:10.1175/BAMS-D-11-00262.1
Li, H., Min, Y., Li, A., and Li, R. (2022). Comparative analysis on the characteristics of two extreme storms in the northern foothills of Kunlun Mountains. Arid. Land Geogr. 45, 715–724.
Li, X., Sungmin, O., Wang, N., Liu, I., and Huang, Y. (2021). Evaluation of the GPM IMERG V06 products for light rain over Mainland China. Atmos. Res. 253, 105510. doi:10.1016/j.atmosres.2021.105510
Lioubimtseva, E., and Cole, R. (2006). Uncertainties of climate change in arid environments of central Asia. Rev. Fish. Sci. 14, 29–49. doi:10.1080/10641260500340603
Pradhan, R. K., Markonis, Y., Godoy, M. R. V., Villalba-Pradas, A., Andreadis, K. M., Nikolopoulos, E. I., et al. (2022). Review of GPM imerg performance: A global perspective. Remote Sens. Environ. 268, 112754. doi:10.1016/j.rse.2021.112754
Rinat, Y., Marra, F., Armon, M., Levi, Y., Khain, P., Vadislavsky, E., et al. (2019). Analysis and modeling of an extreme desert rainstorm: Rainfall, flashfloods, and forecast. Abstr. retrieved Geophys. Res. Abstr. 21.
Rinat, Y., Marra, F., Armon, M., Metzger, A., Levi, Y., Khain, P., et al. (2021). Hydrometeorological analysis and forecasting of a 3 d flash-flood-triggering desert rainstorm. Nat. Hazards Earth Syst. Sci. 21, 917–939. doi:10.5194/nhess-21-917-2021
Schiemann, R., Luthi, D., Vidale, P. L., and Schar, C. (2008). The precipitation climate of Central Asia - intercomparison of observational and numerical data sources in a remote semiarid region. Int. J. Climatol. 2, 295–314. doi:10.1002/joc.1532
Tank, A. M. G. K., Peterson, T. C., Quadir, D. A., Dorji, S., Zou, X., Tang, H., et al. (2006). Changes in daily temperature and precipitation extremes in central and south Asia. J. Geophys. Res. 111, D16105. doi:10.1029/2005JD006316
Wang, B., Zhang, M., Wei, J., Wang, S., Li, S., Ma, Q., et al. (2013). Changes in extreme events of temperature and precipitation over Xinjiang, northwest China, during 1960–2009. Quat. Int. 298, 141–151. doi:10.1016/j.quaint.2012.09.010
Wang, N., Jiao, J., Bai, L., Zhang, Y., Chen, Y., Tang, B., et al. (2020). Magnitude of soil erosion in small catchments with different land use patterns under an extreme rainstorm event over the Northern Loess Plateau, China. Catena 195, 104780. doi:10.1016/j.catena.2020.104780
Wang, W., and Wang, X. (2021). Spatial distribution and temporal variation characteristics of rainstorm flood disasters with different intensities in southern Xinjiang from 1980 to 2019. J. Glaciol. Geocryol. 43, 1818–1828. (in Chinese). doi:10.7522/j.issn.1000-0240.2021.0032
Wang, X., Yin, G., Hu, Z., He, D., Cui, Q., Feng, X., et al. (2021). Dynamical variations of the global COVID-19 pandemic based on a seicr disease model: A new approach of yi hua jie mu. Geohealth 5, e2021GH000455. doi:10.1029/2021GH000455
Wu, M., Wu, Z., Ge, W., Wang, H., Shen, Y., and Jiang, M. (2021). Identification of sensitivity indicators of urban rainstorm flood disasters: A case study in China. J. Hydrology 599, 126393. doi:10.1016/j.jhydrol.2021.126393
Xie, Z., Zhou, Y., and Yang, L. (2018). Review of study on precipitation in Xinjiang. Torrential Rain Disasters 37, 204–212.
Xirenayi, T., Aikedai, S., and Aerpati, T. (2020). Analysis of a heavy rain weather process in Bozhou, Xinjiang. Clim. Change Res. Lett. 9, 617–626. (In Chinese). doi:10.12677/ccrl.2020.96068
Yang, L., Zhang, Y., and Tang, H. (2012). Analyses on water vapor characteristics in three heavy rainstorm processes of Xinjiang in July 2007. Plateau Meteorol. 31, 963–973.
Yang, X., Xu, T., Zhang, L., Hua, Y., and Zhou, H. (2022). Characteristics and differences of rainstorm in the southern Xinjiang during warm season under different climatic backgrounds. J. Arid Meteorology 40, 222–233. doi:10.11755/j.issn.1006-7639(2022)-02-0222
Yin, G., Hu, Z., Chen, X., and Tiyip, T. (2016). Vegetation dynamics and its response to climate change in Central Asia. J. Arid. Land 8, 375–388. doi:10.1007/s40333-016-0043-6
Zang, Y., Ma, J., Zhou, X., Tao, Y., Yin, B., and Zhang, Y. (2021). Extreme precipitation increases the productivity of a desert ephemeral plant community in Central Asia, but there is no slope position effect. J. Veg. Sci. 32, e13077. doi:10.1111/jvs.13077
Zeng, Y., and Yang, L. (2020). Triggering mechanism of an extreme rainstorm process near the Tianshan Mountains in Xinjiang, an arid region in China, based on a numerical simulation. Adv. Meteorology 2020, 1–12. doi:10.1155/2020/8828060
Zeng, Y., Yang, L., and Zhang, Y. (2020). Numerical simulation of mesoscale system during a rare torrential rainstorm process in Yili of Xinjiang. J. Arid Meteorology 38, 290–300. doi:10.11755/j.issn.1006-7639(2020)-02-029
Zhang, C., Lu, D., Chen, X., Zhang, Y., Maisupova, B., and Tao, Y. (2016). The spatiotemporal patterns of vegetation coverage and biomass of the temperate deserts in Central Asia and their relationships with climate controls. Remote Sens. Environ. 175, 271–281. doi:10.1016/j.rse.2016.01.002
Zhang, Q., Singh, V. P., Li, J., Jiang, F., and Bai, Y. (2012). Spatio-temporal variations of precipitation extremes in Xinjiang, China. J. Hydrology 434, 7–18. doi:10.1016/j.jhydrol.2012.02.038
Zhang, Y., Yu, B., Wang, Z., and Jia, L. H. (2018). Dynamic mechanism and water vapor transportation characteristics of two extreme rainstorm events in Ili River valley in summer of 2016. Torrential Rain Disasters 37, 435–444. doi:10.3969/j.issn.1004-9045.2018.05.006
Zhou, Q., Chen, D., Hu, Z., and Chen, X. (2021). Decompositions of Taylor diagram and DISO performance criteria. Int. J. Climatol. 41, 5726–5732. doi:10.1002/joc.7149
Zhou, Q., Huang, J., Hu, Z., and Yin, G. (2022). Spatial-temporal changes to GRACE-derived terrestrial water storage in response to climate change in arid Northwest China. Hydrological Sci. J. 67, 535–549. doi:10.1080/02626667.2022.2030060
Keywords: hotan rainstorm, heavy rainfall, synoptic process, spatial and temporal characteristics, physical mechanism
Citation: Yin G, Zhang Z, Zhu B, Li Q, Mao M, Xing W, Hu Z and Chen X (2022) Characteristics and physical mechanisms of a rainstorm in Hotan, Xinjiang, China. Front. Environ. Sci. 10:1046882. doi: 10.3389/fenvs.2022.1046882
Received: 17 September 2022; Accepted: 24 November 2022;
Published: 08 December 2022.
Edited by:
Lunche Wang, China University of Geosciences Wuhan, ChinaReviewed by:
Yuanjian Yang, Nanjing University of Information Science and Technology, ChinaJunqiang Yao, China Meteorological Administration, China
Copyright © 2022 Yin, Zhang, Zhu, Li, Mao, Xing, Hu and Chen. This is an open-access article distributed under the terms of the Creative Commons Attribution License (CC BY). The use, distribution or reproduction in other forums is permitted, provided the original author(s) and the copyright owner(s) are credited and that the original publication in this journal is cited, in accordance with accepted academic practice. No use, distribution or reproduction is permitted which does not comply with these terms.
*Correspondence: Zengyun Hu, aHV6ZW5neXVuQG1zLnhqYi5hYy5jbg==; Xi Chen, Y2hlbnhpQG1zLnhqYi5hYy5jbg==