 Yang Liu
 Cheng Gao
 Xiaomin Ji2
 Zhenxing Wang
95% of researchers rate our articles as excellent or good
Learn more about the work of our research integrity team to safeguard the quality of each article we publish.
Find out more
ORIGINAL RESEARCH article
Front. Environ. Sci. , 28 November 2022
Sec. Water and Wastewater Management
Volume 10 - 2022 | https://doi.org/10.3389/fenvs.2022.1045907
This article is part of the Research Topic Sustainable Development on Water Resources Management, Policy and Governance in a Changing World View all 10 articles
Water resources play a key role in development. The research on water resources carrying capacity (WRCC) is helpful to judge the development status and provide suggestions for regional policy-making. In this study, the System Dynamics (SD) model and the Technique for Order Preference by Similarity to an Ideal Solution (TOPSIS) method are combined to calculate the change of WRCC of the Hangbu River basin from 2015 to 2035 under four development scenarios. The results show that WRCC of each scenario decreases first and then increases. The scenario that prioritizes water resources is the best for the Hangbu River Basin, under which the WRCC will increase to 0.631 in 2035, achieving a good level. This is different from other WRCC studies. Through analysis, the research method and the development level and focus of the study area may be the reasons for this difference. In addition, some suggestions were provided such as focusing on improving the efficiency of irrigation water use and looking at the long-term development of the region.
As an irreplaceable and strategic basic resource, water resources play a vital role in social development. The supporting degree of the river basin’s economic and social scale is an important aspect of water resources research, and also a key factor restricting the sustainable development of the basin (Zuo et al., 2021). In 2014, the Chinese government put forward new water management policies with water conservation as the priority in response to the increasingly serious water shortage (Wang and Guo, 2021). The evaluation of WRCC is an essential key step in regional water control. WRCC is a concept with natural and social attributes (Feng et al., 2008), but its connotation and meaning are not clear (Hartmann et al., 2014). Hui and Jiang, (2001) believes that WRCC is the maximum support capacity that water resources in a certain region can provide to the social and economic development of the region under the influence of the dual mode of “natural and artificial”, based on the foreseeable level of technology, economy, resources; and social development, based on the principle of sustainable development, and through reasonable optimization allocation. Xia and Zhu, (2002) defined WRCC as ‘At a certain stage of water resources development and utilization, the available water to meet ecological water demand can maintain the largest socio-economic scale of the limited development goals of population, resources, and environment in the region’; Song et al, (2011) believed that WRCC is the largest environmental supporting capacity that human activities do not harm to the regional water environment at a certain stage of social and economic development; Ren et al, (2016) defined WRCC as the largest industrial, agricultural, population and urban scale that the number of water resources in a specific area can carry without damaging the society and ecosystem. In this study, WRCC is defined as the maximum development potential of the region that can be tapped by available water resources under the sustainable development of social technology and residents’ living standards.
At present, there are many studies on the evaluation methods of WRCC. For example, Cao et al, (2020) used the principal component analysis method to evaluate the natural support of water resources in Fuyang; Wu and Jin, (2011) decomposed the weight structure of the evaluation index and established a projection pursuit model which uses the variable weight to evaluate the regional WRCC. Gong and Jin, (2009) adopted the fuzzy comprehensive evaluation method and found that Lanzhou meets difficulties in substandard water quality rather than the lack of water sources in terms of water resources. Peng and Deng, (2020) proposed the DOESBR conceptual model and evaluated WRCC in karst areas using combined weight assignment. Qi et al., 2021 analyzed the impact of climate change on agricultural WRCC in high-latitude basins by using a multivariate statistical analysis method. Liu et al., 2022a considered the interaction between people, water, and the city, pooled long-term data into a Human–Water–City evaluation index system consisting of 13 representative indicators, and used Principal component analysis to study the current and future WRCC in Wuhan. Hu et al., 2022 combine water supply-demand analysis and the S-shaped curve threshold analysis to calculate WRCC in Inner Mongolia. Other widely used methods include the artificial neural network Yu et al., 2020, the logistic attribution model Bai et al, (2019), and set pair analysis Wan et al, (2006).
WRCC of the basin is affected by many factors, and there is a coupling relationship between these factors. Although the above method can qualitatively evaluate the past WRCC of a specific region, it fails to comprehensively and systematically analyze and predict WRCC of the basin quantitatively. The SD model is a system simulation method proposed by Professor Forrester in 1958 (Niu and Sun, 2019), as a method suitable for describing complex systems and analyzing their dynamic behavior, SD can be used to deal with nonlinear, multi-feedback, and multi-level complex system problems (Forrester, 1997). The SD model can transform the interaction between different elements in a complex system into a series of interrelated data streams, and realize system simulation through dynamic feedback (Zhang et al., 2014; Zomorodian et al., 2018). For example, Sun and Yang, (2019) quantitatively evaluated WRCC of Xiong’an New Area by using the SD model, and proposed that the local government should control the expansion of secondary industry; Sun et al, (2017) used the SD model to simulate the status quo of water resources supply and demand in China over the past 15 years and found that the fundamental way to bridge the gap between water supply and demand is to improve water supply.
With only numerical values and no qualitative evaluation, the current state of water resources cannot be known. Since the SD model lacks a comprehensive qualitative evaluation, some scholars combine the SD model with other evaluation methods, such as combining the SD model with an improved fuzzy comprehensive evaluation method (Wang et al., 2021) or combining the SD model with the analytic hierarchy process (Yang et al., 2019). This kind of coupling method can systematically solve the problems of quantitative analysis and qualitative evaluation of regional WRCC. TOPSIS was originally proposed by Hwang and Yoon (1981) to help select the best alternative with a finite number of criteria (Tzeng and Huang, 2011). As a well-known classical MCDA/MCDM method, TOPSIS has received much interest from researchers and practitioners and has been widely used in water research (Behzadian et al., 2012). In this study, TOPSIS is used for qualitative analysis.
Therefore, an analysis and evaluation method combining the SD model and TOPSIS method is proposed in this paper. The SD model is firstly used to calculate relevant data on basin water resources, then the TOPSIS method is applied to calculate WRCC in the Hangbu River basin.
The Hangbu River Basin is located in the west of Chaohu Lake Basin, with a drainage area of 4,246 km2, as shown in Figure 1. The administrative areas involved in the Hangbu River Basin include Jin’an District, Lu’an City, Shucheng county and Huoshan County of Lu’an City, Feixi County, Lujiang County of Hefei city, and Yuexi County of Anqing city. Among them, the Hangbu River Basin in Huoshan and Yuexi Counties covers an area of 217.59 km2, accounting for only about 5.13% of the Hangbu River Basin. This region is located in the upstream mountainous area, with few water users, and has little impact on the analysis of water resources in the Hangbu River Basin, so the two areas are excluded in this study. The Hangbu River Basin belongs to the subtropical humid monsoon climate zone in the north, with four distinct seasons and wet and warm climates. The multi-year annual precipitation of the basin is about 1,000 mm on average, the multi-year average relative humidity is 81%, the annual average evaporation is 1,397 mm, and the evaporation increases from southwest to northeast. The precipitation during the crop growth period is 780–850 mm. Also, the local place is featured by the sound rainfall and heat conditions, which can generally meet the needs of various thermophilic crops. The Hangbu River irrigation area in the basin is an important base for national grain crop production. In recent years, with the growth of population, the rapid development of the economy, and the increasing water consumption in irrigation areas, problems, such as periodic shortage of water resources and water environmental pollution have gradually emerged in the basin. The evaluation of WRCC of the Hangbu River basin will help alleviate the resource and environmental problems in the basin at this stage and ensure the sustainable development of the Hangbu River Basin.
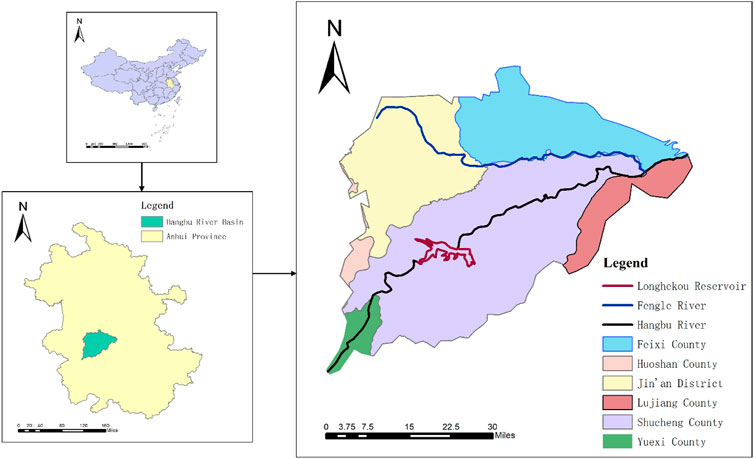
FIGURE 1. Geographical location of the Hangbu river basin.
All data in this study are annual data. Water resources data are mainly from Lu’an water resources bulletin (2015–2020) (http://slj.luan.gov.cn/index.html) and Hefei Water Resources Bulletin (2015–2020) (http://sswj.hefei.gov.cn/), and socio-economic data are mainly from Lu’an national economic and social development statistical bulletin (2015–2020) (https://www.luan.gov.cn/), Hefei National Economic and social development statistical bulletin (2015–2020) (https://www.hefei.gov.cn/) and Anhui national economic and social development statistical bulletin (2015–2020) (https://www.ah.gov.cn/). The Rest of the data comes from Comprehensive Planning of the Hangbu River Basin (2019–2035).
The SD model provides feedback on the structure and behavior of complex systems by building simulation models (Zhang et al., 2010). The SD model is often composed of a large number of nonlinear differential equations, which are solved by computer simulation. The core of the model is the state equation, which is used to describe the dynamic changes of the system (Wei et al., 2012). It can be expressed as follows,
where
To build up an SD model, the variables that have a certain impact on the regional WRCC and have a large amount of data are selected. Then a flow chart (as shown in Figure 2) is drawn by Vensim software (version: Vensim DSS), including the domestic water demand subsystem, industrial water demand subsystem, agricultural water demand subsystem, ecological water demand subsystem, and one water supply subsystem. Arrows are used to indicate the logical relationship between variables. Each variable is determined by all variables that point to it. All variables determined by time will change with the change of time, and the change of these variables will cause a change in the whole system. At each time node, each variable in the system has a unique value.
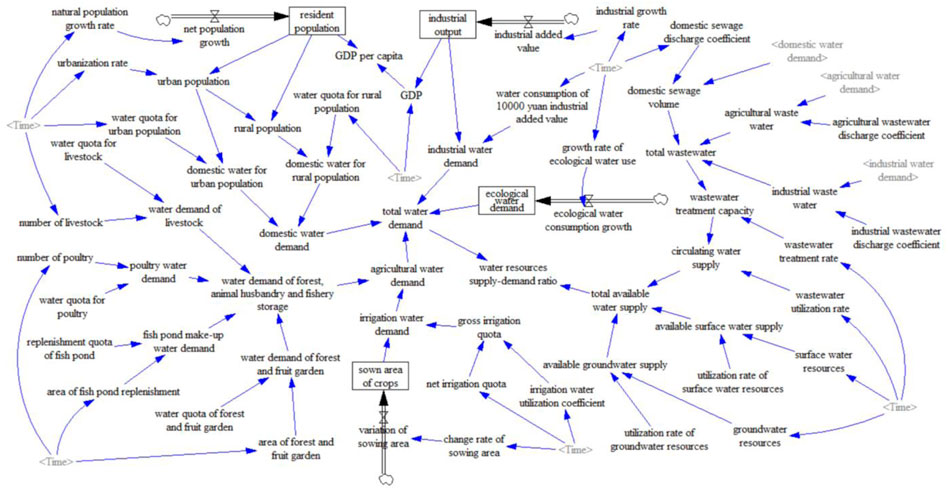
FIGURE 2. Flow chart of the SD model.
There are three kinds of variables in the flow chart: level variable, rate variable, and common variable The level variable is surrounded by a black border, which has its stock; Below the long black arrow is the rate variable, which is often determined by other common variables, and the rate variable determines the change rate of the level variable it points to. Some variables with complex numerical changes and little time correlation are represented by level variables, while others are represented by common variables. There will be some variables in the flow chart many times. Only one of these variables is displayed in black font, and the rest are displayed in gray font, which is called the shadow variable.
A formula or a data table is adopted to express the numerical relationship between variables. For example, the domestic water consumption of urban residents is equal to the urban population multiplied by the domestic water consumption quota of urban residents. The domestic water consumption of urban residents is calculated according to this formula. Table 1 demonstrates the relationship between water consumption of 10000 yuan industrial added value and time. Vensim software will fit the numerical relationship between the two according to this table and calculate the water consumption of 10000 yuan industrial added value in the subsequent time according to this table.

TABLE 1. Data table between water consumption of 10000 yuan industrial added value and time.
The role of the system dynamics model in the simulation of WRCC in the Hangbu River Basin is determined by whether the model can truthfully reflect the economic and social development of the Hangbu River Basin. Through parameter calibration, the calculation results can better reflect the status quo of the basin. Based on the research of Xu et al, (2020), the error degree of the model is expressed by the absolute relative error (ARE) between the real data and the simulated data. The ARE calculation formula is shown as,
where
If ARE does not exceed 10%, the model is considered to be in line with the status quo and can be used for the simulation of future situations.
The values of each variable in 2015 are input in the SD model of the Hangbu River Basin, the simulated value of each variable from 2016 to 2020 is iteratively calculated, the ARE between the simulated value and the true value is calculated, and then the numerical relationship between each variable and the initial value in 2015 is adjusted to recalculate until the ARE value meets the requirements.
Based on 6 years of actual data from 2015 to 2020, five variables, including resident population, urbanization rate, total GDP, crop sown area, and total water demand, are selected to verify the reliability of the model parameters. The ARE calculation results are shown in Table 3. It can be seen from Table 2 that the ARE of the five variables is less than 10%. It can be seen that the SD model can reflect the actual situation well and is highly reliable.
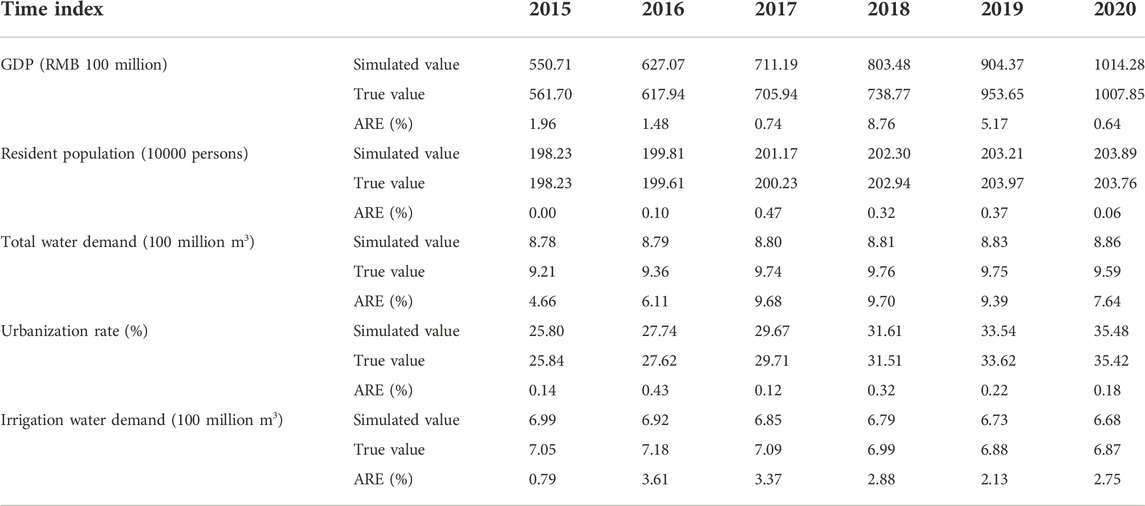
TABLE 2. Comparison of simulated and real values.
The evaluation index system of WRCC is the standard and basis for the comprehensive evaluation and research on the coordinated development of regional water resources, society, ecological environment, and economy (Cao et al., 2019). The main body of WRCC system is the water resources subsystem, while the target is the socio-economic and ecological environment subsystem supported by water (SONG et al., 2018). In developing WRCC evaluation index system, the principles of scientificity, completeness, a combination of dynamic and static, qualitative and quantitative, comparability, and feasibility need to be taken into consideration (Wang et al., 2004). Due to the limited amount of data available from the data source, this study selects 8 evaluation indexes that have a great influence on WRCC of the Hangbu River Basin from three aspects: natural support capacity, social technology level, and social living standard, and constructs the evaluation index system of WRCC. The natural supporting capacity reflects the supporting effect of the natural conditions of regional water resources on social development, including the per capita water supply and the ratio of water supply to demand; The socio-techno level reflects the social utilization efficiency of water resources, including water consumption per 10000 yuan GDP, irrigation water utilization coefficient and wastewater utilization rate; Social living standards reflect the degree of social demand for water resources, including GDP per capita, urbanization rate, and eco-environmental water use rate. These eight indicators are also frequently used in the evaluation of WRCC. For example, Peng and Deng (Gong and Jin, 2009) take into consideration the per capita GDP, water consumption per 10000 yuan GDP, per capita water consumption, and ecological environment water consumption rate when evaluating WRCC of Guiyang; Zhang et al, (2021) included the per capita GDP, urbanization rate, water consumption per 10000 yuan of GDP, and agricultural irrigation water consumption rate in their study when evaluating WRCC in Nanjing, Wang et al, (2022) took into consideration the utilization rate of renewable water resources, the balance rate of water resources supply and demand, and the urbanization rate.
The impact of these eight indexes on WRCC can also be divided into positive and adverse effects. See Table 3 for details.
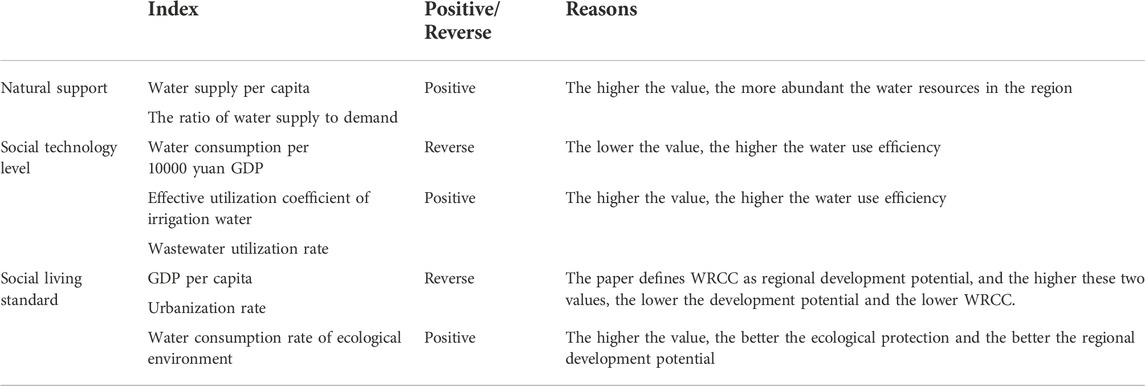
TABLE 3. Evaluating index of WRCC.
Since there are two kinds of indexes in the system, the subsequent data processing will be cumbersome without normalization. Therefore, the selected evaluation indexes should be normalized before the basin WRCC is evaluated (Wang et al., 2017). In the evaluation index system, the indicators that have a positive effect on WRCC are normalized by the following formula as follows,
where
The normalization formula of indicators that have a reverse effect on WRCC is shown as,
After normalization, the index data are standardized to eliminate the influence of each index dimension on the evaluation system. The standardized formula is as follows,
where
As different indicators have different impacts on WRCC of the basin, the weight of each evaluation index should be given. To avoid subjective preference in evaluating the weight of each index, this paper integrates subjective and objective weighting methods to calculate the weight of each index.
The analytic hierarchy process (AHP) is a subjective weighting method. Qualitative and quantitative levels are integrated to determine the index weight. AHP is often used to solve multi-dimensional decision-making problems. The calculation steps of the analytic hierarchy process are illustrated in detail in the literature (Du et al., 2022).
To obtain a reasonable objective weight for each indicator, the researchers in this study consulted the opinions of 9 experts, including 5 experts engaged in the research of water resources optimization and dispatching and 4 experts engaged in the research of urban flood control and drainage. Based on their scores on the importance of each indicator, nine groups of subjective weights were obtained by using AHP software. The nine groups of subjective weights passed the consistency test. In this paper, the average value of the nine groups of weights is taken as the subjective weight of the evaluation index of WRCC of the Hangbu River Basin.
The entropy weight method is an objective weighting method for information entropy. The information entropy and weight of the indicator are calculated according to the relative change degree of each value of the indicator. The greater the relative change of the indicator value, the greater the weight of the indicator. The weight of the entropy weight method is calculated in the steps as follows:
(1) Calculate the proportion of the j-th sample value of the ith index:
(2) Calculate the entropy of the ith index:
(3) Calculate the different degrees of the ith index:
(4) Calculate the weight of the ith index:
Where m is the number of indexes.
According to the water resources data of the Hangbu River Basin from 2015 to 2035 obtained from system dynamics simulation, the entropy weight method is used to calculate the objective weights of each evaluation index based on the SD model simulation data.
The paper takes the average value of subjective weight and objective weight as the combined weight of evaluation indicators. This method has not been thoroughly studied, but it is widely used Liu et al, (2022b); Li et al, (2022) and easy to operate, especially when we do not know which is more important, subjective or objective weights.
The weight values of each index can be seen in Table 4.
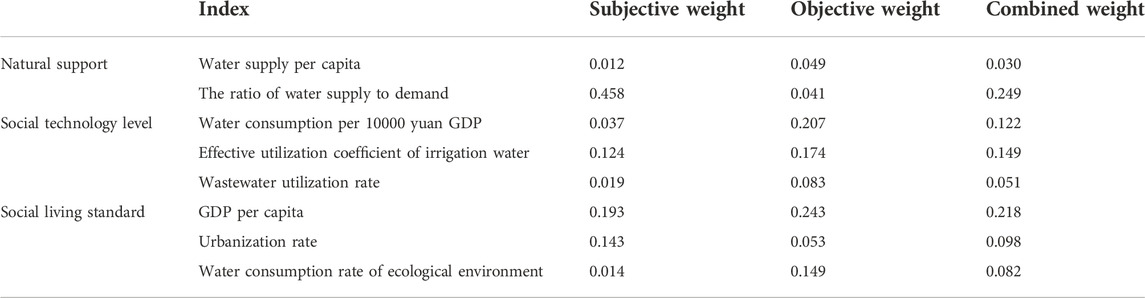
TABLE 4. Weight of each index.
It can be seen from Table 4 that the ratio of water supply to demand and GDP per capita have a great impact on WRCC of the Hangbu River Basin. This is consistent with the rapid economic development of the Hangbu River Basin in recent years; At the social and technological levels, the effective utilization coefficient of irrigation water has a greater weight, which is also in line with the actual positioning of the Hangbu River Basin as a national important food production base.
TOPSIS method, namely, “technique for order preference by similarity to an ideal solution”, can be adopted to rank the scenarios according to the Euclidean distance between each sample value and the ideal value. The basic principle is to establish the optimal (worst) scenario of the sample object, that is, the positive (negative) ideal point, determine the distance between the sample object and the positive (negative) ideal point, and obtain the proximity of the sample object to the ideal point (Wang et al., 2008; Wang et al., 2012; Sun et al., 2018). The calculation steps are as follows:
(1) Establish the index data as a matrix
(2) Establish weight vector
(3) Calculate
Where
(4) Calculate
The object
Different WRCC values correspond to different carrying capacity states. According to Yang et al, (2019), WRCC values are classified as shown in Table 5.
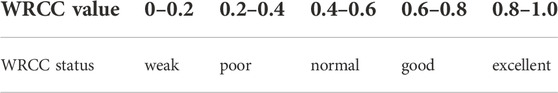
TABLE 5. Classification of WRCC.
By adjusting the model parameters, the SD model can simulate the data of water resources under different regional development scenarios. For example, when looking for the optimal development plan for Mu Us Sandy Land, Liu et al., 2022b adjusted the main parameters such as industrial growth rate, water consumption per unit output value, irrigation water quota, and domestic water quota in the SD model, and simulated six development scenarios. Yang et al., 2015 designed four development plans by adjusting water resource constraints and population migration to simulate WRCC of Tieling.
It is difficult for most cities to have both economic development and water resources protection. Referring to the plan of the economy and water resources in the Comprehensive Planning of the Hangbu River Basin (2019–2035), four scenarios are designed, and the water resources data of the Hangbu River basin under various scenarios are simulated by the SD model, and then the TOPSIS method is used to calculate WRCC.
Scenario 1: the scenario of continuing the original development trend. The industrial structure and development plan of the Hangbu River basin will not be significantly adjusted during the forecast period. Under the simulation scenario, the urbanization rate, each growth rate, and all kinds of water quotas remain unchanged or change according to the historical trend.
Scenario 2: the scenario of giving priority to economics. According to Anhui national economic and social development statistical bulletin in the past 5 years and the research of (Gu et al., 2021). The growth rate of the industry is increased to 200% of the original trend, the growth rate of crop sown area is increased to 200% of the original trend, and the growth rate of urbanization is increased to 120% of the original trend. Other conditions are kept constant or changed according to historical trends.
Scenario 3: the scenario of prioritizing water resources. Based on the research of (Liu et al., 2011), combined with the actual water consumption of cities in the Hangbu River Basin, the reduction rate of a net quota of irrigation water is increased to 180% of the original trend, and the growth rate of domestic water quota is reduced to 50% of the original trend. The water consumption reduction rate of 10000 yuan industrial added value is increased to 120% of the original trend. The water quota for forestry, animal husbandry, fishery, and livestock are decreased to 80% of the original trend, the growth rate of ecological water is increased to 120% of the original trend, the utilization coefficient of irrigation water is increased to 120% of the original trend, and the utilization rate of wastewater goes up to 140% of the original trend. Other conditions remain unchanged or change according to historical trends.
Scenario 4: the comprehensive development scenario. Based on the research of (Wang et al., 2017), the economic development and water use of the basin are integrated. The growth rate of the industry is increased to 150% of the original trend, the growth rate of crop sown area is increased to 150% of the original trend, the growth rate of urbanization rate is increased to 110% of the original trend, the reduction rate of net water quota for irrigation is increased to 130% of the original trend, and the growth rate of domestic water quota is reduced to 80% of the original trend. The water consumption reduction rate of 10000 yuan industrial added value is increased to 110% of the original trend, the growth rate of ecological water is increased to 110% of the original trend, the irrigation water utilization coefficient is increased to 110% of the original trend, and the wastewater utilization rate is increased to 120% of the original trend. Other conditions remain unchanged or change according to historical trends.
After SD model simulation and TOPSIS method calculation, the water resource data and WRCC of each scenario are shown in Figures 3, 4.
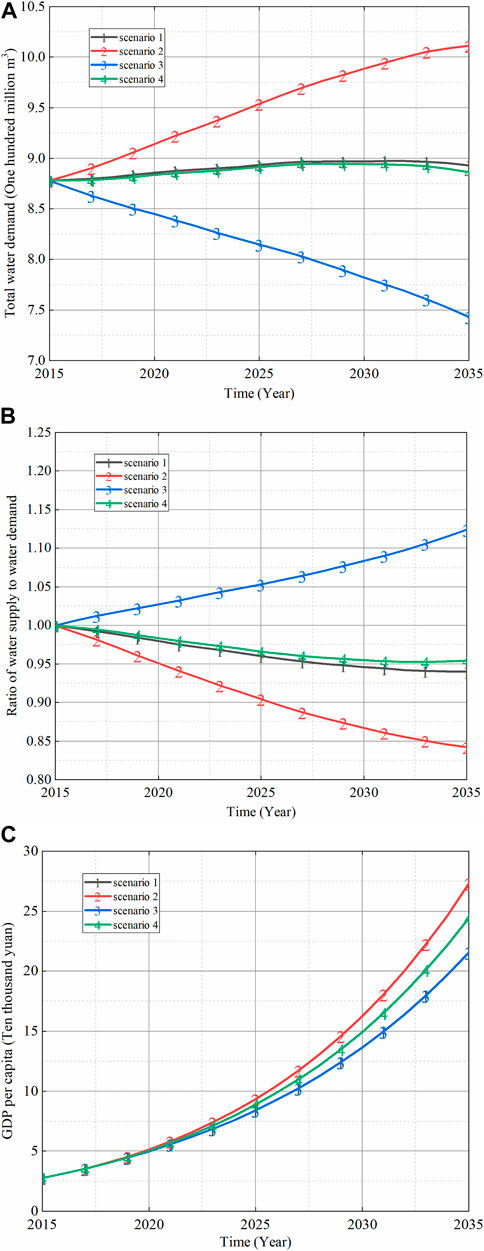
FIGURE 3. Simulation results of three variables.
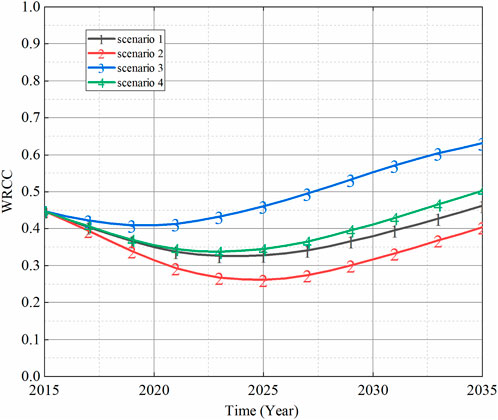
FIGURE 4. WRCC in four scenarios.
Under scenario 1, the total water demand in the Hangbu River Basin changes slightly, reaching a maximum value of 897 million m3 in 2032, and then decreasing slightly. The total water demand in 2035 reaches 893 million m3. The ratio of water supply to demand continues to decline, from 1.000 in 2015 to 0.934 in 2035, and the shortage of water resources becomes more and more obvious. With the development of water technology in the basin, the water use efficiency has been improved, and the annual decline rate of water resources supply and demand has gradually decreased, from an average annual decline of 0.0037 from 2015 to 2020 to an average annual decline of 0.0010 from 2031 to 2035. In terms of economic development, the GDP per capita of the basin will reach 215700 yuan in 2035. WRCC generally decreases first and then increases. It was 0.445 in 2015, drops below 0.400 in 2018, that is 0.382, falls to the lowest point of 0.325 in 2024, and then gradually recovers. It will return to 0.412 in 2032, and WRCC in 2035 will reach 0.464.
Under scenario 2, the water shortage in the Hangbu River Basin is more severe, and the total water demand continues to increase, reaching 1.011 billion m3 by 2035. The ratio of water supply to demand continues to decline, from 1.000 in 2015 to 0.837 in 2035. In terms of economic development, the GDP per capita of the basin will reach 273000 yuan in 2035. The general change trend of WRCC is consistent with that in scenario 1. It is 0.445 in 2015, falls below 0.400 in 2017, that is 0.392, drops to the lowest point of 0.262 in 2025, and then gradually rises. It will recover to above 0.300 in 2029, which is 0.301, and rise to 0.406 in 2035.
Under scenario 3, the total water demand will continue to decrease in 2027 and will drop to 743 million m3 in 2035. The ratio of water supply to demand continues to increase, from 1.000 in 2015 to 1.117 in 2035, and the growth rate increases from an average annual growth rate of 0.0043 in 2015–2020 to an average annual growth rate of 0.0064 in 2031–2035. In terms of economic development, the GDP per capita of the basin will reach 215700 yuan in 2035. WRCC shows an upward trend. WRCC is 0.445 in 2015, falls to the lowest point of 0.407 in 2020, and then gradually rises. It will rebound to 0.445 in 2024, reaching WRCC level in 2015, increase above 0.600 to 0.606 in 2033, and reach 0.633 in 2035.
Under scenario 4, the total water demand of the Hangbu River Basin changes slightly, reaching the maximum value of 895 million m3 in 2028, and then decreases slightly. The total water demand will be 886 million m3 in 2035. The ratio of water supply to demand decreases firstly and then increases, which drops to the minimum value of 0.946 in 2033, then rebounds slightly, and reaches 0.948 in 2035. In terms of economic development, the GDP per capita of the basin will reach 244300 yuan in 2035. The overall trend of WRCC is consistent with that of scenario 1. It is 0.445 in 2015, falls below 0.400 in 2018, that is 0.385, falls to the lowest point of 0.338 in 2023, and then gradually recovers. It will rise above 0.400 in 2030, which is 0.413 and WRCC will reach 0.504 in 2035.
Under scenario 1, the ratio of water supply to demand in the Hangbu River Basin is slightly worse than that in scenario 4, better than that in scenario 2, and worse than that in scenario 3. In 2035, 6.6% of the water demand will not be met, and the basin will face a water shortage for a long time, and the water shortage is difficult to solve. In terms of economic development, the GDP per capita of the Hangbu River Basin in 2035 under this scenario is the same as scenario 3, lower than scenario 2 and scenario 4. From the perspective of WRCC, it will be lower than 0.400 for 14 years during the study period. During this period, WRCC is in a poor state. The overall level of WRCC is higher than that under scenario 2 and worse than that under scenario 3 and scenario 4.
Under scenario 2, the Hangbu River Basin has the lowest ratio of water supply to demand of the four scenarios. In 2035, 16.3% of the water demand will not be met, and the water resource gap is huge, suggesting that the shortage of water resources in this scenario will be an increasingly serious long-term problem under this scenario. In terms of economic development, the GDP per capita in 2035 under this scenario is the highest among the four scenarios, 11.75% higher than that under scenario 4 and 26.56% higher than that under scenarios 1 and 3. However, it should be noted that the GDP per capita in 2035 under scenarios 1 and 3 is RMB 215700, reaching US $34000 according to the exchange rate in April 2022, which approximates the level of moderately developed countries. Based on this, compared with the shortage of water resources, the economic advantage of this scenario is relatively weak and from the comparison of WRCC, it can be seen that the Hangbu River WRCC under this scenario is the worst among the four scenarios.
Under scenario 3, the ratio of water supply to demand in the Hangbu River Basin is the highest among the four scenarios. The ratio of water supply to demand will reach 1.117 in 2035, while that of the other three scenarios is less than 1.000, indicating that water resources are abundant in the near-term development process of the basin under this scenario. In terms of economic development, the GDP per capita of the Hangbu River Basin in 2035 under this scenario is the same as scenario 1, which is lower than scenario 2 and scenario 4. As for WRCC, it will always be higher than 0.400 during the study period and will exceed 0.600 from 2033, reaching a sound state and further providing strong support for the sustainable development of subsequent basins. Furthermore, the overall WRCC under this scenario is optimum.
Under scenario 4, the ratio of water supply to demand in the Hangbu River Basin is better than in scenario 1 and scenario 2, and worse than in scenario 3. In 2005, 5.2% of the water demand will not be met. However, it should be noted that the ratio of water supply to demand in this scenario will rise from 2033 to 2035, indicating that the basin will face water shortage during development in this scenario, but the problem may be improved or can be solved. In terms of economy, under this scenario, the GDP per capita of the Hangbu River Basin in 2035 is higher than scenario 1 and scenario 3 and worse than scenario 2. From the perspective of WRCC, it will be lower than 0.400 for 12 years during the study period, which is in a poor state. The overall level of WRCC outperforms that under scenario 1 and scenario 2 and is worse than that under scenario 3.
In September 2020, China put forward the policies of “carbon peaking” and “carbon neutrality”. It means that China will strive to reach the peak of carbon emissions by 2030 and achieve relatively zero carbon emissions by 2060. The “double carbon” policy requires all regions to improve science and technology, readjust the industrial structure and energy structure, and reduce their dependence on resources and the environment.
Compared with Western China and North China, the Hangbu River Basin has abundant water resources. The simulation reveals that such a relatively water-rich region will face a long-term water shortage if the current trajectory continues. Then, the local water shortage problem will be more serious in the future. Therefore, the “double carbon” policy is correct and will effectively improve sustainable development in all regions of China.
From a national perspective, the economy of the Hangbu River Basin is underdeveloped, and agriculture still dominates in the basin. Compared with the industry and service industry, agriculture consumes a huge amount of water under the same value of production, and the irrigation water use coefficient in the basin is about 0.535 in 2020, lower than the national average of 0.55. Therefore, the Hangbu River Basin is highly dependent on water resources. If the development plan of giving priority to water resources is not adopted, the basin will inevitably be posed with a water shortage. At that time, there will be a shortage of water resources, and the use of highly polluting resources, such as coal, will be restricted due to the “double carbon” policy. It is far from enough to rely on new energy to support the development of the basin. Therefore, in the context of the “double carbon” policy, the Hangbu River Basin must adopt a development plan that prioritizes water resources.
Based on the analysis of this study, the scenario of giving priority to water resources is the best development plan suitable for the Hangbu River Basin. Previous studies on WRCC have considered comprehensive development as the best option, such as research on WRCC in Xi’an by (Niu and Sun, 2019) and research on WRCC of Xiong’an New Area by (Yu et al., 2020). After analysis, there are two main reasons for the difference. The first reason is the different evaluation standards and methods for WRCC, and the second reason lies in different regional development priorities. Xi’an and Xiong’an New Area are large cities that have been built or are being planned. The secondary and tertiary industries are relatively developed, and the primary industry accounts for a relatively low proportion. When comprehensive development plans are adopted for these cities, the regional water resources carrying capacity is optimized instead. As an important grain production area, the Hangbu River Basin has a large area of arable land and a high proportion of agricultural water. According to the national regulation that the red line of 1.8 billion mu of arable land should be preserved, the area of arable land cannot be reduced at will, so the water consumption for agriculture cannot be reduced significantly. Only by adopting the development plan of giving priority to water resources can we ensure that there will always be sufficient water resources for regional development.
Therefore, the following suggestions are put forward to the relevant urban governments in the Hangbu River Basin:
1) The water used for irrigation should be improved. At present, the efficiency of irrigation water used in the basin is low, and the waste of irrigation water is huge. Some measures can be taken, such as lining the irrigation canal and increasing the drip irrigation area of crops, to improve the effective utilization coefficient of irrigation water.
2) Economic development should not be taken as a priority. If the local places continue to be economy-oriented, regional resources will be consumed more rapidly. It is not worthwhile pursuing limited economic growth by consuming more water resources, because it will further hinder regional development.
According to the characteristics of water resources and water use in the Hangbu River Basin, the influencing factors of WRCC in the Hangbu River Basin are selected, the system dynamics model of the Hangbu River Basin is built, four scenarios of continuing the original development trend, economic priority, water resources priority and comprehensive development are designed, the changes of various data related to water resources in the Hangbu River Basin from 2015 to 2035 is simulated, and eight indexes that can reflect the carrying capacity of the Hangbu River Basin are selected. The changing trend of WRCC of each development scenario is calculated and compared based on the good and bad solution distance method. According to the results, the following conclusions are drawn:
1) With a reasonable flow chart design and parameter calibration, the system dynamics model can effectively simulate the change of water resources in the basin.
2) For the Hangbu River Basin, the development scenario of giving priority to water resources is the best.
If the scenario of continuing the original trend is adopted, the Hangbu River Basin will face a water shortage for a long time, and the water shortage is difficult to solve. If the economic priority development scenario is adopted, the economic situation of the basin will be greatly improved. At the same time, the basin will be very short of water, and the water shortage will become more and more serious. If the comprehensive development plan is adopted, the economic situation of the basin will be improved and the water resource shortage will also appear, but the water resource shortage under the plan may be improved or can be solved. The scenario of giving priority to water resources has significantly improved WRCC of the Hangbu River Basin, and abundant water resources can provide strong support for the sustainable development of the basin.
3) As a country with relatively scarce water resources per capita, China urgently needs to adjust its development mode. In this context, the ‘double carbon’ policy is appropriate.
The original contributions presented in the study are included in the article/supplementary material, further inquiries can be directed to the corresponding author.
YL and CG contributed to the conception and design of the study. XJ, ZZ, and YZ organized the database. CL and ZW performed the statistical analysis. YL wrote the first draft of the manuscript. CG wrote sections of the manuscript. All authors contributed to manuscript revision, read, and approved the submitted version.
This work was partially funded and supported by National Key R&D Program of China (Granted: 2018YFD1100102), the Fundamental Research Funds for the Central Universities (Granted: B220202028).
The authors declare that the research was conducted in the absence of any commercial or financial relationships that could be construed as a potential conflict of interest.
All claims expressed in this article are solely those of the authors and do not necessarily represent those of their affiliated organizations, or those of the publisher, the editors and the reviewers. Any product that may be evaluated in this article, or claim that may be made by its manufacturer, is not guaranteed or endorsed by the publisher.
Bai, L., Wu, C. G., Jin, J. L., Zhou, L. Y., and Ning, S. W. (2019). Logistic relational analysis method for regional water resources carrying capacity evaluation. Yellow River 41 (12), 43–49.
Behzadian, M., Otaghsara, S. K., Yazdani, M., and Ignatius, J. (2012). A state-of the-art survey of TOPSIS applications. Expert Syst. Appl. 39 (17), 13051–13069. doi:10.1016/j.eswa.2012.05.056
Cao, F., Lu, Y., Dong, S., and Li, X. (2020). Evaluation of natural support capacity of water resources using principal component analysis method: A case study of Fuyang district, China. Appl. Water Sci. 10 (8), 192–198. doi:10.1007/s13201-020-1174-7
Cao, Q. W., Bao, C., Gu, C. L., and Guan, W. H. (2019). SD model and Simulation of China's Urbanization Based on water resource constraints [J]. Geogr. Res. 38 (01), 167–180.
Du, X. F., Li, Y. B., and Zhang, X. Y. (2022). Study on water resources carrying capacity of zhengzhou city based on TOPSIS model. Yellow River 44 (2), 84–88.
Feng, L. H., Zhang, X. C., and Luo, G. Y. (2008). Application of system dynamics in analyzing the carrying capacity of water resources in Yiwu City, China. Math. Comput. Simul. 79 (3), 269–278. doi:10.1016/j.matcom.2007.11.018
Forrester, J. W. (1997). Industrial dynamics. J. Operational Res. Soc. 48 (10), 1037–1041. doi:10.1057/palgrave.jors.2600946
Gong, L., and Jin, C. (2009). Fuzzy comprehensive evaluation for carrying capacity of regional water resources. Water Resour. manage. 23 (12), 2505–2513. doi:10.1007/s11269-008-9393-y
Gu, M. R., Wang, F., and Wang, S. H. (2021). Simulation Research on China's green development policy based on system dynamics [J]. China Environ. Manag. 13 (03), 126–135. doi:10.16868/j.cnki.1674-6252.2021.03.126
Hartmann, A., Goldscheider, N., Wagener, T., Lange, J., and Weiler, M. (2014). Karst water resources in a changing world: Review of hydrological modeling approaches. Rev. Geophys. 52 (3), 218–242. doi:10.1002/2013rg000443
Hu, M., Li, C., Zhou, W., Hu, R., and Lu, T. (2022). An improved method of using two-dimensional model to evaluate the carrying capacity of regional water resource in Inner Mongolia of China. J. Environ. Manag. 313, 114896. doi:10.1016/j.jenvman.2022.114896
Hui, Y. H., and Jiang, X. H. (2001). Study on dynamic simulation model of water resources carrying capacity system in binary mode. Geogr. Res. 20 (2), 8.
Li, Y., Zhang, J., and Song, Y. (2022). Comprehensive comparison and assessment of three models evaluating water resource carrying capacity in Beijing, China. Ecol. Indic. 143, 109305. doi:10.1016/j.ecolind.2022.109305
Liu, H., Xia, J., Zou, L., and Huo, R. (2022). Comprehensive quantitative evaluation of the water resource carrying capacity in Wuhan City based on the “human–water–city” framework: Past, present and future. J. Clean. Prod. 366, 132847. doi:10.1016/j.jclepro.2022.132847
Liu, J. J., Dong, S. C., and Li, Z. H. (2011). Comprehensive evaluation of China’s water resources carrying capacity. J. Nat. Resour. 26 (2), 258–269.
Liu, L., Xu, X., Wu, J., Jarvie, S., Li, F., Han, P., et al. (2022). Comprehensive evaluation and scenario simulation of carrying capacity of water resources in Mu Us Sandy Land, China. Water Supply 22 (9), 7256–7271. doi:10.2166/ws.2022.304
Niu, F. Q., and Sun, D. Q. (2019). Simulation of resources and environment carrying capacity and sustainability of China’s economic development. J. Geogr. 74 (12), 2604–2613.
Peng, T., and Deng, H. (2020). Comprehensive evaluation on water resource carrying capacity based on dpesbr framework: A case study in Guiyang, southwest China. J. Clean. Prod. 268, 122235. doi:10.1016/j.jclepro.2020.122235
Qi, P., Xia, Z., Zhang, G., Zhang, W., and Chang, Z. (2021). Effects of climate change on agricultural water resource carrying capacity in a high-latitude basin. J. Hydrology 597, 126328. doi:10.1016/j.jhydrol.2021.126328
Ren, C., Guo, P., Li, M., and Li, R. (2016). An innovative method for water resources carrying capacity research–metabolic theory of regional water resources. J. Environ. Manag. 167, 139–146. doi:10.1016/j.jenvman.2015.11.033
Song, J. X., Tang, B., Zhang, J. L., Dou, X., Liu, Q., and Shen, W. (2018). System dynamics simulation for optimal stream flow regulations under consideration of coordinated development of ecology and socio-economy in the Weihe River Basin, China. Ecol. Eng. 124, 51–68. doi:10.1016/j.ecoleng.2018.09.024
Song, X. M., Kong, F. Z., and Zhan, C. S. (2011). Assessment of water resources carrying capacity in Tianjin City of China. Water Resour. manage. 25, 857–873. doi:10.1007/s11269-010-9730-9
Sun, B., and Yang, X. (2019). Simulation of water resources carrying capacity in Xiong’an New Area based on system dynamics model. Water 11 (5), 1085. doi:10.3390/w11051085
Sun, Y., Liu, N., Shang, J., and Zhang, J. (2017). Sustainable utilization of water resources in China: A system dynamics model. J. Clean. Prod. 142, 613–625. doi:10.1016/j.jclepro.2016.07.110
Sun, Y., Yang, K., Liu, J. L., Zhong, J. H., Qiu, G. S., Gu, G. H., et al. (2018). Evaluation model of reclaimed water quality based on TOPSIS and variable weight fuzzy. Yellow River 40 (8), 57–61.
Tzeng, G. H., and Huang, J. (2011). Multiple attribute decision making: Methods and applications. Boca Raton, Florida: CRC Press.
Wan, X., Ding, J., and Zhang, X. L. (2006). Set pair analysis for comprehensive evaluation on regional groundwater resources carrying capacity[J. ]. Urban Environ. Urban Ecol. 19 (2), 8–10.
Wang, G., Xiao, C., Qi, Z., Meng, F., and Liang, X. (2021). Development tendency analysis for the water resource carrying capacity based on system dynamics model and the improved fuzzy comprehensive evaluation method in the Changchun city, China. Ecol. Indic. 122, 107232. doi:10.1016/j.ecolind.2020.107232
Wang, H., Qin, D. Y., Wang, J. H., and Li, L. Y. (2004). Study on carrying capacity of water resources in inland arid zone of Northwest China. J. Nat. Resour. 19 (2), 151–159.
Wang, J., Li, J., Wei, H. Y., and Tian, P. (2008). Prediction and evaluation of regional water resources carrying capacity based on TOPSIS method – Taking Guanzhong area of Shaanxi Province as an example. Study Soil Water Conservation 15 (3), 161–163.
Wang, J. Z., and Guo, P. P. (2021). Thoughts on the management of Bosten Lake Basin based on the water control policy in the new era. Water Conservancy Plan. Des. 207 (1), 10–12+23.
Wang, J. H., Zhai, Z. L., Sang, X. F., and Li, H. H. (2017). Study on index system and judgment criterion of water resources carrying capacity. J. Hydraulic Eng. 48 (9), 1023–1029.
Wang, Y. N., Sun, L. Q., Wang, Z. L., and Liu, M. (2012). Comprehensive evaluation of water supply safety in Northern Anhui. Water Conservancy Hydropower Technol. 43 (1), 30–34.
Wang, Y. Q., Li, G. P., and Yan, B. Q. (2022). Simulation of watershed water resources carrying capacity based on SD and AHP model. Syst. Eng. 40 (3), 24–32.
Wei, S. K., Yang, H., Song, J. X., Abbaspour, K. C., and Xu, Z. (2012). System dynamics simulation model for assessing socio-economic impacts of different levels of environmental flow allocation in the Weihe River Basin, China. Eur. J. Operational Res. 221 (1), 248–262. doi:10.1016/j.ejor.2012.03.014
Wu, K. Y., and Jin, J. L. (2011). Projection pursuit evaluation model of regional water resources security based on variable weight and information entropy. Resour. Environ. Yangtze River Basin 20 (9), 1085–1091.
Xia, J., and Zhu, Y. Z. (2002). The measurement of water resources security: Research and challenge of water resources carrying capacity. J. Nat. Resour. 17 (3), 5–7.
Xu, K. L., Lv, H. S., and Zhu, Y. H. (2020). Dynamic simulation and research on water resources carrying capacity system. J. Water Resour. Water Eng. 31 (6), 67–72.
Yang, J., Lei, K., Khu, S., and Meng, W. (2015). Assessment of water resources carrying capacity for sustainable development based on a system dynamics model: A case study of tieling city, China. Water Resour. manage. 29 (3), 885–899. doi:10.1007/s11269-014-0849-y
Yang, Z. Y., Song, J. X., Cheng, D. D., Xia, J., Li, Q., and Ahamad, M. I. (2019). Comprehensive evaluation and scenario simulation for the water resources carrying capacity in Xi’an city, China. J. Environ. Manag. 230, 221–233. doi:10.1016/j.jenvman.2018.09.085
Yu, C., Li, Z., Yang, Z., Chen, X., and Su, M. (2020). A feedforward neural network based on normalization and error correction for predicting water resources carrying capacity of a city. Ecol. Indic. 118, 106724. doi:10.1016/j.ecolind.2020.106724
Zhang, B., Yu, Z. H., Sun, Q., Li, S., Huang, M. X., Wang, L. Q., et al. (2010). A brief introduction to system dynamics and its related software. Environ. Sustain. Dev. 35 (2), 1–4.
Zhang, Z., Lu, W. X., Zhao, Y., and Song, W. (2014). Development tendency analysis and evaluation of the water ecological carrying capacity in the Siping area of Jilin Province in China based on system dynamics and analytic hierarchy process. Ecol. Model. 275, 9–21. doi:10.1016/j.ecolmodel.2013.11.031
Zhang, Z. Y., Liu, C. W., Gao, C., and Ding, H. K. (2021). Research on water resources carrying capacity and influencing factors of typical villages and towns in rapid urbanization area [J]. J. Ecol. Rural Environ. 37 (07), 877–884.
Zomorodian, M., Lai, S. H., Homayounfar, M., Ibrahim, S., Fatemi, S. E., and El-Shafie, A. (2018). The state-of-the-art system dynamics application in integrated water resources modeling. J. Environ. Manag. 227, 294–304. doi:10.1016/j.jenvman.2018.08.097
Keywords: WRCC, SD model, TOPSIS method, different scenarios, regional development
Citation: Liu Y, Gao C, Ji X, Zhang Z, Zhang Y, Liu C and Wang Z (2022) Simulation of water resources carrying capacity of the Hangbu River Basin based on system dynamics model and TOPSIS method. Front. Environ. Sci. 10:1045907. doi: 10.3389/fenvs.2022.1045907
Received: 16 September 2022; Accepted: 04 November 2022;
Published: 28 November 2022.
Edited by:
Zhanhong Wan, Zhejiang University, ChinaReviewed by:
Ying Zhu, Xi’an University of Architecture and Technology, ChinaCopyright © 2022 Liu, Gao, Ji, Zhang, Zhang, Liu and Wang. This is an open-access article distributed under the terms of the Creative Commons Attribution License (CC BY). The use, distribution or reproduction in other forums is permitted, provided the original author(s) and the copyright owner(s) are credited and that the original publication in this journal is cited, in accordance with accepted academic practice. No use, distribution or reproduction is permitted which does not comply with these terms.
*Correspondence: Cheng Gao, Z2Nob2hhaUAxNjMuY29t
Disclaimer: All claims expressed in this article are solely those of the authors and do not necessarily represent those of their affiliated organizations, or those of the publisher, the editors and the reviewers. Any product that may be evaluated in this article or claim that may be made by its manufacturer is not guaranteed or endorsed by the publisher.
Research integrity at Frontiers
Learn more about the work of our research integrity team to safeguard the quality of each article we publish.