 Shanshan Zhao
 Ying Mei
 Yundi Jiang1
 Shiquan Wan
 Wenping He
94% of researchers rate our articles as excellent or good
Learn more about the work of our research integrity team to safeguard the quality of each article we publish.
Find out more
ORIGINAL RESEARCH article
Front. Environ. Sci., 18 October 2022
Sec. Atmosphere and Climate
Volume 10 - 2022 | https://doi.org/10.3389/fenvs.2022.1045133
This article is part of the Research TopicClimate-Environment Interactions under Global WarmingView all 25 articles
Approximate entropy (ApEn) can measure the regularity and complexity of a nonlinear system. We find that the results of ApEn are relatively stable when the sample size of a time series exceeds 100, which indicates that the estimation results of the ApEn algorithm are robust to small sample data. In this study, the complexity of the daily precipitation records in China from 1961 to 2015 was first analyzed by using ApEn, and then we further investigated the spatial and temporal variability of the dynamical characteristics of precipitation. The results show that the ApEn values of daily precipitation in China during 1961–2015 present the following characteristics: larger in southern and eastern China and smaller in northern and western China. In addition, ApEn in Northwest China and the Tibetan Plateau has been increasing since 1961. However, since the 1970s, ApEn in the south of the middle and lower reaches of the Yangtze River shows a gradual decrease. The temporal instances of abrupt ApEn changes in daily precipitation occur from region to region. The number of stations with an abrupt ApEn shift has a statistically significant increase since 1984 at a significant level of α = 0.01, which means the complexity characteristic of daily precipitation in China has been more prone to abrupt shifts since 1984 than in the previous period.
In recent years, with the development of nonlinear science, various exponents from the nonlinear dynamic field were applied to describe the underlying dynamical characteristics of a time series, including correlation dimension (CD), Lyapunov characteristic exponent, and Kolmogorov entropy (Grassberger and Procaccia, 1983a; Wang et al., 1984; Wang and Yang, 2002). CD can be used to quantitatively characterize the minimal effective state variables needed to accurately describe a complex system. Grassberger and Procaccia (1983b) presented a classical method for estimating CD of a time series using the Grassberger−Procaccia algorithm (GPA). GPA is also commonly used to calculate the Kolmogorov entropy of a time series. However, the estimation of GPA is heavily dependent on parameters, such as sample sizes, time delay, and embedding dimension in phase space reconstruction (Rosenstein et al., 1993). The Lyapunov exponent is a physical quantity that measures the rate of separation or approach of infinitesimally close trajectories in the phase space of a dynamical system (Lyapunov, 1966). The Lyapunov exponent is a valuable indicator of whether the dynamical behavior of a dynamical system is chaotic or not. However, it is well known that how to obtain an accurate Lyapunov exponent is also a very difficult problem. Approximate entropy (ApEn) can measure the regularity and complexity of a time series, which is related to the Kolmogorov entropy and the rate of generation of new information (Pincus, 1991, 1992, 1995). Based on the ApEn method, He et al. (2011) developed a moving cut data-approximate entropy (MC-ApEn) technique to detect an abrupt change in the complexity of a time series. Jin et al. (2012a, 2012b) found that the detection results of MC-ApEn are little affected by the periodical trend, linear trend, nonlinear trend, random spikes, and Gaussian white noise and demonstrated the robustness of the detection performance of MC-ApEn for identifying the complexity of a time series.
Climate systems are complex dynamical systems, which are not only subjected to external forcing but also have complex internal nonlinear dissipation. The complexity of the climate systems is mainly due to the complexity of the temporal and spatial evolution of different meteorological elements, such as temperature, precipitation, wind speed, wind direction, humidity, and air pressure. By analyzing the observational records of different meteorological elements, the nonlinearity and complexity properties of the climate system can be revealed to a certain extent. Precipitation has an important influence on social and economic development in China. Therefore, the variability in precipitation in China has attracted much attention. Some studies showed that there were no statistically significant trends in annual total precipitation in China (Karl et al., 1995; Zhai et al., 1999). However, Liu et al. (2005) found that precipitation in China increased by 2% from 1960 to 2000, while the frequency of precipitation events decreased by 10%. The annual mean precipitation increased in southwestern, northwestern, and East China while decreasing in North China and central-northern China (Liu et al., 2005; Wang and Zhou, 2005). The frequency of precipitation shows an increasing trend in northwestern China, but the opposite is true in the rest of China during 1960–2000 (Liu et al., 2005). The increasing trends of precipitation occurred in all four seasons for Northwest China and only in summer for East China (Gemmer et al., 2004; Wang and Zhou, 2005). In summer, rainfall increased in the middle and lower reaches of the Yangtze River valley, while it presented a reduced characteristic in northern China (Gong and Ho, 2003; Zhai et al., 2005; Wang et al., 2013). Furthermore, summer rainfall in East China experienced four inter-decadal abrupt changes, occurring in 1979, 1983, 1993, and 1999, during 1958–2009 (Liu et al., 2011). However, does the complexity of precipitation in China also follow a decadal shift? That remains an open question.
The ApEn algorithm has been applied to study the dynamical characteristics of the climate system in China (He et al., 2009; 2012). Wang and Zhang (2008) found that ApEn can reflect the territorial difference in dynamic structures of the climate system in China, and abrupt climate changes occurred between the 1970s and 1980s. However, most of the former studies only analyzed ApEn for daily precipitation from a few representative stations. Spatial and temporal variations in ApEn for daily precipitation in China have still not been systematically investigated. In this study, we first describe the data used in this study and briefly outline the ApEn method and moving t-test technique (MTT). Then, the results of ApEn and MTT are shown to discover the spatial and temporal variations in the complexity of daily precipitation in China. A brief discussion as well as conclusion following Results is given.
Observed daily precipitation data are provided by the National Meteorological Information Center of China Meteorological Administration. The observational data includes daily precipitation from 1 January 1960 to 31 December 2015 for 1781 stations in China. The meteorological stations are more concentrated in the central and eastern parts of China than in western China (Figure 1).
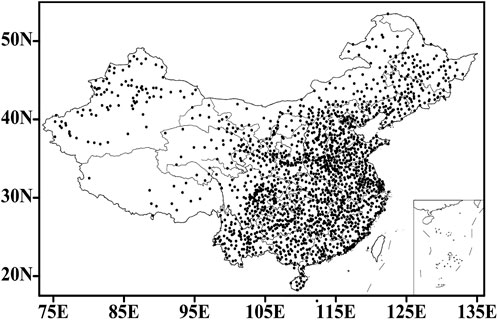
FIGURE 1. Spatial distribution of the 1781 meteorological stations in China.
ApEn can quantify the changing complexity of chaotic and stochastic processes (Pincus, 1991, 1995; Pincus and Goldberger, 1994). ApEn has been extensively studied and applied in many fields (Ocak, 2009; Yentes et al., 2013). The ApEn algorithm is briefly described as follows: first, a sequence of vectors x (1), x (2),…, x (N-m+1) are constructed from a time series {u(i), i = 1,2, ..., N} in the m-dimensional space.
Next, the distance (d [x(i),x(j)]) between the vectors x(i) and x(j) is calculated following Takens (1983):
A positive real number r is defined as a filter. For each i (1 ≤ i ≤ N-m+1), the number of j such that d [x(i) and x(j)]≤r is counted as W. Also, the ratio is defined by the following equation:
Based on
Thus, the estimated value of ApEn is defined as follows:
Yentes et al. (2013) demonstrated that ApEn is sensitive to parameter choices and suggested using N larger than 200, an m of 2, and examined several r values before selecting parameters. Pincus (1991) pointed out that for m = 2 and N = 100, r ranges from 0.1 to 0.2 standard deviation (SD of the original time series {u(i), i = 1,2, ..., N}). In this study, m is 2, and r is 0.15 SD (He et al., 2011). The regularity of the time series is associated with the ApEn value (Yan and Gao, 2007). The greater the regularity is, the lower the ApEn value is. A low value of ApEn denotes a high degree of regularity and low complexity of a dynamical system; thus, the system is more predictable than one with a relatively larger ApEn value. Therefore, based on the ApEn algorithm, we can identify the variations of dynamical characteristics by evaluating the regularity and unpredictability of a system.
ApEn has potential applications in relatively short (greater than 100 points) and noisy datasets (Pincus, 1995). However, Richman et al. (2000) found that the ApEn results are heavily dependent on the record length and are uniformly lower than the expectation for short records. To quantitatively estimate the effect of the sample size on the ApEn results, we performed two sets of independent tests.
In the first test, solutions of the Lorenz model are used to test the sensitivity of the sample size. The Lorenz model (Lorenz, 1963) is defined by Eq 6:
Here, the parameter
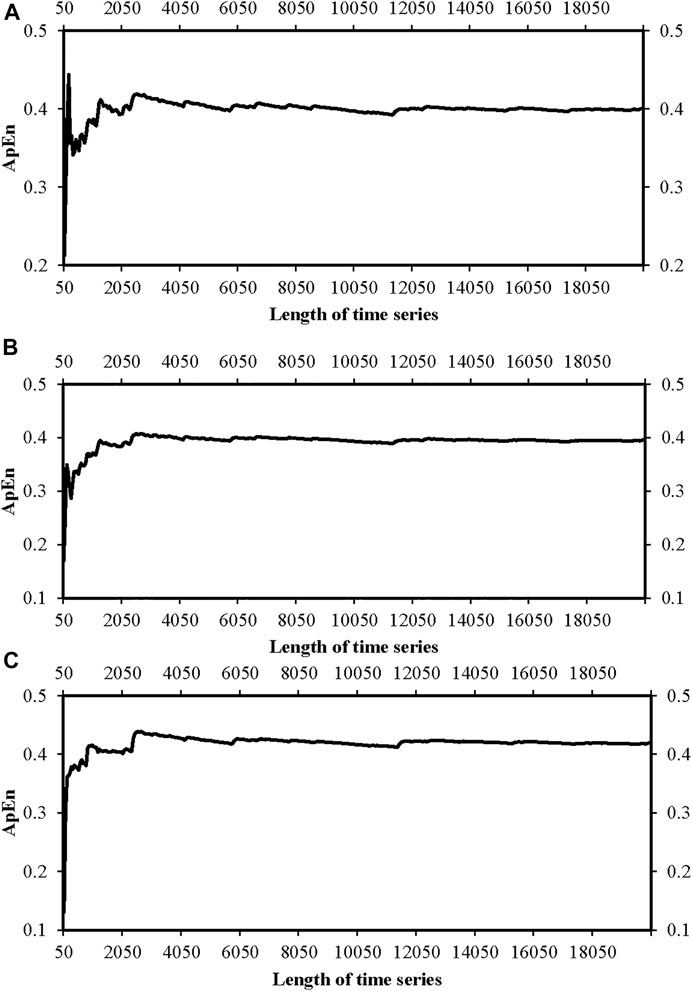
FIGURE 2. ApEn results of the classical Lorenz model with the data length increasing from 50 to 20000 on (A) the variable x, (B) the variable y, and (C) the variable z.
In the second test, the ApEn result of the daily precipitation of the Jinan station in Shandong Province was calculated when the length of the daily precipitation increased continuously from 30 to 19650 (Figure 3). The difference between the ApEn result and true value is less than 0.1 when the data length exceeds 240. Moreover, the difference is less than 0.05 for data lengths larger than 300. In general, ApEn has a relatively stable value when the data length increases to 2,000, which is the case for both the classical Lorenz model and observed daily precipitation at the Jinan station.
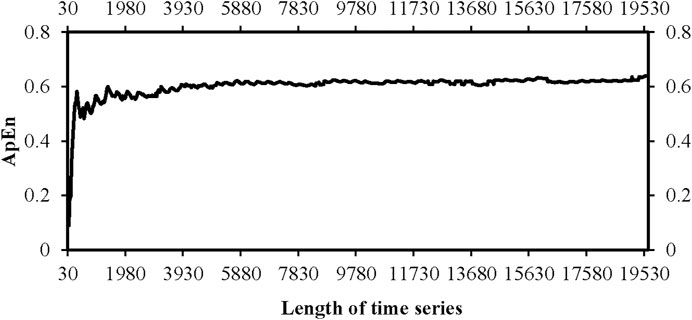
FIGURE 3. ApEn of daily precipitation at the Jinan station with the data length increasing from 30 to 19650.
The moving t-test (MTT) technique is used to test the difference between the mean values of two subsamples before and after one point with an equivalent subsample size. If the difference exceeds a given significance level, then an abrupt change is considered to occur at the point.
For a time series {xi, i = 1, 2, … , n}, a sample is selected by moving a cutting point to obtain two subsets (x1 and x2) before and after this point. Then, the t-statistic is estimated as follows:
where n1 and n2 are the subsample sizes and n1 = n2.
The ApEn results of daily precipitation in China from 1961 to 2015 show the characteristics of large in the south and little in the north, especially in Northwest China (Figure 4A). ApEn of daily precipitation is less than 0.6 in Southern Xinjiang, western Inner Mongolia, and western Qinghai Province, which is much smaller than that in other areas in China. The minimum value of ApEn is 0.1, which occurred at Ejinaqi, western Inner Mongolia. The annual precipitation in the coastal areas of Southeast China is the biggest in China. ApEn ranges from 0.8 to 1.0 in these areas, which is less than those in Sichuan, eastern Tibet, and the most part of the areas in the south of the Yangtze River. In northeastern Sichuan and Zhejiang provinces, ApEn is bigger than 1.1. The ApEn value of daily precipitation in Gongshan, Yunnan, is 1.33, which is the maximum in China. The values of ApEn of daily precipitation in China range from 0.1 to 1.33, and about 90% of the values are between 0.5 and 1.1 (Figure 5), and the percentage of ApEn between 1.0 and 1.1 is bigger than that of the others.
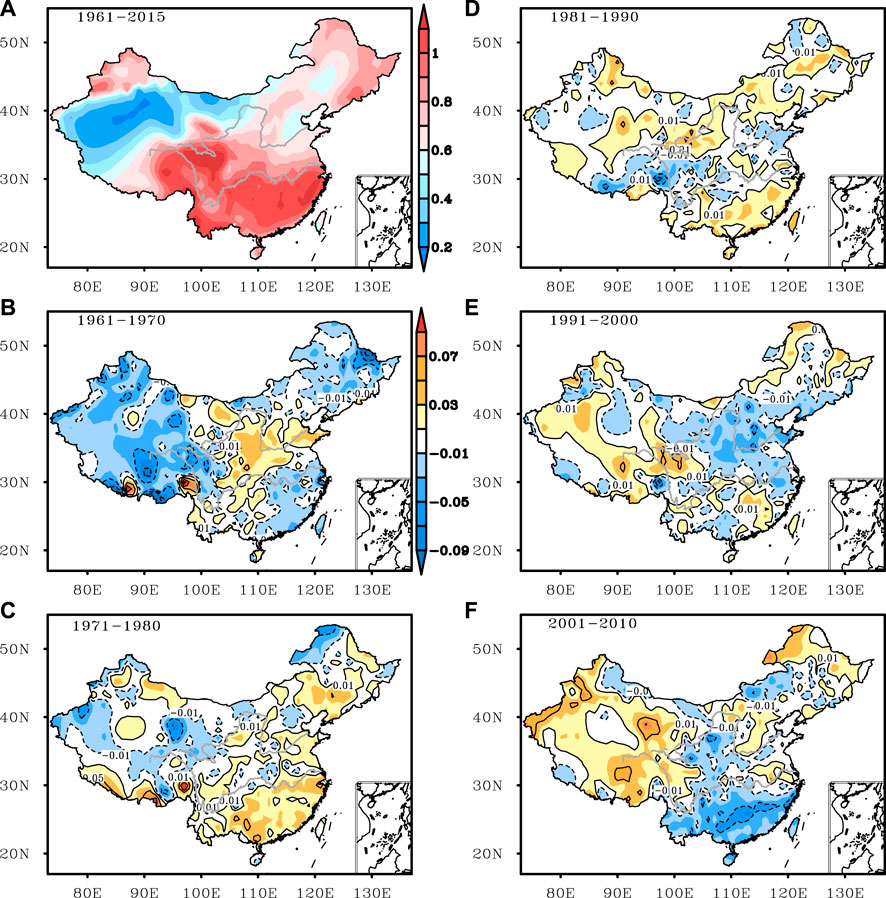
FIGURE 4. ApEn of daily precipitation in China during (A) 1961–2015 and the ApEn anomaly of daily precipitation in China during (B) 1961–1970, (C) 1971−1980, (D) 1981−1990, (E) 1991−2000, and (F) 2001−2010.
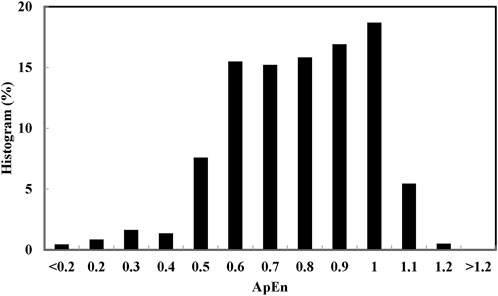
FIGURE 5. Histogram of ApEn of daily precipitation in China during 1961–2015.
To demonstrate the decadal variability of daily precipitation in China, we calculate the ApEn of daily precipitation for five different decades and further obtain the ApEn anomaly for each decade by subtracting the average ApEn of the five decades. During 1961–1970, the ApEn of daily precipitation was weaker than the average in most parts of China except for the central regions between the Yangtze River and the Yellow River (Figure 4B). In the next decade, the ApEn anomaly was bigger than 0.01 in the south of the middle and lower reaches of the Yangtze River, most of Northeast China, Shandong Province, and Jiangsu Province, especially in some areas of southern Tibet (Figure 4C). The ApEn anomaly remains negative in most of Northwest China and Inner Mongolia. During 1981−1990, the ApEn value was bigger than the multi-year average value in most parts of China except Sichuan and Shandong provinces (Figure 4D). The ApEn anomalies in Northwest China and northeastern Inner Mongolia have been positive since 1991 (Figures 4E,F). The ApEn values in the south of the middle and lower reaches of the Yangtze River are less than the average during 2001–2010 (Figure 4F). The spatial pattern of the ApEn anomaly was positive both in 1971–1980 and 1981−1990 in the southern middle and lower reaches of the Yangtze River. However, it was negative during 1961–1970 and 2001−2010. The variance of daily precipitation in China in each decade also shows a decreasing trend in southeastern China while an increasing trend in northern Xinjiang and southern Tibet, consistent with the ApEn analysis. In general, ApEn in Northwest China and the Tibetan Plateau has grown larger since the 1960s, while that in the south of the middle and lower reaches of the Yangtze River has become smaller since the 1970s.
ApEn of daily precipitation in China shows increasing trends in most parts of Northwest China, Tibetan Plateau, central Northeast China, and eastern Inner Mongolia (Figure 6). The increasing trends are significant at the 90% confidence level in western Xinjiang, southern and eastern Qinghai, central Northeast China, and local parts of eastern Inner Mongolia. Trends of the ApEn are negative in most parts of central and eastern China, especially in Shannxi, northern Henan, Yunnan, Guizhou, and northwestern Guangxi provinces.
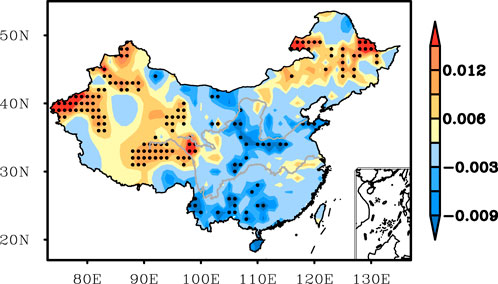
FIGURE 6. Trends of ApEn for daily precipitation in China during 1961–2015.
As an example of detecting abrupt ApEn changes in daily precipitation records, the daily precipitation records of the Wutaishan station in Shanxi Province and Wushaoling station in Gansu Province were selected (Figures 7A,B). Figures 7C,D represent the yearly ApEn results of daily precipitation in Wutaishan and Wushaoling stations, respectively. For the Wutaishan station, the ApEn value changed greatly at the end of the 1980s (Figure 7C). For the Wushaoling station, there was an abrupt mean shift in the ApEn values in the late 1970s and early 1980s (Figures 7D). To quantitatively identify the change point of the ApEn value, the MTT method was used with a significance level of α = 0.01, and the subseries n1 = n2 = 10 was used. Figure 7E shows an apparent abrupt change in the ApEn value of daily precipitation in 1988 at the Wustaishan station. At the Wushaoling station, an abrupt mean shift of the ApEn value of daily precipitation occurred in 1979 (Figure 7F).
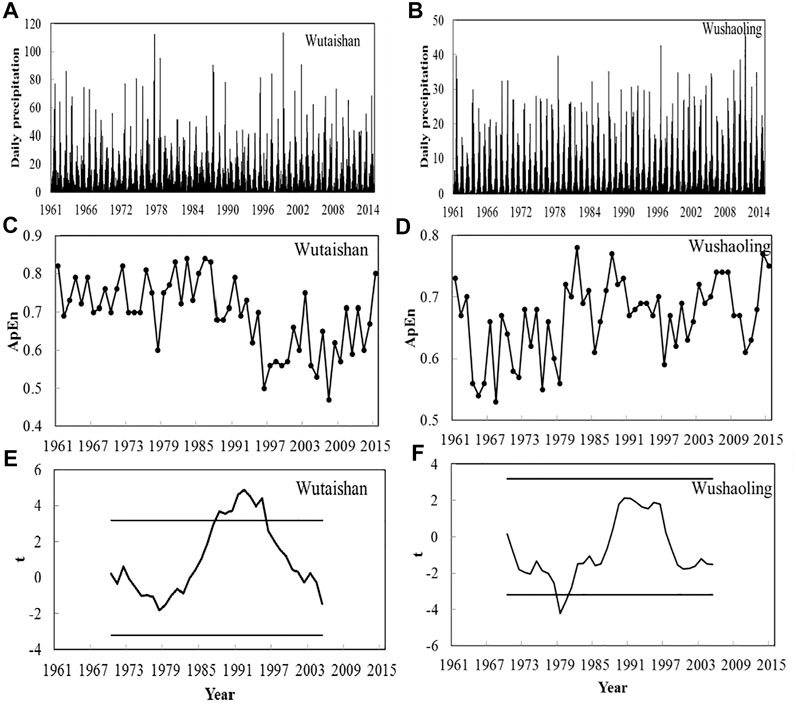
FIGURE 7. Daily precipitation series from 1961 to 2015 from the Wutaishan station in Shanxi Province and Wushaoling station in Gansu Province, and the ApEn results and the corresponding MTT results are shown. Daily precipitation records at the Wutaishan station (A) and at the Wushaoling station /(B); (C) ApEn results for the precipitation records shown in (A); (D) same as (C), but for the precipitation records shown in (B); (E) MTT analysis of the ApEn results shown in (C) with the subseries n1 = n2 = 10; (F) same as (E), but for the ApEn results shown in (D).
During 1961−2015, the abrupt changes in ApEn for daily precipitation in China occurred in most of central and eastern China, western Xinjiang Province, and eastern Qinghai Province (Figure 8). The stations with abrupt ApEn changes that occurred during 1970–1979 are mainly located in central and eastern China, especially in North China and central Inner Mongolia. During the period of 1980–1989, the stations with abrupt ApEn changes were mainly located in central and western China, especially in northern Xinjiang and eastern Southwest China. During 1990−1999, abrupt ApEn changes in daily precipitation mainly occurred in the northern part of China, especially in central Inner Mongolia. Since 2000, the distribution of stations with abrupt ApEn variations in daily precipitation has been almost even in China. These results indicate that the temporal instances of abrupt ApEn changes in daily precipitation occur from region to region.
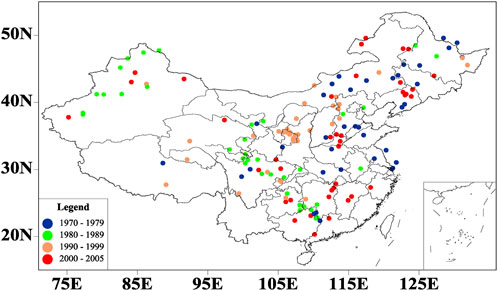
FIGURE 8. Spatial distributions of meteorological stations where abrupt ApEn changes of daily precipitation occurred during 1961–2015.
Figure 9 shows the time evolution of the numbers of stations where the ApEn of daily precipitation shows the significant abrupt change at a significant level of α = 0.01. Four peaks occurred in 1971, 1986, 1992, and 2002, with 20, 16, 12, and 15 stations, respectively. The time evolution of the number of stations with abrupt ApEn changes has a noticeable inter-decadal variation in 1984. Although the maximum number of stations with abrupt changes occurred in 1971, the total number of stations with abrupt changes before 1984 was considerably smaller than that after 1984. This means that the complexity of daily precipitation in China has been more prone to abrupt changes since 1984 than in previous periods.
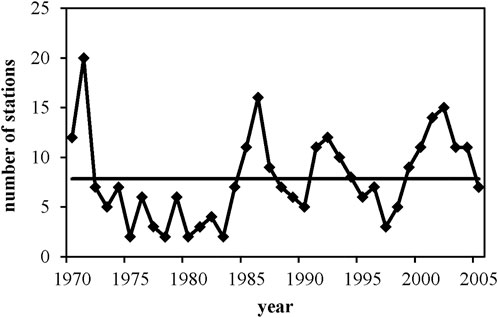
FIGURE 9. Time variations of the number of stations where the ApEn values have an abrupt change.
To investigate the dependence of the ApEn results on the length of a time series, two sets of experiments were designed. It is shown that the ApEn value becomes relatively stable when the length of the time series exceeds 100. Then, ApEn was applied to analyze the complexity of the daily precipitation in China during 1961–2015.
The ApEn value of daily precipitation in China is larger than 0.8 in most of southern China, especially in eastern Sichuan Province. However, the ApEn values in southern Xinjiang, western Inner Mongolia, western Qinhai Province, North China, and the southeastern part of Northeast China are below 0.6. During the period of 1961–2015, the ApEn value increased in most of Northwest China, central-eastern Inner Mongolia, and most of Northeast China. The time instants for an abrupt ApEn shift vary from region to region. The number of stations with abrupt ApEn changes in daily precipitation during the period of 1984–2015 is larger than that in the previous period.
Precipitation in China is affected by both internal natural factors of the climate systems and external forces such as anthropogenic influences. Following the Mount Pinatubo eruption in 1991, precipitation over the global land experienced a significant reduction (Trenberth and Dai, 2007). The East Asian summer monsoon (EASM) has the principal influence on precipitation in China. A stronger EASM corresponds to more rainfall over northern China, whereas a weaker EASM leads to additional rainfall over the Yangtze−Huai River Valley (Zhang, 2015). During the second half of the 20th century, a significant weakening of EASM happened (Wang, 2001), which led to northward moisture transport and convergence weakening and precipitation in North China decreased (Ding et al., 2010). Precipitation in northwestern China increased significantly from 1960 to 2010, which was associated with the strengthening of the West Pacific subtropical high and the North American subtropical high (Li et al., 2016). Thus, ApEn of daily precipitation can be quantified that helps reveal the variability of dynamical features of the climate systems in China (Flesisher et al., 1993, Zhao et al., 2008).
The original contributions presented in the study are included in the article/Supplementary Material; further inquiries can be directed to the corresponding author.
WH contributed to the conception and design of the study. SZ organized the database and performed the statistical analysis. SZ wrote the first draft of the manuscript. YM, YJ, and SW revised the manuscript.
This research was supported by the National Natural Science Foundation of China (Grant Nos. 41875120, 41975086, and 42175067).
The authors would like to thank the reviewers and editors for the beneficial and helpful suggestions for this article.
The authors declare that the research was conducted in the absence of any commercial or financial relationships that could be construed as a potential conflict of interest.
All claims expressed in this article are solely those of the authors and do not necessarily represent those of their affiliated organizations, or those of the publisher, the editors, and the reviewers. Any product that may be evaluated in this article, or claim that may be made by its manufacturer, is not guaranteed or endorsed by the publisher.
The Supplementary Material for this article can be found online at: https://www.frontiersin.org/articles/10.3389/fenvs.2022.1045133/full#supplementary-material
Ding, Y., Wang, Z., and Sun, Y. (2010). Inter-decadal variation of the summer precipitation in east China and its association with decreasing asian summer monsoon. Part I: Observed evidences. Int. J. Climatol. 28, 1139–1161. doi:10.1002/joc.1615
Flesisher, L. A., Pincus, S. M., and Rosenbaum, S. H. (1993). Approximate entropy of heart rate as a correlate of postoperative ventricular dysfunction. Anesthesiology 78, 683–692. doi:10.1097/00000542-199304000-00011
Gemmer, M., Becker, S., and Jiang, T. (2004). Observed monthly precipitation trends in China 1951–2002. Theor. Appl. Climatol. 77, 39–45. doi:10.1007/S00704-003-0018-3
Gong, D., and Ho, C. H. (2003). Arctic oscillation signals in the East Asian summer monsoon. J. Geophys. Res. 108, 4066. doi:10.1029/2002jd002193
Grassberger, P., and Procaccia, I. (1983b). Characterization of strange attractors. Phys. Rev. Lett. 50 (5), 346–349. doi:10.1103/PhysRevLett.50.346
Grassberger, P., and Procaccia, I. (1983a). Measuring the strangeness of strange attractors. Phys. D. Nonlinear Phenom. 9, 189–208. doi:10.1016/0167-2789(83)90298-1
He, W., Feng, G., Wu, Q., He, T., Wan, S., and Chou, J. (2012). A new method for abrupt dynamic change detection of correlated time series. Int. J. Climatol. 32, 1604–1614. doi:10.1002/joc.2367
He, W., He, T., Cheng, H., Zhang, W., and Wu, Q. (2011). A new method to detect abrupt change based on approximate entropy. Acta Phys. Sin. 60 (4), 049202. doi:10.7498/aps.60.049202
He, W., Wu, Q., Zhang, W., Wang, Q., and Zhang, Y. (2009). Comparison of characteristics of moving detrended fluctuation analysis with that of approximate entropy method in detecting abrupt dynamic change. Acta Phys. Sin. 58 (4), 2862–2910. doi:10.7498/aps.58.2862
Jin, H., He, W., Hou, W., and Zhang, D. (2012a). Effects of different trends on moving cut data-approximate entropy. Acta Phys. Sin. 61 (6), 069201. doi:10.7498/aps.61.069201
Jin, H., He, W., Zhang, W., Feng, A., and Hou, W. (2012b). Effect of noises on moving cut data- approximate entropy. Acta Phys. Sin. 61 (12), 129202. doi:10.7498/aps.61.129202
Karl, T. R., Knight, R. W., and Plummer, N. (1995). Trends in high-frequency climate variability in the twentieth century. Nature 277, 217–220. doi:10.1038/377217a0
Li, B., Chen, Y., Chen, Z., Xiong, H., and Lian, L. (2016). Why does precipitation in northwest China show a significant increasing trend from 1960 to 2010? Atmos. Res. 167, 275–284. doi:10.1016/j.atmosres.2015.08.017
Liu, B., Xu, M., Henderson, M., and Qi, Y. (2005). Observed trends of precipitation amount, frequency, and intensity in China, 1960 -2000. J. Geophys. Res. 110, D08103. doi:10.1029/2004jd004864
Liu, Y., Huang, G., and Huang, R. (2011). Inter-decadal variability of summer rainfall in Eastern China detected by the Lepage test. Theor. Appl. Climatol. 106, 481–488. doi:10.1007/s00704-011-0442-8
Lorenz, E. N. (1963). Deterministic nonperiodic flow. J. Atmos. Sci. 20, 130–141. doi:10.1175/1520-0469(1963)020<0130:dnf>2.0.co;2
Ocak, H. (2009). Automatic detection of epileptic seizures in EEG using discrete wavelet transform and approximate entropy. Expert Syst. Appl. 36 (2), 2027–2036. doi:10.1016/j.eswa.2007.12.065
Pincus, S. M. (1995). Approximate entropy (ApEn) as a complexity measure. Chaos. 5 (1), 110–117. doi:10.1063/1.166092
Pincus, S. M. (1991). Approximate entropy as a measure of system complexity. Proc. Natl. Acad. Sci. U. S. A. 88, 2297–2301. doi:10.1073/pnas.88.6.2297
Pincus, S. M., and Viscarello, R. R. (1992). Approximate entropy: A regularity measure for fetal heart rate analysis. Obstet. Gynecol. 79, 249–255. doi:10.1007/BF01204121
Pincus, S. M., and Goldberger, A. L. (1994). Physiological time-series analysis – what does regularity quantify?. Am. J. Physiol. Cell Physiol. 266, 1643–1656. doi:10.1152/ajpheart.1994.266.4.H1643
Richman, J. S., and Moorman, J. R. (2000). Physiological time-series analysis using approximate entropy and sample entropy. Am. J. Physiology-Heart Circulatory Physiology 278, 2039–2049. doi:10.1152/ajpheart.2000.278.6.H2039
Rosenstein, M. T., Collins, J. J., and Luca, C. J. D. (1993). A practical method for calculating largest Lyapunov exponents from small data sets. Phys. D. nonlinear Phenom. 65, 117–134. doi:10.1016/0167-2789(93)90009-P
Takens, F. (1983). Invariants related to dimension and entropy. (Rio de Janerio, Brasil: Brasiliero de Matematicas).
Trenberth, K. E., and Dai, A. (2007). Effects of Mount Pinatubo volcanic eruption on the hydrological cycle as an analog of geoengineering. Geophys. Res. Lett. 34, L15702. doi:10.1029/2007gl030524
Wang, A. L., and Yang, C. X. (2002). Grassberger-Procaccia algorithm for evaluating the fractal characteristic of strange attractors. Acta Phys. Sin. 51 (12), 2719–2729. doi:10.7498/aps.51.2719
Wang, G. R., Chen, S. G., and Hao, B. L. (1984). Kolmogorov capacity and Lyapunov dimension of strange attractors of forced Brusselator. Acta Phys. Sin. 33 (3), 1246–1254. doi:10.7498/aps.33.1246
Wang, H. J. (2001). The weakening of the Asian monsoon circulation after the end of 1970’s. Adv. Atmos. Sci. 18, 376–386. doi:10.1007/bf02919316
Wang, Q. G., and Zhang, Z. P. (2008). The research of detecting abrupt climate change with approximate entropy. Acta Phys. Sin. 57 (3), 1976–1983. doi:10.7498/aps.57.1976
Wang, T., Wang, H., Ottera, O. H., Gao, Y., Suo, L. L., Furevik, T., et al. (2013). Anthropogenic agent implicated as a prime driver of shift in precipitation in eastern China in the late 1970s. Atmos. Chem. Phys. 13, 12433–12450. doi:10.5194/acp-13-12433-2013
Wang, Y., and Zhou, L. (2005). Observed trends in extreme precipitation events in China during 1961-2001 and the associated changes in large-scale circulation. Geophys. Res. Lett. 32, L09707. doi:10.1029/2005GL022574
Yan, R., and Gao, R. X. (2007). Approximate Entropy as a diagnostic tool for machine health monitoring. Mech. Syst. Signal Process. 21, 824–839. doi:10.1016/j.ymssp.2006.02.009
Yentes, J. M., Hunt, N., Schmid, K. K., Kaipust, J. P., McGrath, D., and Stergiou, N. (2013). The appropriate use of approximate entropy and sample entropy with short data sets. Ann. Biomed. Eng. 41 (2), 349–365. doi:10.1007/s10439-012-0668-3
Zhai, P., Sun, A., Ren, F., Liu, X., Gao, B., and Zhang, Q. (1999). Changes of climate extremes in China. Clim. Change 42, 203–218. doi:10.1023/A:1005428602279
Zhai, P., Zhang, X., Wan, H., and Pan, X. (2005). Trends in total precipitation and frequency of daily precipitation extremes over China. J. Clim. 18, 1096–1108. doi:10.1175/Jcli-3318.1
Zhang, R. (2015). Changes in East Asian summer monsoon and summer rainfall over eastern China during recent decades. Sci. Bull. (Beijing). 60, 1222–1224. doi:10.1007/s11434-015-0824-x
Keywords: approximate entropy, daily precipitation, abrupt change, complexity, moving t-test
Citation: Zhao S, Mei Y, Jiang Y, Wan S and He W (2022) Complexity of daily precipitation and its change in China during 1961–2015 based on approximate entropy. Front. Environ. Sci. 10:1045133. doi: 10.3389/fenvs.2022.1045133
Received: 16 September 2022; Accepted: 26 September 2022;
Published: 18 October 2022.
Edited by:
Hainan Gong, Institute of Atmospheric Physics (CAS), ChinaReviewed by:
Dong Xiao, China Meteorological Administration, ChinaCopyright © 2022 Zhao, Mei, Jiang, Wan and He. This is an open-access article distributed under the terms of the Creative Commons Attribution License (CC BY). The use, distribution or reproduction in other forums is permitted, provided the original author(s) and the copyright owner(s) are credited and that the original publication in this journal is cited, in accordance with accepted academic practice. No use, distribution or reproduction is permitted which does not comply with these terms.
*Correspondence: Wenping He, d2VucGluZ19oZUAxNjMuY29t
Disclaimer: All claims expressed in this article are solely those of the authors and do not necessarily represent those of their affiliated organizations, or those of the publisher, the editors and the reviewers. Any product that may be evaluated in this article or claim that may be made by its manufacturer is not guaranteed or endorsed by the publisher.
Research integrity at Frontiers
Learn more about the work of our research integrity team to safeguard the quality of each article we publish.