
95% of researchers rate our articles as excellent or good
Learn more about the work of our research integrity team to safeguard the quality of each article we publish.
Find out more
ORIGINAL RESEARCH article
Front. Environ. Sci. , 21 October 2022
Sec. Environmental Informatics and Remote Sensing
Volume 10 - 2022 | https://doi.org/10.3389/fenvs.2022.1044837
This article is part of the Research Topic Meta-Scenario Computation for Social-Geographical Sustainability View all 60 articles
 Yuanshan Gong1,2*
Effective identification of drought-related events and quantitative analysis of the spatio-temporal evolution of drought are essential for regional disaster prevention and mitigation and sustainable development. Based on monthly precipitation and average temperature data from 113 grid points in the Liaohe River Basin (LRB) from 1961 to 2018, this study evaluated the standardized precipitation evapotranspiration index (SPEI) on monthly, quarterly, 6-monthly, and annual scales. Run-length theory was used to extract three characteristic variables of drought—frequency, severity, and duration—for different grades of drought. Linear regressions, Manner–Kendall mutation tests, correlations, and other methods were used to analyze the spatio-temporal distribution characteristics of the different levels of drought and their influencing factors. Results from this research can provide a scientific reference for disaster prevention and mitigation, water conservancy project planning and construction, land space ecological restoration, and development and protection in the LRB. Our results indicated the following: 1) overall, from 1961 to 2018, the short-term SPEI (monthly, quarterly) showed an upward trend (0.06/103a, 0.01/103a), while the long-term SPEI (6-monthly, annual) showed a downward trend (−0.01/103a, −0.3/103a), and the overall change occurred in three stages, specifically stable–decline–increase. From a seasonal point of view, the SPEI in spring, summer, and autumn showed an upward trend, and although the SPEI showed multiple mutations during all seasons, they were not significant (p > 0.05). 2) Moderate drought occurred the most frequently (32 times) and was concentrated in the northern and western parts of the LRB. The severity of extreme drought in the upper reaches of the Chagan Mulun River was low, with a minimum SPEI of −7.07, and the durations of mild, moderate, severe, and extreme drought were 2, 2-2.5, 2–3, and 3–4 months, respectively. 3) SPEI-1 (monthly) showed the strongest correlation with precipitation and air temperature, which decreased with increasing time frames, such that SPEI-12 (annual) showed the weakest correlation. The correlations between SPEI and precipitation at different time scales were all highly significant (p < 0.01), and the correlation strength was much greater than that for air temperature, indicating that precipitation had the most significant impact on drought conditions in the LRB.
Since the 1990s, the frequency and intensity of extreme climate events have been increasing globally under the combined effects of changing climate, environmental conditions, and human activities (Omer et al., 2020). Drought is an extreme and common natural disaster (Hao et al., 2014; Spinoni et al., 2014). Unlike other climate events, droughts develop slowly and severely impact human life, the ecological environment, and socio-economic development (Xu et al., 2019; Mondol et al., 2021). Economic losses caused by droughts account for more than half of all meteorological disasters worldwide. From 1983 to 2009, production from approximately 454 million hectares of arable land was lost owing to droughts, resulting in economic losses of US$166 billion (Kim et al., 2019). In China, disaster areas and food losses caused by droughts are increasing, and the average annual direct economic losses are estimated to be as high as 25 billion yuan (Qin, 2015). Increased temperature and precipitation variations have led to increased uncertainty in drought studies. Therefore, effective identification of drought events and quantitative analysis of their temporal and spatial evolution is needed to enable disaster prevention and mitigation and to ensure sustainable regional development.
Currently, drought monitoring is conducted mainly using the time series of drought indicators to identify and characterize the occurrence and development of regional droughts. The Palmer Drought Severity Index (PDSI) and the Standardized Precipitation Index (SPI) are widely used drought indicators. The PDSI evaluates drought based on regional rainfall, evapotranspiration (ET), runoff, soil moisture, and other parameters at a fixed time scale. Therefore, the complexity of drought is considered, but calculating the PDSI is complex and requires extensive data (Palmer, 1965; Alley, 1984; Yang et al., 2018). The SPI assesses regional drought based on only precipitation data, with a flexible time scale (Kumar et al., 2021). The standardized precipitation evapotranspiration index (SPEI) is more flexible because it is based on the SPI calculation but combines precipitation and evapotranspiration, thus, making up for the shortcomings of PDSI’s fixed time scale and numerous required parameters (Stagge et al., 2015; Tan et al., 2015). Drought studies in Northeast China and the Qaidam Basin have shown that compared with the SPI and PDSI, the SPEI is more usable and flexible, more sensitive to temperature, and more accurately captures drought characteristics (Zhao et al., 2017; Pei et al., 2020). Ullah et al. (2021) pointed out in the assessment of meteorological drought in Iran that the SPEI could capture more drought events than the SPI. Therefore, the SPEI was selected in the present study to monitor and identify drought events in the Liaohe River Basin (LRB) in China.
The LRB is an important agricultural production base in Northeastern China, associated with a high demand for water (Wang et al., 2020) despite the serious shortage of water resources. The per capita water resource of this area is only 530 m3, less than half of the national level (Liu et al., 2012). The rapid industrial development has further exacerbated the water resource shortage (Song et al., 2015; Wang et al., 2020). Water shortages combined with droughts pose a serious threat to regional food security and economic development. Therefore, this study used the precipitation and temperature data of 113 grid points in the LRB to calculate its SPEI. Run-length theory was used to extract characteristic variables, such as drought frequency, severity, and duration. Methods such as linear regressions, M-K mutation tests, and correlations were used to analyze the spatial and temporal distributions of drought. The study aimed to provide a basis for disaster prevention and mitigation, enable the rational allocation of water resources and optimize ecological and environmental protection policies in the basin.
The Liaohe River (40°30′ N, 117°00′ E–45°10′ N, 127°30′ E) originates from Guangtou Mountain in the Qilaotu Mountains in Pingquan, Hebei Province, flows through Hebei Province, Inner Mongolia Autonomous Region, Jilin Province, and Liaoning Province, and finally enters the Bohai Sea from Panshan County, Liaoning Province. In total it is 1,345 km long and has a drainage area of 219,000 km2 (Zhao et al., 2018; Figure 1). Its tributaries, the Taizi, Hun, Dongliao, West Liaohe, Laoha, Xilamulun, and Chagan Mulun Rivers, are distributed in a dendritic shape (Li et al., 2012). The southern part of the LRB is adjacent to the Bohai and Yellow Seas, the southwestern part is adjacent to the Inland and Hailuan Rivers in Inner Mongolia, and the northern part is adjacent to the Songhua River. The basin has a typical temperate continental monsoon climate, with cold and dry winters and hot and humid summers. The average annual temperature and precipitation range from 4 to 9°C and 400 to 1,100 mm, respectively. There are significant seasonal differences in precipitation, which is concentrated in July, August, and September, mainly as heavy rain, with a small amount of snowmelt in winter (He et al., 2015; Gao et al., 2017). The terrain of the basin is high in the north and low in the south, with slopes from the east and west to the Liaohe Plain in the middle (Jiang and Wang, 2016). The climate–ecological environment of the LRB is complex, with diverse vegetation types. However, the ecological environment of the basin has been disrupted in recent years owing to anthropogenic influences, which have even caused the river to stop flowing at times.
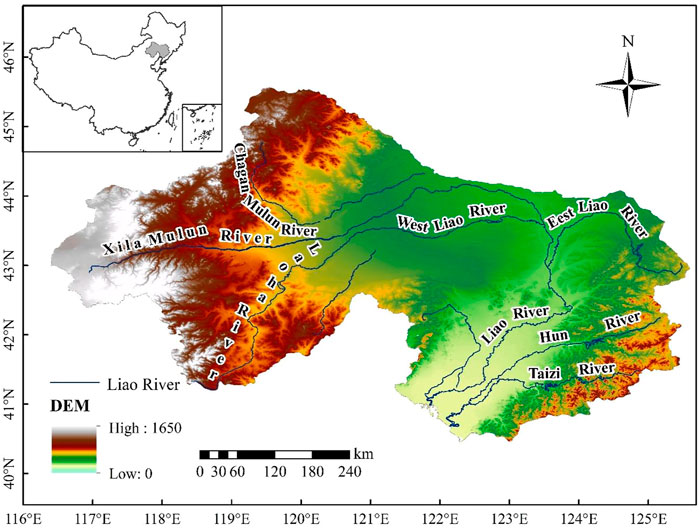
FIGURE 1. Geographical location and DEM of LRB.
The monthly precipitation and average temperature data used in this study were obtained from grid data with a spatial resolution of 0.5° provided by the China Meteorological Data Service Centre, with a time range from 1961 to 2018. There are 113 grid points in the LRB. Elevation data were a digital elevation product of SRTMDEM 90M resolution obtained from Geospatial Data Cloud. The DEM of the LRB was extracted using ArcGIS software.
Drought indices are basic tools that can be used to monitor drought conditions quantitatively. For example, the SPEI, proposed by Vicente-Serranosm et al., in 2010, is a commonly used index for evaluating meteorological drought (Xu et al., 2020). Potential evapotranspiration (PET) was calculated using the Thornthwaite method.
SPEI-1, SPEI-3, SPEI-6, and SPEI-12 were used to characterize the monthly, quarterly, 6-monthly, and annual drought conditions in the LRB, respectively. According to the national standard of Grades of Meteorological Drought (GB/T 20,481-2017) of the People’s Republic of China (National Standardization Management Committee of China, drought can be divided into five grades: normal conditions and mild, moderate, severe, and extreme drought (Table 1).
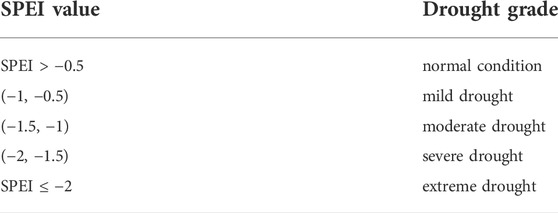
TABLE 1. Range of SPEI values corresponding to different drought grades.
The run-length theory was used to identify drought events and judge drought and flood conditions (Zhang et al., 2022). Any SPEI value less than the threshold, X1 (Figure 2), was recorded as a drought event. A total of five drought events occurred during the time period, t, which were recorded as events a, b, c, d, and e. If the drought duration was confined to only one period (such as a and b), and its SPEI value was less than X3 (such as b), it was recorded as a drought event, but otherwise (such as for a), it was not. If the SPEI value of the interval between two adjacent drought events, such as d and e, was less than X2, the two adjacent droughts were regarded as a single drought event, with the combined drought duration T = T2-T1+1, and drought severity S=SPEIc + SPEId; otherwise, it was recorded as two independent drought events. According to this definition of drought events, there were three drought events, namely b, c, and d + e (Figure 2). As the SPEI value is negative, the severity of drought increases with a decrease in the index’s value.
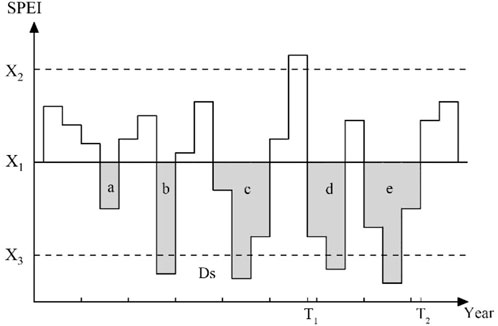
FIGURE 2. Schematic diagram of extracting drought characteristic elements by run-length theory.
The thresholds were selected based on the SPEI values associated with the different drought grades (Table 1). Based on the SPEI-1, run-length theory was used to identify and analyze the frequency, severity, and duration of different drought grades and to quantify the drought characteristics.
Univariate linear regression analyses were used to assess the variation trends in SPEI at different time scales. Linear regression is commonly used to analyze the linear relationship between independent (x) and dependent variables (y). The calculation formula was based on Uyanık’s method (Uyanık and Güler, 2013).
The Mann-Kendall (M-K) method is typically used to test randomly distributed time series data. This test has a low sensitivity to outliers. In this paper, the MK test was used to assess the change trend of SPEI-3 and -12, and ±1.96 was selected as the significance level to judge whether the change in the SPEI-3 and -12 sequence was significant. The calculation formula was derived from Zhang et al. (2021).
The Pearson product-moment correlation coefficient is usually used to reflect the degree of linear correlation between two meteorological elements. The value of P ranges between −1 and 1. The closer |P| is to 1, the stronger the correlation between the two meteorological elements. The formula for the calculation of the coefficient was derived from Jain et al. (2015). Correlation analyses of SPEI-1, SPEI-3, SPEI-6, and SPEI-12 with precipitation and air temperature were carried out using Pearson’s correlation coefficient.
Inverse distance weighting (IDW) is a commonly used spatial interpolation method in regional drought analysis. It is a deterministic spatial interpolation method based on the principle of similarity and proximity (Chen et al., 2017). In ArcGIS, IDW was used to spatially interpolate the drought characteristics of the LRB from 1961 to 2018 to analyze spatial distribution characteristics.
Annual (SPEI-12) and quarterly (SPEI-3) SPEI in the LRB from 1961 to 2018 were subjected to trend analyses and the M-K mutation test. SPEI-12 decreased at a rate of 0.0514/10a, and presented four periods of normal–wet–dry–wet, corresponding to 1961–1983, 1984–1996, 1996–2010, and 2011–2018, respectively (Figure 3A). Post 1995, the severity and frequency of droughts and floods in the LRB have increased. A prolonged severe drought occurred from 1996 to 2010, with SPEI values of −1.56 and −1.6 in 2000 and 2009, respectively. From 2011 to 2018, a wet period was observed. Based on the UF values, the SPEI showed a significant downward trend from 1997 to 2001 (p < 0.05; Figure 3A).
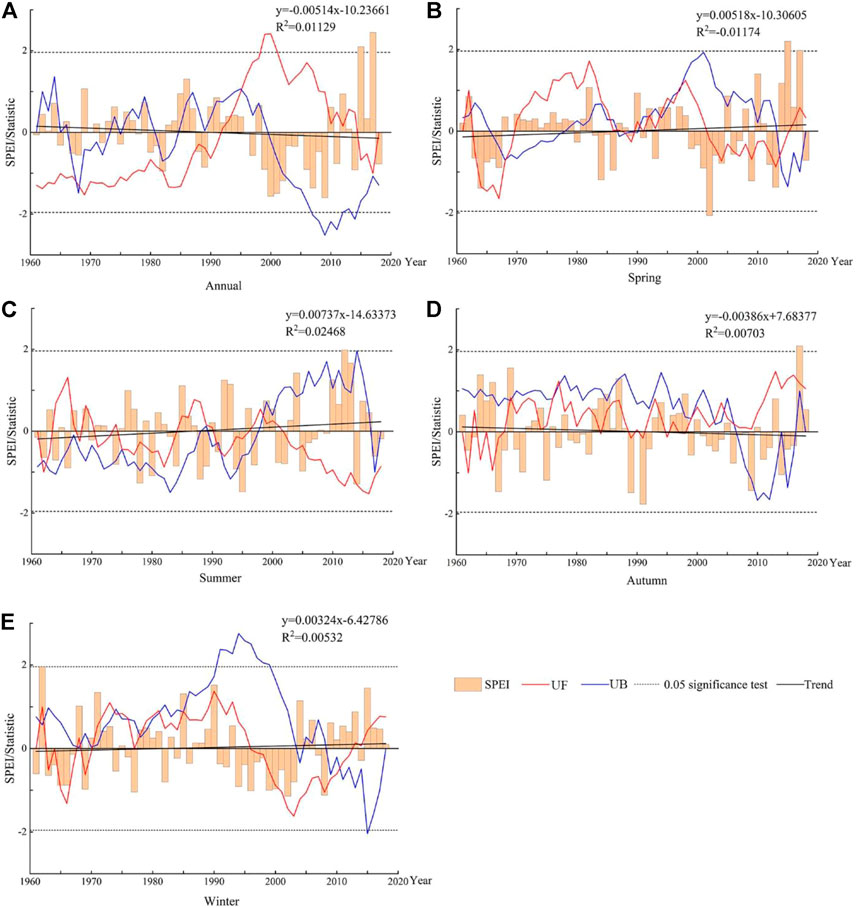
FIGURE 3. SPEI changes and M-K mutation test in the LRB from 1961 to 2018. (A) is the annual change trend and M-K mutation test of SPEI. (B–E) are the spring, summer, autumn and winter changes and M-K mutation test of SPEI, respectively.
In spring, the SPEI increased at a rate of 0.0518/10a and presented four periods of dry–wet–dry–wet (Figure 3B). A prolonged dry period was noted during 1998–2013, and the lowest spring SPEI value in nearly 60 years (−2.07) was identified in 2002. Additionally, the SPEI value experienced several sudden changes from 1985 to 1998, indicating that the dry and wet conditions were unstable. The abrupt changes in 1968 and 2014 changed the conditions in the LRB from dry to wet.
The SPEI increased at a rate of 0.0737/10a in summer but fluctuated greatly, with frequent changes between wet and dry; three abrupt changes, in 1962, 1991, and 1999, were noted (Figure 3C).
The SPEI in autumn decreased at a rate of 0.0368/10a, with a severe drought event in 1991, when the SPEI was -1.76. A total of five mutations occurred during the study period, and the UF values in 1969–1989 and 1996–2018 were all above 0, indicating that SPEI showed an overall upward trend (Figure 3D).
The winter SPEI, which increased at a rate of 0.0324/10a, was divided into three stages of dry–wet–dry, corresponding to 1961–1970, 1971–1995, and 1996–2018, respectively (Figure 3E). The SPEI in winter had multiple mutations. The mutation years mainly occurred before 1985. No significant mutations in SPEI were found across all four seasons (p > 0.05).
The frequency of different grades of drought in the LRB varied substantially in space (Figure 4). Overall, the frequency of mild drought was relatively high (Figure 4A). The frequency of mild droughts in the East Liaohe River Basin, the lower reaches of the West Liaohe River Basin, and the Chagan Mulun River Basin was relatively high, with the highest frequency of 29 noted in the middle reaches of the East Liaohe River during the study period. The drought frequency in the Hunhe and Taizi River Basins and the headwaters of the Xilamulun River was relatively low, with the lowest being 8 in the northern Liaohe River Basin. Moderate droughts occurred the most frequently (slightly more often than mild droughts), with relatively little spatial variability (Figure 4B). The western and northern parts of the LRB had a higher frequency of moderate droughts, with the middle reaches of the Xilamulun River having the highest frequency (32), and the East Liaohe River Basin a comparatively lower frequency (13). Severe droughts were most frequent (20) in the south and least frequent (4) in the north (Figure 4C). The frequency of extreme droughts was higher in the East Liaohe River Basin and the northwest of the LRB, occurring up to 12 times. In the Liaohe and Laoha River estuaries, extreme droughts were the least frequent, occurring a minimum of two times (Figure 4D).
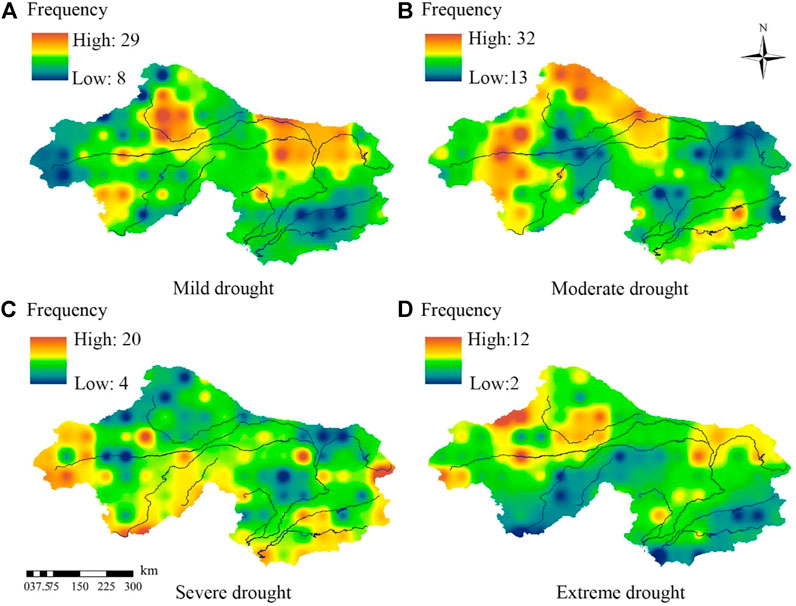
FIGURE 4. Spatial frequency distribution of different grades of droughts from 1962 to 2019. (A) is mild drought, (B) is moderate drought, (C) is severe drought, (D) is extreme drought.
A decreasing trend in the SPEI value represents an increasing trend in drought severity. Overall, mild droughts in the LRB were more severe in the east, less severe in the west, and most severe in the middle reaches of the Laoha River (SPEI = −1.79; Figure 5A). Moderate droughts were less severe in the north and more so in the south, while drought severity in the Hunhe and Laoha River Basins was high (SPEI = −2.58; Figure 5B). Severe droughts were most severe in the upper reaches of the Xilamulun River and the lower reaches of the Xiliao River, with the lowest SPEI value being −5.24 (Figure 5C). However, regions with an SPEI value below −2.5 accounted for only 2.65% of the study area. Extreme droughts were quite severe in the northwest of the LRB, with the lowest SPEI value being −7.07 (Figure 5D), but this was quite localized, with only 4% of the total area of the LRB having an SPEI value of less than −6.
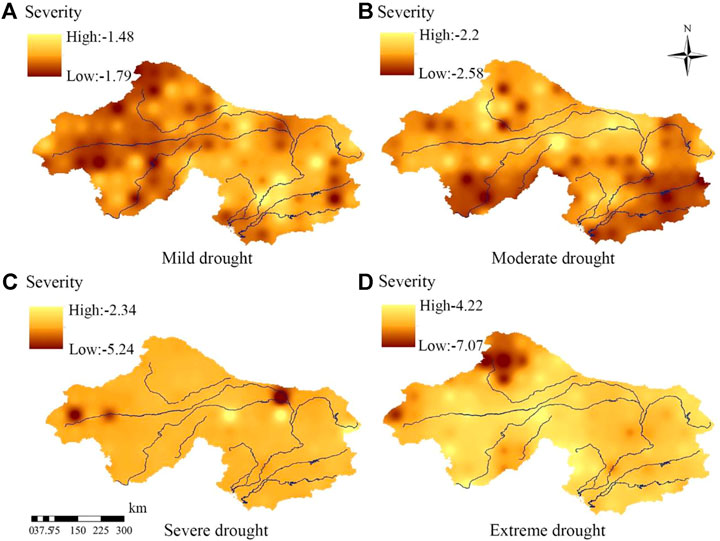
FIGURE 5. Spatial distribution of drought severity at different levels in the LRB from 1962 to 2019. (A) is mild drought, (B) is moderate drought, (C) is severe drought, (D) is extreme drought.
Drought duration has a direct impact on regional drought status. When the drought grade is low but the duration is very long, the impact becomes more serious. Therefore, studying drought duration is essential for evaluating the drought status in a given area. For the LRB, the drought level and duration were positively related, such that the more severe the drought level was, the longer the duration of each drought was. The duration of mild droughts remained stable at 2–2.11 months. There was little spatial heterogeneity (Figure 6A). The duration of moderate droughts ranged from 2 months (in the eastern LRB) to 3.5 months (in the southern LRB and southern Chaganmulun River Basin; Figure 6B). The duration of severe droughts ranged from 2 months (in the northeastern Liao River Basin) to 5 months (in the Xilamulun and West Liao River Basins; Figure 6C). The shortest extreme droughts occurred in the Xilamulun and southern Taizi River Basins (3 months) while the longest ones occurred in the northwest of the LRB and in the lower reaches of the West Liaohe River (up to 6.22 mo; Figure 6D).
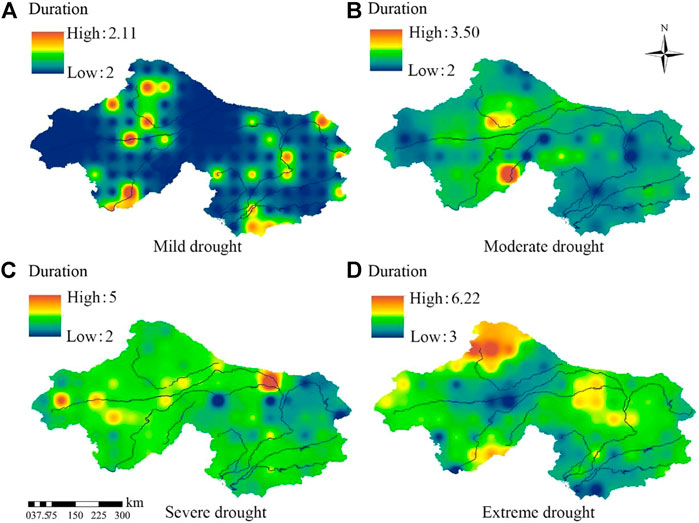
FIGURE 6. Spatial distribution of drought duration at different drought levels from 1961 to 2018. (A) is mild drought, (B) is moderate drought, (C) is severe drought, (D) is extreme drought. (Numerical unit: month).
The spatial distribution of the correlations between SPEI and temperature and precipitation at different time scales is shown in Figure 7. The SPEI was positively correlated with precipitation and negatively correlated with air temperature across all the time scales. SPEI correlated more strongly with precipitation than air temperature, and the level of correlation with both meteorological elements varied spatially. SPEI-1 had the strongest correlation with precipitation and air temperature, but increased time frames made this relationship progressively weaker. Across all time frames, the correlation between SPEI and precipitation presented a decreasing trend from southeast to northwest (Figures 7A,C,E,G). The correlation between SPEI-1 and precipitation in the southeast of the LRB was the strongest, reaching 0.4055 (Figure 7A). The correlation between SPEI and air temperature across all the time frames was high in the middle and low on both sides (Figures 7B,D,F,H). Among them, SPEI-1 had the strongest correlation (−0.0767) with air temperature in the middle of the LRB (Figure 7B). Across all time frames, the SPEI correlated significantly with precipitation (p < 0.01), but SPEI-1 correlated significantly with temperature (p < 0.05) for only some areas (accounting for 7% of the LRB).
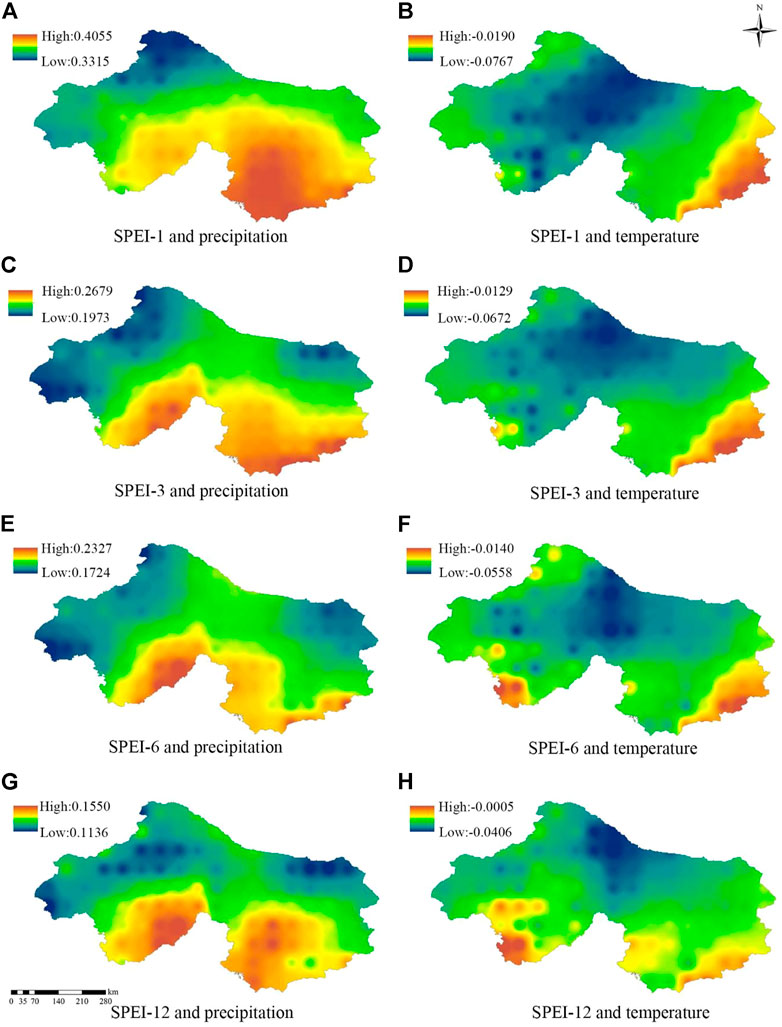
FIGURE 7. Spatial distribution of the Pearsons correlation between SPEI and precipitation and air temperature at different time scales from 1961 to 2018. (A, C, E, G) are the Pearson correlations between SPEI-1, SPEI-3, SPEI-6, SPEI-12 and precipitation respectively; (B, D, F, H) are the Pearson correlations between SPEI-1, SPEI-3, SPEI-6, SPEI-12 and temperature respectively.
In a natural state, meteorological drought is the only external factor that drives hydrological and agricultural drought. Therefore, the quantitative analysis of temporal and spatial variations in meteorological drought forms the basis for understanding regional drought conditions. Some studies have indicated that China may be undergoing a drying trend as a whole, wherein the drought trend in the northeast has intensified, and the center of drought intensity in the northeast is gradually shifting to the Liaoning region (Shao et al., 2018; Zhao et al., 2020). Therefore, based on the multi-time-scale SPEI, this study explored the spatial and temporal distribution characteristics and influencing factors of drought in the LRB during the past 60 years. The results showed that the LRB as a whole is becoming more arid, which is consistent with other research results.
The present study showed that the higher the level of drought, the less frequent and severe they are, and the longer they persist. That is, extreme droughts occurred the least, had the lowest severity (within that level of drought), and continued the longest. Cavus and Aksoy (2020) constructed a drought severity/intensity–duration–frequency curve (S/IDF) and found that the higher the grade of drought in the Seyhan River basin, the lower the frequency, the longer the duration, and the lower the severity. Wang et al. (2015) proposed that in the Huang Huai Hai Plain, severe droughts were most commonly long-term events, as a long-term water deficit reduces the severity of drought but eventually leads to an increase in the level of drought, which is consistent with the results of this study. However, Han et al. (2021) and Zhang et al. (2015) pointed out that drought in the west of China has a higher frequency, longer duration, and lower severity than drought in eastern China. In the analysis of drought characteristics, this study only divided drought grades based on drought severity to analyze the spatial distribution of drought frequency, severity, and duration. Therefore, the relationship between drought characteristics still needs to be elucidated.
The evolution of drought is influenced largely by changes in precipitation and temperature. Quantitative analysis of the relationship of SPEI with precipitation and temperature indicated that the drought conditions in the LRB were highly dependent on regional precipitation, which showed a significant negative correlation with the drought index. This may be attributed to the temperate continental monsoon climate and the significant seasonal variation in precipitation in the LRB (Yuan et al., 2021), which means that the climatic conditions of the basin are very much determined by changes in precipitation. Guo et al. (2020) showed that variations in droughts are significantly correlated with the temporal and spatial distribution of precipitation and that areas with excessive precipitation have a significantly negative correlation with drought indicators, agreeing with the results of the present study. Because the causes of drought are extremely complex, the effects of different meteorological factors on the drought conditions affecting the LRB need further investigation. Although the current study only discusses the influence of precipitation and temperature on drought conditions in the LRB, droughts can be induced by various meteorological factors. Their formation mechanisms are complex, with different factors exerting different degrees of influence on drought characteristics. Therefore, future research should consider other influencing factors, such as relative humidity, sunshine hours, and average wind speed, to improve the research content (Shen et al., 2017; Zhang et al., 2020). At present, climate warming and the impact of human activities lead to more complex drought formation mechanisms. Therefore, moving forward, the impact of underlying surface changes and human activities on drought should be considered (Xie et al., 2021).
As climate warming and drying trends intensify, extreme drought events are likely to continue increasing. Thus, emergency response and management plans for droughts may play an important role in regional development. As foundational research, the outcomes of this research have value in the following contexts: 1) The LRB, especially the West Liaohe River Basin, is an important sand-control and sand-fixing area for shelter forests in North China and Northeast China. Due to the causal relationship between drought, wind erosion, organic matter removal, and desertification, this work supports the formulation of sand control and sand fixation policies. 2) Highlighting the need for the protection and responsible utilization of water resources, the planning and construction of water conservancy projects, and the formulation of water safety policies in the LRB. 3) Promoting the territorial and spatial planning of the LRB, which highlights “the whole area, the whole element, and the whole process” concept. This is especially important for ecological restoration and management, construction of the ecological security pattern, and the rational layout of the ecological, production and living spaces. The LRB is located in a semi-humid to humid area, where public awareness of disaster prevention and mitigation and drought early-warning forecasting, emergency response, and management capabilities are poor. If not improved in time, these will seriously affect agriculture and the social economy (Chen et al., 2018). Therefore, relevant departments should raise awareness and attach great importance to issues such as crop drought resistance and water resource management and allocation in order to reduce the damage associated with droughts.
This study used the monthly precipitation and monthly average temperature grid point data (0.5° × 0.5°) in the LRB from 1961 to 2018 to calculate the multi-time-scale SPEI, and analyze the spatial and temporal distribution characteristics and influencing factors of drought. The following conclusions were reached:
(1) From 1961 to 2018, the annual SPEI decreased at 0.0514/10a. This trend was significant from 1997 to 2001. Seasonally, the SPEI in spring (0.0518/10a), summer (0.0737/10a), and winter (0.0324/10a) showed an upward trend; multiple mutations occurred, but no significant trends were observed.
(2) Concerning the frequency of droughts, the frequency of mild droughts in the northern LRB was relatively high, with a maximum of 29 occurrences. The frequency of extreme droughts was similar to that of mild droughts; the highest frequency was 12. In the northern and western parts of the LRB, the frequency of moderate droughts was the highest, with a maximum of 32 occurrences. In the southern part of the LRB, the frequency of severe droughts was the highest, with a maximum of 20 occurrences.
(3) Regarding drought severity, mild and moderate droughts gradually increased from west to east and from south to north, respectively. Severe droughts in the north of the Xilamulun and Xiliao River Basins were comparatively more severe, with an SPEI value as low as −5.24. Also, the upper reaches of the Chagan Mulun River experienced extreme drought, with the lowest SPEI value being −7.07.
(4) Concerning the drought duration, 79% of the regions experienced a mild drought that lasted for 2°months, with the longest duration of mild droughts being 2.11 months. In 96% of the regions, the duration of moderate droughts was 2–2.5 months, while the longest duration was 3.5 months. Severe droughts lasted for 2–3 months in 65% of the regions, while the longest duration was 5 months. The duration of extreme drought in 88% of the regions was 3–4 months, while the longest duration was 6.22 months.
(5) The SPEI of different time scales showed a positive correlation with precipitation and a negative correlation with air temperature. The correlation between the SPEI and precipitation was significant and stronger than that between the SPEI and air temperature. Only the correlation between SPEI-1 and the temperature of 7% of the regions was significant, indicating that precipitation exerts a more pronounced and significant effect on drought.
The raw data supporting the conclusion of this article will be made available by the authors, without undue reservation.
YG is solely responsible for the development of the manuscript, including but not limited to, data collection and analysis, creating graphics, and writing.
The author thanks the editor and reviewers for their valuable comments and suggestions.
Author YG was employed by Shenyang Urban Planning and Design Institute Co, Ltd.
All claims expressed in this article are solely those of the authors and do not necessarily represent those of their affiliated organizations, or those of the publisher, the editors and the reviewers. Any product that may be evaluated in this article, or claim that may be made by its manufacturer, is not guaranteed or endorsed by the publisher.
Alley, W. M. (1984). The palmer drought severity index: Limitations and assumptions. J. Clim. Appl. Meteor. 23, 1100–1109. doi:10.1175/1520-0450(1984)023<1100:tpdsil>2.0.co;2
Cavus, Y., and Aksoy, H. (2020). Critical drought severity/intensity-duration-frequency curves based on precipitation deficit. J. Hydrol. X. 584, 124312. doi:10.1016/j.jhydrol.2019.124312
Chen, H., Fan, L., Wu, W., and Liu, H. (2017). Comparison of spatial interpolation methods for soil moisture and its application for monitoring drought. Environ. Monit. Assess. 189 (10), 525–613. doi:10.1007/s10661-017-6244-4
Chen, X., Jiang, J., and Li, H. (2018). Drought and flood monitoring of the Liao River Basin in Northeast China using extended GRACE data. Remote Sens. 10 (8), 1168. doi:10.3390/rs10081168
Gao, Z., He, J., Dong, K., and Li, X. (2017). Trends in reference evapotranspiration and their causative factors in the West Liao River basin, China. Agric. For. Meteorol. 232, 106–117. doi:10.1016/j.agrformet.2016.08.006
Guo, E., Wang, Y., Jirigala, B., and Jin, E. (2020). Spatiotemporal variations of precipitation concentration and their potential links to drought in mainland China. J. Clean. Prod. 267, 122004. doi:10.1016/j.jclepro.2020.122004
Han, L., Zhang, Q., Zhang, Z., Jia, J., Wang, Y., Huang, T., et al. (2021). Drought area, intensity and frequency changes in China under climate warming, 1961–2014. J. Arid Environ. 193, 104596. doi:10.1016/j.jaridenv.2021.104596
Hao, Z., AghaKouchak, A., Nakhjiri, N., and Farahmand, A. (2014). Global integrated drought monitoring and prediction system. Sci. Data 1 (1), 140001–140010. doi:10.1038/sdata.2014.1
He, C., Tian, J., Gao, B., and Zhao, Y. (2015). Differentiating climate-and human-induced drivers of grassland degradation in the Liao River Basin, China. Environ. Monit. Assess. 187 (1), 4199–4214. doi:10.1007/s10661-014-4199-2
Jain, V. K., Pandey, R. P., Jain, M. K., and Byun, H. (2015). Comparison of drought indices for appraisal of drought characteristics in the Ken River Basin. Weather Clim. Extrem. 8, 1–11. doi:10.1016/j.wace.2015.05.002
Jiang, C., and Wang, F. (2016). Temporal changes of streamflow and its causes in the Liao River Basin over the period of 1953-2011, northeastern China. Catena 145, 227–238. doi:10.1016/j.catena.2016.06.015
Kim, W., Iizumi, T., and Nishimori, M. (2019). Global patterns of crop production losses associated with droughts from 1983 to 2009. J. Appl. Meteorol. Climatol. 58 (6), 1233–1244. doi:10.1175/JAMC-D-18-0174.1
Kumar, U., Singh, S., Bisht, J. K., and Kant, L. (2021). Use of meteorological data for identification of agricultural drought in Kumaon region of Uttarakhand. J. Earth Syst. Sci. 130 (3), 121–213. doi:10.1007/s12040-021-01622-1
Li, Y., Liu, K., Li, L., and Xu, Z. (2012). Relationship of land use/cover on water quality in the Liao River basin, China. Procedia Environ. Sci. 13, 1484–1493. doi:10.1016/j.proenv.2012.01.140
Liu, X., Xu, Z., and Yu, R. (2012). Spatiotemporal variability of drought and the potential climatological driving factors in the Liao River basin. Hydrol. Process. 26 (1), 1–14. doi:10.1002/hyp.8104
Mondol, M. A. H., Zhu, X., Dunkerley, D., and Henley, B. J. (2021). Observed meteorological drought trends in Bangladesh identified with the Effective Drought Index (EDI). Agric. Water Manag. 255, 107001. doi:10.1016/j.agwat.2021.107001
Omer, A., Ma, Z., Zheng, Z., and Saleem, F. (2020). Natural and anthropogenic influences on the recent droughts in Yellow River Basin, China. Sci. Total Environ. 704, 135428. doi:10.1016/j.scitotenv.2019.135428
Palmer, W. C. (1965). Meteorological drought. Washington, D.C. US Department of Commerce, Weather Bureau.
Pei, Z., Fang, S., Wang, L., and Yang, W. (2020). Comparative analysis of drought indicated by the SPI and SPEI at various timescales in inner Mongolia, China. Water 12 (7), 1925. doi:10.3390/w12071925
Qin, D. (2015). China national assessment report on risk management and adaptation of climate extremes and disasters. Beijing: Science Press.
Shao, D., Chen, S., Tan, X., and Gu, W. (2018). Drought characteristics over China during 1980-2015. Int. J. Climatol. 38 (9), 3532–3545. doi:10.1002/joc.5515
Shen, Q., Liang, L., Luo, X., Li, Y., and Zhang, L. (2017). Analysis of the spatial-temporal variation characteristics of vegetative drought and its relationship with meteorological factors in China from 1982 to 2010. Environ. Monit. Assess. 189 (9), 471–514. doi:10.1007/s10661-017-6187-9
Song, Y., Liu, R., Sun, Y., Lei, K., and Kolditz, O. (2015). Waste water treatment and pollution control in the Liao River Basin. Environ. Earth Sci. 73 (9), 4875–4880. doi:10.1007/s12665-015-4333-7
Spinoni, J., Naumann, G., Carrao, H., Barbosa, P., and Vogt, J. (2014). World drought frequency, duration, and severity for 1951-2010. Int. J. Climatol. 34 (8), 2792–2804. doi:10.1002/joc.3875
Stagge, J. H., Tallaksen, L. M., Gudmundsson, L., Van Loon, A. F., and Stahl, K. (2015). Candidate distributions for climatological drought indices (SPI and SPEI). Int. J. Climatol. 35 (13), 4027–4040. doi:10.1002/joc.4267
Tan, C., Yang, J., and Li, M. (2015). Temporal-spatial variation of drought indicated by SPI and SPEI in ningxia hui autonomous region, China. Atmosphere 6 (10), 1399–1421. doi:10.3390/atmos6101399
Ullah, I., Ma, X., Yin, J., Asfaw, T. G., Azam, K., Syed, S., et al. (2021). Evaluating the meteorological drought characteristics over Pakistan using in situ observations and reanalysis products. Int. J. Climatol. 41 (9), joc.7063–4459. doi:10.1002/joc.7063
Uyanık, G. K., and Güler, N. (2013). A study on multiple linear regression analysis. Procedia - Soc. Behav. Sci. 106, 234–240. doi:10.1016/j.sbspro.2013.12.027
Wang, Q., Shi, P., Lei, T., Geng, G., Liu, J., Mo, X., et al. (2015). The alleviating trend of drought in the Huang-Huai-Hai Plain of China based on the daily SPEI. Int. J. Climatol. 35 (13), 3760–3769. doi:10.1002/joc.4244
Wang, X., Li, J., Chen, J., Cui, L., Li, W., Gao, X., et al. (2020). Water quality criteria of total ammonia nitrogen (TAN) and un-ionized ammonia (NH3-N) and their ecological risk in the Liao River, China. Chemosphere 243, 125328. doi:10.1016/j.chemosphere.2019.125328
Xie, J., Sun, Y., Liu, X., Ding, Z., and Lu, M. (2021). Human activities introduced degenerations of wetlands (1975–2013) across the sanjiang plain north of the wandashan mountain, China. Land 10 (12), 1361. doi:10.3390/land10121361
Xu, L., Abbaszadeh, P., Moradkhani, H., Chen, N., and Zhang, X. (2020). Continental drought monitoring using satellite soil moisture, data assimilation and an integrated drought index. Remote Sens. Environ. 250, 112028. doi:10.1016/j.rse.2020.112028
Xu, Y., Zhang, X., Wang, X., Hao, Z., Singh, V. P., and Hao, F. (2019). Propagation from meteorological drought to hydrological drought under the impact of human activities: A case study in northern China. J. Hydrol. X. 579, 124147. doi:10.1016/j.jhydrol.2019.124147
Yang, P., Xia, J., Zhang, Y., Zhan, C., and Qiao, Y. (2018). Comprehensive assessment of drought risk in the arid region of Northwest China based on the global palmer drought severity index gridded data. Sci. Total Environ. 627, 951–962. doi:10.1016/j.scitotenv.2018.01.234
Yuan, Z., Xu, Q., Song, Y., Wei, J., Duan, L., and Gao, Y. (2021). Practice and enlightenment of water ecological integrity restoration in Liaohe River Basin of Liaoning Province[J]. Journal of Environmental Engineering Technology 11 (1), 48–55. doi:10.12153/j.issn.1674-991X.20200113
Zhang, Q., Qi, T., Singh, V. P., Chen, Y. D., and Xiao, M. (2015). Regional frequency analysis of droughts in China: A multivariate perspective. Water Resour. manage. 29 (6), 1767–1787. doi:10.1007/s11269-014-0910-x
Zhang, Q., Yao, Y., Li, Y., Huang, J., Ma, Z., Wang, Z., et al. (2020). Causes and changes of drought in China: Research progress and prospects. J. Meteorol. Res. 34 (3), 460–481. doi:10.1007/s13351-020-9829-8
Zhang, R., Wu, X., Zhou, X., Ren, B., Zeng, J., and Wang, Q. (2022). Investigating the effect of improved drought events extraction method on spatiotemporal characteristics of drought. Theor. Appl. Climatol. 147 (1), 395–408. doi:10.1007/s00704-021-03838-z
Zhang, Y., Luo, Y., and Su, H. (2021). Study on land use and precipitation changes in the main urban area of kunming in the past 40 years. IOP Conf. Ser. Earth Environ. Sci. 658 (1), 012008. doi:10.1088/1755-1315/658/1/012008
Zhao, C., Wang, C., Yan, Y., Shan, P., Li, J., and Chen, J. (2018). Ecological security patterns assessment of liao River basin. Sustainability 10 (7), 2401. doi:10.3390/su10072401
Zhao, P., Lu, H., Fu, G., Zhu, Y., Su, J., and Wang, J. (2017). Uncertainty of hydrological drought characteristics with copula functions and probability distributions: A case study of weihe river, China. Water 9 (5), 334. doi:10.3390/w9050334
Keywords: SPEI, run theory, spatio-temporal distribution, correlation, Liaohe river basin
Citation: Gong Y (2022) Spatio-temporal distribution characteristics and influencing factors of drought in the Liaohe river basin, China. Front. Environ. Sci. 10:1044837. doi: 10.3389/fenvs.2022.1044837
Received: 15 September 2022; Accepted: 10 October 2022;
Published: 21 October 2022.
Edited by:
Jun Yang, Northeastern University, ChinaReviewed by:
Xiao Liu, South China University of Technology, ChinaCopyright © 2022 Gong. This is an open-access article distributed under the terms of the Creative Commons Attribution License (CC BY). The use, distribution or reproduction in other forums is permitted, provided the original author(s) and the copyright owner(s) are credited and that the original publication in this journal is cited, in accordance with accepted academic practice. No use, distribution or reproduction is permitted which does not comply with these terms.
*Correspondence: Yuanshan Gong, NDAzOTg4MjUyQHFxLmNvbQ==
Disclaimer: All claims expressed in this article are solely those of the authors and do not necessarily represent those of their affiliated organizations, or those of the publisher, the editors and the reviewers. Any product that may be evaluated in this article or claim that may be made by its manufacturer is not guaranteed or endorsed by the publisher.
Research integrity at Frontiers
Learn more about the work of our research integrity team to safeguard the quality of each article we publish.