 Kaida Chen
 Hanliang Lin
 Fangxiao Cao
 Yan Han
 Shuying You
 Oliver Shyr1
 Yichen Lu
 Xiaodi Huang
95% of researchers rate our articles as excellent or good
Learn more about the work of our research integrity team to safeguard the quality of each article we publish.
Find out more
ORIGINAL RESEARCH article
Front. Environ. Sci. , 24 November 2022
Sec. Land Use Dynamics
Volume 10 - 2022 | https://doi.org/10.3389/fenvs.2022.1044600
This article is part of the Research Topic Meta-Scenario Computation for Social-Geographical Sustainability View all 60 articles
This study investigates the interaction between the accessibility of various urban public facilities and the price of urban space by analysing the influence of urban hospitals and rail accessibility on housing prices. In recent years, with the development of social civilisation and the influence of COVID-19, people have become increasingly interested in the quality of hospitals in their living environment. This makes medical convenience (hospital accessibility) a crucial element in determining housing prices. At the same time, people regard rail as one of the important means to access hospitals. Therefore, demonstrating the intrinsic value of accessibility to hospitals and rail in residential areas is essential. As a point of reference, this paper presents an empirical analysis of Fuzhou, Fujian Province, China, a city in a developing nation with relatively widespread access to hospitals during a significant rail construction period. The study demonstrates the interaction between hospital and rail accessibility and their moderate influence on housing prices, which is geographically heterogeneous. The study also determines the optimal metric model for assessing geographical interaction based on the significance and stability of the interaction in geographic space. It concludes with a discussion of the findings and social recommendations.
In recent years, as the economy as a whole has risen, the problem of ageing has become more severe, and people have become increasingly concerned about their quality of life. Furthermore, in the context of COVID-19 over the past 2 years, people are becoming more health-conscious and aware of how to gain access to a high-quality hospital (Wu et al., 2013). As an integral part of the city’s infrastructure, hospitals serve the diagnostic needs of residents and contribute to economic growth (Yang et al., 2022).
Consequently, people tend to consider the proximity of hospitals when purchasing houses (Baumont et al., 2003). The factors they consider include degree, ownership, type, scope and accessibility, which is one of the most important. Accessibility is a crucial concept in human geography for analysing the geographical arrangement of public service facilities (Yang et al., 2019). Western scholars have been concerned with accessibility since 1950. The accessibility of healthcare facilities largely impacts the convenience of getting healthcare services.
These concerns about hospital accessibility have also prompted a recent increase in research on the influence on housing prices. Li, Gong (Li et al., 2021) used the Gaussian-two step floating catchment area method to study the influence of accessibility to public services on housing prices in Beijing. The influence was strongly positive at a 1% significance level. A one-unit increase in the accessibility of hospitals is associated with an average increase of 1.1% in housing prices, all other variables being equal.
By contrast, when purchasing houses, people also consider the proximity of rail accessibility in addition to hospital accessibility (Yang et al., 2020a). As an efficient and environmentally friendly means of transportation, rail is an essential component of residential accessibility (Yang et al., 2020b). Numerous studies have demonstrated that rail stations have a significant influence on housing prices. Foreign scholars initiated their research in this field earlier than their counterparts in China. Alonso, for instance, proposed bid rent theory as early as 1964, arguing that accessibility has a direct influence on housing prices near transportation hubs (Alonso, 1964).
Collectively, the aforementioned studies indicate that hospital and rail station accessibility will affect housing prices. Given the potential correlation between hospital and rail accessibility, investigating the interaction between hospital and rail station accessibility on housing prices. This paper introduces the concept of interaction to the hedonic price model and develops a linear regression interaction regression model and a spatial regression interaction regression model for the continuous accessibility variables. It examines the mutual adjustment relationship between the accessibility variables of hospitals and that of rail stations on housing prices. A few scholars have conducted studies on the relationship between such two variables, but the studies are brief and do not provide a thorough overview of the relationship between the two. As a result, this paper will focus on the interaction between the two to supplement the research in this field.
The paper is structured into four components. The first part is the introduction and review, which explores the background of the study and a summary of previous research. The second part is the statistics and methodology, which introduces the subject of the study, the research framework, the research statistics sources and the research methodology. The third part is a report of the research statistics results. The fourth part is discusses and concludes.
As a key element of urban infrastructure, hospitals have a significant influence on housing prices. Numerous international studies, such as Banzhaf and Farooque (2012), have confirmed this finding. The findings of Dziauddin (2014) also suggest that hospital accessibility can affect housing prices.
Scholars have occasionally discussed the varying effects of the different categories of hospitals on influencing housing prices. In a study of the influence of different categories of hospitals on housing prices, Baden (2013) used the hedonic price model to conduct a controlled experiment to examine the influence of medical centres and hospitals on retirement housing prices. They concluded that hospitals had a positive influence on retirement housing prices, whereas medical centres had a negligible influence. By incorporating different ecological sites into a feature analysis based on a spatial multilevel model, Liu et al. (2020) concluded that the proximity of a grade-A tertiary hospital plays a positive role in housing prices.
Previous scholars have evaluated the accessibility of hospitals, and their findings regarding the influence of hospitals are diverse. They can be divided into three broad perspectives: spatial distance, number of hospitals and density of hospitals. The findings can also be categorized as positive, negative or both. The section that follows provides a more in-depth analysis of the research conducted in these two areas.
One of the most common options is research based on the distance of houses to hospitals. Many scholars have conducted research from this perspective. For example, Using geostatistical methods and quantitative regression, Wang and Liu (2013) ascertained that the distance to hospitals and schools significantly decreased housing prices by 3.8% and 3.3%, respectively. Dziauddin et al. (2013) determined that for every additional metre in a straight line and grid distance from the hospital in Malaysia, the housing prices would increase by about MYR 3. Dziauddin (2014) employed the hedonic price model to determine the influence of location characteristics on housing prices and determined that the housing prices would increase by approximately MYR 5.52 per metre of distance from the hospital. Peng and Chiang (2015) used quantile regressions to examine the spatial effects of hospitals in the Taipei metropolitan area at different housing prices scales. They found that hospitals were rated higher for their ‘close but not too close’ proximity to residential areas and that housing prices were unrelated.
Precedents for defining hospital accessibility based on the proximity of hospitals to a residence are numerous. Several Chinese scholars have also conducted the following research on the influence of the density of hospitals on housing prices. Wang and Gao (2014) investigated the spatial characteristics of housing prices using spatial statistics on average transaction prices in residential areas of Beijing in 2005 and 2012, revealing that housing prices in 2005 and 2012 increased by 10.7% and 7.5%, respectively, when one or more grade-A tertiary hospitals were within 1,000 m of a residential area. Yang et al. (2016) used a sample of 1,840 general residences on Xiamen Island to examine the direction and extent of capitalisation of public items in the residential market by constructing hedonic price equations, demonstrating that the walkability of grade-A tertiary/secondary hospitals had a negative influence on housing prices, with each additional grade-A tertiary/secondary hospital lowering the total housing prices by 2.8%.
A small number of scholars employed the density concept, which is derived by combining distance and quantity, as an indicator of hospital accessibility. Wang and Chen (2019) use a non-linear model of three property types, buildings, apartments and suites - a combination of upward and downward trends derived from the generalised additive model as an indicator of hospital accessibility. The study concluded that the residential-to-hospital distance pattern has a ‘V’ curve, with the lowest prices at 0.8 km to the hospital. The right number of hospitals will result in higher prices, and too many or too few will result in lower prices.
The majority of scholarly research indicates that the proximity of hospitals has a positive influence on housing prices. The pertinent literature is compiled and summarized as follows: Guo et al. (2016) studied the spatially divergent status of housing prices and their factors in Jinan and concluded that key hospitals play a crucial role in housing prices, which were positively correlated with the distance to hospitals. According to Jabbar (2016) research, individuals are willing to pay more for a nearby hospital. Lan and Ye (2020) investigated the linear relationship between these factors and housing prices in Shanghai using linear regression on a large statistics set combining characteristics such as housing prices and location information. It concluded that hospitals have a positive influence on the price of surrounding houses. Liu et al. (2022) compared the multi-scale effects of accessibility to various facilities on housing prices and demonstrated that hospitals have a positive influence on housing prices, indicating that the closer the proximity, the higher the housing prices.
Nonetheless, some scholars have concluded that the influence of hospitals on housing prices is marginal. According to He et al. (2010), hospital proximity appears to have little influence on housing transaction prices. Cao et al. (2019) analysed the geographical variation of the public housing resale prices credited to the Housing Development Board (HDB) in Singapore and the various determinants of HDB resale condominium prices and concluded that the distance to the proximate general hospital was marginally correlated with HDB resale condominium prices in Singapore in 2011.
Some scholarly research even indicates that the presence of hospitals has the potential to result in lower housing prices. Using weighted least squares and a heteroskedasticity consistent covariance matrix estimator, Tan (2011) estimated the coefficients of the influence of the structure, location and neighbourhood characteristics of houses on housing prices. Li et al. (2013) used GIS techniques and the hedonic price model to determine the extent to which different spatial factors influence housing prices in Xiamen. They found that housing prices increased by CNY 1,190 for every kilometre away from the hospital. Peng et al. (2015) examined the spatial influence effect of grade-A tertiary hospitals on the neighbouring housing prices by harnessing the hedonic price model and multiple regression analysis, finding that grade-A tertiary hospital plays a negative role in housing prices in their vicinity. By contrast, Luo et al. (2010), who conducted a study on housing prices in the central area of Wuhan, discovered that greater accessibility to a hospital led to lower housing prices.
In addition, a body of research suggests that the influence of hospitals on housing prices is two-way. The first study by Waddell and Hoch (1993) investigated a non-linear housing prices gradient in a multi-node urban area and discovered that hospitals lower housing prices by 3% within half a mile, boost them by 2% between one and two miles and then decay to zero. Zhang et al. (2016) used the hedonic price model to examine the link between the prices of major hospitals and the surrounding residential communities, using Shandong Provincial Hospital as an example. In both the east–west and north–south within the study distance range, a significant cubic function relationship was observed between the weighted distance from the residential community to the major hospital and its price. In the east-west, within a 0.83 km radius of the key hospital, the price of housing decreases as the distance increases. Within 0.83–2.35 km of the key hospital, the price of housing increases as the distance increases. In the north–south, within 1.03 km of the key hospital, the price of housing decreases as the distance increases. Within 1.03–2.46 km of the key hospital, the price of housing increases proportionally with distance. Febrita et al. (2017) concluded that housing prices increase gradually as the distance between hospitals and residences decreases, but that the most expensive residences may be located either far from or close to hospitals. Han et al. (2018) highlighted the importance of different geographical heterogeneity and concluded that the influence of hospitals on housing prices in Shenzhen is predominantly negative, meaning housing prices are lower near hospitals. Owing to the lack of hospitals and the increase in the elderly population, hospitals have a positive influence on Longgang and Yantian’s housing prices. Lan et al. (2018) analysed service facilities in Xi’an, China and concluded that hospitals have varying effects on housing prices in different regions. In well-built residential areas in the south, the presence of hospitals exacerbates issues such as traffic jams and environmental pollution, and hospitals therefore have a detrimental influence on housing prices; in poorly built facilities in the city’s periphery, hospitals have a beneficial influence on housing prices.
Rail is an essential component of urban infrastructure, and rail stations can have a substantial influence on housing prices in the vicinity. This subject has been researched by numerous scholars around the world. Foreign scholars initiated research in this field considerably earlier than their Chinese counterparts. In Almosaind et al. (1993), an empirical study of rail in Portland determined that proximity to a light rail station is advantageous for houses within 500 m walking distance, with a housing prices differential of nearly 10.6% and a distance decay effect.
Numerous studies and the vast majority of scholarly research have demonstrated that rail stations have a significant positive influence on housing prices. McDonald and Osuji (1995) compared land values in Chicago before and after the rail plan was announced and found a 17% increase within 1.5 miles of the station. Benjamin and Sirmans (1996) demonstrated that for every 0.1-mile increase in distance to a rail station, flat rents decrease by 2.5%. In addition, Agostini and Palmucci (2008) for Santiago, Chile; Bae et al. (2003) for Seoul, Korea; Hao and Chen (2007) for Shanghai and Li, Chen (Li et al., 2019) for Beijing all conclude that rail contributes to neighbourhood housing prices. Tan et al. (2019) conducted empirical analyses of rail in Wuhan and all concluded that rail can promote the growth of housing prices and that the two have a positive correlation. Zhang (2014) examined housing prices statistics near Nanjing Lines one and two from a distance-based research perspective and discovered that rail has a positive influence on housing prices, with the results indicating that the stimulative effect of rail on housing prices growth is greatest when the distance between rail and residential is less than 500 m. Once the distance between rail and residential reaches 2,000 m, the growth effect ceases to be significant. Im and Hong (2018) examined the difference in housing prices in Daegu, South Korea, before and after the opening of the rail transit line. They discovered that housing prices within 500 m of the proximate station on the new line increased by approximately USD 96.3 per square foot. Rohit and Peter (2018) used a characteristic price model analysis to demonstrate that rail in Bangalore substantially increased property values, with the influence of rail appearing to extend well beyond the traditional 500 m radius to encompass the entire city.
Alternatively, some studies have found that rail lessens the housing prices along the route. Teng et al. (2014) used the hedonic price model to study the influence of rail on housing prices along rail transit lines, using Tianjin metro line 1 as an example, and the analysis revealed that housing prices decreased with increasing distance from the proximate rail station. The average housing prices in non-central areas increased and then decreased with increasing distance from the proximate rail station, whereas the average housing prices in central areas increased and then decreased with increasing distance from the proximate rail station. However, once the distance exceeds 500 m, the change in housing prices is no longer statistically significant.
A few studies have also concluded that the influence of rail on housing prices along the route is negligible. In a study of the influence of transit improvements on housing premiums, Bajic (1983) determined that savings in commuting expenses were capitalised into housing values. Gatzlaff and Smith (1993) analysed statistics on housing prices along rail transit lines in Miami and determined no significant increase in condominium prices along rail transit lines. When contrasting commercial properties in Washington and Atlanta, Cervero and Landis (1993) came to comparable conclusions. Bae et al. (2003) and others examined the influence of the construction of the new rail transit line five in Seoul, Korea, on the influence of nearby housing prices and found that accessibility had a smaller influence on housing prices than other variables.
Less research has been conducted on the interaction between hospital and rail accessibility. The only available study, conducted by Tang et al. (2020), concludes that the interaction between hospitals and rail stations has no significant influence on housing prices.
The city of Fuzhou in China’s Fujian Province was selected as the subject of this study. Fuzhou (E:119.28, N:26.08.) is located on the southeastern coast of China. It is one of the country’s most prosperous regions, as well as the capital of Fujian Province. Fuzhou has abundant hospitals, a large population and a large sample size of housing, and its housing prices trends are generally consistent with those at the national level which is typically representative. In addition, it occurs at a time when the construction of urban rail is currently underway, so discussing the influence of hospital and rail accessibility on housing prices is interesting.
Figure 1 depicts the framework of this paper, and the core of the research process is divided into three stages. The first stage is the hedonic price model to examine the presence of the hospital and rail accessibility variable among the significant variables affecting housing prices. The second stage is an interaction regression model to examine whether mutual moderation in the influence of hospital and rail accessibility on housing prices actually exists. In the third stage, the geographical heterogeneity in the interaction moderating effects was investigated using a spatial regression model. In addition, a robustness test was conducted on the findings of the second stage of the study prior to determining whether geographical heterogeneity exists in the interaction in the third stage, making the preconceived notions of the pertinent study findings more convincing and trustworthy.
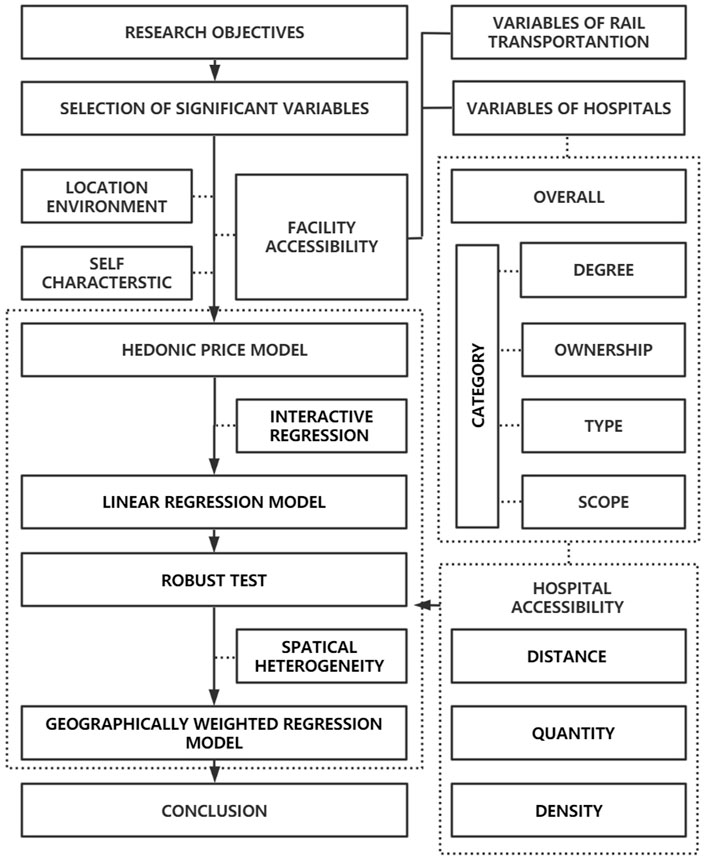
FIGURE 1. Framework diagram.
In this study, 1,079 housing samples and other relevant geographical information statistics were selected in March 2021, when the rail construction in Fuzhou City was opened to traffic. These statistics were obtained from internet information crawling and field research, and the statistics of the variables are described in Table 1.

TABLE 1. Descriptive statistics of the variables (N = 1,079).
In this study, interception statistics variables that may influence housing prices were established, and the most significant ones were utilised in the final regression model through a screening regression procedure. This includes statistics on the explanatory variable, housing prices statistics for March 2021, as well as statistics on three other explanatory variables: location environmental, self characteristics and facilities accessibility.
As shown in Table 2, the primary variable of this study is hospital accessibility. The investigation will be categorised from multiple vantage points. First, the study’s objectives will be set at all hospitals in the city, without distinction between hospital categories; second, the study’s objectives will be to investigate the influence of different degrees of hospitals on housing prices and their reliance on rail access. Given that different degrees of hospitals are differentiated by the level of equipment, the quantity of beds and specialists, there is a certain overlap in the function of demand for medical care between the different degrees of hospitals. To eliminate such covariance interferences, the study will use regressions with different degrees of hospitals independently. To investigate the variability of the influence of differences in the degree, ownership, type and scopes of hospitals on housing prices, as well as their reliance on rail access, a sub-study of the influence of different categories of hospitals was also conducted. Given no absolute non-substitutability of medical functions between hospitals with similar categorisation perspectives, the classified hospitals will continue to be fitted independently and separately in the regression analysis.
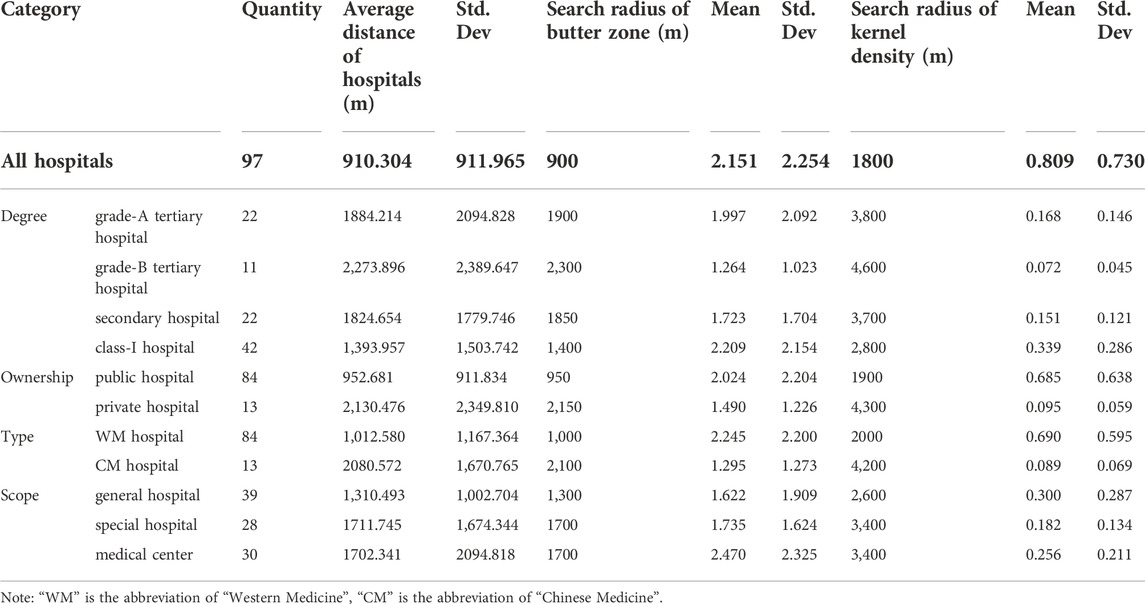
TABLE 2. Statistics variables of hospitals (N = 1,079).
The study will establish a variety of accessibility indicators for hospitals. Given that hospitals are not like school district zoning according to the residential grid but rather public facilities that are freely chosen by residents under market conditions, the accessibility of hospitals will be described by the Euclidean distance to the proximate hospital, the quantity of hospitals within the residential buffer zone and the urban hospital kernel density to which the residence belongs (Figure 2).
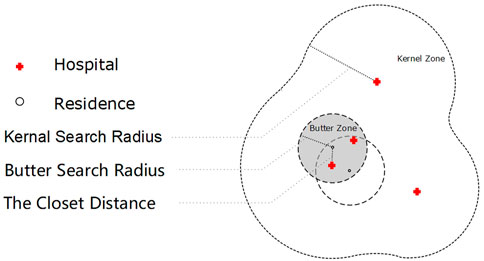
FIGURE 2. Categories of hospital accessibility index.
The various accessibility evaluation indicators for the residential hospital variable have distinct connotations. The Euclidean distance from hospitals explains, from a macroeconomic standpoint, the influence of hospital and rail accessibility on housing prices, as well as their mutually moderating effect. The quantity of hospitals within the residential buffer zone compensates for the absence of micro-level characteristics of proximity to hospitals due to the moderating effects of macro-level distance to hospital and rail accessibility factors on housing prices, and the radius size of the buffer is set as the average distance between all hospitals of the same type in the city. The final urban hospital kernel density value describes the comprehensiveness of the city’s macro healthcare system’s backup coverage when the distance to the proximate hospital in a residence is estimated and the quantity of hospitals within a close residence is the same. The search radius of the kernel density is defined as double the average distance between all hospitals of the same type within a city.
In this study, the rail accessibility variable serves as a moderator variable, and the spatial linear distance to the proximate rail station will be used to characterise the accessibility of rail to a residence. In contrast to hospitals, which are distinct and unique, rail stations are viewed as homogeneous, and people typically choose the proximate rail station.
For determining surface densities and for conducting empirical analyses of aggregation, the kernel density estimation method is frequently employed. It is used to calculate and estimate the aggregation of statistics from sample statistics and to investigate the dispersion and properties of hotspots in a spatial area by gauging the change in study element density via a specified distance decay function. Kernel density estimation is the practice of interpolating through discrete point or line statistics, where the points dropping further into the search agent have different weights, using the distance decay function to monitor the difference in the local density of the event; the closer to the centre, the greater the weight of the points. The kernel density estimation can intuitively reflect the spatial layout characteristics of the studied object, whose specific calculation formula model is as formula 1.
In formula 1:
The hedonic price model is a linear model function that is frequently applied to price forecasting, land value estimation and real estate transactions (Yang et al., 2018). The specific function model comes in a variety of shapes, including linear, semi-logarithmic and double-logarithmic. However, the double-logarithmic model is better able to convey the existence of significant marginal utility of the transaction price for residential characteristics when purchasing a residence, making the simulation process more realistic and reasonable. As a result, the hedonic price model used in this study adopts the double-logarithmic model frequently used by scholars. The explanatory variables and the housing prices are related as formula 2.
Here, Price
The addition of an interaction term to a linear regression model in econometrics is a special case of a regression equation model where the interaction can be viewed as the outcome of the interaction of two or more contributing factors. This approach broadens the range of variables that can be understood and the depth to which they are influenced by various explanatory factors in the regression model to some amount. The two cases of additive and multiplicative interaction terms were separately considered during the study, but after comparing the significance of the pertinent statistics, the multiplicative interaction model with the best fit and significance was selected as the method for this interaction study. Its specific formula model is as formula 3.
The ‘interaction effect’ in the interaction model, or the relationship between an explanatory variable’s effect and its magnitude, is represented by formula 4.
In spatial analysis, the GWR model is frequently employed. On top of conventional global regression, it considers the spatial position of each variable and computes the local effects of variables at various places using a spatial weight function, which has higher fitting properties. The GWR, whose precise calculation formula is as formula 5, incorporates the geographic location of the sample point statistics into the regression parameters:
where
Through the screening of significant variables and the R-squared test, the regression equation of STEP4 was chosen as the fitting function for the study, and the following results were found. The significant variables influencing housing prices are the location of residence (inside Second Ring Road or Third Ring Road), the quantity of population, the density of population and the GDP level in the variables of the location environment. In the variables of self-characteristics, the age of residence, high-quality primary and secondary school and property management fee are significant. The variables of facilities accessibility include distance to the closet green space, distance to the proximate main water source, distance to the proximate funeral facilities, distance to dump area and distance to rail stations and hospitals, which are the study’s primary concerns. The coefficients in Table 3 reveal the trends in the effects of each of these variables on housing prices. Negative coefficients are associated with the variables for distance to hospitals and rail stations.
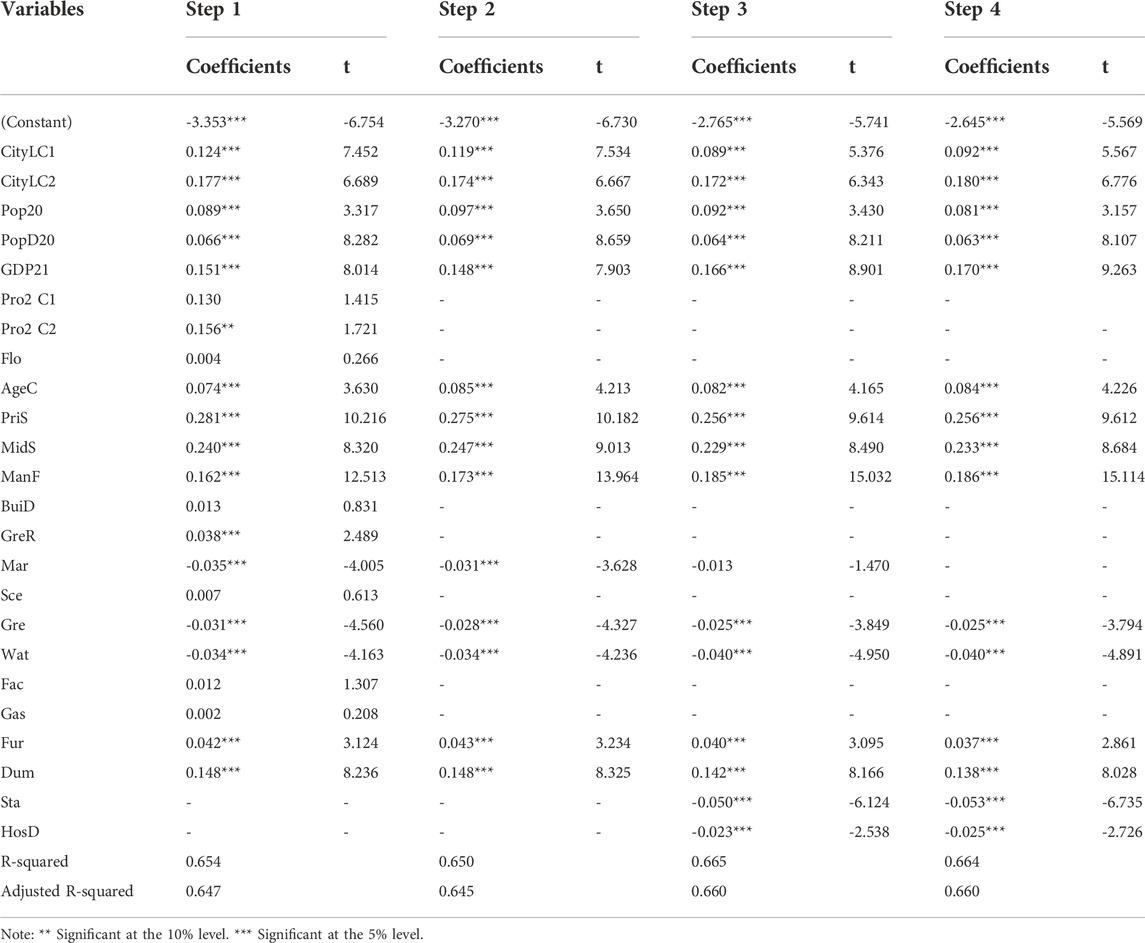
TABLE 3. Filtering statistics of the variables (N = 1,079).
The regressions were then fitted to different categorisations and hospital accessibility perspectives using a filtered functional model, yielding the following analysis (Table 4). The table depicts the level of significance of the influence on housing prices from a variety of hospital accessibility measurement vantage points.
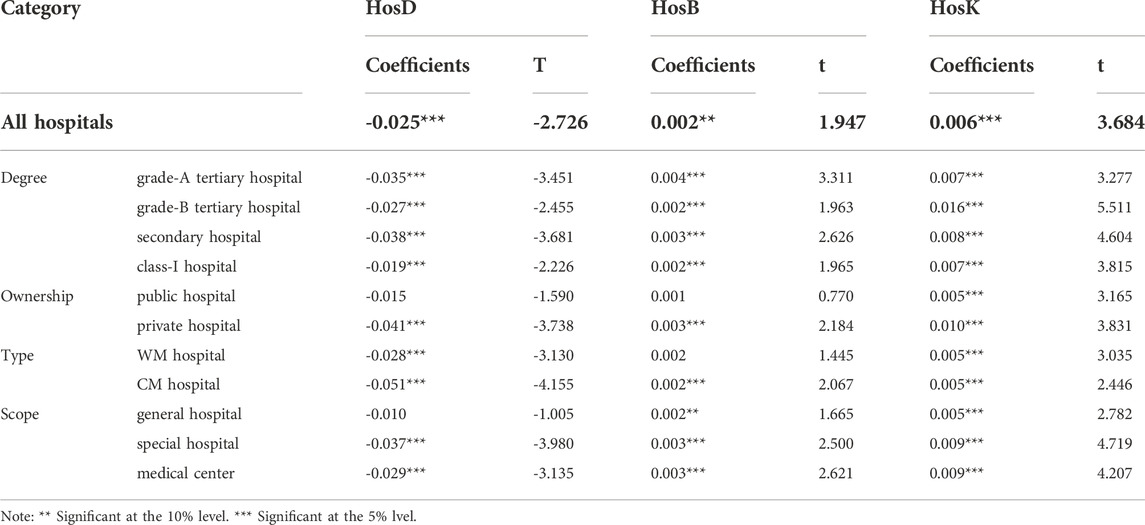
TABLE 4. Regression results of the Hos (N = 1,079).
The results of the interaction term analysis are presented in Table 5 by simulating the interactive regression results of the proximate hospital. The subsequent analysis outcomes contain linear and spatial interaction regression models. Moreover, the study demonstrates the robustness of the linear regression results before moving on to the spatial interaction regression model, demonstrating the dependability of the study’s statistics.
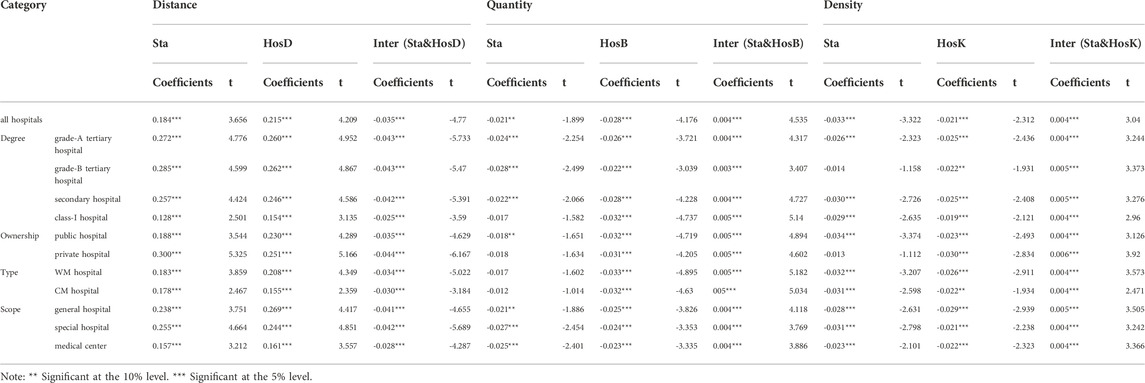
TABLE 5. Interactive regression results of the hospital accessibility.
The results of each model fit are presented in Table 5, one for each of the aforementioned hospital accessibility indicators. R-squares greater than 0.63 are displayed in each table containing interaction regression models for the various categories of hospital and rail accessibility. In the table, the core study variables: the hospital accessibility, the rail accessibility and its interaction, the significance and the coefficients are also described.
To increase the dependability of the findings of this research, a robustness test spot check was conducted following the linear regression model. Different categories of hospitals were selected at random to conduct the sample check for the regression fit analysis from each of the three evaluative perspectives of the study variables. The outcomes are displayed in Table 6.
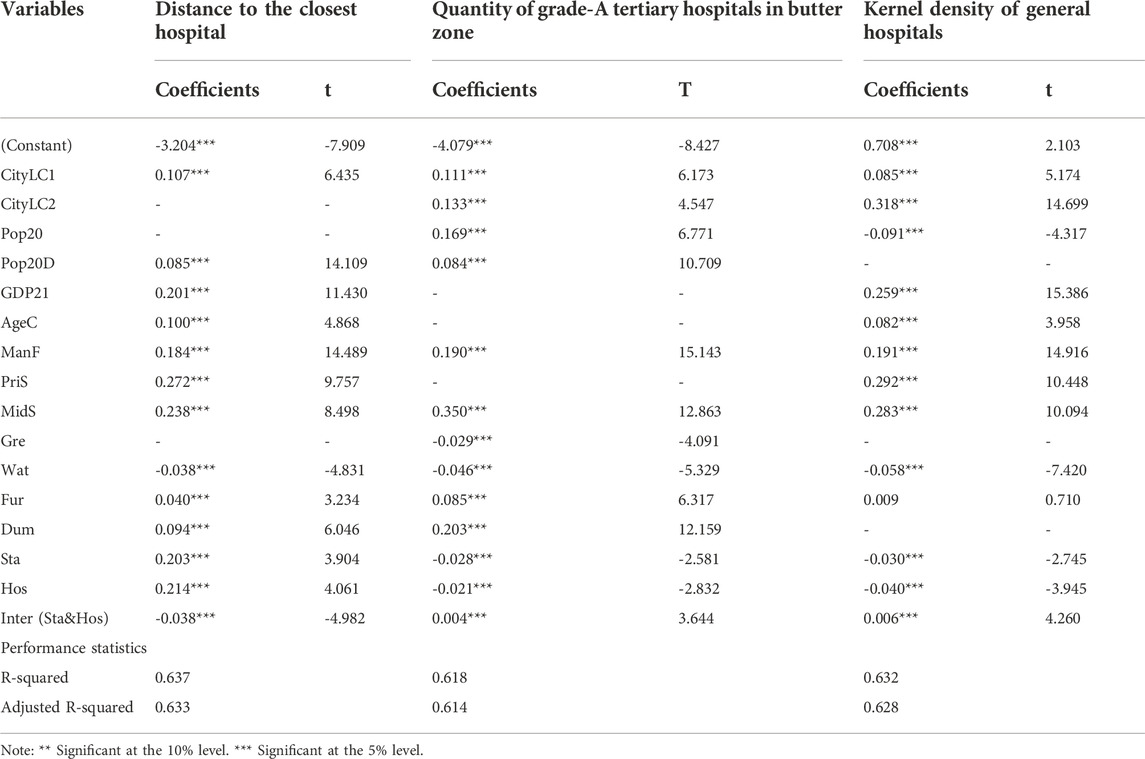
TABLE 6. Robust test (N = 1,079).
The study regressed the linear regression case with significant spatial interactions using a geographically weighted model, yielding the statistics presented in Table 7.
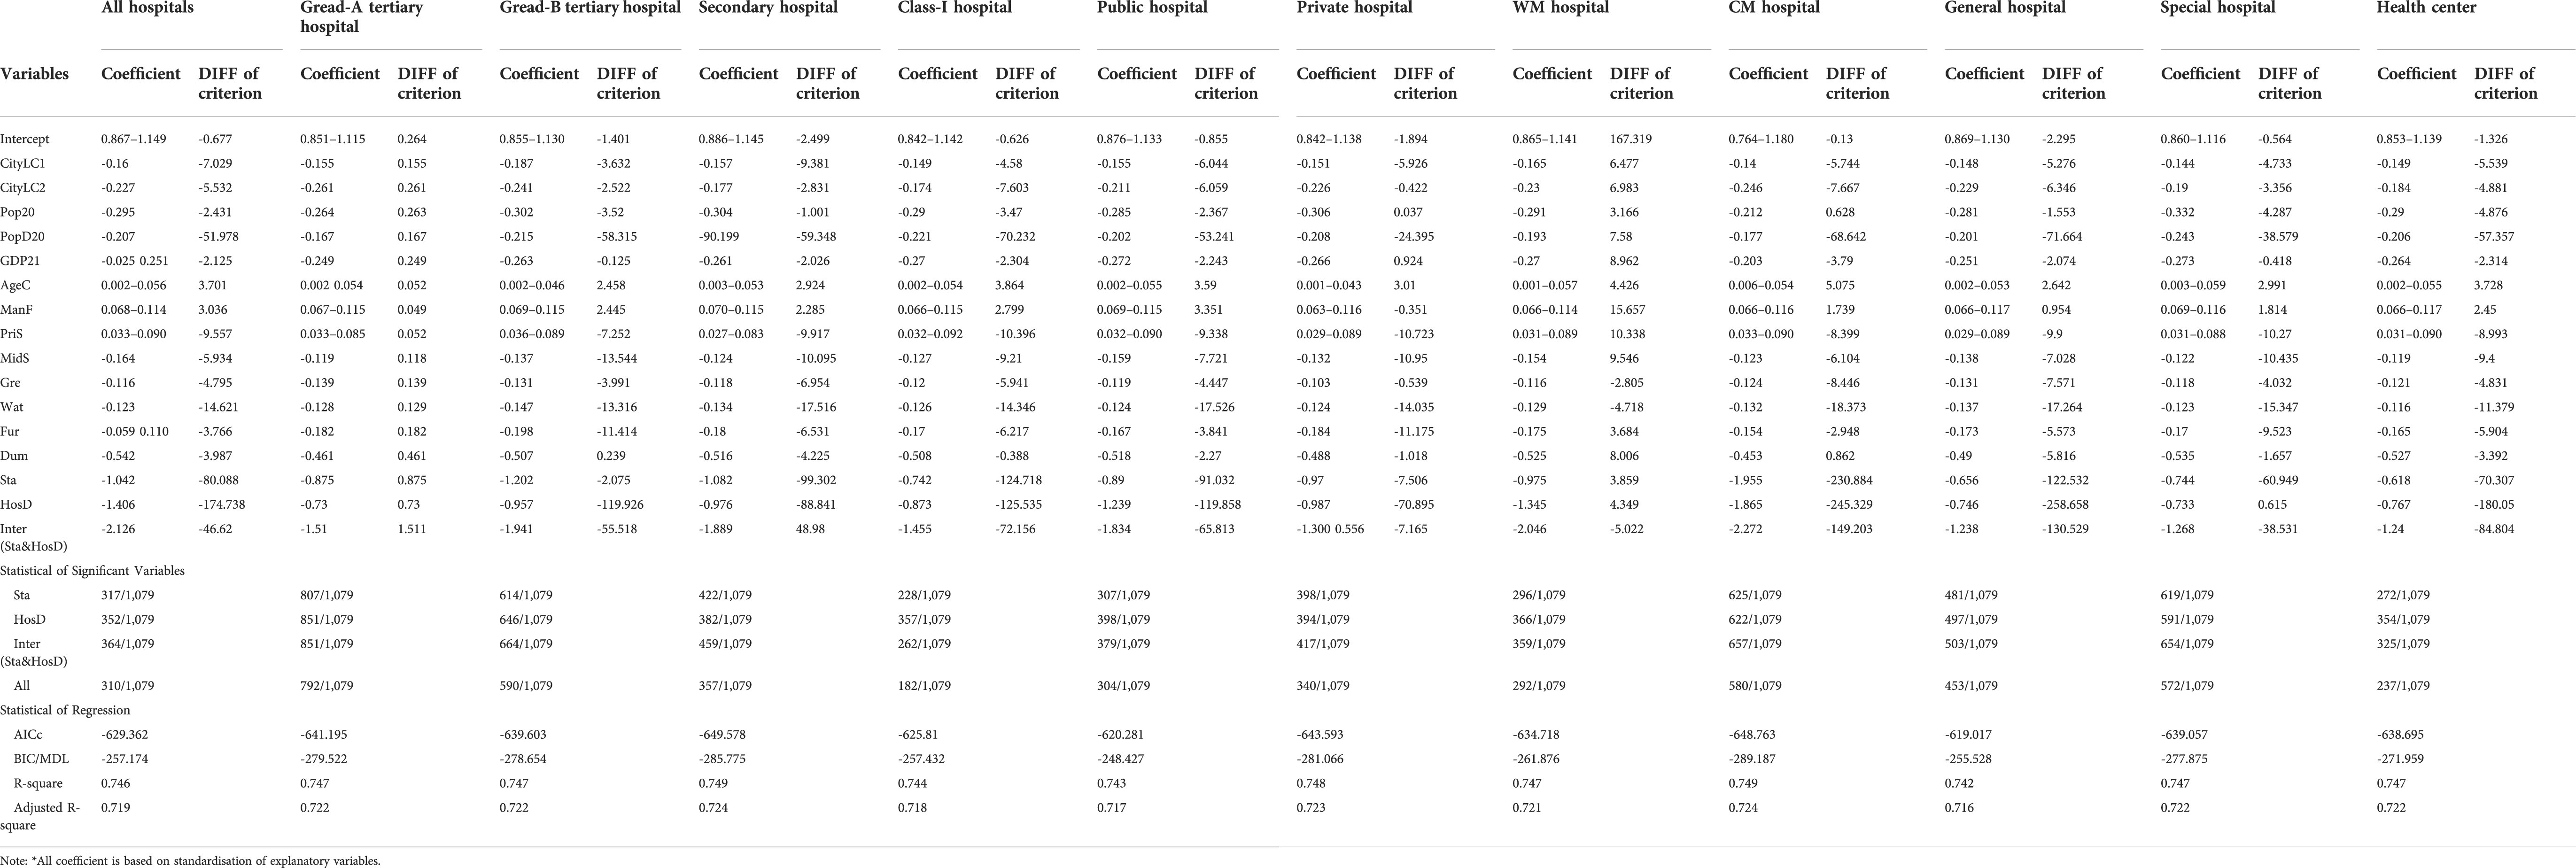
TABLE 7. Results of the geographically weighted regression analysis based on distance (N = 1,079).
The study compiles the spatial interaction effects of residential proximate hospitals and rail stations in Table 7. When all the impact variables are significant in an interactive regression function, the highest explained sample rate of 73.4% (792/1,079) was found for the regression model of the interaction between grade-A tertiary hospital distance and rail station distance with a positive spatial variance value. The next highest explained sample rates of 61.5% (590/1,079) was found for the regression model of the interaction between grade-B tertiary hospital distance and rail station distance with a negative spatial variance value. The third explained sample rates is 53.8% (580/1,079) for the interaction between distance to CM hospitals and distance to rail stations, with negative values of spatial variance. Fourth is 53.0% (572/1,079) for the interaction between distance to private hospitals and distance to rail stations, with negative values of spatial variance. Except for the spatial variances for secondary hospitals, which were positive, all other interaction regression equations had significance below 50% and negative spatial variances.
Table 8 shows the spatial relationship between the quantity of hospitals and the proximate rail station. Although it only has the explained sample rates of 14.7% (159/1,079) and a negative spatial variance value, the interaction regression model between medical centres and rail stations within the residential neighbourhood has the greatest explained sample rates of all the interaction regression equations. The explained sample rates for the other interaction regression models are even lower.
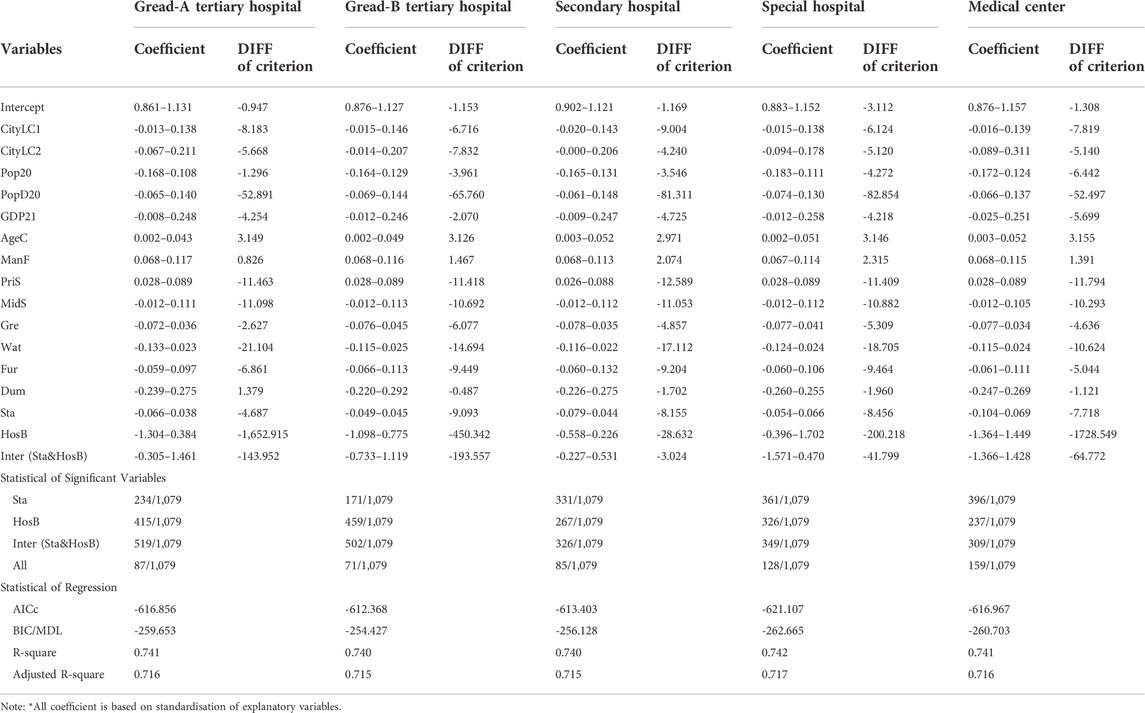
TABLE 8. Results of the geographically weighted regression analysis based on quantity (N = 1,079).
Table 9 displays the spatial coefficients and variance of the interactive function between the distance to the proximate rail stations and the hospital kernel density located in the residential area. Similar to the regression interaction model for the quantity of hospitals, the explained sample rates for each interaction model are relatively low, with the highest explained sample rates being 17.1% (184/1,079) for the interaction model for the density values of rail stations and general hospitals in the area, with a negative spatial variance value. The table also contains the proofs of the interaction regression models for the remaining categories.
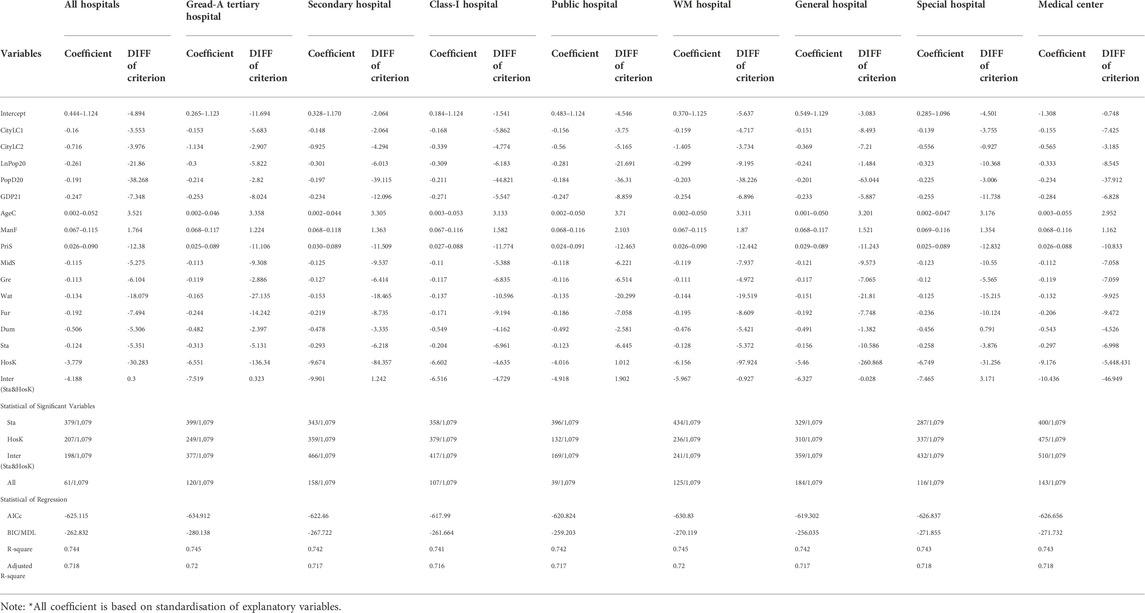
TABLE 9. Results of the geographically weighted regression analysis based on density (N = 1,079).
In the linear regression model (Table 3), the results of a city-wide statistics analysis led to the investigation of the following variables that affect the correlation of housing prices. Variables of environmental location are location of residence (inside Second Ring Road or Third Ring Road), the quantity of population, the density of population and the GDP level. Variables of self-characteristics are the age of residence, high-quality primary and secondary school and property management fee. Variables of facilities accessibility are rail accessibility (moderator variable), green space accessibility, main water source accessibility, funeral facilities accessibility and dump area accessibility. The variables that do not affect housing prices include the following. For self-characteristic variables, they are the residence containing commercial housing or housing placement, the residence with a high-rise building, the density of building and greening rate. For facilities accessibility variables, they are large shopping malls accessibility, scenic spots accessibility, factories accessibility and gas station accessibility. Of these significant variables, variables of environmental location and self-characteristic are both positively correlated with housing prices. All the facilities accessibility variables, except for the funeral facilities variable and the dump areas variable, express a positive correlation between facilities accessibility and housing prices. This result is not much different from the results of previous related studies and can be understood in the context of people’s life experience.
On the basis of the results of the hospital accessibility regression model (Table 4) and the interaction regression model statistics (Table 5) with rail accessibility, a discussion will be developed regarding the influence of hospital accessibility on housing prices and that of accessibility interactions on housing prices. The discussion in the section on interaction studies will be divided into two: a linear regression section and a spatial regression section. Discussion of the former will be categorised in terms of hospital type and accessibility evaluation. In the spatial regression model discussion section, sample models where the interaction is generally spatially significant and stable will be discussed and analysed in a targeted manner.
In the results of the model measuring residential accessibility by distance to the proximate hospital (Table 4–5), there is a positive value-added orientation of unclassified proximate hospital accessibility to housing prices, and there is a reciprocal moderating influence on housing prices with the accessibility of the proximate rail station. The greater the distance to the hospital, the smaller the influence of medical accessibility on housing prices. This suggests a spatially positive linear correlation between the perception of medical proximity and accessibility. Additionally, from a city-wide perspective, people’s preference for the proximate hospital can be interpreted as a spatially substitutable effect of rail for transporting their medical needs. In other words, people will choose rail to get to the hospital due to its accessibility, and this preference for accessibility will be reflected in the price of housing.
People’s preference for medical accessibility when purchasing a residence does not result in different outcomes based on the hospital’s degree. People can access the proximate level of the hospital via rail, so the influence of hospital distance on houses also changes with the distance from the rail station to the residence and vice versa, that is, the distance from the proximate rail station has a different influence on the price of houses located at different levels of proximity to hospitals. The influence of proximity to the proximate rail station on residence values at varying distances from the hospital varies.
In the case of residential proximity to a public hospital, the convenience added by the public hospital is offset by its equally negative effects, so there is no direct proximity effect of the public hospital on housing prices. These negative factors may include the noise, the mixed traffic and the psychological rejection of hospitals in the minds of residents around public hospitals. Given that public hospitals encompass several degrees, including grade-A tertiary, grade-B tertiary, secondary and class-I hospitals, the findings for public hospitals as a whole are presented here. Although grade-A tertiary hospitals are public hospitals, their positive influence outweighs the negative influence; hence, the overall presentation of grade-A tertiary hospitals remains positively connected with the influence on housing prices. By contrast, other tiers of public hospitals fail to cancel the negative consequences by beneficial influences. As a result, the overall data results for public hospitals were distinct from those of grade-A tertiary hospitals. Furthermore, the proximity of the proximate public hospital to the housing stock can somewhat mitigate the reliance of the housing stock on rail and, with the accessibility of rail, can change the price influence of the proximate public hospital from a positive to a negative. Firstly, it is understandable that when no hospitals are nearby, people will demand rail access to hospitals, thereby increasing the reliance of houses on rail stations. Secondly, when houses are in close proximity to a rail station, the negative price influence of hospital proximity increases as people from other areas choose to travel via the nearby rail station, perhaps due to the need to travel to a hospital in close proximity to the residence. This makes the residence’s surroundings susceptible to the combined noise of the nearby rail station and hospital. These are extremely undesirable environmental factors, so prices will naturally decrease. Private hospitals are not subject to the same limitations as public hospitals. Given that the negative influence of hospitals is due to the flow of people and psychological factors, private hospitals are generally not the first choice for people in China to visit, greatly reducing the negative influence resulting from the flow of people in private hospitals. Secondly, people dislike hospitals from the psychological factor, mainly because they dislike the inner feelings of life, death and illness that hospitals bring. Generally, the main place to experience life, death and illness in China remains public hospitals, so the negative influence of private hospitals is much less than that of public hospitals, which have more of a role of auxiliary medical support. The statistics conclude that people travel by rail to private hospitals and that the distance from the residence to the proximate private hospital lowers the price of housing because private hospitals do not have the negative life influence from public hospitals’ high demand.
When hospital types are separated by Chinese and Western medicine (WM), these distinctions do not produce distinct outcomes due to hospital type. Similar to hospital categorisation, the positive price markup for housing decreases as the distance between the hospital and the residence increases, regardless of the type of hospital. In addition, the demand for proximate Chinese or Western hospitals can be met by rail, so the influence of hospital distance on housing is amplified by the distance between the rail station and the residence.
A significant correlation is found between the proximity to the proximate speciality hospital and medical centre and housing prices, and a reciprocal moderating effect exists between the distance to the proximate special hospital and the influence of rail stations on housing prices. In essence, the reasons for both outcomes are the same as those for private hospitals, namely, the urgent need for medical coverage, and the influence on housing prices is a combination of the direct influence of proximity and the moderating effect of rail. However, a significant reciprocal moderating effect is found between the proximate rail station and the proximate hospital. This indicates that the proximity of the general hospital has some negative effects on the residential neighbourhood, thus offsetting the premiums associated with the general hospital’s accessibility. Owing to the hospital’s comprehensive nature, these negative influences may include the possibility of high levels of noise, traffic congestion, mixed traffic and psychological rejection of people. Their fundamental characteristics are comparable to those of public hospitals.
In the regression model of hospital accessibility based on the quantity of hospitals in the residential neighbourhood (Table 4–5), the results of the study statistics for hospitals not classified indicate that when hospitals are not classified for regression fitting, the presence of a large number of medical centres, low-degree hospitals or hospitals where people do not frequently seek services renders this hospital accessibility evaluation criterion insufficient to fully reflect people’s needs. The criterion only partially reflects this trend in hospital demand. Consequently, when the impact on housing prices is quantified on a scale based on the quantity of hospitals within 900 m of a residence, only marginal significant results are observed. Additionally, unclassified hospitals may have a moderating effect on rail station proximity, thereby reducing the extent to which they increase housing prices.
When hospitals are targeted and graded, a positive correlation is found between the quantity of hospitals at each degree and the housing prices within the proximate average distance to hospitals of varying degrees. The degree to which this positive correlation change is greatest in the presence or absence of the first hospital, indicates that hospitals have a significant marginal influence on housing prices. Simultaneously, the quantity of hospitals within an average distance of the proximate hospital and the distance between the residence and the proximate rail station has a reciprocal moderating influence on housing prices. This moderating effect can be explained in two ways. First, the quantity of hospitals in the immediate residential area already meets the need to some extent, thereby reducing the need for rail access to hospitals and reducing the influence of housing prices on rail accessibility. Second, no hospitals are present in the immediate residential area, but the need for rail access to hospitals remains because rail accessibility shares some of the need for hospital accessibility. Thus, there is an interaction term significant for the influence on housing prices.
Possible explanations for the insignificance of public hospitals include the presence of some of these medical centres and their low degree, rendering them neither routinely nor interactively significant in relation to rail. It may be able to moderate it in an interactive manner with the proximity of the rail stations, suggesting that the more alternatives people have for medical services, the less dependent their housing prices will be on rail accessibility. Private hospitals are not in the same position as public hospitals. The presence of private hospitals, due to their necessity to meet market demand, makes the number of hospitals in close proximity to residences provide an additional gain in value for medical care, showing a positive correlation between the number of hospitals in the area and housing prices. Similar to public hospitals, housing price dependence on rail accessibility decreases as the quantity of private hospitals increases.
As with type, the fact that WM hospitals encompass medical centres and the majority of lower-degree hospitals renders them insignificant in terms of the pattern. In relation to the distance of the rail stations, however, the quantity of options within its buffer zone can have a moderating effect, that is, the greater the quantity of options for WH, the lower the dependence on the rail stations. By contrast, CM hospitals, are not as highly valued by residents as their Western counterparts, as evidenced by the fact that they have a significant influence on housing prices. The non-essential modern medical demands and functional orientation of health care in CM hospitals provide an additional medical benefit. Consequently, the quantity of CM hospitals within the residential buffer zone is positively correlated with housing prices. In addition, a moderating effect appears to be associated with rail transport, suggesting that people use rail transport to travel to different CM hospitals, and that the greater the quantity of CM hospitals in the neighbourhood, the weaker the impact of distance change to the rail stations on housing prices.
Among the attribute-specific differences, the influence of general hospitals on housing price is marginally significant. However, a moderating effect is found in terms of distance from rail stations which is a very intriguing point to consider. Although general hospitals can provide strong medical services, the negative aspects of their strong services, such as congestion, noise, mixed traffic and psychological rejection, make the quantity of general hospitals in the buffer zone absolutely insignificant in terms of their hospital convenience, which has no positive additive influence on housing prices. If there are numerous general hospitals in the buffer zone, the approximate functional overlap between them due to the completeness of medical services precludes meeting the absolute significance criteria for influencing housing prices. In the interaction regression model, the reliance on general hospital access is generally such that a portion of the population must choose rail. In the vast majority of instances, the interaction term between the distance to the proximate rail station and the quantity of hospitals within the residential buffer zone will be significant, as indicated by the fact that the further a residence is from the rail station, the more dependent its value is on the quantity of hospitals within the buffer zone. In buffer zones with more general hospitals, house price premiums are likely to be less affected by rail accessibility.
For the quantity of special hospitals and medical centres in the respective residential buffer zones, the complementary and additive functions of their positioning in the healthcare system enable them to have a direct positive additive influence on housing prices, similar to CM hospitals, and to interact significantly with the distance to the proximate rail station. In other words, an interaction between the accessibility of rail and the quantity of special hospitals and medical centres in terms of their influence on housing prices.
In the density-based hospital accessibility evaluation system (Table 4–5), the results of the overall hospital density statistics illustrate the overall hospital density of the city of Fuzhou, which, when not categorised, has a premium added to residence. Differences in the overall healthcare system can have an influence on housing price appreciation when the proximity of the proximate hospital and the quantity of hospitals in the vicinity of a residence are the same. Where the overall medical system is more accessible, the influence of rail on housing prices is reduced. This can be interpreted as a reduction in the reliance on rail to access hospitals, which can be avoided in areas with better access to health services.
When degrees are developed for the level of hospital and the intensity of medical care is graded, the health care system of hospitals of all degrees can be favourably connected with housing prices. This indicates that the intensity of the healthcare system provides a positive price premium for housing, which is understood by most people. However, among the different levels of hospital density, all degrees of hospitals are able to interact with rail accessibility to moderate the effect on housing prices. However, a slight difference is perhaps observed in the reasons why the density of tertiary hospitals (grade-A and B), secondary hospitals and class-I hospitals can have a moderating influence on housing prices in relation to rail accessibility. The moderating effect of the density of tertiary hospitals (grade-A and B) is because areas with a low density of such hospitals are accessed by rail, while the density of class-I hospitals and secondary hospitals moderates the influence of rail on housing prices because they are more numerous and widely distributed. When people demand low-degree hospitals, they can access them by other, shorter means of transport, thus partially diluting the reliance on rail demand and making rail convenience less of an additive to housing prices.
The urban concentration of public and private hospitals can have a positive correlation with housing prices. This is largely in line with expectations and is typical of the influence of service amenities on housing prices. A similar interaction is observed between hospital density and rail accessibility in the regulation of housing prices for public and private hospitals. As a result, the density of both spaces tends to reduce the extent to which residence price is affected by rail stations.
Similar to the nature categorisation, the distribution density of WM and CM hospitals is positively correlated with housing prices from a type standpoint. Again, rail accessibility interacts with WM and CM hospitals on housing prices. In essence, the higher the density of WM or CM hospitals in a residential neighbourhood, the less the reliance on rail stations.
In the scope categorisation, the density of the distribution of general hospitals, special hospitals and medical centres has a positive correlation with housing prices, which is moderated by the proximity of houses to rail station. This demonstrates the relationship between the number of hospitals and the housing prices, irrespective of the scopes of the hospitals that offer residents hospital accessibility. This could be interpreted as a reduction in reliance on rail due to the accessibility of hospitals or as an increase in reliance on rail accessibility to hospitals due to the lack of hospital density in the area and the necessity of meeting medical needs. Conversely, the negative effects associated with high medical intensity, regardless of the hospital’s scope, can be negatively correlated with housing prices when residences are closer to rail stations, consistent with the characteristics of public and WM hospitals.
The study confirms that the regression model of hospital accessibility (Table 6–8), based on the spatial distance to the proximate grade-A tertiary hospitals, fits better than the linear model (Adjusted R-square = 0.722) to the greatest extent possible. The geographic heterogeneity in the extent to which residential sample prices are spatially moderated by hospital accessibility and rail accessibility is explained. The moderating effect expressed by this spatial regression model demonstrates the explanatory rate of the sample, the spatial stability and the spatial geographical distribution of the explained sample, which is not captured by the linear regression model (Figure 3). In the geospatial distribution figure, the lighter the colour of the explained residential sample, the smaller the coefficient of the interaction term of its model and the weaker the mutual moderating effect of hospital and rail accessibility (distance from the residence to the proximate grade-A tertiary hospital) on the influence of housing prices; whereas the grey residential sample indicates that the spatial coefficients cannot be resolved by this regression function.
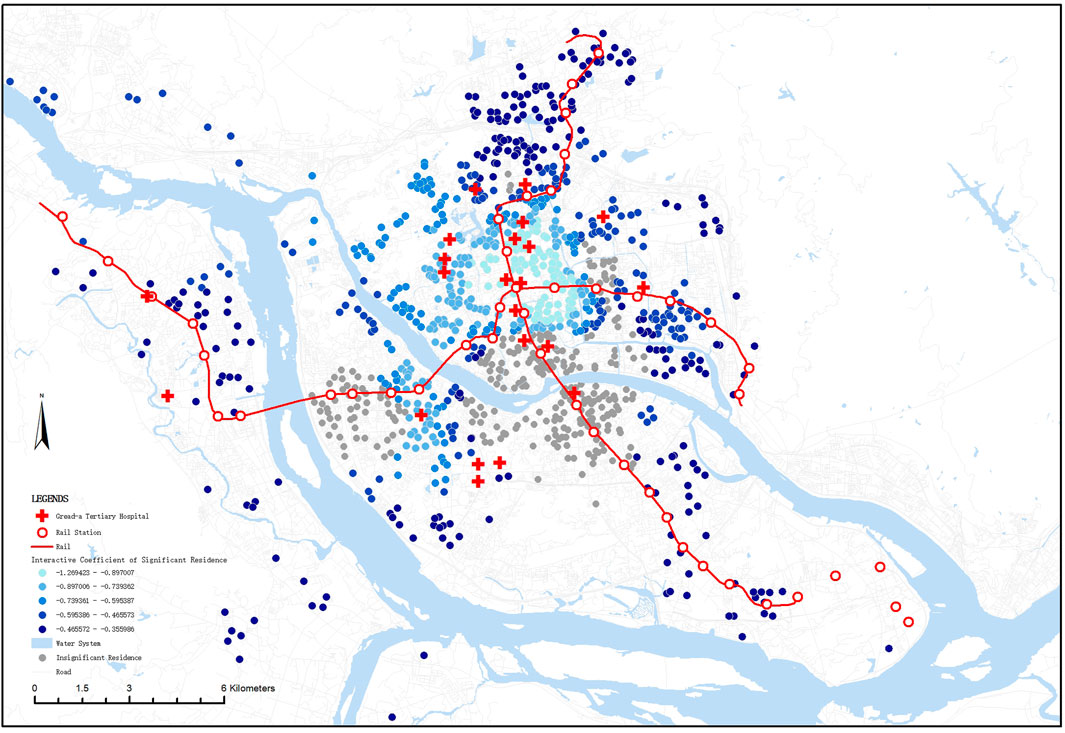
FIGURE 3. Geospatial distribution of interaction samples.
The subsequent paragraphs will discuss and analyse the reasons for the applicability of the aforementioned models and their explanation of the sample’s geospatial distribution. Although other spatial interaction regression models can also reflect the influence of hospital and rail accessibility on housing prices to a certain extent and can compensate for other perspectives on hospital accessibility that are not captured by spatial distance scales, their explained sample rates are relatively low and the majority of interactions are spatially heterogeneous. In other words, the strength of the interactions cannot be summarised consistently as geographic space changes.
The excellent regression performance of the linear model, the linear interaction regression model, and the spatial interaction regression model for the distance to a grade-A tertiary hospital as a metric of residential hospital accessibility demonstrate its reliability. The reason is that in real life, the first choice for Chinese citizens for daily medical treatment is often grade-A tertiary hospitals, which often have a certain brand effect. As a Chinese saying goes: ‘no need to consult for minor illnesses, and no need to see a doctor for a big one as well’. When most people need medical treatment, they will always habitually go to the proximate grade-A tertiary hospital, and most people will not consider hospital choices specific to their condition. This explains why the presence of a second hospital has no influence on the marginal effect of the real estate price when evaluating the quantity of hospitals’ accessibility. Several key grade-A tertiary hospitals in the city centre of Fuzhou are simultaneously linked by passenger rail transit lines. When suburban houses are far from their own proximate grade-A tertiary hospital but close to a rail station, city dwellers typically choose rail as a quick and comfortable way to reach the city centre for medical care. Therefore, both the regression model for the distance to the proximate grade-A tertiary hospital and the regression interaction regression model has a high degree of general applicability. In addition, these innate understandings of grade-A tertiary hospitals and rail render the interactions underlying latent housing price models extremely spatially stable.
The discussion of the interpretation of the spatial interaction regression model will be divided into two parts: the significance causes and the interaction’s strength. The significance of the sample implies that the prices of the residential sample conform to the pattern revealed by the regression model function. To some extent, housing prices are affected by the interaction moderation formed by their distance from the proximate grade-A tertiary hospital and the proximate rail station, the specific effects of which were discussed in the hospital distance section of the linear regression.
Furthermore, the presence of a small sample of insignificant residential interactions in the model can be explained by several reasons. 1) The proximity of residences to a grade-A tertiary hospital does not have a citywide core status and therefore does not attract other people to the residential proximity of the grade-A tertiary hospital via rail, avoiding the confusing and noisy crowd and poor psychological perceptions associated with the proximity of a grade-A tertiary hospital and a rail station at the same time, thereby preventing a downward trend in housing prices. 2) There is a reliable grade-A tertiary hospital in the immediate area, and the commute to this hospital does not rely on a rail at all. 3) Other, more significant housing prices influencing variables in the residential area were omitted from the study, thereby weakening the interaction between the grade-A tertiary hospital and rail.
The strength of the interaction and the geospatial distribution characteristics are described as follows. Although the presence of grade-A tertiary hospitals and rail stations in the proximity to housing does have a hurtful influence on housing prices, the distance of the negative influence will be reduced, and the extent to which housing prices will fall as a result of the negative influence will be less. Conversely, the weaker the interaction, the greater the dependence on the accessibility of grade-A tertiary hospitals and rail stations. Therefore, the geospatial distribution of the interaction’s strength can be summarised as follows: the closer the grade-A tertiary hospital to the residence and the closer the residence is to the rail station, the weaker the interaction, and vice versa.
The final study was based on a spatial interaction regression model of residential proximate grade-A tertiary hospital and rail station distance (Table 6) with a randomly drawn image of the functional characteristics of a significant sample (Figure 4) to analyse the strength of the interaction effect and the characteristics of the pattern of change. The graph of the function for this sample indicates that when all other factors influencing housing prices are held constant, housing prices decrease with the decrease in spatial straight-line distance from the rail station when the residence is less than 550 m from the proximate grade-A tertiary hospital, and the reduction is greater the closer the residence is to the grade-A tertiary hospital. Similarly, when houses are less than 400 m from the proximate rail station, the price of houses decreases as the straight-line distance to the grade-A tertiary hospital decreases, and more so as the distance to the rail station decreases. When either the distance to the proximate grade-A tertiary hospital or rail station is 550 or 400 m, the other distance has no influence on housing prices, regardless of how it changes. When the distance to a grade-A tertiary hospital exceeds 550 m or the distance to a rail station exceeds 400 m, the other accessibility variable will have a positive influence on housing prices, and as the distance increases, housing prices will decrease. The distances of 550 m for a grade-A tertiary hospital and 400 m for a rail station can be interpreted as the distances at which people will accept a change of transport mode to reach the hospital by rail. If the distance is less than these, people will not be able to reach the hospital by rail, and if it is greater, they will not perceive the area as convenient. Similarly, when houses are 550 m from a grade-A tertiary hospital, residents are less reliant on the additional accessibility convenience of rail. Therefore, changes in rail station distance no longer affect housing prices. When the distance to the grade-A tertiary hospital is less than this, however, people from other areas will travel by rail to the grade-A tertiary hospital in the vicinity of the residence, and the traffic noise and congestion caused by the rail station become a factor in reducing the housing prices. Concurrently, the inconvenience of being 550 m away from the proximate grade-A tertiary hospital encourages people to travel to a grade-A tertiary hospital elsewhere by rail, thereby making the accessibility of the rail station a positive price variable.
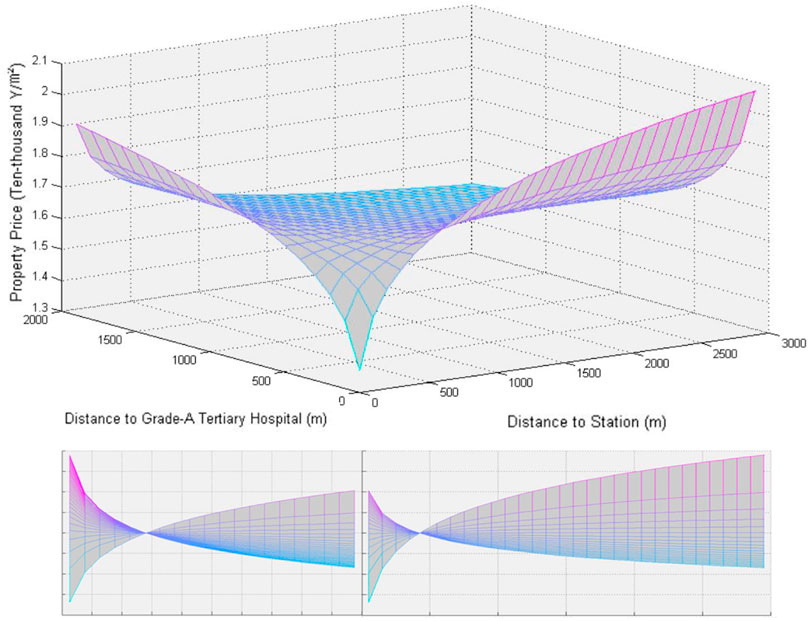
FIGURE 4. Spatial interactive regression model of housing prices.
This study confirmed that the variables influencing housing prices included a wide range of factors, including regional context, individual characteristics and facilities accessibility. The study’s findings indicate that different variables exert varying degrees of influence and maintain continuity with prior research.
Regarding the amenity accessibility variables of interest, rail station accessibility and hospital accessibility have a significant influence on housing prices. The level of significance of the performance of the hospital accessibility variables on housing prices was found to be similar for different categories and different measures, and the overall analysis is consistent with the observed situation.
The Euclidean distance to the proximate grade-A tertiary hospital was used as a measure of hospital accessibility when analysing the interaction between hospital and rail accessibility on housing prices regulation. The interaction regression model had the highest explained sample rates and spatial stability. The study compared spatial interaction regression models from different hospital categorisation perspectives and accessibility perspectives and discovered that not all models had the same number of explained sample rates, heterogeneity of interactions, and spatial distribution patterns. The model that could explain sample prevalence and stability to the greatest extent was selected for detailed coefficient analysis and interpretation.
The existence of interactions indicates that the influence of hospital and rail accessibility on housing prices is not constant. The influence of hospital accessibility on housing prices with differing rail accessibility is independent of all other variables (control variables). Rail accessibility has a different influence on housing prices with varying hospital accessibility. Using an image of the housing prices-relationship function, the study examined the reliance of residents on grade-A tertiary hospitals and rail station facilities.
Lastly, the distribution of the interaction between the city’s grade-A tertiary hospitals and rail stations is plotted based on the strength of the model interaction (Figure 5). This predictive map for the city-wide interaction is an accurate representation of the geospatial distribution characteristics of the interaction in Fuzhou, and the interaction strength for each region can be determined by consulting the legend’s coefficients. This distribution can be used to comprehend the regional strength of the interaction as well as the spatial distribution of its regional extent.
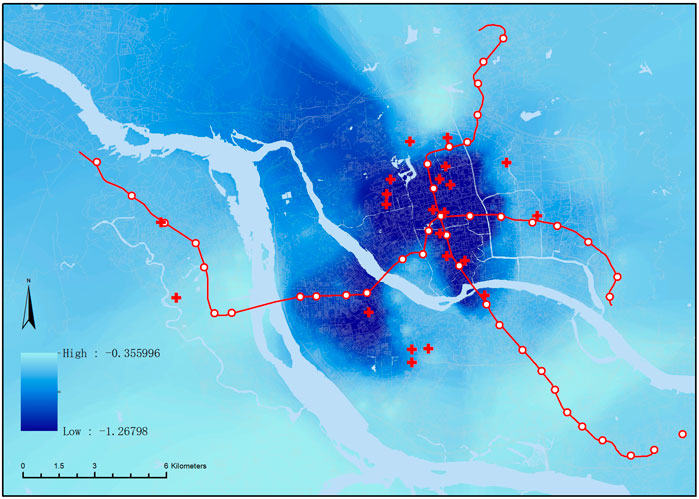
FIGURE 5. Interaction strength distribution.
The findings of this study can be utilised by citizens to inform their house purchase decisions. For purchasers with a significant medical need for a residence, purchasing a residence with a medical package tailored to their specific medical requirements is possible. As the influence of different hospitals on housing prices varies, investing excessively in high-end hospitals, public hospitals, WM hospitals or general hospitals is not needed. In addition, the study discovered that when housebuyers consider hospital and rail accessibility, the straight-line distance to the proximate venue is the most effective reference point. Therefore, when people purchase a residence, they typically only need to consider the proximate hospital’s spatial distance. Lastly, a price-moderating relationship is observed between the accessibility of grade-A tertiary hospitals and the accessibility of rail. Therefore, housebuyers who combine the need for medical care with the need for rail can purchase houses in appropriate areas based on the geospatial distribution of the interactions in the findings.
Using the study’s findings, city planners can modify the urban distribution density of public facilities such as rail and grade-A tertiary hospitals, as well as their location in relation to residential areas. By doing so, they can better regulate the stability of urban housing prices, improve regional coordination and increase the overall effectiveness of hospitals and per capita access to a hospital.
This study’s process of exploring variables from multiple perspectives can be used by future scholars and researchers to determine the optimal perspective for measuring model variables. A precise measurement perspective will maximise the reduction of covariance, increase the significance of variables and enhance the model’s fit, allowing researchers to precisely identify the core reference factors and uncover the objective patterns underlying them.
In the process of the study, the quantity of samples is insufficient and the angle of variable selection may still be inadequate, so some covariates are integrated into the present variables, resulting in an inadequate fit of the equation. Faced with such issues, in the future, the quantity of statistics sources is hoped to be expanded and the statistics’ precision can be enhanced when variables are extracted.
In the case of hospital accessibility, a degree of inadequacy is identified in evaluating accessibility based on the Euclidean distance from the residence to the proximate hospital and rail station. This is because spatial distance does not fully express the accessibility of houses to different facilities and does not reflect the detailed variation in the influence on housing prices based on the distance measure, which is only linear at a macro level. Furthermore, the categorisation of hospitals can only be based on a fixed hospital unit standard, which is limited by the information available and therefore does not allow for a more precise evaluation of the distance to demand based on the proximate specialist hospital department. This makes our hospital categorisation subject to the problem of ignoring functional overlap.
In addition, a more rational evaluation model for a hospital in the buffer zone is required for all hospitals in the nearby residential area, due in part to the duplication of functions between hospitals. The model must be based on the quantity of hospitals and the ability to calculate comprehensive medical functions. Additionally, the quantity of hospitals in the buffer zone is the same, but the specific accessibility differences are not reflected, so a more accurate calculation process of accessibility in the buffer zone based on the quantity of hospitals is required.
In the design of the study on hospital kernel density, calculating a comprehensive medical kernel density system evaluation with area-weighted weights based on the frequency of demand for different hospital categories and age bracket preferences as a whole in their everyday lives was not possible due to a lack of statistics and information. Consequently, the evaluation of the medical system can only be conducted on the basis of distinct global and categorical categories, as well as an assessment of the moderating effect of hospitals on housing prices and rail accessibility under distinct categories.
The models based on geographical heterogeneity as a starting point for ideas that validate empirical conclusions have not been validated consistently in geographical models based on other ideas. Owing to the limitations of the model concept, a limited interpretation of the conclusions is therefore possible.
The original contributions presented in the study are included in the article/supplementary material, further inquiries can be directed to the corresponding author.
KC, HL, SY and OS contributed to conception and design of the study. KC and YH organized the database. FC performed the statistical analysis. KC and SY wrote the first draft of the manuscript. KC, YH, SY, XH and YL wrote sections of the manuscript. All authors contributed to manuscript revision, read, and approved the submitted version.
This study was supported by the National Natural Science Foundation of China (No. 51808452) and the General Program of the Sichuan Federation of Social Science Associations (No. SC20B113).
Author XH was employed by Fujian Communications Planning and Design Institute CO.,Ltd.
The remaining authors declare that the research was conducted in the absence of any commercial or financial relationships that could be construed as a potential conflict of interest.
All claims expressed in this article are solely those of the authors and do not necessarily represent those of their affiliated organizations, or those of the publisher, the editors and the reviewers. Any product that may be evaluated in this article, or claim that may be made by its manufacturer, is not guaranteed or endorsed by the publisher.
Agostini, C., and Palmucci, G. A. (2008). The anticipated capitalisation effect of a new metro line on housing prices. Fisc. Stud. 29 (2), 233–256. doi:10.1111/j.1475-5890.2008.00074.x
Almosaind, M. A., Dueker, K. J., and Strathman, J. G. (1993). Light-rail transit stations and property values: A hedonic price approach. Washington, DC: Transportation Research Record.
Alonso, W. (1964). Location and land use. Cambridge, MA: publications of the Joint Center for Urban Studies of the Massachusetts Institute of Technology and Harvard University Press.
Bae, C., Jun, M. J., and Park, H. (2003). The impact of Seoul’s subway Line 5 on residential property values. Transp. policy 10 (2), 85–94. doi:10.1016/s0967-070x(02)00048-3
Bajic, V. (1983). The effects of a new subway line on housing prices in metropolitan toronto. Washington, DC: Urban Studies.
Banzhaf, S., and Farooque, O. (2012). Interjurisdictional housing prices and spatial amenities: Which measures of housing prices reflect local public goods? Cambridge, Massachusetts, United States: National Bureau of Economic Research, Inc.
Baumont, C., Ertur, C., and Le Gallo, J. (2003). Spatial analysis of employment and population density: The case of the agglomeration of dijon, 1999. Germany: University Library of Munich.
Benjamin, J. D., and Sirmans, G. S. (1996). Mass transportation, apartment rent and property values. J. Real Estate Res. 12 (1), 1–8. doi:10.1080/10835547.1996.12090830
Cao, K., Diao, M., and Wu, B. (2019). A big data–based geographically weighted regression model for public housing prices: A case study in Singapore. Ann. Am. Assoc. Geogr. 109, 173–186. doi:10.1080/24694452.2018.1470925
Cervero, R., and Landis, J. (1993). Assessing the impacts of urban rail transit on local real estate markets using quasi-experimental comparisons. Transp. Res. Part A Policy Pract. 27 (1), 13–22. doi:10.1016/0965-8564(93)90013-b
Dziauddin, M. F., Alvanides, S., and Powe, N. (2013). Estimating the effects of light rail transit (lrt) system on the property values in the klang valley, Malaysia: A hedonic house price approach. J. Teknol. 61 (1), 35–47. doi:10.11113/jt.v61.1620
Febrita, R. E., Alfiyatin, A. N., Taufiq, H., and Mahmudy, W. F. (2017). “Data-driven fuzzy rule extraction for housing price prediction in Malang, East Java,” in 2017 International Conference on Advanced Computer Science and Information Systems (ICACSIS), Bali, Indonesia, 28-29 October 2017. (Washington, DC: IEEE).
Gatzlaff, D. H., and Smith, M. T. (1993). The impact of the Miami metrorail on the value of residences near station locations. Land Econ. 69 (1), 54–66. doi:10.2307/3146278
Guo, J., Xia, T., and Li, J. (2016). Study on the spatial divergence of urban residential prices and the influencing factors. Statistics Decis. (08), 142–145. doi:10.13546/j.cnki.tjyjc.2016.08.039
Han, S., Ren, F., Wu, C., Chen, Y., Du, Q., and Ye, X. (2018). Using the tensorflow deep neural network to classify mainland China visitor behaviours in Hong Kong from check-in data. ISPRS Int. J. Geoinf. 7 (4), 158. doi:10.3390/ijgi7040158
Hao, Q., and Chen, J. (2007). Geospatial differences in distance to CBD, transport accessibility and residential prices in Shanghai. World Econ. Pap. 1 (01), 22–35. doi:10.3969/j.issn.0488-6364.2007.01.003
He, C., Zhen, W., Guo, H., Hu, S., Rui, Z., and Yang, Y. (2010). Driving forces analysis for residential housing price in beijing. Procedia Environ. Sci. 2 (1), 925–936. doi:10.1016/j.proenv.2010.10.104
Im, J., and Hong, S. H. (2018). Impact of a new subway line on housing values in Daegu, Korea: Distance from existing lines. Washington, DC: Urban Studies.
Jabbar, E. H. (2016). Willingness to pay for public park, waste disposal and wide roads. Hedonic Price Model. 5, 35–47.
Lan, F., Wu, Q., Zhou, T., and Da, H. (2018). Spatial effects of public service facilities accessibility on housing prices: A case study of xi’an, China. Sustainability 10 (12), 4503. doi:10.3390/su10124503
Lan, J., and Ye, Z. (2020). Factors affecting Shanghai housing prices. Front. Econ. Manag. Res. 1 (2), 59–62. doi:10.33969/twjournals.femr.2020.010214
Li, R., Gong, S., and Gao, Y. (2021). Accessibility of public service facilities in beijing and its impact on housing prices. Acta Sci. Nat. Univ. Pekin. 57 (05), 875–884.
Li, S., Chen, L., and Zhao, P. (2019). The impact of metro services on housing prices: A case study from beijing. Transportation 46 (4), 1291–1317. doi:10.1007/s11116-017-9834-7
Li, Y., Lang, H., Xu, W., Hui, W., and He, Z. (2013). Using GIS and Hedonic in the modelling of spatial variation of housing price in Xiamen city. IRSPSD. Int. 1 (4), 29–42. doi:10.14246/irspsd.1.4_29
Liu, L., Yu, H., Zhao, J., Wu, H., Peng, Z., and Wang, R. (2022). Multiscale effects of multimodal public facilities accessibility on housing prices based on mgwr: A case study of wuhan, China. ISPRS Int. J. Geoinf. 11 (1), 57. doi:10.3390/ijgi11010057
Liu, T., Hu, W., Song, Y., Zhang, A., and Cleveland, C. J. (2020). Exploring spillover effects of ecological lands: A spatial multilevel hedonic price model of the housing market in wuhan, China. Ecol. Econ. 170, 106568. doi:10.1016/j.ecolecon.2019.106568
Luo, X., Yue, B., Lin, A., and Chen, F. (2019). Impact of accessibility of public service facilities on housing price in central district of wuhan city: Based on analysis of tri-network transport system. Areal Res. Dev. 38 (02), 86–91+6.
McDonald, J. F., and Osuji, C. I. (1995). The effect of anticipated transportation improvement on residential land values. Regional Sci. Urban Econ. 25 (3), 261–278. doi:10.1016/0166-0462(94)02085-u
Peng, B., Shi, Y., Shan, Y., and Chen, D. (2015). The spatial impacts of class 3A comprehensive hospitals on peripheral residential property prices in Shanghai. Sci. Geogr. Sin. 35 (07), 860–866. doi:10.13249/j.cnki.sgs.2015.07.860
Peng, T-C., and Chiang, Y-H. (2015). The non-linearity of hospitals’ proximity on property prices: Experiences from Taipei, Taiwan. J. Prop. Res. 32 (4), 341–361. doi:10.1080/09599916.2015.1089923
Rohit, S., and Peter, N. (2018). Does urban rail increase land value in emerging cities? Value uplift from Bangalore metro. Transp. Res. Part A Policy Pract. 117, 70–86. doi:10.1016/j.tra.2018.08.020
Tan, R., He, Q., Zhou, K., and Xie, P. (2019). The effect of new metro stations on local land use and housing prices: The case of Wuhan, China. J. Transp. Geogr. 79, 102488. doi:10.1016/j.jtrangeo.2019.102488
Tan, th (2011). Neighborhood preferences of house buyers: The case of klang valley, Malaysia. Int. J. Hous. Mark. Analysis 4 (4), 58–69. doi:10.1108/17538271111111839
Tang, K., Li, Q., Lu, H., and Yu, P. (2020). Accessibility of public service facilities and its impact on housing prices. Geospatial Inf. 18 (02), 90–93+8+8.
Teng, S., Yan, J., and Zhou, S. (2014). Research on impact of urban rail transit on house price along the line: A case study on No. 1 line of Tianjin subway. Berlin Heidelberg: Springer.
Waddell, P., and Hoch, B. I. (1993). Residential property values in a multinodal urban area: New evidence on the implicit price of location. J. Real Estate Finance&Economics 7 (2), 117–141. doi:10.1007/BF01258322
Wang, F., and Gao, X. (2014). The transitional spatial pattern of housing prices in beijing: Factors and implications. IRSPSD. Int. 2 (3), 46–62. doi:10.14246/irspsd.2.3_46
Wang, L., and Liu, G. (2013). “Spatial variation analysis of the housing price in multi-center city: A case study in chongqing city, China,” in 2013 International Conference on Computational and Information Sciences: IEEE Computer Society, Shiyang, China, 21-23 June 2013, 450–453.
Wang, P-D., and Chen, M. (2019). The non-linear relationships of numeric factors on housing prices by using gam. J. Data Sci. 17 (1), 131–144. doi:10.6339/jds.201901_17(1).0006
Wu, W., Zhang, W., and Dong, G. (2013). Determinant of residential location choice in a transitional housing market: Evidence based on micro survey from Beijing. Habitat Int. 39, 16–24. doi:10.1016/j.habitatint.2012.10.008
Yang, L., Chau, K. W., Szeto, W. Y., Cui, X., and Wang, X. (2020). Accessibility to transit, by transit, and property prices: Spatially varying relationships. Transp. Res. Part D Transp. Environ. 85, 102387. doi:10.1016/j.trd.2020.102387
Yang, L., Chen, Y., Xu, N., Zhao, R., Chau, K. W., and Hong, S. (2020). Place-varying impacts of urban rail transit on property prices in Shenzhen, China: Insights for value capture. Sustain. Cities Soc. 58, 102140. doi:10.1016/j.scs.2020.102140
Yang, L., Liang, Y., He, B., Lu, Y., and Gou, Z. (2022). COVID-19 effects on property markets: The pandemic decreases the implicit price of metro accessibility. Tunn. Undergr. Space Technol. 125, 104528. doi:10.1016/j.tust.2022.104528
Yang, L., Wang, B., Zhou, J., and Wang, X. (2018). Walking accessibility and property prices. Transp. Res. part D Transp. Environ. 62, 551–562. doi:10.1016/j.trd.2018.04.001
Yang, L., Zhang, X., Hong, S., Lin, H., and Cheng, G. (2016). The impact of walking accessibility of public services on housing prices: Based on the cumulative opportunities measure. South China J. Econ. (1), 14. doi:10.19592/j.cnki.scje.2016.01.005
Yang, L., Zhou, J., Shyr, O. F., and Huo, D. (2019). Does bus accessibility affect property prices? Cities 84, 56–65. doi:10.1016/j.cities.2018.07.005
Zhang, X. (2014). An empirical study of the impact of metro station proximity on property value in the case of nanjing, China. Asian Dev. Policy Rev. 2, 61–71. doi:10.18488/journal.107.2014.24.61.71
Keywords: housing prices, spatial economics, geographical heterogeneity, facility accessibility, interaction
Citation: Chen K, Lin H, Cao F, Han Y, You S, Shyr O, Lu Y and Huang X (2022) Do hospital and rail accessibility have a consistent influence on housing prices? Empirical evidence from China. Front. Environ. Sci. 10:1044600. doi: 10.3389/fenvs.2022.1044600
Received: 14 September 2022; Accepted: 07 November 2022;
Published: 24 November 2022.
Edited by:
Jun Yang, Northeastern University, ChinaReviewed by:
Hao Zhu, Chengdu University of Technology, ChinaCopyright © 2022 Chen, Lin, Cao, Han, You, Shyr, Lu and Huang. This is an open-access article distributed under the terms of the Creative Commons Attribution License (CC BY). The use, distribution or reproduction in other forums is permitted, provided the original author(s) and the copyright owner(s) are credited and that the original publication in this journal is cited, in accordance with accepted academic practice. No use, distribution or reproduction is permitted which does not comply with these terms.
*Correspondence: Shuying You, c3lvdW9vQDE2My5jb20=
Disclaimer: All claims expressed in this article are solely those of the authors and do not necessarily represent those of their affiliated organizations, or those of the publisher, the editors and the reviewers. Any product that may be evaluated in this article or claim that may be made by its manufacturer is not guaranteed or endorsed by the publisher.
Research integrity at Frontiers
Learn more about the work of our research integrity team to safeguard the quality of each article we publish.