 Zhizhong Liu
 Guangyue Liu
 Ping Zhang2*†
- 1School of Finance and Trade, Liaoning University, Shenyang, China
- 2School of Economics and Management, Sanming University, Sanming, China
The pollution caused by foreign investment has become a serious concern of the host government and academia. Many studies have discussed much about the environmental impact of China’s OFDI in countries along the Belt and Road Initiative (BRI) region, but ignored the impact of the BRI itself on China’s OFDI. This study uses the Global Malmquist–Luenberger index to measure the green technology spillover of China’s OFDI from 2005 to 2018 and studies the impact of BRI on this spillover effect with the DID (difference-in-difference) method. The results show that (1) the BRI has significantly increased the green technology spillover of China’s OFDI in countries along the routes. The heterogeneity study shows that such an effect is significant in middle- or low-income countries with high institutional quality or poor environmental performance, but not obvious in other countries. (2) The BRI promotes green technology spillover through the mechanism of increasing R&D investment, improving the environmental system, and accelerating the flow of production factors. This study provides a useful reference for developing a greener OFDI and promoting the sustainable development of regional cooperation.
1 Introduction
OFDI (Outward Foreign Direct Investment) has not only economic impacts on host countries but also impacts their ecological environment. At the 26th session of the United Nations Framework Convention on Climate Change (UNFCCC) in November 2021, nearly 200 countries and regions signed the “Glasgow Climate Pact” and presented the goal of halving global CO2 emissions over the next decade. With the increasingly severe situation and the common awareness of green development, environmental pollution caused by foreign investment has become a great concern of host countries’ governments. In 2013, China proposed the Belt and Road Initiative (BRI, short for the Economic Belt of the Silk Road and the Maritime Silk Road of the 21st Century), which aims to establish a regional cooperation platform for relevant countries in bilateral or multilateral mechanisms, such as investment and policy coordination. Since the initiative was put forward and implemented, China’s investment in the region has grown rapidly, and by the end of 2021, China’s direct investment in 65 BRI countries had reached $160 billion. Under this background, some host countries started to worry about the spread of the so-called “pollution heaven” effect. Scholars also raised doubts about the environmental impact brought by the BRI (Harlan, 2021), and the FOE (Friends of the Earth) presented that Chinese firms in host countries carried out their investments ignoring the need for environmental impact assessments and damaged the local ecology through poor construction and operation. Hilton (2020) argued that the delivery of the BRI projects will prevent host countries from meeting their carbon reduction commitments and potentially lead to “catastrophic climate change.” Saha (2020) believed that the BRI contributed to emissions that will push global warming, and the Chinese policy of investments, with weak standards, mainly support coal or hydroelectric projects, which would cause damage to the local environment. Many other scholars hold similar views, and they argued that China is not only grabbing resources from countries along the routes but also taking the opportunity to transfer its “dirty industries” abroad, exacerbating the deterioration of the host country’s ecological environment (Ascensao et al., 2018).
The BRI has significantly changed the quantity and quality of China’s OFDI in terms of mode, location, and industry (Du and Zhang, 2018; Yu et al., 2019), but when referring to the BRI, existing studies always use it to divide the sample area and rarely consider the initiative itself as a worthy factor of attention. This study uses a classical difference-in-difference model to identify the effects of the BRI from the perspective of the green technology spillover. In this way, it empirically analyses the impact of the BRI on the green economic development of countries along the routes. The possible marginal contribution of this article is as follows: First, it uses the GML index to calculate the change in green technology of the host country with China’s OFDI input. This index can be used to represent the green technology spillover of China’s investment and measure the role of China in the green economic development of the host countries. Second, this study considers the BRI as a key policy and evaluates its influence on the green technology spillover effect with the difference-in-difference method. Third, this study constructs a threshold mode to study the heterogeneity of the spillover effect. It selects the per capita income, institutional quality, and environmental performance of the host country as threshold variables to identify the specific areas where the BRI has a significant impact. Finally, this study uses the mediation effect model to test the mechanism, and the results show that the BRI could promote the green technology spillover of OFDI by increasing R&D investment, improving the environmental system, and accelerating the flow of production factors. The results illustrate the positive significance of the BRI for China’s OFDI green technology spillover. As the current major policy of China, this initiative has made important contributions to environmental protection and green development in countries along the routes, and this conclusion hits back at the so-called theory of “China’s environmental threat”. Furthermore, the exploration of the influence mechanism will be conducive to further rational and effective use of China’s outward investment in the future.
The rest of this article is organized as follows: Section 2 is a review of existing literature and research hypothesis; Section 3 introduces the research methods and data source; Section 4 performs empirical regression and robustness tests; Section 5 discusses heterogeneity and mechanism of the effect; Section 6 summarizes the conclusions and proposes the corresponding policy suggestions.
2 Literature review and research hypothesis
There have always been great differences in research on the impact of FDI on the environment of host countries, which could be roughly divided into two classical hypotheses: the “pollution paradises hypothesis” and the “pollution halo hypothesis”. The former argues that developed countries will consciously preserve more high-tech and low-pollution industries on their own and move industries with opposite characteristics abroad. In this way, they could improve domestic environmental quality and reduce related governance costs. Different from the strict environmental standards and huge fines imposed by developed countries, developing countries (most of the countries along the Belt and Road are on this list) have not realized the importance of environmental protection, or even if they have recognized the problem, they would choose to prioritize economic development. In some cases, host governments would even voluntarily loosen related restrictions to engage in the so-called “race to the bottom”. Multinational enterprises in high-tech and low-pollution industries are forced by domestic pressures and seek reduced governance costs to gain higher profits, so they invest overseas to transfer these industries abroad, which in turn also transfer pollution and environmental damage to host countries (Walter and Ugelow, 1979; Eskeland and Harrison, 2003; Poelhekke and van der Ploeg, 2015; Hu et al., 2019). Many studies empirically support this view; they investigated the environmental impact of FDI on typical developing countries and found that FDI has a significant positive correlation with pollution emission and resource consumption of host countries (Zhu et al., 2016; Sarkodie and Strezov, 2018; Liu et al., 2020; Zhuang et al., 2021). In contrast, the pollution halo hypothesis argues that FDI could bring more advanced production technology and mature management experience to host developing countries. Through active learning or unconscious spillover, domestic enterprises can improve their energy efficiency and reduce pollution (Antweiler et al., 2001; Christmann and Taylor, 2001; Ahmad et al., 2021; Zhang et al., 2021). Empirical results show that FDI has significantly increased the host country’s energy utilization or reduced smog pollution (Mielnik and Goldemberg, 2002; Xie et al., 2020).
When talking about this issue, the researches mentioned earlier involve an important transmission mechanism, more or less, that is the technology spillover effect of FDI. The technology spillover effect of FDI has been widely studied and verified. This effect could work through channels such as labor turnover, demonstration effect, competition effect, reverse engineering, and “learning and watching” [(Blalock and Gertler, 2008); (Kokko, 1994)]. Multinational enterprises (MNEs) entering host markets would hire local workers, who are then exposed to advanced foreign technology and may transfer the technology to domestic enterprises when changing their workplace. To prevent technology leakage, MNEs tend to pay more wages, and to some extent, it promotes competition in the market (Urban, 2010). Another aspect of the promotion effect comes from the application of technology itself. Advanced technology and efficient management of MNEs make their products more competitive, and it also raises industry standards and changes consumer preferences in the host countries. To survive, domestic enterprises have to actively seek change, introduce more advanced production techniques that are often more environmentally friendly, and adopt higher standards, which use more efficient energy and reduce emissions of pollutants (Blackman and Wu, 1999).
To empirically evaluate the effect of China’s OFDI on green economic development along the routes, scholars have constructed a series of index systems to assess the level of green development in host countries, such as the green development index (GDI) or the Belt and Road green development index (BRGI) (Cheng and Ge, 2020; Jiang et al., 2021; Xue et al., 2021). Most of these studies gained positive conclusions, and they believe that investments from China promoted energy saving and emission reduction in participating countries and improved the institutional quality of the participating countries by strengthening cooperation (Zhang et al., 2020). Scholars generally take the quantity of OFDI as an explanatory or control variable to evaluate the impact on green development of host countries, especially in the energy and infrastructure sectors, but few pieces of literature associated the green economic progress of host countries with the quality of China’s OFDI, only attributed this improvement to the promotion of investors or the narrowing of institutional distance (Pao and Tsai, 2011; Dong et al., 2018; Lechner et al., 2018; Khan et al., 2021; Xie and Zhang, 2021).
From the abovementioned analysis, the existing results have laid a firm foundation for this study, but there are some shortcomings. Few scholars focus on the environmental effects of capital from specific countries, which could greatly affect the purpose of investment and its consequences (Hu et al., 2019). In addition, when studying the environmental impact of China’s OFDI in the context of the BRI, scholars have discussed many possible angles and transmission paths from various characteristics of investors and host countries but ignored the role of the initiative’s formulation and implementation. These are the gaps that this study tries to fill.
Since the BRI was formally proposed and implemented in 2013, China’s OFDI has improved significantly both in quantity and quality. By the end of 2021, China had established more than 10,000 overseas enterprises in countries along the Belt and Road, and their foreign direct investment reached $20.3 billion in 2021, up 1.7% from the previous year, accounting for 17.9% of the total flow in the same period; since the initiative was put forward, China’s direct investment in the region has reached $160 billion (data from the Commerce Department). On the other hand, China’s outward investment attaches great importance to harmonious economic and environmental growth and strives to help host countries achieve efficient, harmonious, and sustainable development. Ministries issued “Guidelines on Advancing the Belt and Road Initiative,” “The Belt and Road Cooperation Plan on Ecological and Environmental Protection,” and “Guidelines on Environmental Protection for Foreign Investment cooperation,” which clearly presented guidance and specific requirements on environmental protection for investment enterprises, encouraged them to use advanced green technology in production, and promoted the spread of green technology abroad. At the same time, relevant cooperation between China and the host countries has also been actively promoted. For example, in 2017, 29 countries jointly approved the Guidelines for Financing the Belt and Road Initiative, calling for the establishment of a stable and sustainable investment financing system. In 2019, China and the United Kingdom jointly launched the Belt and Road Green Investment Principles to ensure that BRI investment projects are environmentally friendly. In fact, China has created many typical cases of promoting green economic development in host countries, such as the Garissa photovoltaic power plant in Kenya, which was built through the Belt and Road concessional loan and put into operation in December 2019 and could reduce annual carbon dioxide emissions by 64,000 tons, and the Sirindhorn Dam floating photovoltaic project jointly built by China and Thailand was successfully connected to the grid in July 2021, reducing greenhouse gas emissions by 47,000 tons annually. These examples show that the BRI is not only a road to economic prosperity but also a road to green development. Based on this, the first hypothesis is proposed.
H1: The Belt and Road Initiative has significantly increased the green technology spillover of OFDI in countries along the routes.
The possible mechanisms of BRI on green technology spillover might be as follows: First, the BRI significantly promoted the growth of China’s greenfield outward investment; greenfield capital injected into host countries could share the R&D expenditure of the host country, so the ability and willingness of host countries to invest in R&D could be improved. On the other hand, abundant funds could expand the market of host countries and produce a scale effect, thus reducing the R&D cost per unit product, helping both the host governments and enterprises to spend more money on the R&D of environmentally friendly technologies. Second, the BRI has significantly improved the level of external investment and the ability to control the risk of Chinese enterprises, and the requirements on the environmental conditions and relevant institutions of the host countries are also increased accordingly. Therefore, to obtain more investment, the governments of the host countries must improve their environmental and institutional standards. Third, after the BRI was put forward, China’s investments in infrastructure along the routes have increased significantly (Teo et al., 2019), providing more convenient conditions for the transnational flow of production factors such as capital, labor force, and intermediate inputs, thus the allocation of production factors is optimized, and the efficiency of resource utilization in host countries get improved and promote the better development of a green economy. According to the discussion above, we propose another hypothesis:
H2: The Belt and Road Initiative promotes green technology spillover through the mechanism of increasing R&D investment, improving the environmental system, and accelerating the flow of production factors.
3 Model and methods
3.1 Measurement of green technology spillover
The development and progress of social productive forces have made people’s demands for improving environmental quality increasingly stronger. In addition to focusing on the desired output level of ascension, they also increasingly pay attention to reducing pollution of the environment and other unfavorable output levels [(Fare et al., 1989); (Charnes et al., 1979)]. To quantify and evaluate the degree of such coordinated development more reasonably, scholars have conducted a large number of studies on total factor productivity under the constraints of resources and environment (i.e., green total factor productivity). In the early stage, researchers commonly used the no-radial slacks-based measure (SBM) function and the Malmquist–Luenberger (ML) index to evaluate green productivity, but the ML index does not have a multiplicative property, so it could not observe the long-term growth trend of production very well, in addition, the mixed direction of the SBM function might reduce output (both of desired and undesired) and lead to no feasible solution. Therefore, we adopted the Global Malmquist–Luenberger (GML) index, which is based on a series of production possibilities over the full-time horizon of all decision-making units (Oh and Heshmati, 2010), and the principle is as follows:
We assume that all decision-making units are bound by the production possibility set (PPS); they use input N, x∈
From the computational perspective, the PPS is not useful enough, so we use the directional distance function (DDF), defining g = (gy,gb) be a direction vector, g∈
According to Pastor and Lovell (2005), in a panel of time periods T (t = 1,…), there are two kinds of PPS: the contemporaneous one Pt (xt) = { (yt,bt) | xt can produce (yt,bt)} and the global one
It can be decomposed into efficiency changes and technology changes:
The efficiency change (EC) represents the movement of a decision-making unit towards the best practice frontier, and technology change (TC) represents the technology progress. When the TC is greater than 1, it can be considered that the inputs used in measurement could promote technological progress and vice versa.
The Global Malmquist–Luenberger method includes three levels of index system: (1) Input indicator, including the host country’s stock of direct investment, energy consumption, and labor force. In this study, the host country’s direct investment stock is expressed as China’s OFDI stock after depreciation by the perpetual inventory method; the data are from China’s Outward investment Bulletin. Energy consumption is expressed by the total energy use of the country; the data are from the International Energy Agency (IEA). The labor force is represented by the employment population; the data are from the International Labor Organization (ILO). (2) Expected output indicator, expressed by the GDP of each country; the data are from the World Bank database. (3) Undesired output indicators, based on data consistency and availability reasons, are expressed by the countries’ carbon dioxide emissions, and the data are from the IEA.
By processing the above data with Stata software, we obtained the GML index and the decomposed green technology progress index (TC), which can be used to represent the green technology spillover of Chinese investment. According to the theory mentioned above, when the value of TC is greater than 1, we assume that China’s OFDI could promote the progress of green technology in the host countries, or in other words, there are green technology spillover effects.
Based on data availability, we measured China’s green technology spillover index of OFDI in 72 countries (including 41 BRI countries) from 2005 to 2018. Figure 1 shows the index of the sample countries during the last time interval. It can be found that in most host countries, China’s OFDI has created the green technology spillover effect, but this effect could not be seen in some countries of eastern or western Europe, as well as the United States.
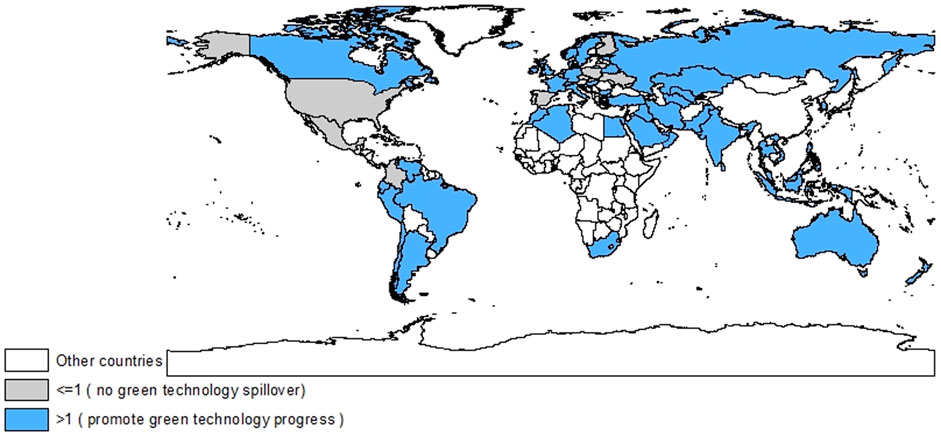
FIGURE 1. TC index of the sample countries (2018).
In order to demonstrate the BRI’s impact on green technology spillover more intuitively, we calculated the average index of each country in the two periods (before and after 2013) and compared the change rate, then compared the change rate of each country with the whole sample.
Figure 2 shows three different scenarios: First, in some countries (mainly in South America and Europe), the green technology spillover of China’s OFDI has decreased rather than increased since the BRI was proposed, showing that China’s OFDI in these countries will not lead to progress in green technology. Second, the green technology spillover index of some countries improved after 2013 but did not reach the average progress rate of the entire sample countries. It indicates that the impact of the BRI is not significant and much of the improvement is due to time trends. This scenario occurs mainly in Southeast Asia, the Middle East, and Canada. Finally, the rest of the countries experienced a huge increase in green technology spillover after the BRI, which is much higher than in other parts of the world, and these countries are located mainly along the BRI routes. In summary, the intuitive data display preliminarily validates our first hypothesis.
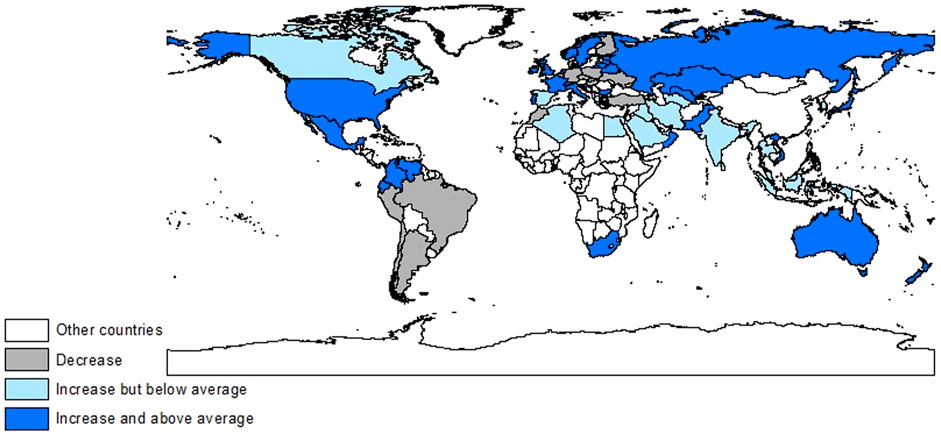
FIGURE 2. TC index change rate before and after the BRI was proposed in 2013.
3.2 Setting of the research model
The difference-in-difference method (DID) uses a quasi-natural experiment of policy to divide research samples into a treatment group and a control group; individuals affected by the policy are called the treatment group, and vice versa. To estimate the policy effect, it is necessary to compare the changes in the treatment group before and after the policy, but part of this change may be caused by the time effect, so it is necessary to introduce the changes in outcome variables in the control group before and after the implementation of the policy to propose the time effect within the treatment group, that is, the control group was hypothesized to construct a treatment group that only had a time effect and was not affected by the policy. To accurately identify the impact of the BRI on OFDI’s green technology spillover, we use 2013, the year the BRI was proposed, as the policy point of impact. It should be noted that although the years when the countries joined the BRI are not the same, the impact of the initiative on the investment characteristics of Chinese enterprises has occurred since the initiative was formally proposed, so we still use 2013 as the key year. Then we sort the countries or regions along the routes as the experimental group, while other countries or regions are sorted as the control group, and finally, we build the basic model as follows:
In this model,
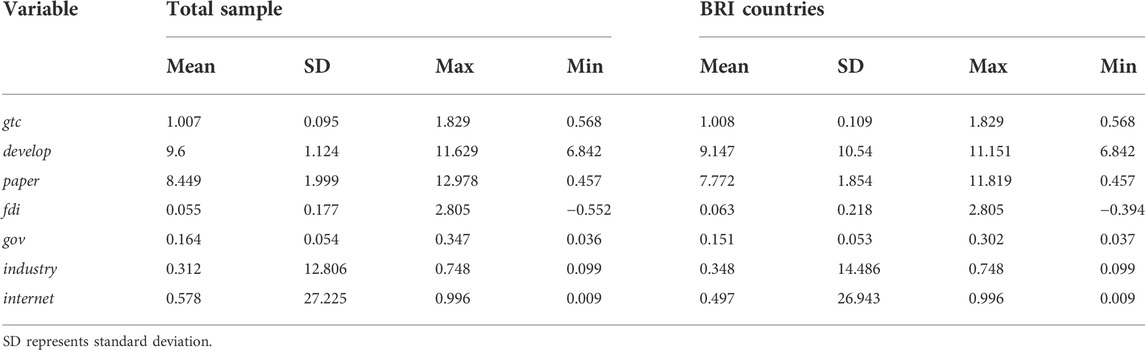
TABLE 1. Sample statistical results of each variable.
4 Results and discussion
4.1 Benchmark empirical
We performed regression with the model of Eq. 1, and the results are shown in Table 2. Column (1) only performed regression on the DID term representing the BRI, column (2) added control variables, and column (3) further controlled individual and time effects.
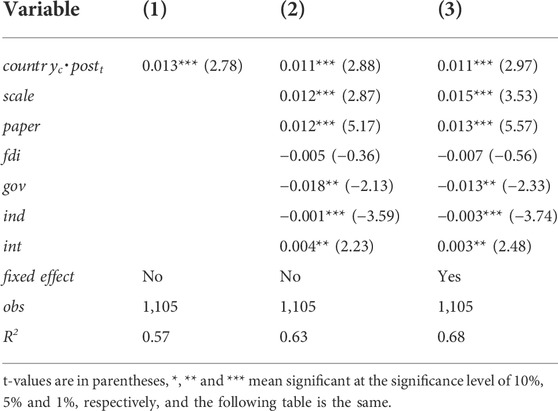
TABLE 2. Results of the benchmark empirical.
Through the regression results in the table, we can draw the following conclusions: (a) The coefficient of the DID term decreases after introducing other control variables and control fixed effects but is always positive at the 1% significance level, indicating that after the BRI was put forward, China has significantly improved the green technology spillover of OFDI in countries along the routes. (b) The influence of the market size of the host country on OFDI green technology spillover is significantly positive, possibly due to the scale effect. The number of published scientific papers and Internet users are also positive, indicating that the effect is greatly influenced by the host countries’ own scientific research capacity and informatization degree. (c) The variables of government expenditure and degree of industrialization in the host countries are significantly negative, indicating that the increase of government expenditure and degree of industrialization will reduce green technology spillover. Scholars who came to similar conclusions argued it may be because of government behavior; it might be blind and inefficient, and the improvement of the industrialization degree of the host country is at the cost of developing high-pollution and energy-consuming industries. (d) Although the regression result of the FDI utilization level variable is negative, it is not significant, indicating that the green technology spillover effect of China’s OFDI is less affected by the investment status of other countries in the host country, so it may be relatively independent.
4.2 Robustness test
4.2.1 Parallel trend test
The necessary premise of using the DID method is that the change trend of the two groups is consistent before the policy occurs; otherwise, the estimation of the policy effect would produce bias (Iyigun et al., 2017). To test the parallel trend of the samples, we constructed the interaction terms between the dummy variables and the countries along the BRI routes in each year and performed the regression, respectively. We finally plotted a parallel trend test graph of the interaction terms’ coefficients (Figure 3). It can be seen that the coefficient is not significantly different from zero before the BRI was put forward (the vertical axis of “current”), indicating that there is no time trend of heterogeneity in this period. However, the coefficient is significantly greater than zero after the policy point, indicating that the green technology spillover of China’s OFDI has been significantly improved after the initiative was put forward. Therefore, a conclusion could be drawn that the sample in this study has passed the parallel trend test and that the estimation of the DID method is reliable.
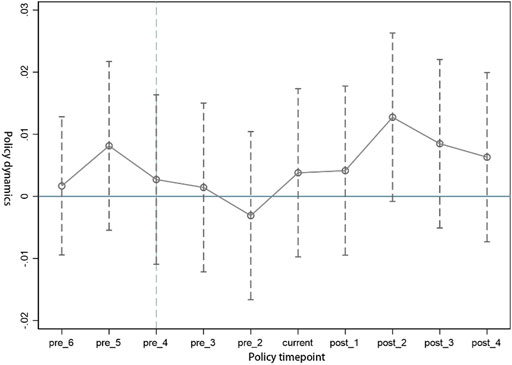
FIGURE 3. Results of the parallel trend.
4.2.2 Re-regression after propensity score matching (PSM-DID)
The sample in this study covers the whole world, and there are great differences in the selected control variables. To further control the characteristics of the treatment group and the control group, the propensity score matching (PSM) method was used to select and match the sample countries to draw more robust conclusions. As shown in the figures below, after 1:1 proximity matching for each control variable in the baseline regression, most of the data support the DID test (Figure 4), and the balance test results also show that the bias of all control variables decreased significantly after matching (Table 3). On this basis, the data with successful matching were used for re-regression, and the results reported in column (1) of Table 4 show that the estimated coefficient and significance degree have not changed substantially.
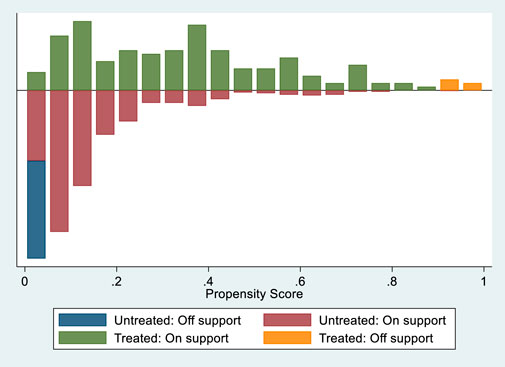
FIGURE 4. Results and distribution of the PSM.
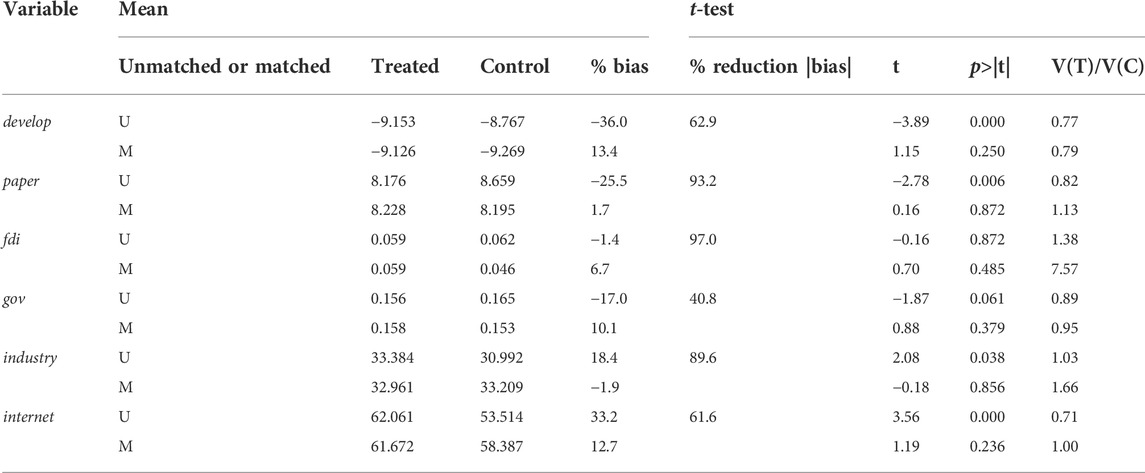
TABLE 3. Results of the balance test.
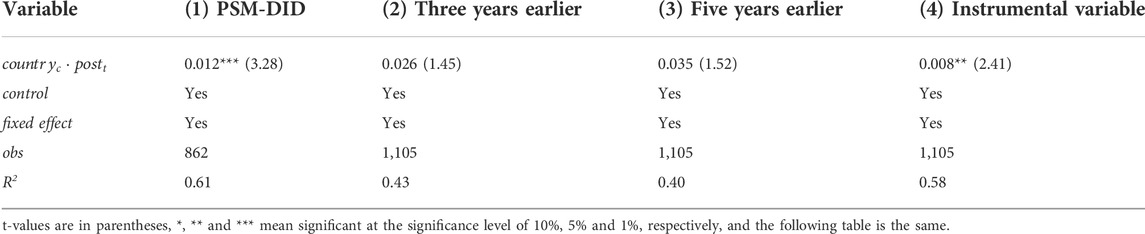
TABLE 4. Results of the robustness test.
4.2.3 Placebo test: Advancing the timing of policy shocks
It is assumed that the time of proposing the BRI is a point before 2013, and the sample interval is set as 2005–2013 to investigate whether the policy still has an influence on OFDI’s green technology spillover in the changed period. As stated above, the first premise of using the DID method is to confirm that there are no significant differences between the treatment and the control groups before the implementation of the policy. Therefore, the interaction coefficient representing the effect of “initiative” in the hypothetical situation should be insignificant; otherwise, there might be other uncontrolled potential factors affecting the green technology spillover of OFDI, and the estimation of the role of the BRI is biased. To enhance the robustness of the test results, it is also assumed that the proposed time of BRI is three and five years earlier, respectively, and the estimated results are reported in columns (2) and (3) of Table 4. It can be found that the estimated coefficient of the interaction term is no longer significant, so it can be considered that the possibility of the influence of potential unobserved variables is excluded.
4.2.4 Placebo test: Repeated randomized grouping experiments
To control estimation bias due to the omission of country-time-level variables, the placebo test of the randomized grouping experiment is introduced. The principle of this method is to make a DID test between the “pseudo-treatment group” and the “pseudo-control group” composed of other countries, since the grouping is randomly generated, the differential term should not have a significant effect on the explained variables of the model, i.e., if there is no significant missing variable bias, the coefficients reported in the regression results should not deviate significantly from zero; otherwise, there is “identification bias” in the setting of the model. To avoid the interference of small probability events in a single test, this study repeats the randomized trials 500 and 1,000 times, respectively, then plots the estimated coefficient and p value as shown in Figures 5, 6. With the increase of repeat test times, it can be found that the coefficient gradually converges to zero, and most p values are greater than 0.1. Meanwhile, the number of discrete outliers is very small. The results indicate that the estimations of this study should be free of errors caused by missing variables.

FIGURE 5. Coefficients and p values of randomly grouped regression (500 times).
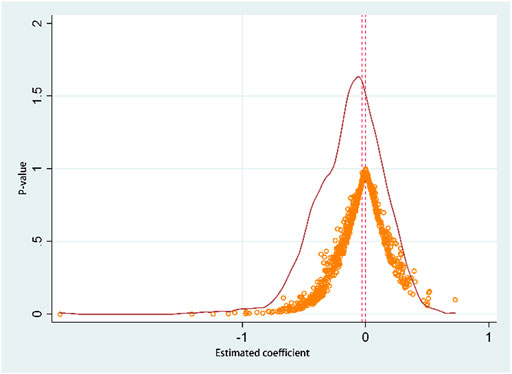
FIGURE 6. Coefficients and p values of randomly grouped regression (1,000 times).
4.3 Instrumental variable test
The DID model could solve the endogeneity problem caused by missing variables, but there may still be nonrandom problems in the selection of the treatment sample. This study uses the geographical distance between the capitals of two countries as an instrumental variable to alleviate the endogeneity problem. It is generally believed that the farther a country is from China, the less likely it is to be located along the Belt and Road and the less willing it is to participate in the initiative. Therefore, geographical distance is correlated with whether the host country of OFDI is a country along the routes. At the same time, the geographical distance between the two countries does not directly affect the green technology spillover of OFDI, so this variable is exogenous, and it conforms to the selection principle of instrumental variable. We obtained the geographic distance data from the CEPII database and then used the two-stage instrumental variable model to perform the estimation. The results are reported in column (4) of Table 4. The coefficient of the interaction term is still significantly positive at the level of 5%, indicating that after further alleviating the endogenous problems caused by the non-randomness of the selection of the treatment group, the BRI still significantly improves the green technology spillover of China’s OFDI.
4.4 Heterogeneity analysis
To further study the impact of the BRI on China’s OFDI green technology spillover on different types of host countries, this study selects three perspectives: income types, institutional quality, and environmental performance, to discuss the heterogeneity of impact effects in different kinds of host countries. The sample countries are divided into high-income and middle- or low-income countries according to the income classification standard reported by the World Bank. The countries are also divided into high-quality and low-quality types by median according to the latest edition of the World Bank’s World Governance Index (WGI) and The Environmental Performance Index (EPI) compiled by Yale University. The regression results by the group are reported in Table 5. It can be found that the BRI has a significantly positive impact on middle- or low-income countries but not on high-income countries, indicating that the green technology spillover effect of OFDI is mainly reflected in poorer countries. The results of the grouping regression of different samples of institutional and environmental quality show that the BRI has a more significant effect on improving the green technology spillover in countries with better institutions and poorer basic environmental quality.
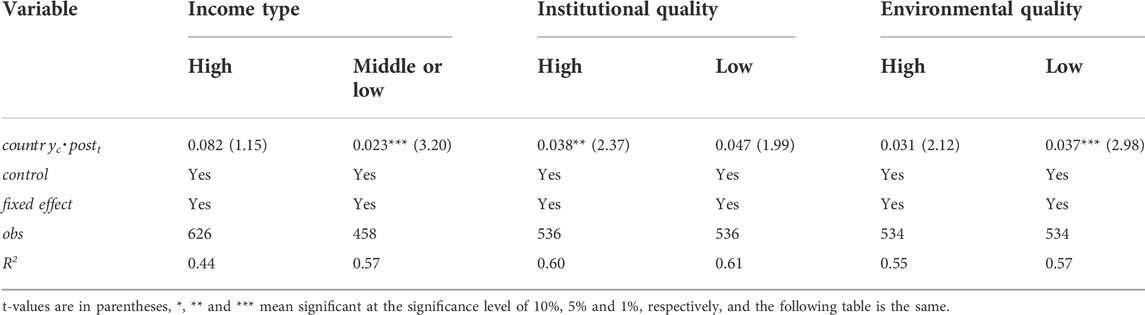
TABLE 5. Results of the heterogeneity test.
The single dividing standard of the sample group cannot identify the specific case of the impact of BRI, so this study constructs a threshold effect model, taking income per capita, institutional quality, and environmental performance as thresholds. The threshold test shows that the per capita income variable (income) and the environmental performance variable (epi) have passed the single threshold and double threshold test, while the triple threshold test failed, so they have two thresholds; the institutional quality variable (institution) has passed the triple threshold test. The minimum LR statistics of the above results are all less than the critical level under the 95% confidence interval, so it can be considered that the threshold values estimated above are true and effective.
Table 6 reports the regression results of the threshold test, showing that when the host country’s per capita income is less than the first threshold value, the BRI plays a significant role in promoting the green technology spillover of China’s OFDI, but while the host country’s economic development level exceeds a certain degree, the significance declines and finally fades after the second threshold. When the institutional quality of the host country passes the first threshold, the BRI has a significant promoting effect, but the significance decreases after the second threshold and stops to be significant after the third threshold, which represents the very high institutional quality of the host country. When the environmental performance of the host country stays at a low level, the BRI can significantly improve the green technology spillover of OFDI, but with continuous improvement of the environmental performance level, this promoting effect gradually weakens and finally is no longer significant at last. In summary, the test results of the threshold model are consistent with the grouping regression results.
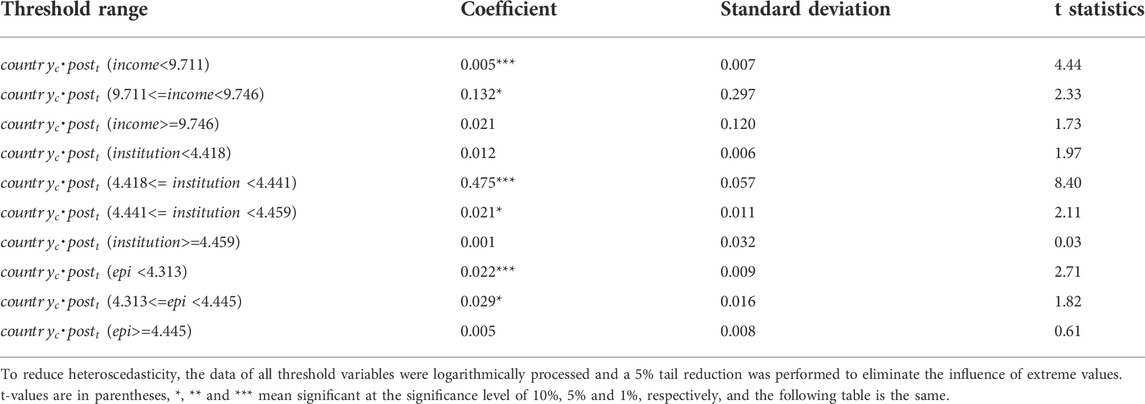
TABLE 6. Results of the threshold test.
The above heterogeneity characteristics might be explained as follows: The development in middle- or low-income countries are dominated by industries with high pollution and high energy consumption, which have a relatively poor environmental foundation, weak awareness of environmental protection, and backward environmental protection technology; therefore China’s OFDI green technology spillover is more likely to be effective. On the other hand, higher institutional quality is more conducive to bilateral cooperation and provides a better guarantee for China’s OFDI in green technology spillover channels such as demonstration and imitation, training of personnel, promotion of competition, and improvement of standards.
To show the coverage of the impact of the BRI more intuitively, this study draws the threshold distribution map of countries along the routes according to the threshold values with the latest data of 2018 (Figures 7–9). It can be found that the distribution is similar to the green technology change index map (Figures 1, 2), indicating that BRI has played a significant role in most of the participating countries.
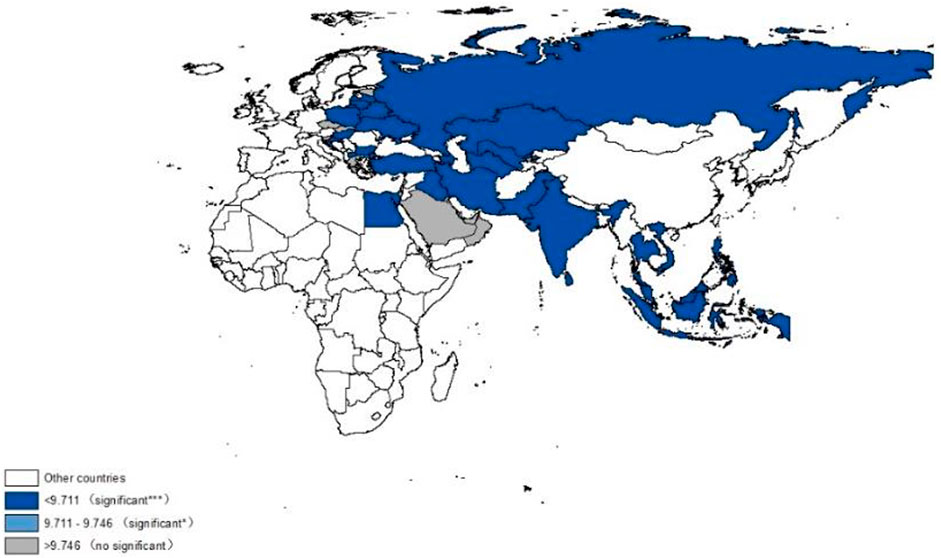
FIGURE 7. Significance distribution (per capita income level as threshold index).

FIGURE 8. Significance distribution (institutional quality as threshold index).
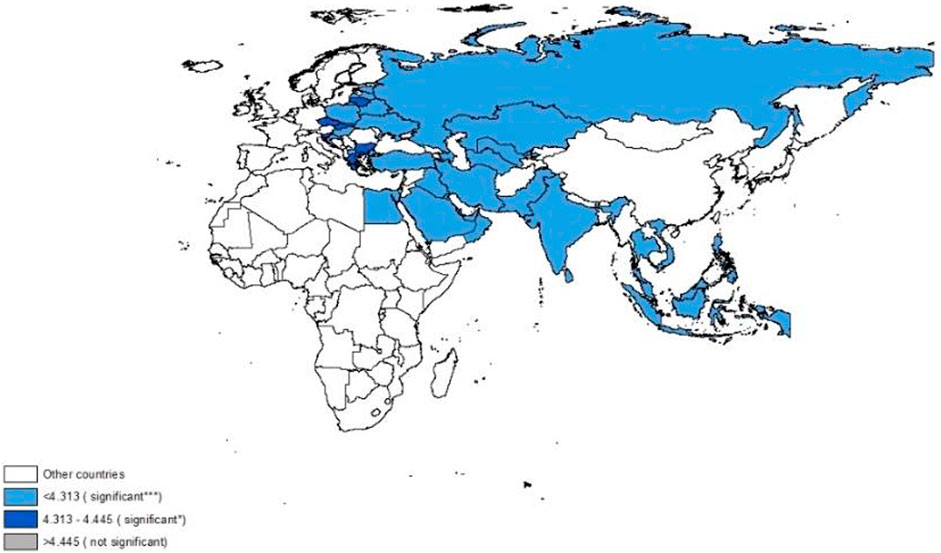
FIGURE 9. Significance distribution (environmental performance as threshold index).
4.5 Mechanism analysis
To test the effective mechanism of the BRI that affects OFDI green technology spillover, this study constructs the mediating effect model as follows:
BRIit is the proxy variable for the mechanism described above, the coefficient
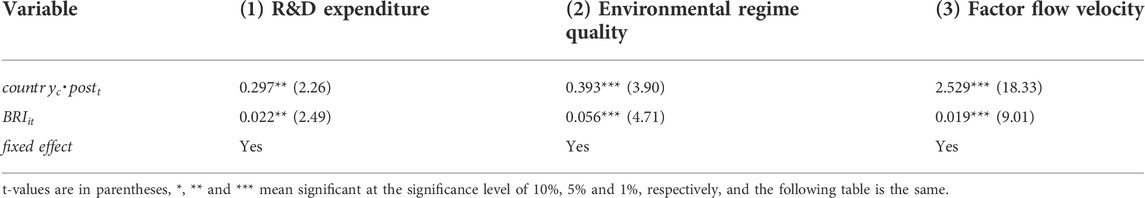
TABLE 7. Results of the mechanism test.
The first row of Table 7 reports the regression results of Eq. 6, showing that the proposal of the BRI has a significant impact on the proxy variables of each influence mechanism. It increases the R&D expenditure of the host government, improves the quality of the host country’s environmental system, and promotes the speed of factor flow in the host country. The second row reports the regression results of Eq. 7. It can be found that the mediating effect tests of all items are significantly positive, indicating that the mechanisms for the BRI to improve OFDI green technology spillover above are all effective.
5 Conclusion and implications
This study uses the Global Malmquist–Luenberger index method to measure the green technology spillover of China’s OFDI from 2005 to 2018. On this basis, it studies the impact of BRI on this effect with the difference-in-difference model and explores the heterogeneity and mechanism. The main conclusions are as follows: First, the BRI has significantly increased the green technology spillover of OFDI into countries along the routes. The heterogeneity study shows that this effect is significant in middle- or low-income countries with high institutional quality or poor environmental performance but not obvious in other countries. Second, the BRI promotes green technology spillover through the mechanism of increasing R&D investment, improving the environmental system, and accelerating the flow of production factors.
With an increasingly serious environmental and energy situation, countries are beginning to pay more attention to environmental protection and optimal utilization of energy, as well as developing economies. Some scholars accused China of using the BRI as a tool to plunder natural resources from other developing countries and divert high-polluting industries. The conclusion of this study empirically shows that the BRI has effectively promoted the progress of green technology in the host countries, which contributes to the development of a green economy. Thus, this study could refute the abovementioned criticisms.
For rational and effective use of outward investment and promotion of the development of a green economy in the BRI region, we put forward the following policy suggestions: First, expand the coverage of the Green Belt and Road initiative, vigorously promote green investment and practice the principles of green investment, sign ecological and environmental cooperation agreements, and add green investment clauses to trade agreements. In this way, more countries and regions could join the team of green development. Second, guide enterprises to implement high standards and strict requirements when making outward investments and insist that environmental benefits should be regarded as equally important as economic benefits when evaluating project plans. This will not only promote the green economic development of the host countries but also reduce the possibility of investment loss caused by environmental risks. Third, formulate differentiated policies for outward investment, increase targeted investment for host countries with a low level of economic development and relatively poor quality of environmental infrastructure, make up the “short slab” in the region and achieve coordinated development of all countries. At last, increase the display of external publicity, set up typical cases of energy saving, consumption saving, and emission reduction successfully achieved by “Belt and Road” investment projects in host countries. Finally, strengthen the construction of an information-sharing platform to dispel doubts of countries along the routes through transparency of related policy and data.
Limited by the author’s academic level and cognitive scope, there are still many defects in this study. The results of this study are generally contrary to some existing research findings, which suggest that China’s OFDI does not have a positive effect on the environment of other countries. We believe that this is because this study focuses on a specific effect in the complex mechanism of FDI; that is, China’s OFDI does promote green technology progress in the host country, and the proposal of the Belt and Road Initiative amplifies this promoting effect. Unfortunately, we have not been able to integrate this positive effect into a unified research framework with other possible negative channels, which could measure specifically the extent to which this positive effect determines the overall direction of the effect, and this will be a possible future research direction.
Data availability statement
The raw data supporting the conclusions of this article will be made available by the authors, without undue reservation.
Author contributions
All authors listed have made a substantial, direct, and intellectual contribution to the work and approved it for publication.
Funding
This research was funded by the National Social Science Foundation of China, grant number 17BJY145; the Xingliao Outstanding Young Talents Support program of Liaoning Province, grant number XLYC1907051; the Key project of Education Department of Liaoning Province, grant number LZD202006; and the Natural Science Foundation of Fujian Province, grant number 2020JOI927.
Conflict of interest
The authors declare that the research was conducted in the absence of any commercial or financial relationships that could be construed as a potential conflict of interest.
Publisher’s note
All claims expressed in this article are solely those of the authors and do not necessarily represent those of their affiliated organizations, or those of the publisher, the editors, and the reviewers. Any product that may be evaluated in this article, or claim that may be made by its manufacturer, is not guaranteed or endorsed by the publisher.
References
Ahmad, M., Khan, Z., Rahman, Z. U., and Khattak, S. I. (2021). Can innovation shocks determine CO2 emissions (CO2e) in the oecd economies? A new perspective. Econ. Innovation New Technol. 30 (1), 89–109. doi:10.1080/10438599.2019.1684643
Antweiler, Werner, Copeland, Brian R., and Scott Taylor, M. (2001). Is free trade good for the environment? Am. Econ. Rev. 91 (4), 877–908. doi:10.1257/aer.91.4.877
Ascensao, F., Fahrig, L., Clevenger, A. P., Corlett, R. T., Jaeger, J. A. G., Laurance, W. F., et al. (2018). Environmental challenges for the belt and road initiative. Nat. Sustain. 1 (5), 206–209. doi:10.1038/s41893-018-0059-3
Blackman, A., and Wu, X. (1999). Foreign direct investment in China's power sector: Trends, benefits and barriers. Energy Policy 27 (12), 695–711. doi:10.1016/S0301-4215(99)00063-4
Blalock, G., and Gertler, P. J. (2008). Welfare gains from Foreign Direct Investment through technology transfer to local suppliers. J. Int. Econ. 74 (2), 402–421. doi:10.1016/j.jinteco.2007.05.011
Charnes, A., Cooper, W. W., and Rhodes, E. (1979). Measuring the efficiency of decision-making units. Eur. J. Oper. Res. 3 (4), 339. doi:10.1016/0377-2217(79)90229-7
Cheng, C. Y., and Ge, C. Z. (2020). Green development assessment for countries along the belt and road. J. Environ. Manage. 263, 110344. doi:10.1016/j.jenvman.2020.110344
Christmann, P., and Taylor, G. (2001). Globalization and the environment: Determinants of firm self-regulation in China. J. Int. Bus. Stud. 32 (3), 439–458. doi:10.1057/palgrave.jibs.8490976
Dong, Y., Tian, J. H., and Ye, J. J. (2018). Environmental regulation and foreign direct investment: Evidence from China's outward FDI. Financ. Res. Lett. 39, 101611. doi:10.1016/j.frl.2020.101611
Du, J. L., and Zhang, Y. F. (2018). Does One Belt One Road initiative promote Chinese overseas direct investment? China Econ. Rev. 47, 189–205. doi:10.1016/j.chieco.2017.05.010
Eskeland, G. S., and Harrison, A. E. (2003). Moving to greener pastures? Multinationals and the pollution haven hypothesis. J. Dev. Econ. 70 (1), 1–23. doi:10.1016/S0304-3878(02)00084-6
Fare, R., Grosskopf, S., Lovell, C. A. K., and Pasurka, C. (1989). Multilateral productivity comparisons when some outputs are undesirable - a nonparametric approach. Rev. Econ. Stat. 71 (1), 90–98. doi:10.2307/1928055
Harlan, T. (2021). Green development or greenwashing? A political ecology perspective on China's green beltand road. Eurasian Geogr. Econ. 62 (2), 202–226. doi:10.1080/15387216.2020.1795700
Hu, J. F., Wang, Z., Huang, Q. H., and Zhang, X. Q. (2019). Environmental regulation intensity, foreign direct investment, and green technology spillover-an empirical study. Sustainability 11 (10), 2718. doi:10.3390/su11102718
Iyigun, M., Nunn, N., and Qian, N. (2017). Winter is coming: The long-run effects of climate change on conflict, 1400-1900. Germany: NBER Working Papers.
Jiang, Q. C., Ma, X. J., and Wang, Y. (2021). How does the one belt one road initiative affect the green economic growth? Energy Econ. 101 (490), 105429. doi:10.1016/j.eneco.2021.105429
Khan, A., Yang, C. G., Hussain, J., and Kui, Z. (2021). Impact of technological innovation, financial development and foreign direct investment on renewable energy, non-renewable energy and the environment in belt & Road Initiative countries. Renew. Energy 171, 479–491. doi:10.1016/j.renene.2021.02.075
Kokko, A. (1994). Technology, market characteristics, and spillovers. J. Dev. Econ. 43 (2), 279–293. doi:10.1016/0304-3878(94)90008-6
Lechner, A. M., Chan, F. K., and Campos-Arceiz, A. (2018). Biodiversity conservation should be a core value of China's Belt and Road Initiative. Nat. Ecol. Evol. 2 (3), 408–409. doi:10.1038/s41559-017-0452-8
Liu, H. Y., Wang, Y. L., Jiang, L., and Wu, P. (2020). How green is the ‘belt and road initiative’? - evidence from Chinese OFDI in the energy sector. Energy Policy 145, 111709. doi:10.1016/j.enpol.2020.111709
Mielnik, O., and Goldemberg, J. (2002). Foreign direct investment and decoupling between energy and gross domestic product in developing countries. Energy Policy 30 (2), 87–89. doi:10.1016/S0301-4215(01)00080-5
Muhammad, S., and Long, X. L. (2021). Rule of law and CO2 emissions: A comparative analysis across 65 belt and road initiative(BRI) countries. J. Clean. Prod. 279, 123539. doi:10.1016/j.jclepro.2020.123539
Oh, D. H., and Heshmati, A. (2010). A sequential Malmquist-Luenberger productivity index: Environmentally sensitive productivity growth considering the progressive nature of technology. Energy Econ. 32 (6), 1345–1355. doi:10.1016/j.eneco.2010.09.003
Pao, H. T., and Tsai, C. M. (2011). Multivariate Granger causality between CO2 emissions, energy consumption, FDI (foreign direct investment) and GDP (gross domestic product): Evidence from a panel of BRIC (Brazil, Russian Federation, India, and China) countries. Energy 36 (1), 685–693. doi:10.1016/j.energy.2010.09.041
Pastor, J. T., and Lovell, C. A. K. (2005). A Global Malmquist productivity index. Econ. Lett. 2, 266–271. doi:10.1016/j.econlet.2005.02.013
Poelhekke, S., and van der Ploeg, F. (2015). Green havens and pollution havens. World Econ. 38 (7), 1159–1178. doi:10.1111/twec.12219
Saha, S. (2020). The climate risks of China’s Belt and Road Initiative. Bull. At. Sci. 76, 249–255. doi:10.1080/00963402.2020.1806584
Sarkodie, S. A., and Strezov, V. (2018). Effect of foreign direct investments, economic development and energy consumption on greenhouse gas emissions in developing countries. Sci. Total Environ. 646, 862–871. doi:10.1016/j.scitotenv.2018.07.365
Teo, H. C., Lechner, A. M., Walton, G. W., Chan, F. K., Cheshmehzangi, A., Tan-Mullins, M., et al. (2019). Environmental impacts of infrastructure development under the belt and road initiative. Environments 6 (6), 72. doi:10.3390/environments6060072
Urban, D. M. (2010). FDI, technology spillovers, and wages. Rev. Int. Econ. 18 (3), 443–453. doi:10.1111/j.1467-9396.2010.00909.x
Walter, I., and Ugelow, J. L. (1979). Environmental policies in developing-countries. Ambio 8 (2-3), 102–109.
Xie, F. M., and Zhang, B. (2021). Impact of China's outward foreign direct investment on green total factor productivity in ‘belt and road’ participating countries: A perspective of institutional distance. Environ. Sci. Pollut. Res. 28 (4), 4704–4715. doi:10.1007/s11356-020-10849-2
Xie, Q. C., Wang, X. Y., and Cong, X. P. (2020). How does foreign direct investment affect CO2 emissions in emerging countries? New findings from a nonlinear panel analysis. J. Clean. Prod. 249, 119422. doi:10.1016/j.jclepro.2019.119422
Xue, H. L., Lan, X., Zhang, Q., Liang, H., and He, Z. (2021). Assessment of the green development level for participating countries in the Belt and Road initiative. Ann. Oper. Res. 10, 1–21. doi:10.1007/s10479-021-04440-2
Yu, S., Qian, X. W., and Liu, T. X. (2019). Belt and road initiative and Chinese firms' outward foreign direct investment. Emerg. Mark. Rev. 41, 100629. doi:10.1016/j.ememar.2019.100629
Zhang, S. J., Hu, B. B., and Zhang, X. F. (2021). Have FDI quantity and quality promoted the low-carbon development of science and technology parks (STPs)? The threshold effect of knowledge accumulation. Plos One 16 (1), e0245891. doi:10.1371/journal.pone.0245891
Zhang, Y. J., Jin, Y. L., and Shen, B. (2020). Measuring the energy saving and CO2 emissions reduction potential under China's belt and road initiative. Comput. Econ. 55 (4), 1095–1116. doi:10.1007/s10614-018-9839-0
Zhu, H. M., Duan, L. J., Guo, Y. W., and Yu, K. M. (2016). The effects of FDI, economic growth and energy consumption on carbon emissions in ASEAN-5: Evidence from panel quantile regression. Econ. Model. 58, 237–248. doi:10.1016/j.econmod.2016.05.003
Keywords: the Belt and Road Initiative, OFDI, green technology spillover, difference-in-difference model, Global Malmquist–Luenberger
Citation: Liu Z, Liu G and Zhang P (2022) Does the Belt and Road Initiative increase the green technology spillover of China’s OFDI? An empirical analysis based on the DID method. Front. Environ. Sci. 10:1043003. doi: 10.3389/fenvs.2022.1043003
Received: 13 September 2022; Accepted: 18 October 2022;
Published: 02 November 2022.
Edited by:
Irfan Ullah, Nanjing University of Information Science and Technology, ChinaReviewed by:
Weijian Du, Shandong Institute of Business and Technology, ChinaJinwen Tang, Guangdong Polytechnic Normal University, China
Sher Ali, Islamia College University, Pakistan
Copyright © 2022 Liu, Liu and Zhang. This is an open-access article distributed under the terms of the Creative Commons Attribution License (CC BY). The use, distribution or reproduction in other forums is permitted, provided the original author(s) and the copyright owner(s) are credited and that the original publication in this journal is cited, in accordance with accepted academic practice. No use, distribution or reproduction is permitted which does not comply with these terms.
*Correspondence: Guangyue Liu, NDAyMTkxMDA0MUBzbWFpbC5sbnUuZWR1LmNu; Ping Zhang, cGluZ21laWd1aUAxMjYuY29t
†These authors have contributed equally to this work and share first authorship