
94% of researchers rate our articles as excellent or good
Learn more about the work of our research integrity team to safeguard the quality of each article we publish.
Find out more
ORIGINAL RESEARCH article
Front. Environ. Sci. , 24 October 2022
Sec. Environmental Economics and Management
Volume 10 - 2022 | https://doi.org/10.3389/fenvs.2022.1041992
 Wenlong Liu1
 Zhenya Liu2,3*
For countries with small farmers as the main body of agricultural production, green production transformation of small farmers is crucial to achieve green agricultural development. Based on the prospect theory, this paper builds an evolutionary game model of cooperative leading the green production transformation of small farmers, systematically deduces the possible combination of different strategies of both sides, and puts forward targeted countermeasures for improvement. Finally, the simulation is verified, and the influence of relevant parameters on the decision-making of both sides is analyzed. In the initial stage of green production transformation, the local government’s support to the cooperative supervision and incentive strategy is the key to the successful transformation. Cooperatives can effectively promote small farmers’ transition to green production by reducing green production costs and increasing their perceived ecological benefits, moral benefits and brand benefits, but the effect of simply increasing the proportion of dividends is not obvious. Under the supervision and incentive strategy of cooperatives, there is an interval in which small farmers adopt cooperation strategy but fail to realize income increase, so cooperatives should increase the benefit distribution of small farmers. The research results provide reference for the green production transformation of small farmers, and also have strong enlightenment for the cooperative hitchhiking governance.
Over the past 40 years, the development of agriculture in China has relied heavily on chemical fertilizers and pesticides, and it has caused ecological damage and food safety problems (Liu et al., 2015; Li et al., 2021a; Liu and Wu, 2022). In recent years, the Chinese government has issued several policy documents to promote the green development of agriculture. Agricultural green production is the core of agricultural green development. However, the main body of agricultural production and operation in China is small farmers (ZHANG, 2020). According to the data of the third national agricultural census in 2016, there are 207 million agricultural operators nationwide, with a total of 2.024 million mu of arable land. According to the World Bank classification standard, China’s small farmers account for 98.1%, and small farmers in large countries will be China’s long-term basic national conditions (ZHANG, 2020). Therefore, under the background of small farmers in China, the transformation of small farmers’ green production is the key to realizing the green development of agriculture in China (Liu et al., 2020; Li et al., 2021b).
However, on the consumption side, it is difficult for small farmers to obtain market trust in the face of the market alone, and they cannot solve the problem of high quality and low price alone, so they cannot solve the problem of sales (Shen, 2021). On the production side, small farmers are characterized by short-sightedness and low-risk preferences, and may not comply with regulations in the production process, use prohibited pesticides privately or do not want to participate in green production activities, and continue to use large amounts of chemical fertilizers and pesticides in the production method (Jin et al., 2017; He et al., 2020). Therefore, the participation of other social organizations is needed to promote the realization of green production behaviors of small farmers. It is necessary to explore how relevant social organizations can promote the transformation of small farmers’ green production. As a natural farmer organization, cooperatives have a broad base of farmers and great advantages in organizing farmers’ production activities. Therefore, it is necessary to explore the mechanism of cooperatives to promote the transformation of small farmers’ green production.
However, there are many problems in the development of China’s cooperatives under the background of small farmers, such as small scale, weak strength, and lack of development motivation (Yan and Chen, 2013; Hu et al., 2017). Therefore, it is necessary for the government to intervene and provide relevant policy support to promote the green production transformation of small farmers by cooperatives. In the context of small farmers in China, the green production transformation of small farmers involves small farmers, the government, and cooperatives. This paper will try to explore the mechanism of cooperatives leading the green production transformation of small farmers under the background of government participation.
Researches on the green production transformation of small farmers mainly focus on the influencing factors of the green production behavior of small farmers. Mao et al. (2021) explored the impact of land ownership on farmers’ green production behavior. Through regression analysis, (Li et al., 2021b) found that farmers’ age, land type, land transfer compensation, technical service institutions, training, and subsidies have a significant impact on their willingness to produce green agriculture. Using survey data from 623 rice farmers in Sichuan Province, China, (Li et al., 2021a) showed that cooperative membership has a significant positive impact on safe rice agricultural production. Li et al. (2022a) pointed out that social network has a significant positive promotion effect on rice farmers’ application behavior of biopesticides. Li et al. (2020) pointed out that perceived value and perceived income has a significant positive impact on agricultural green production behavior while perceived risk has a significant negative impact. Du et al. (2021) pointed out that when formal environmental regulations were relatively lacking or weak, village regulations could serve as a useful complement to formal environmental regulations to promote farmers’ participation in cleaner production. Zhang et al. (2021) pointed out that agricultural subsidies can effectively improve the utilization rate of green pesticides, and the increase of agricultural subsidies is more effective than product certification.
In the process of green production transformation of small farmers led by cooperatives, both sides are faced with different strategies due to information asymmetry. Both sides will adjust their behaviors according to their subjective judgment of economic interests. Therefore, this paper will use the evolutionary game method to study. Evolutionary game theory, originating from biological evolution theory, breaks the hypothesis of complete rationality and assumes that the groups involved in the game are bounded rationality, which is more consistent with the actual situation. Evolutionary game theory has been applied in many fields and has produced abundant research results. Li et al. (2022b) introduced the evolutionary game model into the supervision of coal mining enterprises, and constructed a multi-agent evolutionary game model for coal mining enterprises, regulators, and frontline workers. To explore the role of public participation in China’s environmental governance, (Chu et al., 2022) constructed an evolutionary game model among local governments, polluting enterprises, and the public, and pointed out through model analysis and simulation that public supervision and action could help reduce the regulatory burden of local governments. To explore the problems of rural garbage classification in China, (Teng et al., 2022) constructed a tripartite evolutionary game model of government, village collective, and farmers, and the research provided a reference for guiding rural garbage classification. Wang (2022) constructed a tripartite evolutionary game model composed of platforms, restaurants, and consumers, and explored how to promote the healthy development of the takeout industry. Zhu et al. (2022) explored the influence of reward and punishment mechanisms on construction workers’ safety behavior through evolutionary game theory. In the aspect of agriculture, (Huo et al., 2022) constructed a tripartite evolutionary game model of professional farmer cooperatives, producers, and retailers, explored the mechanism of promoting tripartite cooperation, and provided a reference for comprehensive cooperation of the agricultural supply chain. Teng et al. (2021) constructed an evolutionary game model of government, farmers, and consumers. Through model analysis and simulation, the study pointed out that effective supervision could promote farmers to change to green production mode.
To strengthen the explanatory power of people’s real decision-making behavior, (Kahneman and Amos, 1979) proposed the prospect theory which is closer to real decision-making than the expected utility theory from the perspective of cognitive psychology. Then prospect theory and evolutionary game are applied in different scenarios. To study rent-seeking behavior in major infrastructure projects (MIP), (Lv et al., 2022)constructed an evolutionary game model among project owners, supervision units, and project contractors based on prospect theory, studied the strategy selection and stability conditions of game participants, and provided a decision-making basis for major infrastructure projects (MIP). Dou et al. (2021) constructed a tripartite evolutionary game model of government, developer, and contractor based on prospect theory to provide decision-making suggestions for the promotion of prefabricated buildings. Based on prospect theory and evolutionary game theory, (Shen et al., 2021) established an evolutionary game model between local governments and polluting enterprises in Taihu Lake Basin to explore the ecological compensation mechanism of Taihu Lake Basin. Shen et al. (2018) established an evolutionary game model of building material contractors and manufacturers based on the prospect theory to explore the mechanism of promoting garbage recycling.
Through the above research, it can be found that prospect theory can effectively combine evolutionary game theory. In the process of green production transformation of small farmers led by cooperatives, both parties pursue the maximization of their interests due to information asymmetry, and both parties are bounded rationality, so this study is suitable for adopting evolutionary game theory. At present, there is a lack of research on the green production transition of small farmers combining prospect theory and evolutionary game theory. 1) On the one hand, it is difficult for the government to directly manage farmers, and farmers do not directly face consumers, and cooperatives usually act as intermediary organizations; on the other hand, the previous literature based on the assumption of complete rationality more, the actual game players as not entirely rational. 2) The existing research on green production transition only focuses on the improvement of product quality, but does not pay attention to the problem of increasing the income of small farmers. At the same time, the green production transformation of small farmers is a systematic project. This paper attempts to combine the prospect theory and evolutionary game research methods to discuss the income increase of small farmers, the development of the cooperative brand, and the free-riding problem within the same systematic framework, and explore the mechanism of cooperatives leading small farmers to realize the green production transformation under the background of government participation.
The rest of the study is organized as follows. In the second section, model assumptions are made based on the actual problems of cooperatives leading the green production transformation of small farmers and the payment matrix of both parties is constructed. The third section solves the model and analyzes the stability of the strategies of both sides. In the fourth section, the model is simulated and parameter sensitivity is analyzed. The fifth part is the conclusion.
In the process of green production transformation of small farmers led by cooperatives, both sides are faced with different strategies due to information asymmetry. Both sides will adjust their behaviors according to their subjective judgment of economic interests. Small farmers may not produce according to green production standards, and cooperatives can adopt educational incentives and supervision incentives for small farmers’ production behaviors. This part will make assumptions on the model according to the actual problems, and add the decision-makers’ psychological perception factor in the prospect theory into the game of both sides, so as to construct the benefits matrix of both sides. The overall research ideas of this paper are shown in Figure 1.
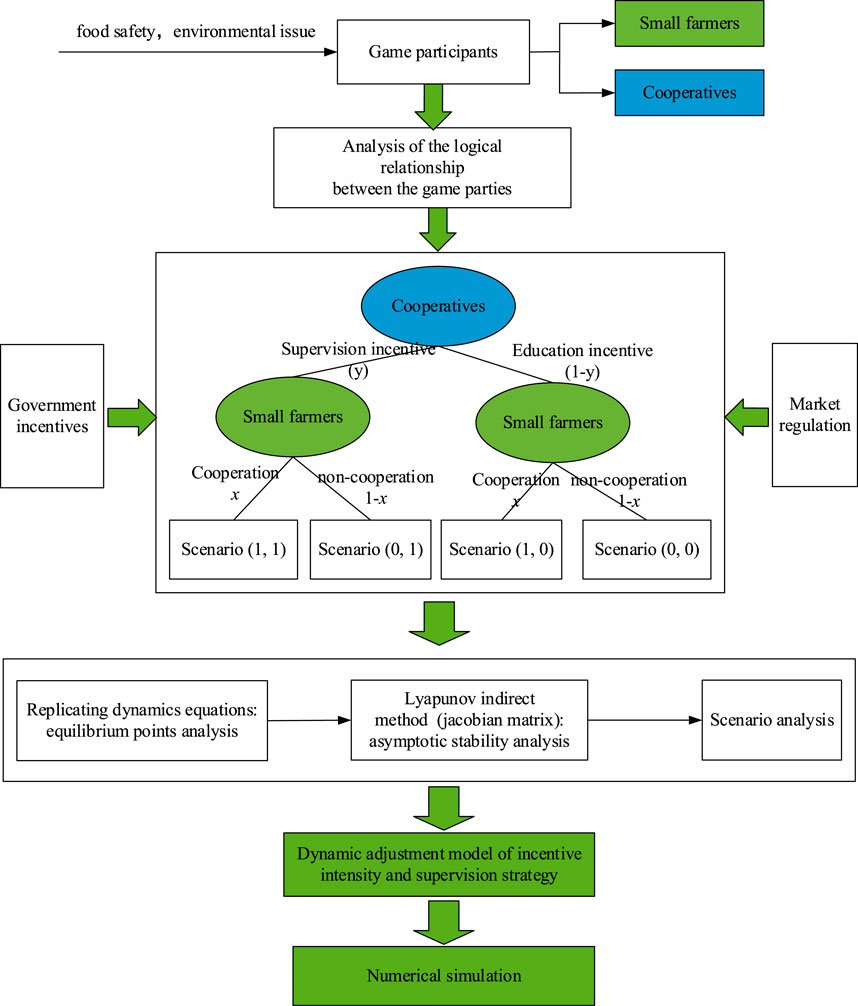
FIGURE 1. Overall research framework.
Hypothesis 1. In the process of developing green agriculture, small farmers will have two choice strategies: “cooperation” and “non-cooperation”. That is, the strategic space of small farmers is (cooperation, non-cooperation). “Cooperation” refers to production following green standards, and “non-cooperation” refers to small farmers using traditional production methods. Due to information asymmetry, cooperatives have two strategic options for non-cooperation behaviors of small farmers, namely “supervision incentive” and “education incentive”. That is, the strategic space of cooperatives is (supervision incentive, education incentive). “Education incentive” mainly guide small farmers to produce according to green standards through publicity and education. “Supervision incentive” refers to daily production supervision, production record inspection, and laboratory testing of small farmers in addition to publicity and education.
Hypothesis 2. The prospect theory on the premise of limited rationality and think policymakers the strategy choice of the main basis for subjective evaluation and perceived value of profit and loss, rather than the actual gain and loss, make up for the deficiency of the objective profit and loss payoff matrix in the evolution game, can explain behavior evolution strategy behind the change of the psychological perception, solving the contradiction of decision-making behavior does not accord with the expected utility theory. Both cooperatives and smallholder households are bounded rationality. The choice of strategies of both parties is based on the perceived value of the profit and loss of the strategy, rather than the direct profit and loss of the strategy itself. This value perception behavior conforms to the prospect theory. Therefore, this paper combines prospect theory with an evolutionary game and applies it to the evolutionary game analysis in the process of green production transformation of small farmers led by cooperatives.According to the prospect theory, V is the decision-makers perceived value of profit and loss, which is jointly determined by value function v(Δxi) and weight function π(pi). The expression is:
v(Δxi) and π(pi) can be expressed as:
Where, pi is the objective probability of occurrence of event i, the curvature of θ weight function curve, Δxi represents the difference between the actual obtained xi by the game subject and the reference point x0 after occurrence of event i, that is, Δxi = xi-x0. α and γ describe the marginal diminishing degree of value function of gain and loss respectively, and represent the sensitivity of perceived gain and perceived loss in this paper. λ is the degree of loss avoidance.
Hypothesis 3. When the cooperative adopts the strategy of “supervision incentive”, it will obtain the support income V(BD) from the government, mainly including capital subsidy, agricultural product publicity, and assistance, honor incentive, but it will also pay the cost V(Hc) higher than the strategy of “education incentive”. Normally, the benefits of green transformation obtained by cooperatives’ green production transformation are V(ΔHr), but when the quality problems of agricultural products are reported by consumers, the brand value loss V(BL) will occur, and the reduction of the brand value of cooperatives will also affect the interests of small farmers, such as the reduction of dividend amount and purchase price of cooperatives. Assuming that the proportion of brand loss reduction borne by small farmers was ζ, the proportion borne by cooperatives was (1-ζ).
Hypothesis 4. The production cost of small farmers when they choose the “non-cooperation” strategy is CN, and the perceived difference between green production cost and traditional production cost when they choose the “cooperation” strategy is V(ΔCs). Usually, small farmers can only get ordinary agricultural product sales revenue V(RN) when they sell themselves without cooperation with relevant organizations or brand resources, and the perceived green sales revenue they can get higher than ordinary agricultural products through cooperative channels is V(ΔRs).
Hypothesis 5. Studies have shown that education of farmers can significantly increase farmers’ sense of responsibility and reduce farmers’ fertilizer use (Ying et al., 2017; Tian et al., 2021; Luo et al., 2022), that moral responsibility, environmental knowledge, and skills can promote farmers’ pro-environmental behavior, and that cultivating farmers’ sense of moral responsibility and responsibility and running field schools can promote farmers’ pro-environmental behavior (Bagheri et al., 2019; Gowda et al., 2021; Khan et al., 2021). Education and training by cooperatives can make smallholder farmers aware of the ecological damage caused by the heavy use of fertilizers and pesticides. It is assumed that the perceived ecological gain that farmers can obtain when they produce according to green standards in the production process is V(EC), and when they do not produce according to green, they incur a loss of perceived moral gain V(ED) because they violate the rules of the cooperative and fail to guarantee the quality of their agricultural products.
Hypothesis 6. The cooperative will distribute the green transformation benefits to its members, assuming that the percentage of dividends is β, and the perceived dividend benefit to farmers is βV(ΔHr). When the cooperative adopts the “supervision incentive” strategy, each batch of vegetables will be inspected. When small farmers are found to violate the rules during the daily supervision of the cooperative, or found to be substandard in the inspection, small farmers can only sell their vegetables through the market, and no longer enjoy the cooperative’s dividends, and will be punished by the cooperative, assuming that the punishment here is the public announcement of the failure of the inspection, small farmers will suffer from loss of face V(FP).Since the decision weight function is used to measure the subjective probability of the occurrence of uncertain gains and losses, this paper holds that the uncertain gains and losses in the green production transformation of small farmers are mainly reflected in the complaints of customers and the reduction of brand trust caused by the quality of agricultural products. If the objective probability of occurrence is P0, the subjective probability is π(P0), so V(BL) = π(P0)λ(BL)γ. According to the above assumptions, the income matrix of cooperatives and small farmers can be obtained as shown in Table 1.
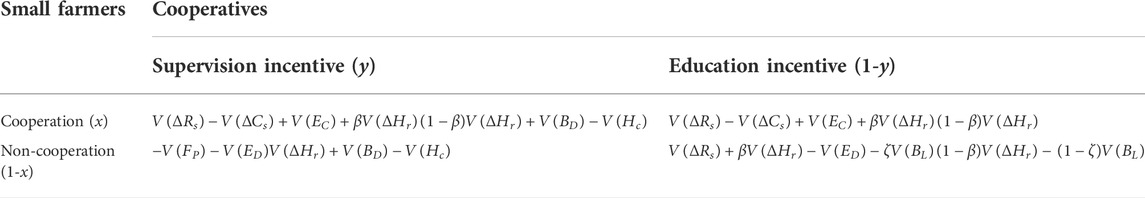
TABLE 1. Income matrix of cooperatives and small farmers.
The expected income M1 of cooperatives adopting the “supervision incentive” strategy is:
The expected income M2 of cooperatives adopting the “educational incentive” strategy is:
The average expected income‾M of cooperatives is
The number growth rate of the cooperative choosing the “supervised incentive” strategy is equal to its fitness minus its average adaptation, that is, under the continuous continuation of time T, the replication dynamic equation of the cooperative is:
The expected income K1 of small farmers choosing the “cooperation” strategy is:
The expected income K2 of small farmers choosing the “non-cooperation” strategy is:
The average expected income ‾K of small farmers is:
The growth rate of the strategic quantity of small farmers is
According to the above analysis, from F(x) and F(y), it can be concluded that the driving system E of green production transformation of small farmers is:
When F(x) = 0 and F(y) = 0, the dynamical system has five equilibrium points, which are (0, 0), (0, 1), (1,1), (x *, y*), where
The five equilibrium points obtained from the above replication dynamic equation are not completely the evolutionary stability strategy of the system. The evolutionary stability of the two-dimensional dynamic system should be derived by analyzing the local stability of the jacobian matrix of the system. Therefore, the Jacobian matrix constructed is:
After solving respectively, the following results can be obtained:
The equilibrium point of the replication dynamic equation is not the evolutionary stability point, and the following two conditions should be satisfied at the same time:
From the condition of the equilibrium point of the evolutionary stable strategy, it can be deduced that the equilibrium point of the evolutionary stable strategy needs to satisfy Γ11 < 0 and Γ22 < 0. By solving the Jacobian matrix, we get the values of Γ11, Γ22, Γ12, Γ21 respectively, and as shown in Table 2. When det(J) > 0 and tr(J) = 0 or uncertain, this point is a saddle point. The trace of the equilibrium point (x*, y*) is equal to 0, so it is not stable and will not be discussed below.

TABLE 2. Specific values of local equilibrium points at Γ11, Γ22, Γ12, Γ21.
Scenario 1. When
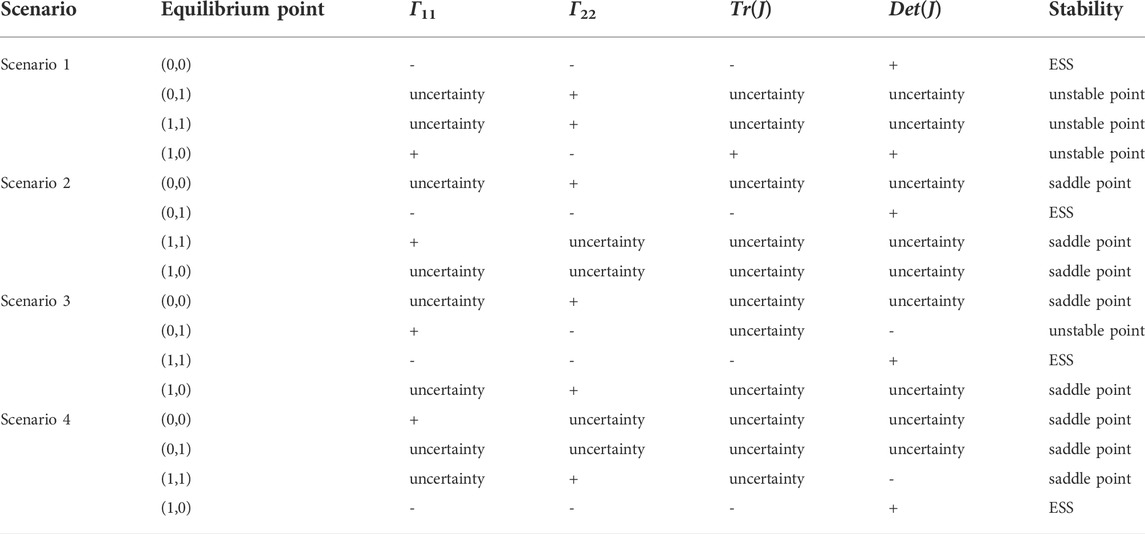
TABLE 3. Analysis of strategy stabilization equilibrium points.
Scenario 2. When
Scenario 3. when
Scenario 4. When
The brand development of cooperatives usually needs a process, which will be in different stages. The incentive measures of cooperatives for small farmers also need to be dynamically adjusted to promote the evolution of small farmers to the “cooperation” strategy. To better explain the choice of strategies of both parties, according to the analysis of each situation in the above section, the cooperative supervision and incentive dynamic adjustment model are established without considering the drastic fluctuation of income caused by inflation, fluctuation of agricultural products price, weather, and other factors. Although the curve in the model may not be completely consistent with reality, its logic is consistent, as shown in Figure 2.
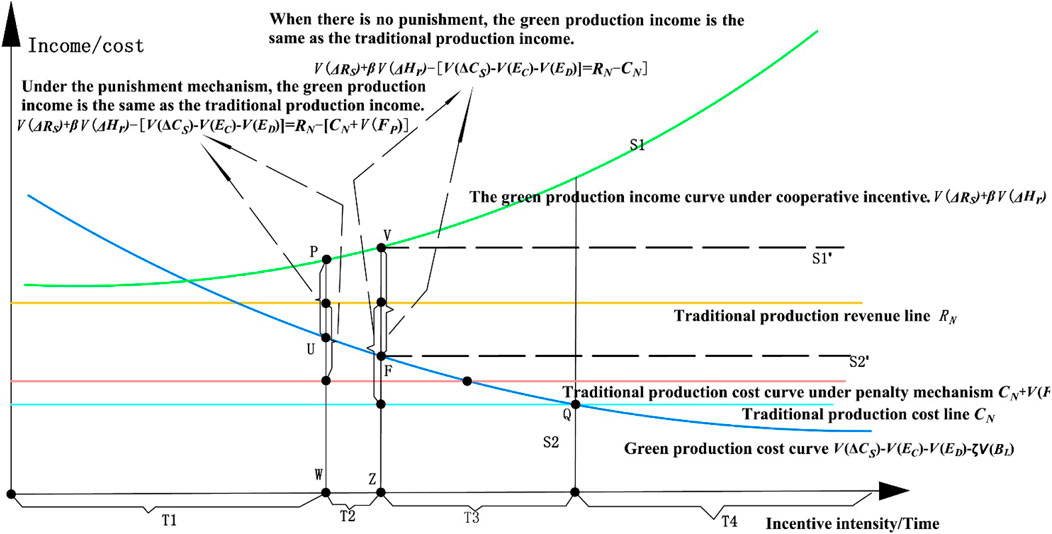
FIGURE 2. Dynamic adjustment model of incentive intensity and supervision strategy.
In scenario 1, when small farmers adopt the “cooperation” strategy, the sum of perceived ecological benefits, moral benefits, and brand value benefits is not enough to compensate for the cost of green production higher than traditional production. At this point, small farmers are in T1, T2, and T3 in Figure 2. In this region, there is room for small farmers to free ride and save costs. If cooperatives only adopt the strategy of “education incentive”, small farmers may evolve into the strategy of “non-cooperation”. Therefore, from the perspective of brand development, cooperatives should adopt the strategy of “supervision incentive”, and at the same time, cooperatives should improve the ecological perceived benefits of small farmers, brand perceived benefits, and reduce the green production costs of small farmers. Local governments can give cooperatives certain rewards or subsidies to increase the perceived benefits of adopting the strategy of “supervision incentive”.
In Scenario 2, small farmers are located in the T1 area in Figure 2, and even if the cooperative chooses to adopt the “supervision incentive” strategy, it will not be able to increase the proportion of smallholder cooperation because the benefits of the “cooperation” strategy are lower than the benefits of the “non-cooperation” strategy. In such a case, the use of punitive measures alone will lead to the withdrawal of small farmers from the cooperative. In this case, if the benefits are not equally distributed among small farmers, the cooperative should increase the benefits to small farmers so that the income of small farmers from green production reaches after the P point of curve S1 and the cost of green production is after the U point of curve S2. If the income of green production is low because the brand is in the initial stage and the brand value is low, on the one hand, the cooperative should focus on increasing brand awareness and brand value, and on the other hand, it should reduce the cost of green production for small farmers through ecological compensation, etc. At this stage, the income of green production for small farmers is at least equal to the income of the original traditional production method.
In Scenario 3, small farmers are located in the T2 and T3 regions in Figure 2. It should be noted that when small farmers are in T2 region, they choose the “cooperation” strategy when the cooperative adopts the “supervision incentive” strategy, but the existence of the penalty mechanism makes the traditional production cost of small farmers increase, which causes small farmers to choose the “cooperation” strategy. Although the penalty mechanism in this paper is not a punishment for smallholder economic benefits, small farmers do not gain more welfare by cooperating with green production, and they may choose to adopt green production for reasons such as loss of face. In terms of total benefits, small farmers in the T2 area did not increase their income due to green production, and if the difference between the benefits of adopting green production and traditional production methods is beyond the psychological tolerance of small farmers, it will lead to small farmers’ withdrawal from the cooperative. Therefore, in this area, cooperatives need to increase the incentives of small farmers by increasing the cost and income of smallholder green production. When in the T3 region, small farmers are able to achieve increased income in green production. When the income level of smallholder green production is after the point V of curve S1 (i.e., the level of achieving S1’) and the cost is after the level F of S2 (i.e., the level of achieving S2’), the income of smallholder green production can be achieved equal to the income of traditional production.
In Scenario 4, the perceived green production cost of small farmers is less than the cost of traditional production, as shown in the T4 region in Figure 2. Therefore, it is easier for the cooperatives to use the funds to reduce the perceived green production costs of small farmers, so that small farmers can consciously adopt the “cooperation” strategy.
To illustrate more specifically the influence of the strategy chosen by the cooperative and the smallholder on the final equilibrium point, as well as the influence of each parameter on the strategy of both parties, this part will assign values to the parameters in the model and use Matlab simulate the above situation. It should be noted that, since the parameters of the model are abstract, it is not convenient to assign them about examples, and the parameters are mainly used to reflect the relationship between the function variables, which do not affect the simulation results when the basic assumptions are satisfied. From prospect theory, it is known that 0 < α, γ, λ > 1, indicating those decision makers are more sensitive to losses compared to gains. According to existing studies, when α= γ = 0.88, λ = 2.25 is assumed to represent the approximate behavioral preferences of decision makers, the decision influence coefficient θ = 0.69 (Khan et al., 2021; Shen et al., 2021; Lv et al., 2022). According to Marshall and Hirmas’ 1:300 principle (Marshall et al., 2018), P0 = 0.03, and the initial values of other parameters were set as follows β = 0.2, ζ = 0.4, ΔRS = 20, ΔHr = 15, BL = 55, FP = 0.5, EC = 1, ED = 1, ΔCS = 16, ΔHc = 15, BD = 25.
Scenario 1. Under the initial conditions, the system satisfied the conditions of Scenario 1, and the initial values of x and y were taken from 0.1 to 0.9 in steps of 0.1, and the simulation results are shown in Figure 3. As we can see from the figure, with different initial values, the proportion of small farmers taking the “cooperation” strategy gradually tends to 0, and the proportion of cooperatives choosing the “supervision incentive” strategy also gradually tends to 0. The equilibrium point is (0, 0), that is, both sides of the game are in a stable state (no cooperation, education incentive).
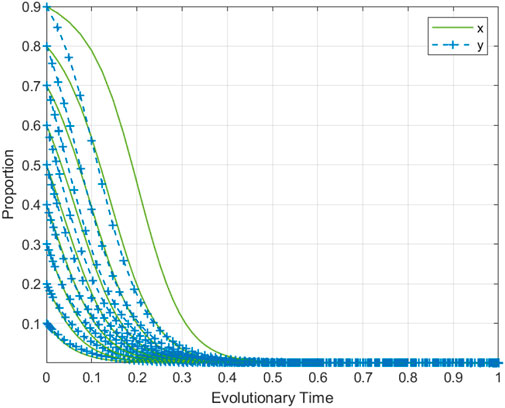
FIGURE 3. Simulation results of scenario one evolution.
Scenario 2. Adjust BD to 28 and ΔRS to 15 to satisfy the condition of Scenario 2, and take the initial values of x and y from 0.1 to 0.9 in steps of 0.1, respectively, and the simulation results are shown in Figure 4. From Figure 4, it can be seen that under different initial values, as the number of evolutionary periods continues to extend, the proportion of small farmers adopting the “cooperation” strategy gradually tends to 0, and the proportion of cooperatives choosing “supervision incentive” gradually tends to 1, i.e., both sides of the game are in a stable. The simulation results are consistent with the theoretical derivation results.
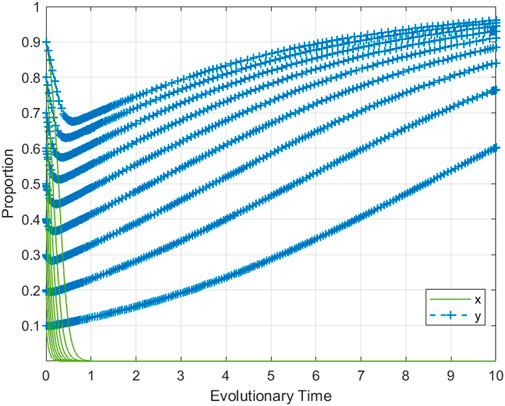
FIGURE 4. Simulation results of scenario two evolution.
Scenario 3. Let ΔRS = 30, ΔHr = 30, BD = 38, and the initial values of x and y are taken from 0.1 to 0.9 in steps of 0.1, and the simulation results are shown in Figure 5. As can be seen from the figure, with the extension of the evolution period, the proportion of small farmers taking the “cooperation” strategy gradually converges to 1, and the proportion of cooperatives choosing the “supervision incentive” strategy gradually converges to 1, i.e., the equilibrium point is (1,1) at this time. In this case, both sides of the game are in a stable state (cooperation, supervision incentive), and the simulation results are consistent with the theoretical derivation. The simulation results are consistent with the theoretical derivation. Under different initial values of x and y, small farmers will choose the “cooperation” strategy, which indicates that different proportions of the “supervision incentive” strategy will make small farmers adopt the “cooperation” strategy in this case.
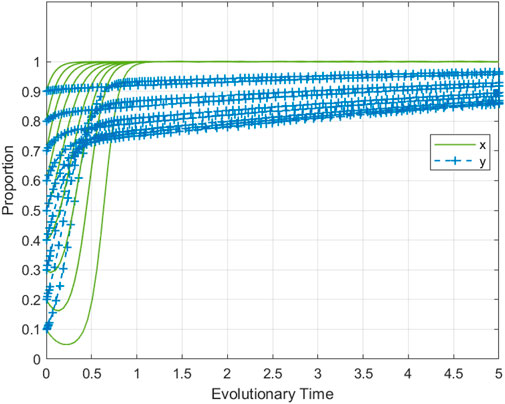
FIGURE 5. Simulation results of scenario three evolution.
Scenario 4. Let EC = 10, ED = 10,ΔCS = 10, and the initial values of x and y are taken as 0.1 to 0.9 in steps of 0.1, and the simulation results are shown in Figure 6. As can be seen from the figure, with different initial values, the proportion of small farmers taking the “cooperation” strategy gradually converges to 1, and the proportion of cooperatives choosing the “supervision incentive” strategy gradually converges to 0. At this time, the equilibrium point is (1,0), that is, both sides of the game are in a stable state (cooperation, education incentive). The higher the initial value of “cooperation” strategy of small farmers, the shorter the time to converge to 1. Therefore, we should fully mobilize small farmers at the early stage of cooperative development, and increase the proportion of small farmers who adopt the “cooperation” strategy at the initial state through demonstration by party members or model households to shorten the evolution time.
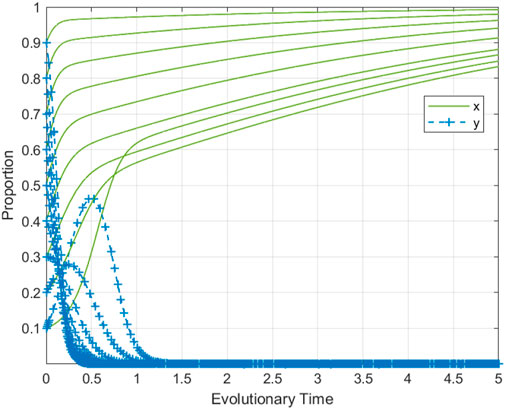
FIGURE 6. Simulation results of scenario four evolution.
In order to investigate the effects of smallholder farmers’ and cooperative’s perception of gain α, loss γ, and risk aversion sensitivity λ on the evolution of the system, x and y are taken as 0.5, and α, γ, and λ are assigned as values for analysis. The values of 0.4, 0.6, 0.7, 0.88, and 0.95 are taken for α, and the rest of the parameters are the simulation values of scenario 3. The evolutionary results of the small farmers are shown in Figure 7A, and the evolutionary results of the cooperative are shown in Figure 7B. From the figure, it can be seen that the system is very sensitive to the value of α. When α is taken as 0.4, 0.6, 0.7, the system evolves as (non-cooperation, educational incentive), and when α is taken as 0.88, 0.95 the system evolves as (cooperative, supervision incentive). It can be seen that as α gradually increases, small farmers gradually evolve to adopt “cooperation” strategy and cooperatives gradually evolve to adopt “supervision incentive” strategy.
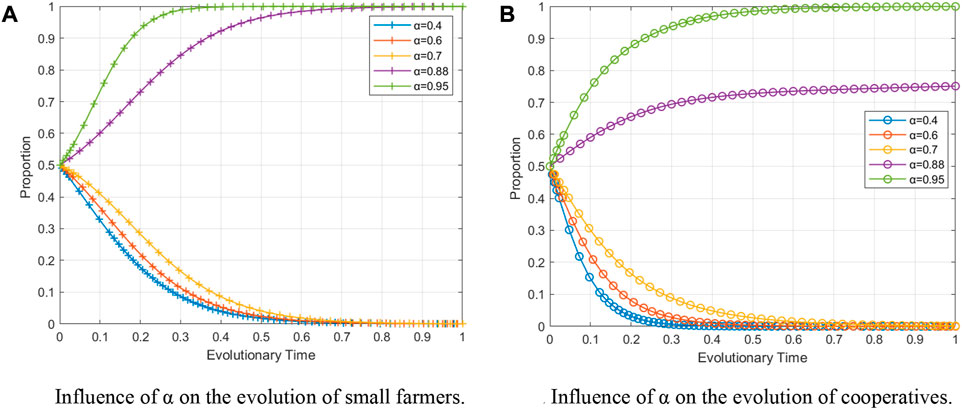
FIGURE 7. (A)Influence of α on the evolution of small farmers. (B)Influence of α on the evolution of cooperatives.
The evolutionary results for small farmers are shown in Figure 8A and for cooperatives in Figure 8B for values of γ of 0.88, 0.90, 0.95, and 0.98, respectively, and the remaining parameters are the simulation values of scenario 3. As we can see, with the increase of γ, small farmers gradually evolve to adopt the “no cooperation” strategy, while the cooperative is in a fluctuating state, indicating that small farmers are more sensitive to losses than the cooperative.
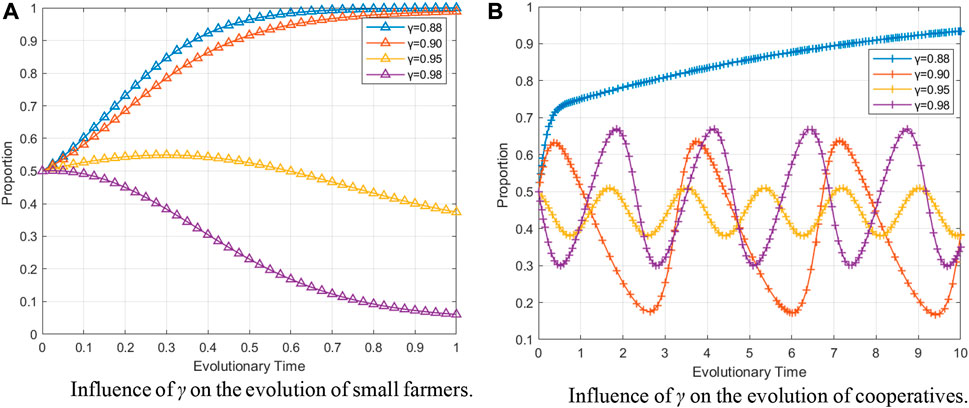
FIGURE 8. (A) Influence of γ on the evolution of small farmers. (B) Influence of γ on the evolution of cooperatives.
The parameter λ represents the degree of loss avoidance, the larger the value of λ means the more risk averse, the higher the degree of loss avoidance, λ is 2.25, 2.8, 3, 3.2, and the rest of the parameters are the simulation values of scenario 3, and the evolutionary results are shown in Figure 9A,B. As can be seen from the figures, with the increase of λ, the small farmers evolve from the “cooperation” strategy to the unstable state, and finally to the “non-cooperation” strategy, while the cooperative evolves from the “supervision incentive” strategy to the unstable state. It should be noted that in this paper, since the cooperative’s punishment for farmers is low and non-economic, loss aversion mainly influences small farmers’ strategies through green production costs. When small farmers are more risk averse, they perceive higher green production costs and thus choose to adopt the “non-cooperation” strategy.
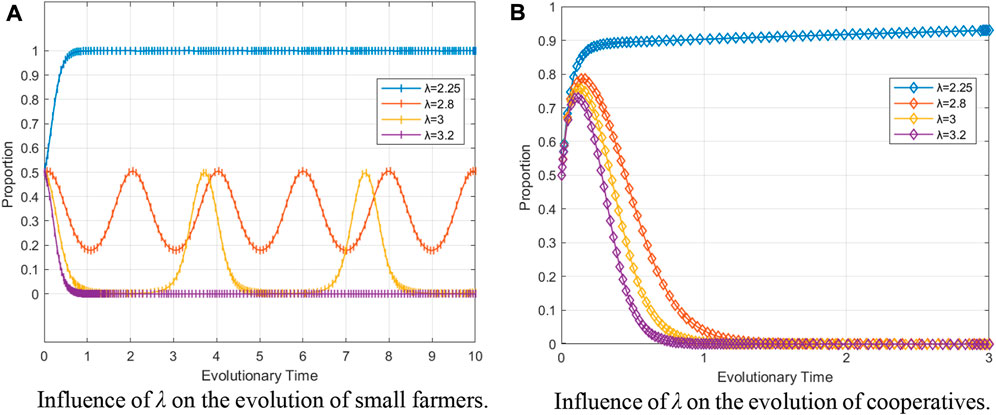
FIGURE 9. (A) Influence of λ on the evolution of small farmers. (B) Influence of λ on the evolution of cooperatives.
In order to analyze the influence of the dividend proportion β on the strategy of both sides, the values of β are assigned to 50%, 70%, and 80%, and the other parameters are the simulation values of situation 2, and the income increase of small farmers can be achieved when β is 20%. For x and y initial values are taken as value 0.5, the results of the evolution are shown in Figure 10A, the proportion of small farmers’ cooperation strategy is in a fluctuating state, indicating that with the increasing proportion of dividend, the proportion of small farmers taking cooperation strategy gradually increases, but in a fluctuating state. It can be seen that if the perceived moral benefit, ecological benefit and perceived benefit to the brand cannot compensate the difference of green production cost of small farmers, the system cannot converge to one simply by increasing the proportion of dividends. Increasing the proportion of small farmers’ initial cooperation to 0.8 still has no obvious effect, while adjusting the proportion of supervisory incentive strategy to one can achieve small farmers’ cooperation, as shown in Figure 10B. It shows that in this case, the initial proportion of supervisory incentive strategy for cooperatives is required to be higher. Unlike small farmers, the time of cooperative evolution becomes shorter as the proportion of dividends increases, as shown in Figure 10C.
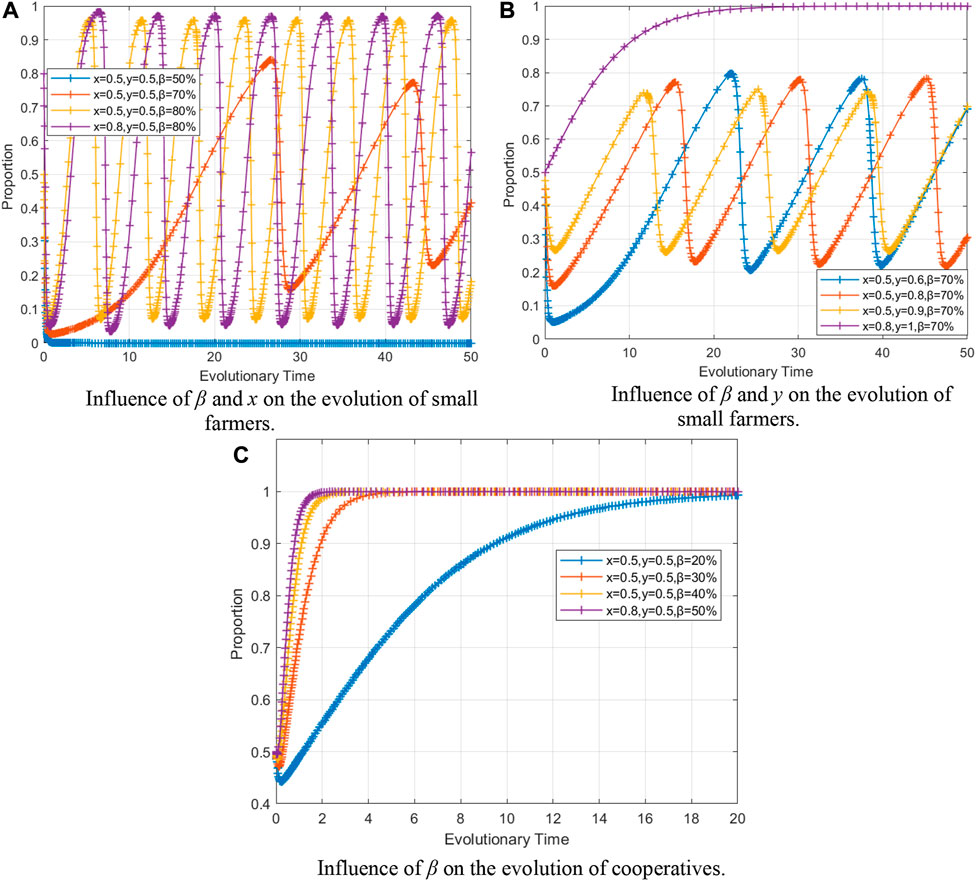
FIGURE 10. (A) Influence of β and x on the evolution of small farmers. (B) Influence of β and y on the evolution of small farmers. (C) Influence of β on the evolution of cooperatives.
To analyze the effect of ζ on the evolution of the system, ζ is assigned to 10%, 30%, 50% and 70%, the initial values of x and y are 0.5, and the other values are the simulation parameters of scenario 4. The results of smallholder evolution are shown in Figure 11A, and the results of cooperatives evolution are shown in Figure 11B. It shows that increasing the share of small farmers in the risk of brand value reduction will make small farmers evolve to the “cooperative” strategy, while the cooperative evolve in the opposite direction. Therefore, in practice, we should improve the perceived benefits of brand value for small farmers, establish a risk-sharing mechanism, and set a reasonable risk-sharing ratio to prevent the system from being in an unstable state.
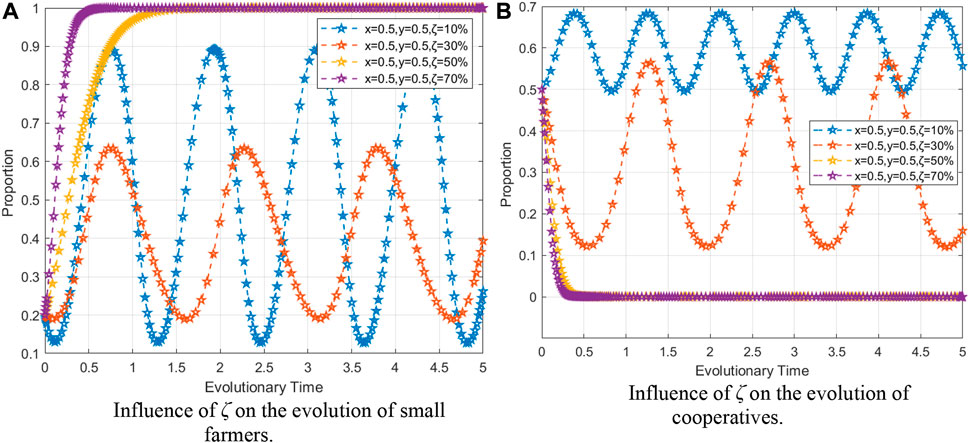
FIGURE 11. (A) Influence of ζ on the evolution of small farmers. (B) Influence of ζ on the evolution of cooperatives.
In order to analyze more comprehensively the influence of other related parameters on the strategy of small farmers, so that targeted measures can be taken to improve the probability of small farmers’ cooperation. Keeping the other parameters constant under the initial conditions, the EC, ED, and ΔCS were assigned values for the analysis, and the initial values of 0.5 were taken for x and y, respectively, and the system evolution results are shown in Figure 12. It can be seen with the increase of EC and ED and the decrease of ΔCS, small farmers gradually evolve to the “cooperative” strategy, which indicates that the cooperative strategy has a significant effect on small farmers by improving their ecological and moral benefit perceptions and by reducing their costs of green production. It is important to note that in practice, there may be limits to the role that smallholder ecological benefits, perceived moral benefits, and production costs can play, so it is recommended to try a combination of measures in practice.
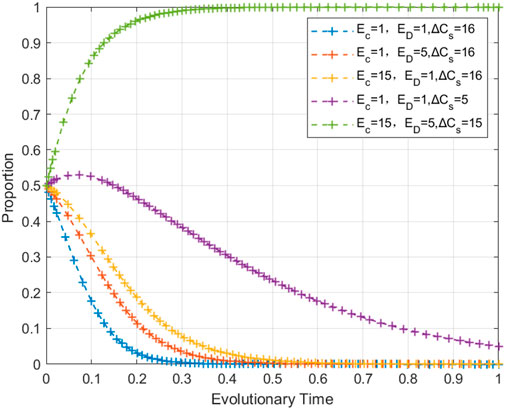
FIGURE 12. Influence of EC, ED and ΔCS on the evolution of small farmers.
Similarly, ΔHr, BD, and ΔHC are assigned separate values for the analysis, and the evolutionary results are shown in Figure 13. From the figure, it can be seen that as ΔHr and BD increase and ΔHC decreases, the cooperatives gradually evolve into the “supervision incentive” strategy. It shows that the higher the green transformation benefit of cooperatives and the greater the support benefit obtained from supervision and incentive, the more it helps cooperatives to adopt the “supervision incentive” strategy, and reducing the cost of “supervision incentive” strategy has a significant effect on cooperatives to adopt the “supervision incentive” strategy. The effect of “supervision incentive” strategy is significant. Therefore, it is suggested that the relevant government departments should give subsidies to cooperatives to improve the perceived benefits of “supervision incentive” strategy.
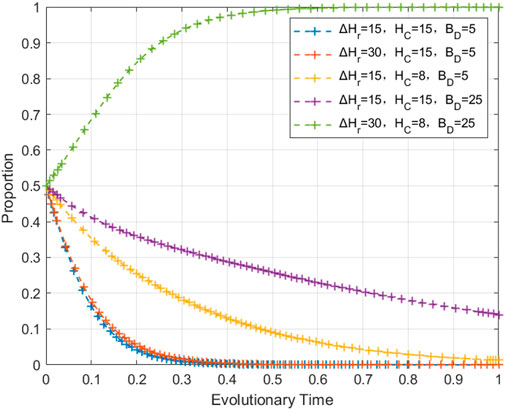
FIGURE 13. Influence of ΔHr, BD and ΔHC on the evolution of cooperatives.
In this paper, prospect theory and evolutionary game theory are introduced into the research of cooperatives leading the transformation of smallholder green production, and the development of cooperative brands, the problem of smallholder income increase, and the problem of quality regulation of agricultural products are discussed under the same framework and verified by numerical simulation. This paper is an important supplement to related research on green production of small farmers, and provides policy reference for promoting green production transformation of small farmers. Although this paper is based on the background of China, the conclusions are also applicable to other developing countries where production is carried out as a unit of small farmers. The following important conclusions are obtained.
(1) At the early stage of brand creation, small farmers tend to adopt the “no cooperation” strategy when the benefits brought by the brand are not significant, and if the cooperatives are not aware of brand protection at this time, it will increase the risk of brand creation failure. 2) Under the cooperative’s “supervisory incentive” strategy, there is an interval when small farmers adopt the “cooperative” strategy but do not achieve income increase, and the cooperative should increase the benefit distribution to small farmers during this interval. 3) Small farmers and cooperatives are sensitive to the perceived coefficient of gain α, the perceived coefficient of loss γ, and the sensitivity of risk aversion λ, which play an important role in the evolutionary outcome. 4) Reducing small farmers’ perception of green production costs, increasing small farmers’ perception of ecological and ethical benefits, and the perception of the brand bringing benefits to small farmers significantly contribute to small farmers’ adoption of cooperative strategies, while simply increasing the proportion of small farmers’ share of benefits has no significant effect on small farmers’ adoption of cooperative strategies.
To promote the transformation of smallholder green production, based on the research results, this paper puts forward the following recommendations. 1) At the government level, in the early stage of the green production transition led by cooperatives for small farmers, local governments should increase support for cooperative supervision strategies, improve the motivation of cooperative supervision and incentive strategies, and establish a long-term mechanism to help cooperatives pass the initial stage of transition. 2) At the early stage of the green production transition, cooperatives can increase the proportion of small farmers who adopt “cooperative” strategies under the initial conditions using demonstration households or party members’ demonstration; 3) In terms of quality supervision, cooperatives should spend more funds on education and training, increase ecological subsidies and reduce the perceived green production costs of small farmers, rather than simply increasing dividends. 3) In terms of quality control, cooperatives should spend more funds on education and training, increasing ecological subsidies, and reducing the cost of green production as perceived by small farmers, rather than simply increasing dividends (Wu et al., 2021).
The original contributions presented in the study are included in the article/supplementary material, further inquiries can be directed to the corresponding author.
WL wrote the first draft and revised it. ZL participated in the design of the model part and the modification.
The authors declare that the research was conducted in the absence of any commercial or financial relationships that could be construed as a potential conflict of interest.
All claims expressed in this article are solely those of the authors and do not necessarily represent those of their affiliated organizations, or those of the publisher, the editors and the reviewers. Any product that may be evaluated in this article, or claim that may be made by its manufacturer, is not guaranteed or endorsed by the publisher.
Bagheri, A., Bondori, A., Allahyari, M. S., and Damalas, C. A. (2019). Modeling farmers’ intention to use pesticides: An expanded version of the theory of planned behavior. J. Environ. Manag. 248, 109291. doi:10.1016/j.jenvman.2019.109291
Chu, Z., Bian, C., and Yang, J. (2022). How can public participation improve environmental governance in China? A policy simulation approach with multi-player evolutionary game. Environ. Impact Assess. Rev. 95, 106782. doi:10.1016/j.eiar.2022.106782
Dou, Y., Sun, X., Ji, A., Wang, Y., and Xue, X. (2021). Development strategy for prefabricated construction projects: A tripartite evolutionary game based on prospect theory. Eng. Constr. Archit. Manag. doi:10.1108/ECAM-05-2021-0455
Du, S., Liu, J., and Fu, Z. (2021). The impact of village rules and formal environmental regulations on farmers’ cleaner production behavior: New evidence from China. Int. J. Environ. Res. Public Health 18 (14), 7311. doi:10.3390/ijerph18147311
Gowda, B., Sendhil, R., Adak, T., Raghu, S., Patil, N., Mahendiran, A., et al. (2021). Determinants of rice farmers’ intention to use pesticides in eastern India: Application of an extended version of the planned behavior theory. Sustain. Prod. Consum. 26, 814–823. doi:10.1016/j.spc.2020.12.036
He, R., Jin, J., Kuang, F., Zhang, C., and Guan, T. (2020). Farmers’ risk cognition, risk preferences and climate change adaptive behavior: A structural equation modeling approach. Int. J. Environ. Res. Public Health 17 (1), 85. doi:10.3390/ijerph17010085
Hu, Z., Zhang, Q. F., and Donaldson, J. A. (2017). Farmers’ cooperatives in China: A typology of fraud and failure. China J. 78 (1), 1–24. doi:10.1086/691786
Huo, Y., Wang, J., Guo, X., and Xu, Y. (2022). The collaboration mechanism of agricultural product supply chain dominated by farmer cooperatives. Sustainability 14 (10), 5824. doi:10.3390/su14105824
Jin, J., He, R., Gong, H., and Xu, X. (2017). Farmers’ risk preferences in rural China: Measurements and determinants. Int. J. Environ. Res. Public Health 14 (7), 713. doi:10.3390/ijerph14070713
Kahneman, D., and Amos, T. (1979). Prospect theory: An analysis of decision under risk. Econometrica 47 (2), 263–291. doi:10.2307/1914185
Khan, F. Z. A., Manzoor, S. A., Akmal, M., Imran, M. U., Taqi, M., and Manzoor, S. A. (2021). Modeling pesticide use intention in Pakistani farmers using expanded versions of the theory of planned behavior. Hum. Ecol. Risk Assess. 27 (3), 687–707. doi:10.1080/10807039.2020.1750345
Li, H., Liu, Y., Zhao, X., Zhang, L., and Yuan, K. (2021). Estimating effects of cooperative membership on farmers’ safe production behaviors: Evidence from the rice sector in China. Environ. Sci. Pollut. Res. 28 (20), 25400. doi:10.1007/s11356-020-12337-z
Li, M., Wang, J., Zhao, P., Chen, K., and Wu, L. (2020). Factors affecting the willingness of agricultural green production from the perspective of farmers' perceptions. Sci. Total Environ. 738, 140289. doi:10.1016/j.scitotenv.2020.140289
Li, S., Yang, Q., Zhang, Y., and Liu, J. (2022). Multi-agent evolutionary game analysis of the coal mine on-site regulatory mode. Resour. Policy 77, 102723. doi:10.1016/j.resourpol.2022.102723
Li, Y., Fan, Z., Jiang, G., and Quan, Z. (2021). Addressing the differences in farmers’ willingness and behavior regarding developing green agriculture—a case study in xichuan county, China. Land 10 (3), 316. doi:10.3390/land10030316
Li, Z., Zhu, M., and Zuo, Q. (2022). Social network, production purpose, and biological pesticide application behavior of rice farmers. Front. Environ. Sci. 10, 380. doi:10.3389/fenvs.2022.834760
Liu, Q., Guo, Y., and JohnGiesy, P. (2015). Spatio-temporal effects of fertilization in anhui Province, China. Environ. Dev. Sustain. 17 (5), 1197–1207. doi:10.1007/s10668-014-9600-3
Liu, T., and Wu, G. (2022). Does agricultural cooperative membership help reduce the overuse of chemical fertilizers and pesticides? Evidence from rural China. Environ. Sci. Pollut. Res. 29 (5), 7972–7983. doi:10.1007/s11356-021-16277-0
Liu, Y., Sun, D., Wang, H., Wang, X., Yu, G., and Zhao, X. (2020). An evaluation of China’s agricultural green production: 1978–2017. J. Clean. Prod. 243, 118483. doi:10.1016/j.jclepro.2019.118483
Luo, L., Qiao, D., Zhang, R., Luo, C., Fu, X., and Liu, Y. (2022). Research on the influence of education of farmers’ cooperatives on the adoption of green prevention and control technologies by members: Evidence from rural China. Int. J. Environ. Res. Public Health 19 (10), 6255. doi:10.3390/ijerph19106255
Lv, L., Li, H., Wang, Z., Zhang, C., and Qiao, R. (2022). Evolutionary game analysis for rent-seeking behavior supervision of major infrastructure projects based on prospect theory. J. Civ. Eng. Manag. 28 (1), 6–24. doi:10.3846/jcem.2021.15852
Mao, H., Chai, Y., and Chen, S. (2021). Land tenure and green production behavior: Empirical analysis based on fertilizer use by cotton farmers in China. Int. J. Environ. Res. Public Health 18 (9), 4677. doi:10.3390/ijerph18094677
Marshall, P., Hirmas, A., and Singer, M. (2018). Heinrich's pyramid and occupational safety: A statistical validation methodology. Saf. Sci. 101, 180–189. doi:10.1016/j.ssci.2017.09.005
Shen, H., Peng, Y., and Guo, C. (2018). Analysis of the evolution game of construction and demolition waste recycling behavior based on prospect theory under environmental regulation. Int. J. Environ. Res. Public Health 15 (7), 1518. doi:10.3390/ijerph15071518
Shen, J., Gao, X., He, W., Sun, F., Zhang, Z., Kong, Y., et al. (2021). Prospect theory in an evolutionary game: Construction of watershed ecological compensation system in Taihu Lake Basin. J. Clean. Prod. 291, 125929. doi:10.1016/j.jclepro.2021.125929
Shen, X. (2021). Roadmap exploring for traditional family farmers entering the path on green development of agriculture. Chin. J. Agric. Resour. Regional Plan. 42 (3), 103–109.
Teng, Y., Chen, X., Yu, Z., and Wei, J. (2021). Research on the evolutionary decision-making behavior among the government, farmers, and consumers: Based on the quality and safety of agricultural products. IEEE Access 9, 73747–73756. doi:10.1109/access.2021.3078561
Teng, Y., Lin, P. W., Chen, X. L., and Wang, J. L. (2022). An analysis of the behavioral decisions of governments, village collectives, and farmers under rural waste sorting. Environ. Impact Assess. Rev. 95, 106780. doi:10.1016/j.eiar.2022.106780
Tian, Q., Yu, Y., Xiang, Z., and Li, C. (2021). Agricultural technical education, interpersonal trust, and pesticide use by vegetable farmers in China. J. Agric. Educ. Ext. 27 (2), 211–227. doi:10.1080/1389224x.2020.1844769
Wang, H. T. (2022). Analysis of a tripartite evolutionary game model of food delivery platform supervision and strategy selection. Technol. Analysis Strategic Manag., 1–17. doi:10.1080/09537325.2022.2090329
Wu, M., Liu, Y., Xu, Z., Yan, G., Ma, M., Zhou, S., et al. (2021). Spatio-temporal dynamics of China’s ecological civilization progress after implementing national conservation strategy. J. Clean. Prod. 285, 124886. doi:10.1016/j.jclepro.2020.124886
Yan, H., and Chen, Y. (2013). Debating the rural cooperative movement in China, the past and the present. J. Peasant Stud. 40 (6), 955–981. doi:10.1080/03066150.2013.866555
Ying, R., Zhou, L., Hu, W., and Pan, D. (2017). Agricultural technical education and agrochemical use by rice farmers in China. Agribusiness 33 (4), 522–536. doi:10.1002/agr.21508
Zhang, W.-X. (2020). Organic connection between small farmer production and modern agricultural development: Theoretical logic and case studies. Econ. Problems (9), 92–99. doi:10.16011/j.cnki.jjwt.2020.09.012
Zhang, Y., Sun, J., Wang, Z. R., Lin, N., Hu, Y., and Wu, L. (2021). Agricultural subsidies, production certification and green pesticide use rate: Evidence from experiments. Fresenius Environ. Bull. 30 (4), 3910–3923. doi:10.20944/preprints201902.0259.v1
Keywords: small farmers, green production transformation, prospect theory, evolutionary game, cooperatives
Citation: Liu W and Liu Z (2022) Evolutionary game analysis of green production transformation of small farmers led by cooperatives based on prospect theory. Front. Environ. Sci. 10:1041992. doi: 10.3389/fenvs.2022.1041992
Received: 12 September 2022; Accepted: 03 October 2022;
Published: 24 October 2022.
Edited by:
Ghaffar Ali, Shenzhen University, ChinaReviewed by:
Muneeb Ahmad, Sam Higginbottom University of Agriculture, Technology and Sciences, IndiaCopyright © 2022 Liu and Liu. This is an open-access article distributed under the terms of the Creative Commons Attribution License (CC BY). The use, distribution or reproduction in other forums is permitted, provided the original author(s) and the copyright owner(s) are credited and that the original publication in this journal is cited, in accordance with accepted academic practice. No use, distribution or reproduction is permitted which does not comply with these terms.
*Correspondence: Zhenya Liu, enVmZWx6eUAxMjYuY29t
Disclaimer: All claims expressed in this article are solely those of the authors and do not necessarily represent those of their affiliated organizations, or those of the publisher, the editors and the reviewers. Any product that may be evaluated in this article or claim that may be made by its manufacturer is not guaranteed or endorsed by the publisher.
Research integrity at Frontiers
Learn more about the work of our research integrity team to safeguard the quality of each article we publish.