 Zhenghai Xue
 Wenkai Feng1*
94% of researchers rate our articles as excellent or good
Learn more about the work of our research integrity team to safeguard the quality of each article we publish.
Find out more
ORIGINAL RESEARCH article
Front. Environ. Sci., 19 October 2022
Sec. Environmental Informatics and Remote Sensing
Volume 10 - 2022 | https://doi.org/10.3389/fenvs.2022.1039985
This article is part of the Research TopicAdvancement in Quantitative Risk Analysis of Geological Disaster in Reservoir AreasView all 8 articles
The correlation calculation model between landslide and mapping factors has a direct influence on the accuracy of landslide susceptibility mapping results. Using the Baihetan reservoir area as a case study, the effect of several correlation models on mapping landslide susceptibility is studied. The frequency ratio (FR) and the information value (IV) coupled BP neural network (BPNN) model was utilized to assess landslide susceptibility, with the mapping results of the single back propagation neural network (BPNN) model acting as a reference. The receiver operating characteristic (ROC) curve, the frequency ratio, and the susceptibility index distribution (mean value and standard deviation) are used to compare and assess landslide susceptibility values. The FR-BPNN coupling model is less precise than the IV-BPNN model. Findings from a single BPNN model for susceptibility mapping are less exact than those from a coupled model. Using the coupling model of the mapping factor correlation approach to assess landslide susceptibility has evident benefits, according to the study. The coupled model employing IV as the correlation method provides the most accurate and dependable susceptibility findings, and the mapping results are more consistent with the actual distribution of landslides in the study area. It can effectively direct disaster prevention efforts in the reservoir region.
Landslides are one of the most destructive geological disasters globally, as they threaten human life, the environment, resources, and property (Yang and Chen, 2010; Rotigliano et al., 2012; Bao et al., 2019; Sun et al., 2020; Xiaoyu et al., 2021). The high incidence and widespread distribution of landslides have aroused the research interest of many scientists, some of whom are committed to drawing landslide susceptibility maps (Davis, 2003; Ren and Wu, 2014). By analyzing landslide susceptibility maps, we can evaluate and locate the areas vulnerable to these events and then use this information to take appropriate precautions and reduce the negative impact of landslides. After decades of development, landslide susceptibility mapping has become one of the most important topics in international geomorphology and engineering geology (Bui et al., 2019; Liu et al., 2019; Mondal and Mandal, 2019; Monsieurs et al., 2019).
With the advent of remote sensing technologies such as InSAR, UAV, and GIS technology, the quality and availability of landslide fundamental data sources and mapping factor layer data sources have increased significantly (Kouhartsiouk and Perdikou, 2021). Typically, the selection of landslide mapping elements in the study area may be chosen by studying pertinent literature and regional environmental circumstances in the study area. According to the law of geographical similarity, which states, “the more similar the geographical environment, the more similar the geographical characteristics,” it is more likely that the spatial location of potential landslides can be predicted by analyzing the mapping factors of existing landslides and developing a landslide susceptibility model (Huang, et al., 2022).
Clearly, the key to measuring landslide susceptibility in the studied area through landslide hazard is to establish the connection between landslide susceptibility values and their mapping factors; hence, it is vital to pick the most suitable landslide mapping factor correlation method. The frequency ratio (Aemail and Lepcha, 2019), information value (Achour et al., 2017; Wubalem, 2020), probability method (Hangjian et al., 2017) and weight of evidence (WOE) (Sifa et al., 2019; Goyes-Penafiel and Hernandez-Rojas, 2021; Kontoes et al., 2021) are now the most used correlation analysis method. There is currently no clear regulation regarding which correlation analysis method to use, and different correlation analysis methods have different ideas when calculating the grading interval of each mapping factor, resulting in large uncertainty in the landslide susceptibility results obtained using different correlation analysis methods. In order to examine the impact of different correlation methods on landslide susceptibility findings, this has prompted several studies to utilize various correlation approaches with assessment models for landslide susceptibility mapping (Huang et al., 2022). For instance, Bai selected the Index of entropy (IOE) as the mapping factor correlation method coupled with random forest (RF) model to obtain the results of landslide susceptibility mapping in the Northeast Yu region. They discovered that the IOE-RF model was approximately 8% more accurate than the single RF model, demonstrating that the IOE-RF model is more accurate for landslide susceptibility mapping in Northeast Yu or similar large study areas (Zhigang et al., 2022). Huang Lixin et al. utilized the IV model as a correlation strategy in tandem with the RBF neural network (RBFNN) model to simulate landslide susceptibility in Min County, Gansu Province, and analyzed the results using receiver operating characteristic curves. Utilizing ROC (receiver operating characteristic) curves, the results were examined. The area under the curve (AUC) of the IV-RBFNN model is 0.853, which is 6.3% and 9.7% higher than the AUCs of the RBFNN and IV models, respectively, indicating that the RBFNN-IV model gives a more accurate evaluation (Lixin et al., 2021).
Rarely do researchers select two or more correlation models for comparison analysis when mapping landslide hazard. Therefore, this research focuses on mapping the effect of factor correlation approach on landslide susceptibility outcomes. The correlation method is too coarse, resulting in the loss of some information and a reduction in the accuracy of landslide susceptibility mapping results, whereas an excellent correlation method can fit the information of mapping factors affecting landslide development more reasonably and accurately, thereby increasing the dependability of landslide susceptibility models. Both the IV method and the FR method statistical analysis methods are more traditional, straightforward, and user-friendly, and they may respond more sensibly to landslide distribution features (Faming et al., 2022).
After identifying the mapping factor correlation method, the landslide susceptibility mapping model must be established, with the model’s quality directly influencing the accuracy of the mapping findings. Currently, empirical methods, statistical analysis models, physically-based models (Medina et al., 2021), and machine learning models are utilized most frequently for landslide susceptibility mapping. Early landslide susceptibility mapping made substantial use of empirical and statistical analytical methods, such as fuzzy evaluation (Zhao et al., 2017; Salcedo et al., 2018), Certainty factor (CF) model (Wei-dong et al., 2009; Chen et al., 2016) and multiple linear regression (Wenbin et al., 2021). Nowadays, back propagation neural network (BPNN) (Vahidnia Abbas and Hosseinali, 2009; Li et al., 2019; Mohammad H.; Xiong et al., 2019; Huang et al., 2022), support vector machine (SVM) (Huang and Zhao, 2018; Pham et al., 2019; Yu and Chen, 2020), logistic regression (LR) (Abeysiriwardana and Gomes, 2022; Liu et al., 2022), random forest (RF) (Zhao et al., 2020; Sun et al., 2021) and decision tree (DT) (Kadavi et al., 2019; Guo et al., 2021), and other machine learning models, have been found to be applied to regional landslide susceptibility evaluation with high accuracy and significant impact on landslide susceptibility intervals. In this research, we employ BPNN, a common machine learning model, to estimate landslide susceptibility and analyze the accuracy features of its mapping findings. The BPNN model adjusts the weights and thresholds by forward and backward propagation to learn the landslide susceptibility mapping sample data and master the inherent change law of landslides; its calculation concept is more scientific and reasonable, easy to understand and master, and can fully reflect the machine’s self-learning ability (Wu et al., 2013).
The data values of two correlation models of frequency ratio (FR) and information quantity (IV) and the original mapping factor data were used as the input layer of the BP neural network model to conduct landslide susceptibility mapping analysis using the Baihetan reservoir area as an example, and the various susceptibility results were evaluated by ROC curve, frequency ratio, and susceptibility value distribution law (mean and standard deviation).
The study area, which is located on the southeastern margin of the Qinghai-Tibetan Plateau, comprises high-elevation mountains and plateaus in southwestern Sichuan and northeastern Yunnan and is located in the wide valley reservoir section of the lower Jinsha River, 32.4–94 km from the Baihetan dam site, with an area of 583.36 km2. The valley shape is wide and forms a gentle U shape, and the bank slopes on both sides are asymmetrical. During the normal water period, the elevation of the river level is 700–630 m, and the river surface is 62–380 m wide. On both banks, the lower bank slopes (below 900 m) are gentle (generally 10°–30°), while the upper slopes (above 900 m) are steep (generally 30°–50°). The study area is composed of floodplains (floodplains and central plains are widely distributed), terraces, and platforms, and the population is relatively dense. The study area is located on the border of Sichuan and Yunnan, with the most intense human engineering activities, highly inhabited areas, and a high risk of geological disasters, making it the primary focus for the prevention and management of geological disasters in the Baihetan reservoir area.
The stratigraphic section in the study area is relatively complete. The strata include the Pre-Sinian Antong Formation (Pt2t), Sinian Dengying Formation (Zbd) and Chengjiang Formation (Zac), lower Cambrian strata (∈1), middle Cambrian Xiwangmiao Formation (∈2x) and Erdaoshui Formation (∈3e), Ordovician Qiaojia Formation (O2q) and Daqing Formation (O2d), Silurian Shimenkan Formation (S2s), upper Silurian strata (S3), Lower Devonian strata (D1), Middle Devonian Yaopengzi Formation (D2y), Upper Devonian strata (D3), lower Carboniferous strata (C1), lower Permian Liangshan Formation (P1l), lower Permian Qixia-Maokou Formation (P1q+m), upper Permian Emeishan Formation (P2β), and Quaternary deposits (Qcol+dl, Qedl, Qapl, Qal, Qpl, and Qdel).
The study area is located in the subtropical monsoon climate zone and is characterized by complex terrain and large elevation differences, forming unique climate characteristics with an obvious rainfall concentration season and a noticeable vertical climatic gradient. The steep bank slopes on both sides of the Jinsha River and the concentration of precipitation in the reservoir area result in the strong erosion of valleys, mainly the Jinsha River’s mainstream tributaries and gullies. The mainstream of the Jinsha River flows in the direction of N7°W and has three tributaries in the Baihetan Reservoir area with a length exceeding 60 km: the Heishui River enters from the left bank, while the Xiaojiang River and Yili River enter from the right bank (Yi et al., 2022). Changes in both rainfall and temperature have certain effects on runoff in the basin. The wet rainy season is concentrated from June to October, and the runoff in this season accounts for more than 80% of the runoff throughout the year. In addition, the annual variation in runoff decreases gradually from the upper reaches to the lower reaches (Figure 1).

FIGURE 1. Location of the study area. (A) Location of the Baihetan hydropower station; (B) Range of the Hulukou-Xiangbiling section in the Baihetan Reservoir area; (C) distribution of landslides in the study area.
In order to perform this study, the following information was gathered:
(1) A digital elevation model (DEM) with a 10 m resolution: The data were obtained by unmanned aerial vehicle (UAV) aerial photography and were used to extract topographic factors such as slope and aspect.
(2) 1:25,000 geological maps: These data were obtained from the National Geological Data Center (http://www.ngac.cn/) and were used to extract structural factors such as lithology and faults.
(3) 1:250,000 water system data: These data were obtained from the National Earth System Science Data Center (http://www.geodata.cn/) and were used to extract the water system evaluation factors.
(4) Land use data with a 30 m resolution: obtained from the National Geographic Information Resources Catalog Service (http://www.webmap.cn/) for extracting land use factors
(5) Data on 118 landslide disasters: These data, which are taken as the sample in this study, were derived mainly from two sources: 1) Interferometric synthetic aperture radar (InSAR) data were used to interpret deformation points, and then the landslide disaster were identified by an on-site review; 2) UAV remote sensing aerial photos were used to interpret hidden hazard points, and a thorough on-site review was conducted to determine the landslide disasters (Figure 1).
The FR and IV models are combined with the BPNN model for the process of mapping landslide susceptibility as follows (Figure 2).
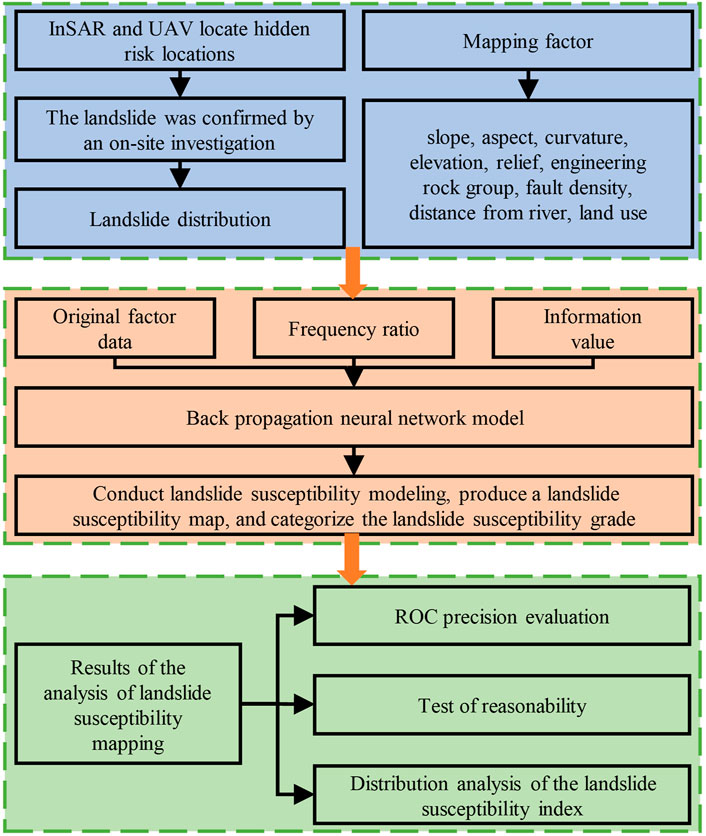
FIGURE 2. Landslide susceptibility mapping process.
(1) The geographical data set for landslide susceptibility mapping is created by obtaining landslide and related mapping factor data sources using a variety of remote sensing and field survey methods.
(2) The input layers of the BPNN model are the original mapping factor data, FR and IV, whereas the output layer indicates whether landslides occur or not.
(3) The three models undergo landslide susceptibility mapping modeling in MATLAB, and the resulting susceptibility values are loaded into ArcGIS for landslide susceptibility mapping and grade classification.
(4) ROC curve, frequency ratio, and susceptibility value distribution pattern were utilized to evaluate the results of the landslide susceptibility mapping (mean and standard deviation).
(5) Using comparison analysis to determine the optimal correlation analysis approach for susceptibility mapping.
The FR approach may reflect the distribution of landslides in different grade intervals and highlight the significance of various grade intervals in landslide development. FR > 1 indicates a high probability of landslides in the area; the larger the FR value is, the higher the probability of landslides; FR < 1 indicates a low probability of landslides in the area (Meena et al., 2019). The formula is as follows:
In Eq. 1,
The IV method is developed and derived from the combination of statistical models and information theory. The purpose of applying the information volume model to landslide susceptibility mapping is to extract the distribution of landslides in areas where landslides have occurred and convert the actual measured data in the study area into information values of quantifiable size, thereby providing a quantitative indicator of landslide susceptibility (Ge et al., 2018). The formula is as follows:
In Eq. 2,
The BPNN model has the capacity to categorize arbitrarily complex patterns and conduct exceptional multidimensional function mapping. It is composed of an input layer, a hidden layer, and an output layer, with different activation functions linking adjacent layers (Figure 3). When completing the calculation, each neuron uses the output value of the neuron in the previous layer as the input value of the neuron in this layer and processes the value according to the weights and thresholds before outputting the result of the computation to the neuron in the next layer (Wu et al., 2013; Li et al., 2019; Yu and Chen, 2020). The BPNN model facilitates machine learning by continuously adjusting weights and thresholds (Guo et al., 2020).
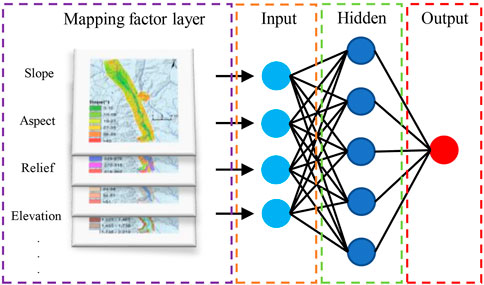
FIGURE 3. Diagrammatic representation of the BP neural network model.
The ROC curve was utilized to evaluate the precision of the mapping results for landslide susceptibility. ROC curves are extensively employed to evaluate the precision of landslide susceptibility mapping results. The horizontal axis is the false positive rate (1-specificity), the vertical axis is the true positive rate (sensitivity), and the area below the ROC curve (the AUC) can be used as an indicator for the accurate evaluation of a certain judgment method. The larger the AUC is, the higher the accuracy of the experiment and the better the prediction effect of the model (Vakhshoori and Zare, 2018; Ngo et al., 2021).
The mean value indicates the trend in a collection of data sets. Its formula is provided in (3), which illustrates the overall pattern of the distribution of landslide susceptibility values in the study region and represents the average landslide susceptibility in the study area. The standard deviation measures the distance from the mean. Its Eq. 4 represents the degree of dispersion of the value of landslide susceptibility in the study area. A smaller standard deviation implies that the values of landslide susceptibility in the study area are more concentrated around the mean value, and vice versa, which indicates that they are more dispersed. The mean and standard deviation are utilized to analyze the distribution characteristics of susceptibility values in the entire study area, reveal the prediction performance under various correlation analysis methods and model coupling models, and provide theoretical guidance for landslide susceptibility research (Huang et al., 2022).
where
From the database, nine landslide mapping factors were selected based on the characteristics of landslide distribution in the study area and a review of relevant papers (Tang et al., 2020; Yang et al., 2021). It includes 1) topographic and geomorphological factors: slope, aspect, curvature, elevation, and relief; 2) the engineering rock group factor: engineering rock group; 3) the tectonic factor: fault density; 4) the hydrological factor: distance from the river; and 5) the surface cover factor: Land use. The seven mapping factors of fault density, slope, aspect, curvature, elevation, relief, and river distance were continuous data that were classified by a certain spacing. The engineering rock group and land use type were defined based on their inherent natural grouping (Figure 4). The FR and IV at each interval are then tallied (Table 1). The index of vegetation coverage was not addressed in this study due to the lack of plant coverage on the slope surface in the study area.
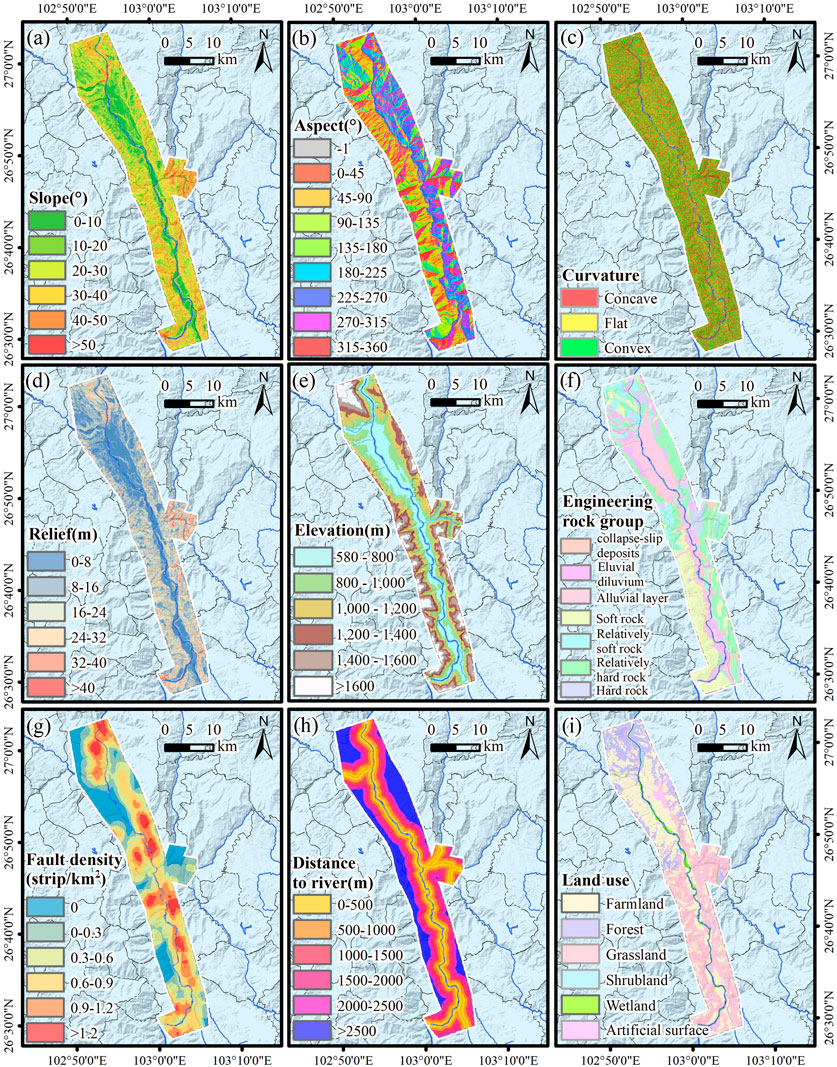
FIGURE 4. Mapping factors of landslide susceptibility in the study area. [(A) Slope; (B) Aspect; (C) Curvature; (D) Relief; (E) Elevation; (F) Engineering rock group; (G) Fault density; (H) Distance; (I) Land use].
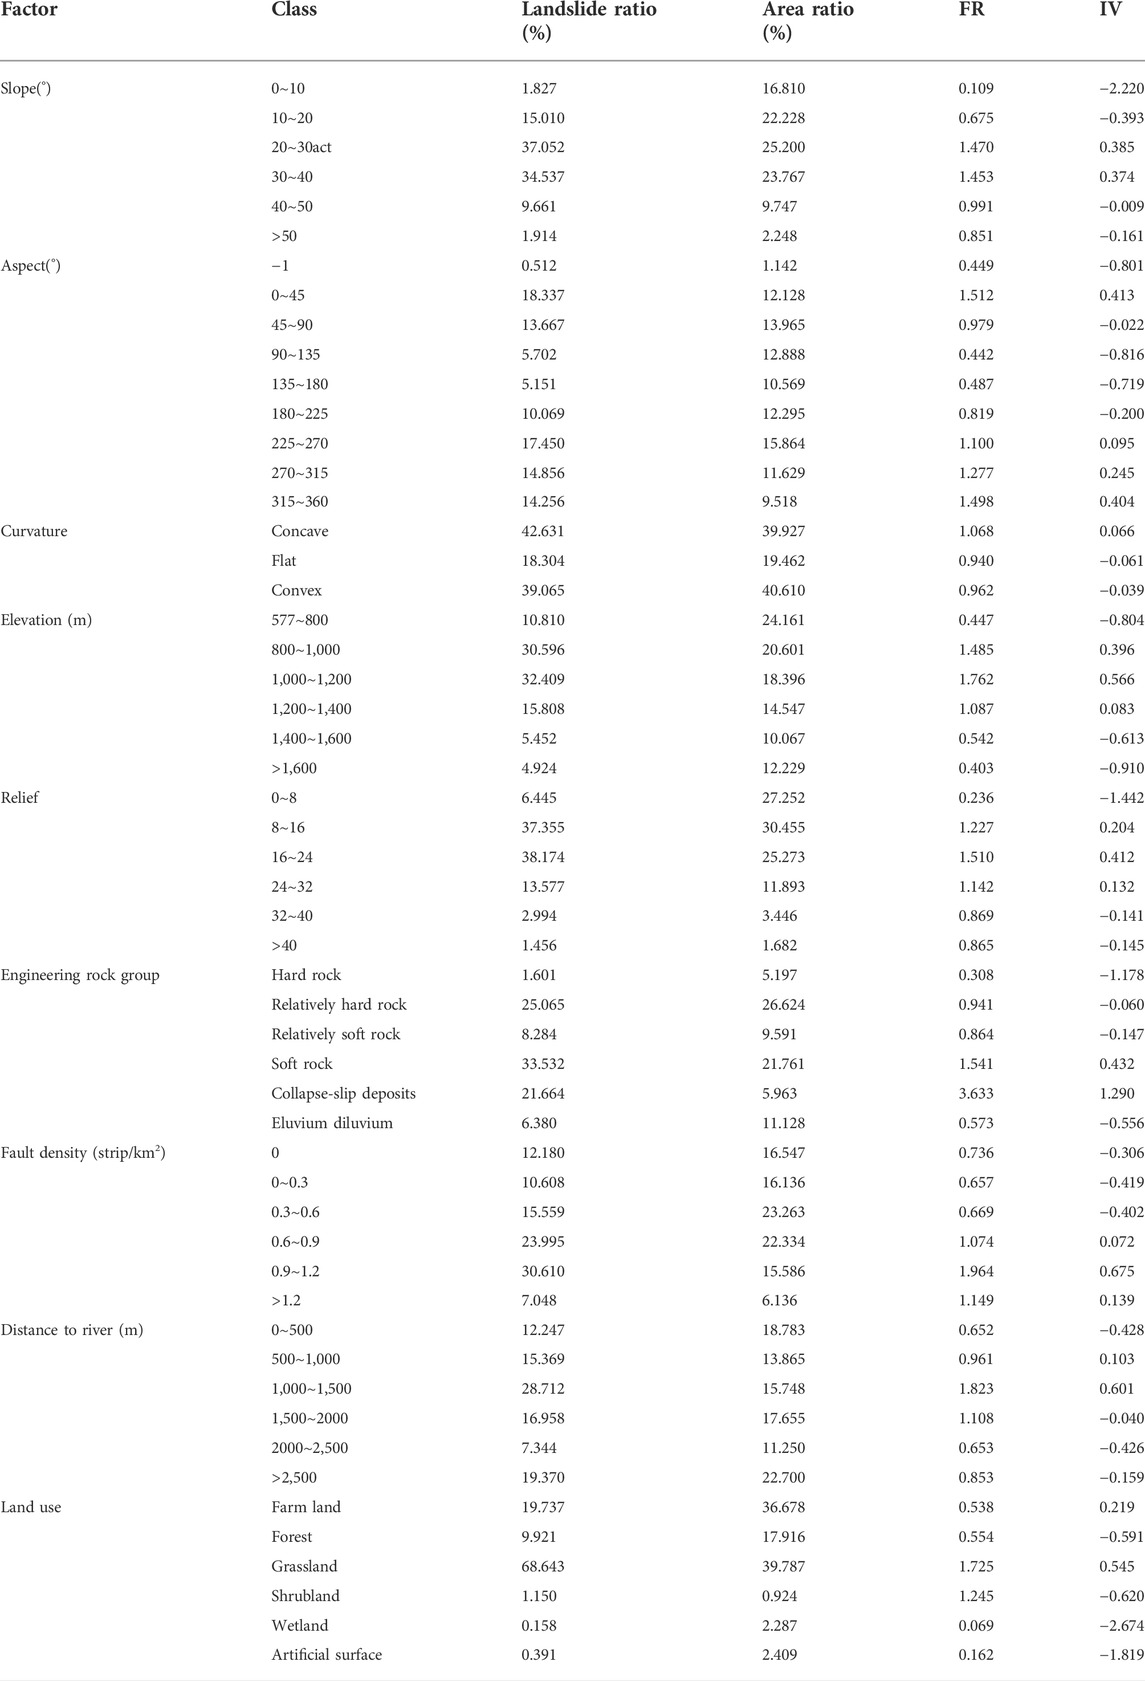
TABLE 1. Correlation values of mapping factors.
The DEM is used to derive the five mapping factors of slope, curvature, aspect, elevation, and relief. The research area was separated into six slope intervals based on the number of landslide distributions, using the slope factor (Table 1) as an example. In these six intervals, the number of landslide disasters follows the law of normal distribution, with a rise followed by a drop. IV and FR were calculated and evaluated for various slope intervals. We discovered that the majority of landslides occurred on slopes between 20° ∼ 40°, accounting for 71.58% of all landslides, and that the IV was more than 0 and the FR was bigger. The IV and FR in the 20° ∼ 30° slope interval are the greatest at 0.385 and 1.470, respectively; the IV and FR in the remaining slope intervals are less. It was consistent with the distribution of landslides that both IV and FR demonstrated a normal distribution relationship in the slope classification interval, with the center value being greater than the two sides.
Landslides are significantly influenced by the structural integrity of the rock and soil. The slopes with superior lithology are more resistant to weathering and experience less weathering, reducing the probability of deformation. As shown in Table 1, the majority of landslides (55.20%) occurred in the collapse-slip deposits and soft rock formations; the IV is greater than 0 and the FR is also greater than 1. IV and FR have the highest values in the collapse-slip accumulation layer, with respective values of 1.290 and 3.633.
The faults control not only the topography and geomorphology, but also the rock mass structure and combination features of rock formations, as well as the occurrence of landslide. In the study area, there are two big regional fault zones and several smaller faults. As a result, the fault density is used to represent the influence of tectonic factors on landslide. The fault density factor is divided into six divisions by ArcGIS. 54.70% of all landslides occur between 0.6 ∼ 1.2 faults/km2, accounting for the majority of landslides. IV and FR in the range of 0.9 ∼ 1.2 faults/km2 are the largest, with values of 0.675 and 1.964, respectively. Both IV and FR demonstrate a statistically significant positive correlation between landslides and fault density in the studied area (Table 1).
Throughout the study area are several rivers, notably the Jinsha River. Downward and lateral erosion caused by these rivers has altered the surface morphology and internal structure of the slope, thereby increasing the risk of slope instability. This time, the distance from the river is utilized to illustrate the effect of the water factor on the landslide, and ArcGIS divides the mapping factor of the distance from the river into six sections. IV is bigger than 0 and FR is also greater in the area between 500 ∼ 1,500 m. Most landslides are developed in the 1,000–1,500 m, accounting for 28.72% of the total landslides, and the IV and FR are the largest, 0.601 and 1.823, respectively. This is because of the river’s downerosion action, which causes the higher section of the slope body to be worn and stripped of vegetation first (Table 1).
Different forms of slope surface cover have a significant impact on the weathering and erosion of the slope. The study area is divided into six groups based on its actual surface cover: farmland, forest, grassland, shrubland, wetland, and artificial surface. Table 1 demonstrates that 68.64% of all landslides occurred on grassland, with the IV and FR being the greatest, 0.545 and 1.725, respectively.
The mapping factors and landslide surface data for the study area were divided into layers with a 10 m resolution. Using the IV correlation method as an example, the specific steps of landslide susceptibility mapping in the studied area are as follows:
(1) Using ArcGIS, 250 landslide sample points and the same number of nonlandslide sample points were randomly selected from polygon files of 118 landslides and the nonlandslide area, respectively. Then, the IV of each mapping factor is distributed to each sample point to obtain 500 samples with independent properties.
(2) 500 samples of data were imported into MATLAB, the IV with 9 mapping factors was used as the input layer, and landslide status was utilized as the output layer (the landslide is assigned “1”, the nonlandslide is assigned “0”). The number of neurons in the hidden layer was seven (this time α = 4) and was calculated by a Eq. 5:
In Eq. 5, m is the number of neurons in the hidden layer; n is the number of neurons in the input layer; l is the number of neurons in the output layer; and α is a constant between 1 and 10.
(3) Seventy percent of the sample data is utilized for training, whereas thirty percent are used for testing. Then, logsig and purelin are selected as activation functions with the training number set to 10,000, the learning rate set to 0.001, and the minimal training goal error set to 0.001. Finally, MATLAB is used to calculate the BPNN model.
(4) The IV of the raster data points in the study area is included into the trained BPNN model to determine the values of landslide susceptibility. The modeling procedures and parameter configurations of the FR-BPNN and BPNN models are essentially identical to those of the IV-BPNN model.
After importing the landslide susceptibility values predicted by the three models into ArcGIS, the natural interval method was used to classify the landslide susceptibility values in the study area into four classes: low, medium, high, and very high. The landslide susceptibility findings of the IV-BPNN model, FR-BPNN model, and BPNN model (Figure 5) were the result of the aforementioned procedures (Huang et al., 2022).
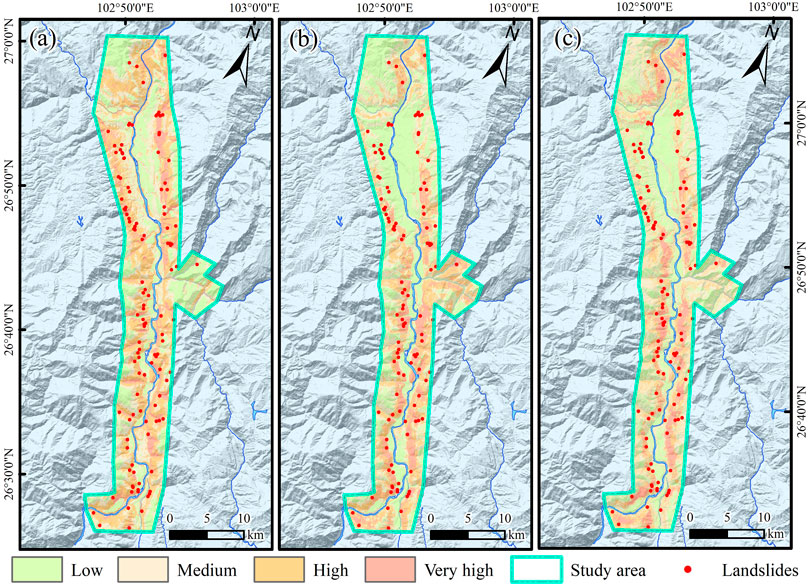
FIGURE 5. Landslide susceptibility mapping results. [(A) BPNN; (B) FR-BPNN; (C) IV-BPNN).
Comparing the mapping results of the three models, the following can be observed:
(1) The very high-susceptibility areas are mostly concentrated in areas with steep slopes and in densely faulted areas, but the susceptibility is also greatly affected by the softness of the engineering rock group. There are two reasons for this in terms of slope: first, in areas with steeper slopes, there is a large shear stress concentration at the foot of the slope; second, the slope restricts the redistribution of surface material and energy to different degrees and controls surface runoff, the thickness of loose material on the slope, and the recharge and discharge of groundwater on the slope. Hence, the steeper the slope is, the greater the possibility of displacement of loose rock and soil on the surface under the hydrodynamic and self-weight conditions and the greater the probability of a landslide. Moreover, on the one hand, fracture zones can trigger landslide disasters; on the other hand, unconformities (structural planes such as fault planes and joint planes) within the geological structure provide the geomorphological conditions necessary for the occurrence of landslides. Thus, under different engineering rock group conditions, collapse-slip deposits and soft rock formations significantly reduce the stability of the slope, facilitating the formation of landslides under the combined action of weathering, earthquakes, and other external factors.
(2) Comparing Figure 5 shows that the landslide susceptibility findings of the three prediction models are distinct; yet, the vast majority of the 118 actual landslides in the study area fall into the very high and high susceptibility areas of the three prediction models. This displays the accuracy of the three models’ mapping results for landslide susceptibility.
The area under the ROC curve (AUC value) was used to evaluate the accuracy of the evaluation of the landslide susceptibility results of various models (Zhao et al., 2022). The greater the AUC number, the more accurate the model’s predictions.
In this study, 500 sample points were randomly picked from the landslide surface file, and an equal number were randomly selected from the non-landslide area. The ROC curve was analyzed using a total of 1,000 independent samples. The ROC curves of the landslide susceptibility results for the BPNN model, the FR-BPNN model, and the IV-BPNN model are depicted in Figure 6.
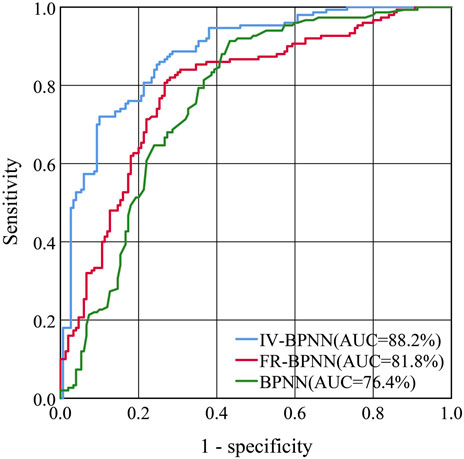
FIGURE 6. ROC curve of landslide susceptibility results.
Figure 6 demonstrates that the susceptibility results predicted by the three models are realizable. The AUC value is in the order of AUC (IV-BPNN) > AUC (FR-BPNN) > AUC (BPNN), which suggests that the coupled model has higher accuracy and better effect than the single BPNN model. At the same time, the IV-BPNN model achieves superior results for landslide susceptibility, and its AUC value is 6.4% higher than that of the FR-BPNN model and 11.8% higher than the value of the single BPNN model.
The frequency ratio represents the density of landslides in different sections prone to landslides in each model, and the findings are displayed in Table 2.
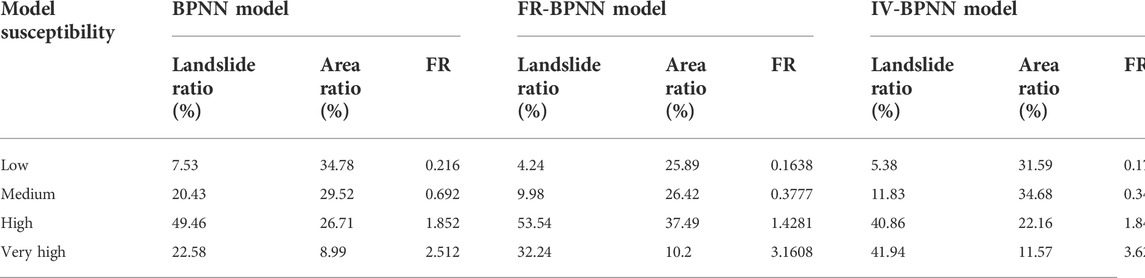
TABLE 2. Frequency ratio of each model’s susceptibility area.
According to Table 2, the frequency ratio of the very high and high susceptibility areas for landslides is greater than 1, but the results of the medium and low susceptibility areas are less than 1. The data level indicates that the landslide susceptibility results of the three models are accurate, and the landslides are primarily dispersed in very high and high susceptibility areas, which is compatible with the susceptibility map’s results. It can also be concluded that the frequency ratio of very high susceptibility areas in the IV-BPNN model is 1.112 and 0.4632 greater than the results of the BPNN model alone and the FR-BPNN model, respectively, indicating that the landslide susceptibility results of the IV-BPNN model are superior to those of the other two models.
The mean and standard deviation are utilized to represent the average and dispersion of landslide susceptibility values in the study area, respectively, and to evaluate the uncertainty of landslide susceptibility mapping for different models (Huang et al., 2022).
Figure 7 depicts the distribution, mean, and standard deviation of landslide susceptibility values in the study area. Figure 7 demonstrates that the distribution laws of the landslide susceptibility values of the BPNN model, the FR-BPNN model, and the IV-BPNN model are comparable and are concentrated in the middle susceptibility area with a normal distribution. The mean value of landslide susceptibility was BPNN (0.48) > IV-BPNN (0.43) > FR-BPNN (0.42); the standard deviation from large to small was IV-BPNN (0.149) > FR-BPNN (0.131) > BPNN (0.124). Additionally, the IV-BPNN model has a smaller very high susceptibility area than the other two models, but it has the highest accuracy. The IV-BPNN model’s landslide susceptibility values have smaller mean values and the largest standard deviation and reflect more landslides with fewer high susceptibility areas, indicating that this model can more effectively identify landslides in the study area and produce more differentiated landslide susceptibility results. Therefore, the uncertainty analysis concludes that the IV-BPNN model delivers much improved susceptibility outcomes compared to the other two models.
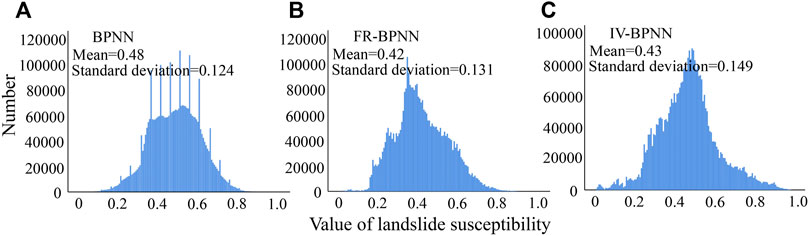
FIGURE 7. Distribution of landslide susceptibility values.
The mapping factor correlation method reflects quantitatively or approximates the effect of different sections of each mapping factor on landslide susceptibility. IV can more precisely reflect the influence of varied intervals of mapping factors on landslides and has a greater AUC value (88.2%) in correlation analysis-based susceptibility mapping compared to FR. Based on the original mapping factor data, the BPNN model yields the least precise susceptibility mapping results.
In terms of landslide susceptibility, the frequency ratio of the IV correlation analysis model in the very high susceptibility area is the greatest at 3.624, while the frequency ratio of the BPNN model alone is the lowest in the very high susceptibility area. In addition, the comparison of the mean and standard deviation demonstrates that the IV-BPNN and FR-BPNN models are far better to the BPNN model. Because the coupling model organically combines the landslide and its mapping factors, it accurately reflects the influence of the mapping factors on the landslide, making the landslide susceptibility value more closely related to the existing landslide hazards and resulting in more reasonable evaluation results. In contrast, the correlation method using the IV method as the mapping factor yields superior results for landslide susceptibility than the FR method.
(1) The precision and uncertainty of the mapping results of the BPNN model using the original data as the input layer are demonstrably lower than those of the coupling model employing the mapping factor correlation method. Consider using a single assessment method for susceptibility mapping to expedite your investigation and obtain landslide susceptibility data quickly. However, if the distribution relationship between landslides and their mapping factors in each interval is to be reflected, the coupling model connected by the mapping factor correlation method should be considered to improve the precision of the evaluation.
(2) The IV as the correlation analysis method produced the most accurate landslide susceptibility mapping results, as its AUC value (88.2%) was much higher than that of the FR-BPNN model (81.8%) and its frequency ratio of very high susceptibility areas was greater than that of the FR-BPNN model. The IV-BPNN model has the lowest mean and the greatest standard deviation. Thus, IV can strengthen the correlation between landslides and their mapping factors.
(3) In conclusion, the coupled model using IV as the correlation method has the best accuracy and reliability of susceptibility results, and the mapping results are more comparable with the actual distribution of landslides in the study area. It can effectively direct disaster prevention efforts in the reservoir region.
The datasets presented in this study can be found in online repositories. The names of the repository/repositories and accession number(s) can be found in the article/supplementary material.
All authors listed have made a substantial, direct, and intellectual contribution to the work and approved it for publication.
This research was funded by the National Natural Science Foundation of China (Grant No. 41977252), the State Key Laboratory of Geohazard Prevention and Geoenvironment Protection Independent Research Project (Grant No. SKLGP 2020Z001) and the Zhejiang Huadong Construction Engineering Co., Ltd. Research Project (KY2020-HDJS-19).
Author MT was employed by the Zhejiang Huadong Construction Engineering Co., Ltd.
The remaining authors declare that the research was conducted in the absence of any commercial or financial relationships that could be construed as a potential conflict of interest.
The authors declare that this study received funding from Zhejiang Huadong Construction Engineering Co., Ltd. The funder was not involved in the study design, collection, analysis, interpretation of data, the writing of this article, or the decision to submit it for publication.
All claims expressed in this article are solely those of the authors and do not necessarily represent those of their affiliated organizations, or those of the publisher, the editors and the reviewers. Any product that may be evaluated in this article, or claim that may be made by its manufacturer, is not guaranteed or endorsed by the publisher.
Abeysiriwardana, H. D., and Gomes, P. I. A. (2022). Integrating vegetation indices and geo-environmental factors in GIS-based landslide-susceptibility mapping: Using logistic regressionusing logistic regression. J. Mt. Sci. 19 (2), 477–492. doi:10.1007/s11629-021-6988-8
Achour, Y., Boumezbeur, A., Hadji, R., Chouabbi, A., Cavaleiro, V., and Bendaoud, E. A. (2017). Landslide susceptibility mapping using analytic hierarchy process and information value methods along a highway road section in constantine, Algeria. Arab. J. Geosci. 10 (8), 194. doi:10.1007/s12517-017-2980-6
Aemail, G. D., and Lepcha, K. (2019). Application of logistic regression (lr) and frequency ratio (fr) models for landslide susceptibility mapping in relli khola river basin of darjeeling himalaya, India. SN Appl. Sci. 1 (11), 1453. doi:10.1007/s42452-019-1499-8
Bao, Y., Zhai, S., Chen, J., Xu, P., Zhou, X., Zhan, J., et al. (2019). The evolution of the samaoding paleolandslide river blocking event at the upstream reaches of the jinsha river, Tibetan plateau. Geomorphology 351, 106970. doi:10.1016/j.geomorph.2019.106970
Bui, D. T., Shahabi, H., Omidvar, E., Shirzadi, A., Geertsema, M., Clague, J. J., et al. (2019). Shallow landslide prediction using a novel hybrid functional machine learning algorithm. Remote Sens. 11 (8), 931. doi:10.3390/rs11080931
Chen, W., Li, W., Chai, H., Hou, E., Li, X., and Ding, X. (2016). Retracted article: GIS-based landslide susceptibility mapping using analytical hierarchy process (AHP) and certainty factor (CF) models for the baozhong region of baoji city, China. Environ. Earth Sci. 75 (1), 3951. doi:10.1007/s12665-014-3749-9
Davis, G. C. O. A., and Davis, J. C. (2003). Using multiple logistic regression and gis technology to predict landslide hazard in northeast Kansas, USA. Eng. Geol. 69 (3-4), 331–343. doi:10.1016/s0013-7952(03)00069-3
Faming, H., Yu, S., Weiping, O., Anyu, H., Ziqiang, Z., and Fugang, X. (2022). Landslide susceptibility prediction modeling based on weight of evidence and chi-square automatic interactive detection. J. Civ. Environ. Eng. 44 (05), 16–28.
Ge, Y., Chen, H., Zhao, B., Tang, H., Lin, Z., Xie, Z., et al. (2018). A comparison of five methods in landslide susceptibility assessment: A case study from the 330-kv transmission line in gansu region, China. Environ. Earth Sci. 77 (19), 662. doi:10.1007/s12665-018-7814-7
Goyes-Peñafiel, P., and Hernandez-Rojas, A. (2021). Landslide susceptibility index based on the integration of logistic regression and weights of evidence: A case study in popayan, Colombia. Eng. Geol. 280, 105958. doi:10.1016/j.enggeo.2020.105958
Guo, Z., Chen, L., Gui, L., Du, J., Yin, K., and Do, H. (2020). Landslide displacement prediction based on variational mode decomposition and WA-GWO-BP model. Landslides 17 (3), 567–583. doi:10.1007/s10346-019-01314-4
Guo, Z., Shi, Y., Huang, F., Fan, X., and Huang, J. (2021). Landslide susceptibility zonation method based on c5.0 decision tree and k-means cluster algorithms to improve the efficiency of risk management. Geosci. Front. 12 (6), 101249–101267. doi:10.1016/j.gsf.2021.101249
Hangjian, F., Aiguo, Z., Xiaoming, T., Shengyi, Y., and Xinghua, X. (2017). Susceptibility analysis of factors controlling rainfall-triggered landslides using certainty factor method. J. Eng. Geol. 25 (02), 436–446.
Huang, F., Yan, J., Fan, X., Yao, C., Huang, J., Chen, W., et al. (2022). Uncertainty pattern in landslide susceptibility prediction modellingeffects of different landslide boundaries and spatial shape expressions. Geosci. Front. 13 (2), 68–83.
Huang, J., Zeng, X., Ding, L., Yin, Y., and Li, Y. (2022). Landslide susceptibility evaluation using different slope units based on bp neural network. Comput. Intell. Neurosci. 2022, 1–15. doi:10.1155/2022/9923775
Huang, Y., and Zhao, L. (2018). Review on landslide susceptibility mapping using support vector machines. Catena 165, 520–529. doi:10.1016/j.catena.2018.03.003
Kadavi, P. R., Lee, C.-W., and Lee, S. (2019). Landslide-susceptibility mapping in gangwon-do, South Korea, using logistic regression and decision tree models. Environ. Earth Sci. 78 (4), 116. doi:10.1007/s12665-019-8119-1
Kontoes, C. C., Loupasakis, C. J., Papoutsis, I., Alatza, S., Poyiadji, E., Ganas, A., et al. (2021). Landslide susceptibility mapping of central and Western Greece, combining ngi and woe methods, with remote sensing and ground truth data. Land 10 (4), 402. doi:10.3390/land10040402
Kouhartsiouk, D., and Perdikou, S. (2021). The application of dinsar and bayesian statistics for the assessment of landslide susceptibility. Nat. Hazards (Dordr). 105 (3), 2957–2985. doi:10.1007/s11069-020-04433-7
Li, D., Huang, F., Yan, L., Cao, Z., Chen, J., and Ye, Z. (2019). Landslide susceptibility prediction using particle-swarm-optimized multilayer perceptron: Comparisons with multilayer-perceptron-only, bp neural network, and information value models. Appl. Sci. 9 (18), 3664. doi:10.3390/app9183664
Liu, L., Li, S., Li, X., Jiang, Y., Wei, W., Wang, Z., et al. (2019). An integrated approach for landslide susceptibility mapping by considering spatial correlation and fractal distribution of clustered landslide data. Landslides 16 (4), 715–728. doi:10.1007/s10346-018-01122-2
Liu, Y., Zhao, L., Bao, A., Li, J., and Yan, X. (2022). Chinese high resolution satellite data and gis-based assessment of landslide susceptibility along highway g30 in guozigou valley using logistic regression and maxent model. Remote Sens. 14, 3620. doi:10.3390/rs14153620
Lixin, H., Junming, H., Wangping, L., Zhaoye, Z., and Peiqian, J. (2021). Landslide susceptibility assessment by the coupling method of rbf neural network and information value: A case study in min xiangansu province. Chin. J. Geol. hazards Prev. 32 (6), 116–126.
Medina, V., Hü Rlimann, M., Guo, Z., Lloret, A., and Vaunat, J. (2021). Fast physically-based model for rainfall-induced landslide susceptibility assessment at regional scale. Catena 201, 105213–213. doi:10.1016/j.catena.2021.105213
Meena, S. R., Ghorbanzadeh, O., and Blaschke, T. (2019). A comparative study of statistics-based landslide susceptibility models: A case study of the region affected by the gorkha earthquake in Nepal. ISPRS Int. J. Geoinf. 8 (2), 94–110. doi:10.3390/ijgi8020094
Mondal, S., and Mandal, S. (2019). Landslide susceptibility mapping of Darjeeling Himalaya, India using index of entropy (IOE) model. Appl. Geomat. 11 (2), 129–146. doi:10.1007/s12518-018-0248-9
Monsieurs, E., Dewitte, O., and Demoulin, A. (2019). A susceptibility-based rainfall threshold approach for landslide occurrence. Nat. Hazards Earth Syst. Sci. 19 (4), 775–789. doi:10.5194/nhess-19-775-2019
Ngo, P. T. T., Panahi, M., Khosravi, K., Ghorbanzadeh, O., Kariminejad, N., Cerda, A., et al. (2021). Evaluation of deep learning algorithms for national scale landslide susceptibility mapping of Iran. Geosci. Front. 12 (2), 505–519. doi:10.1016/j.gsf.2020.06.013
Pham, B. T., Prakash, I., Khosravi, K., Chapi, K., Trinh, P. T., Ngo, T. Q., et al. (2019). A comparison of support vector machines and bayesian algorithms for landslide susceptibility modelling. Geocarto Int. 34 (13), 1385–1407. doi:10.1080/10106049.2018.1489422
Ren, F., and Wu, X. (2014). Gis-based landslide susceptibility mapping using remote sensing data and machine learning methods. Springer Berlin Heidelberg, 319–333.
Rotigliano, E., Cappadonia, C., Conoscenti, C., Costanzo, D., and Agnesi, V. (2012). Slope units-based flow susceptibility model: Using validation tests to select controlling factors. Nat. Hazards (Dordr). 61 (1), 143–153. doi:10.1007/s11069-011-9846-0
Salcedo, D., Almeida, O. P., Morales, B., and Toulkeridis, T. (2018). Landslide susceptibility mapping using fuzzy logic and multi_criteria evaluation techniques in the city of quito, Ecuador. Nat. Hazards Earth Syst. Sci. Discuss., 1–33.
Sifa, S. F., Mahmud, T., Tarin, M. A., and Haque, D. M. E. (2019). Event-based landslide susceptibility mapping using weights of evidence (woe) and modified frequency ratio (mfr) model: A case study of rangamati district in Bangladesh. Geol. Ecol. Landscapes 0 (0), 222–235. doi:10.1080/24749508.2019.1619222
Sun, D., Shi, S., Wen, H., Xu, J., Zhou, X., and Wu, J. (2021). A hybrid optimization method of factor screening predicated on geodetector and random forest for landslide susceptibility mapping. Geomorphology 379, 107623. doi:10.1016/j.geomorph.2021.107623
Sun, X., Chen, J., Han, X., Bao, Y., Zhan, J., and Peng, W. (2020). Application of a gis-based slope unit method for landslide susceptibility mapping along the rapidly uplifting section of the upper jinsha river, south-Western China. Bull. Eng. Geol. Environ. 79 (1), 533–549. doi:10.1007/s10064-019-01572-5
Tang, Y. M., Feng, F., Guo, Z., Feng, W., Li, Z., Wang, J., et al. (2020). Integrating principal component analysis with statistically-based models for analysis of causal factors and landslide susceptibility mapping: A comparative study from the loess plateau area in shanxi (China). J. Clean. Prod. 277, 124159. doi:10.1016/j.jclepro.2020.124159
Vahidnia Abbas, Mohammad H. A. A. A., and Hosseinali, F. (2009). Design and development of an intelligent extension for mapping landslide susceptibility using artificial neural network. Lect. Notes Comput. Sci. 5592 (1), 17–32.
Vakhshoori, V., and Zare, M. (2018). Is the roc curve a reliable tool to compare the validity of landslide susceptibility maps? Geomat. Nat. Hazards Risk 9 (1), 249–266. doi:10.1080/19475705.2018.1424043
Wei-dong, W., Yan-ping, C., and Sheng, Z. (2009). Landslides susceptibility mapped with cf and logistic regression model. J. Central South Univ. Sci. Technol. 40 (4), 1127–1132.
Wenbin, L., Xuanmei, F., Faming, H., Xueling, W., Kunlong, Y., and Zhilu, C. (2021). Uncertainties of landslide susceptibility modeling under different environmental factor connections and prediction models. Earth Sci. 46 (10), 3777–3795.
Wu, X., Niu, R., Ren, F., and Peng, L. (2013). Landslide susceptibility mapping using rough sets and back-propagation neural networks in the three gorges, China. Environ. Earth Sci. 70 (3), 1307–1318. doi:10.1007/s12665-013-2217-2
Wubalem, A. (2020). Modeling of landslide susceptibility in a part of abay basin, northwestern Ethiopia. Open Geosci. 12 (1), 1440–1467. doi:10.1515/geo-2020-0206
Xiaoyu, Y., Wenkai, F., Huilin, B., Shen, H., and Haobin, L. (2021). Catastrophic landslide triggered by persistent rainfall in sichuan, China: August 21, 2020, zhonghaicun landslide. Landslides 18 (8), 2907–2921. doi:10.1007/s10346-021-01701-w
Xiong, J., Sun, M., Zhang, H., Cheng, W., Yang, Y., Sun, M. P., et al. (2019). Application of the levenburg–marquardt back propagation neural network approach for landslide risk assessments. Nat. Hazards Earth Syst. Sci. 19 (3), 629–653. doi:10.5194/nhess-19-629-2019
Yang, X., and Chen, L. (2010). Using multi-temporal remote sensor imagery to detect earthquake-triggered landslides. Int. J. Appl. Earth Obs. Geoinf. 12 (6), 487–495. doi:10.1016/j.jag.2010.05.006
Yang, X., Liu, R., Yang, M., Chen, J., Liu, T., Yang, Y., et al. (2021). Incorporating landslide spatial information and correlated features among conditioning factors for landslide susceptibility mapping. Remote Sens. 13 (11), 2166. doi:10.3390/rs13112166
Yi, X., Feng, W., Wu, M., Ye, Z., Fang, Y., Wang, P., et al. (2022). The initial impoundment of the baihetan reservoir region (China) exacerbated the deformation of the wangjiashan landslide: Characteristics and mechanism. Landslides 19 (8), 1897–1912. doi:10.1007/s10346-022-01898-4
Yu, C., and Chen, J. (2020). Landslide susceptibility mapping using the slope unit for southeastern helong city, jilin province, China: A comparison of ann and svm. Symmetry 12 (6), 1047. doi:10.3390/sym12061047
Zhao, H., Yao, L., Mei, G., Liu, T., and Ning, Y. (2017). A fuzzy comprehensive evaluation method based on ahp and entropy for a landslide susceptibility map. Entropy 19 (8), 396–416. doi:10.3390/e19080396
Zhao, L., Wu, X., Niu, R., Wang, Y., and Zhang, K. (2020). Using the rotation and random forest models of ensemble learning to predict landslide susceptibility. Geomatics, Nat. Hazards Risk 11 (1), 1542–1564. doi:10.1080/19475705.2020.1803421
Zhao, Z., He, Y., Yao, S., Yang, W., Wang, W., Zhang, L., et al. (2022). A comparative study of different neural network models for landslide susceptibility mapping. Adv. Space Res. 70 (2), 383–401. doi:10.1016/j.asr.2022.04.055
Keywords: landslide susceptibility, correlation analysis, frequency ratio model, information value model, back propagation neural network model
Citation: Xue Z, Feng W, Li B, Zhou Y, Yi X and Wu M (2022) Landslide susceptibility mapping based on the coupling of two correlation methods and the BP neural network model: A case study of the Baihetan Reservoir area, China. Front. Environ. Sci. 10:1039985. doi: 10.3389/fenvs.2022.1039985
Received: 08 September 2022; Accepted: 04 October 2022;
Published: 19 October 2022.
Edited by:
Chao Zhou, China University of Geosciences Wuhan, ChinaReviewed by:
Polina Lemenkova, Université libre de Bruxelles, BelgiumCopyright © 2022 Xue, Feng, Li, Zhou, Yi and Wu. This is an open-access article distributed under the terms of the Creative Commons Attribution License (CC BY). The use, distribution or reproduction in other forums is permitted, provided the original author(s) and the copyright owner(s) are credited and that the original publication in this journal is cited, in accordance with accepted academic practice. No use, distribution or reproduction is permitted which does not comply with these terms.
*Correspondence: Wenkai Feng, ZmVuZ3dlbmthaUBjZHV0LmNu
Disclaimer: All claims expressed in this article are solely those of the authors and do not necessarily represent those of their affiliated organizations, or those of the publisher, the editors and the reviewers. Any product that may be evaluated in this article or claim that may be made by its manufacturer is not guaranteed or endorsed by the publisher.
Research integrity at Frontiers
Learn more about the work of our research integrity team to safeguard the quality of each article we publish.