 Peiwen Ding
 Yuhan Zhang3
 Lei Zhou
- 1School of Economics and Management, Northwest University, Xi’an, Shaanxi, China
- 2China Railway First Survey and Design Institute Group Co., Ltd., Xi’an, Shaanxi, China
- 3The Center for Economic Research, Shandong University, Jinan, Shandong, China
Grassroots environmental protection agencies are the “last kilometer” of environmental supervision in China, but the effects of these agencies have not received sufficient attention from the economic community. This paper adopts the synthetic control method to estimate the impact of establishing grassroots environmental protection agencies on industrial pollution discharge. The results show that establishing grassroots environmental protection agencies reduces industrial pollution discharge, but the effects are only statistically significant in some regions. In addition, grassroots environmental protection agencies do not significantly impact local economic growth and the economic structure. Grassroots environmental protection agencies generally have problems such as inadequate managerial staff, which may cause the failure in fully executing their functions. The overall promotion of grassroots environmental protection work can hardly be facilitated by the government before these problems are resolved.
1 Introduction
China has witnessed rapid economic growth since the beginning of reform and opening up. From 1991 to 2019, its GDP growth rate remained above six percent. However, environmental problems are becoming more severe despite brisk economic development. According to the Environmental Performance Index (EPI) 2020, China was ranked 120th out of 180 countries. In addition, it was ranked 137 and 1471,2 in terms of air quality and prevalence of PM2.5, respectively, suggesting a daunting challenge to environmental remediation. Environmental pollution not only reduces the productivity of enterprises and misallocates resources, thus affecting sustainable development, but also negatively impacts people’s physical and mental health (Yin et al., 2020; Xie et al., 2021; Wang et al., 2022). It is urgent for China to solve the problem of environmental pollution, increase the impetus for green economic development and promote quality-oriented economic growth. Therefore, the Chinese government has formulated a raft of environmental management policies in the past two decades. In addition to direct policies issued by the central government, such as environment-related laws and the “two control zone” policy, there are also pioneering policies implemented by local authorities, such as the river chief system and watershed eco-compensation.
Related studies have also shown that environmental governance policies play a pivotal role in energy conservation, emission reduction and environmental improvement (Cheng et al., 2017; Gu et al., 2022). In previous studies, scholars have focused on the economic effects of environmental governance policies and their impact on economic growth. Jefferson et al. (2013), Lu et al. (2012), Hering and Poncet (2014), and Tang et al. (2020) focused on the economic effects of environmental governance policies and investigated the impact of the “two control zone” policy on industrial performance, FDI, exports, and total factor productivity respectively. In addition, the relationship between environmental regulation and economic growth has also been an important issue that scholars study, but the academic community has not yet come to consensus about the relationship between them. Developing countries are faced with the problem of balancing economic development and environmental protection. Systematic analysis of the relationship between the two is of great significance for the formulation and implementation of national environmental regulation policies. Grossman and Krueger (1995) proposed the famous environmental Kuznets curve—an inverted U-shaped relationship between environmental pollution and economic development. Since then, there have been two different views on the impact of environmental regulation on economic growth. Some argue that environmental regulation does not hinder economic development and can achieve a win‒win situation between environmental protection and economic development (Testa et al., 2011; Cao and You, 2017). Others hold that environmental regulation harms economic growth (Greenstone et al., 2012; Cai et al., 2016; Deng et al., 2019). Other studies have shown that the type and rationality of environmental regulation determine its impact on the economy (Liu et al., 2021).
In addition to the above research, scholars have also conducted in-depth research on environmental policy on water pollution and air pollution. With the release of the industrial enterprise pollution discharge database established by the Ministry of Ecology and Environment of China, the data and methods used for environmental pollution research have made further breakthroughs, yielding new research on water pollution. Studies have been conducted on wastewater discharge standards in the Taihu Lake region (Liu et al., 2017), the (NSMF) program (Zhang et al., 2018), river water quality monitoring stations (He et al., 2020), and many other environmental protection policies. Likewise, there is a growing number of studies in other countries. For example, Greenstone and Hanna (2014) found that the National River Conservation Plan had not made an outstanding contribution to environmental improvement, and Keiser and Shapiro (2019) argued that the Clean Water Act in the U.S. had reduced pollutant levels in rivers and led to an increase in housing prices. Both are classic studies in this field. Related research on air pollution is also increasing. Dong et al. (2019) used the spatial econometric method to explore the spatial spillover effects and spatial distribution characteristics of PM10 pollution concentrations. Some scholars have found that the PM2.5 emissions have a Kuznets-style, inverted U-shaped relationship with economic growth (Dong et al., 2018a), and environmental protection measures such as national air quality monitoring have a significant impact on PM2.5 emission reduction, which is heterogeneous in accordance with the variety of the economic levels of different regions (Liu et al., 2021).
Based on the literature, we find that many scholars study the impact of environmental regulation measures on environmental pollution and economic growth. However, an increasing number of grassroots environmental protection agencies in China in recent years have not received sufficient attention from the academic community. Grassroots environmental protection agencies3 are China’s “last kilometer” of environmental supervision and are responsible for inspection, supervision, publicity, and education. These agencies play a crucial role in environmental protection and improvement in China. At the national level, the central government has issued several guidelines on constructing grassroots environmental protection agencies. At the local level, cities and regions such as Yibin and Chongqing have achieved full coverage of grassroots environmental protection agencies in their jurisdictions since 2010. They can serve as examples for policy evaluation. Therefore, this paper will examine the status quo of grassroots environmental protection agencies in a sample consisting of those cities at the prefecture level and above that have achieved full coverage of grassroots environmental protection agencies each year to study whether the establishment of grassroots environmental protection agencies has positively impacted the local environment. On this basis, this paper will further examine the impact of grassroots environmental protection agencies on economic growth and economic structure to provide empirical evidence for the theory of the relationship between environmental regulation and economic growth.
In the following text, this paper selects provincial- and municipal-level data from 2003 to 2018 and investigates the above two questions through the synthetic control method. The results show that (1) grassroots environmental protection agencies reduced pollution discharge to a certain extent and positively impacted environmental improvement. In addition, there is regional heterogeneity in the effect of grassroots environmental protection agencies in reducing the discharge of various pollutants (i.e., the reduction effect). 2) The establishment of grassroots environmental protection agencies did not have a significant negative impact on local economic growth and economic structure. The contributions of this study are threefold: 1) It is among the first to adopt the synthetic control method to empirically test the emission reduction induced by grassroots environmental protection agencies. Therefore, it complements the literature on environmental policy evaluation. 2) It takes grassroots environmental protection agencies as examples to examine the relationship between environmental regulation and economic growth. Furthermore, it provides empirical evidence for the theory of the relationship between the two. 3) It presents a comprehensive summary of the history of the development of grassroots environmental protection agencies and identifies the differences between policies on organizational models and staffing in different regions. These efforts help explain the weak policy effects of grassroots environmental protection agencies. Therefore, this study provides theoretical support for the innovation of environmental policies and the further promotion of grassroots environmental protection agencies.
The rest of the paper is structured as follows. Section 2 briefly describes the background, basic facts of establishing grassroots environmental protection agencies, the data source and the research design. Section 3 illustrates the empirical results and robustness tests. Section 4 further analyzes the results, and Section 5 presents concluding comments.
2 Materials and methods
2.1 Policy background and factual description
China’s first environmental protection law, the Environmental Protection Law of the People’s Republic of China (for Trial Implementation), was promulgated in September 1979. The law required the people’s governments of provinces, autonomous regions, and municipalities directly under the central government to establish environmental protection bureaus and specified the primary responsibilities of these agencies. After 10 years of trial implementation, the Environmental Protection Law of the People’s Republic of China was officially promulgated in December 1989, followed by a series of environmental protection laws and regulations, including The Water Pollution Prevention and Control Law of the People’s Republic of China, the Measures for the Administration of Environmental Standards, and the Law of the People’s Republic of China on the Prevention and Control of Atmospheric Pollution. With the construction and improvement of the legal system for environmental protection, environmental protection agencies at the provincial, municipal, and county levels were gradually established and improved. In 1997, the Environmental Protection Administration of China, in conjunction with various departments, issued regulations on strengthening environmental protection in township enterprises. The regulations stipulated the strengthening of environmental law enforcement teams in townships. In 2002, the State Environmental Protection Administration issued a notice on the further development of the national activity of townships with beautiful environments. The notice specified that establishing environmental protection agencies is one of the assessment criteria for a “national-level township with a beautiful environment”4. Subsequently, a series of documents were issued to improve the environmental management systems and strengthen the capacity building of grassroots environmental protection teams. In 2016, the central government issued the guiding opinions on the pilot reform of the vertical management system for monitoring, supervision, and law enforcement of environmental protection agencies below the provincial level and emphasized again the responsibility of townships (subdistricts) to protect the environment and specify the duties of various departments.
According to the policy of the central government, local governments promote the establishment of grassroots environmental protection agencies, but the specific coverage and establishment time “vary from city to city”. In the process of actually collecting relevant data on the establishment of grassroots environmental protection agencies, it was discovered that some provinces and cities have not publicly released relevant documents on their establishment of grassroots environmental protection agencies. Therefore, to investigate the real situation, the authors of the study consulted the official websites of the people’s governments at the provincial/municipal/county levels, the Ministry of Ecology and Environment of China, the provincial-level departments of ecology and environment, the municipal-level ecology and environment bureaus, and the environmental protection bureaus of various districts (counties). In addition, the authors referred to related news coverage and the website of Baidu Baike. Information on the establishment of grassroots environmental protection agencies was collected, from the building of township environmental protection stations in Weiyuan County, Sichuan Province in 1966 to other districts (counties, autonomous counties), prefecture-level cities (prefectures, leagues), and provinces (autonomous regions, municipalities directly under the central government) that had completed the work by 2018.
According to manually collected information on grassroots environmental protection agencies, Jiaozuo, a city in Henan province, started a pilot grassroots team-building project in 2009 and established environmental protection agencies in 101 townships (subdistricts) across the city in 2010. Since 2010, Yibin, Jingmen, and Huanggang cities have completed the overall construction of grassroots environmental protection agencies. Nearly half of the townships in Yibin and Jingmen have been equipped with environmental protection supervision teams, and the two cities have achieved some results in terms of the grassroots environmental protection supervision mechanism. Huanggang has set up grassroots environmental protection agencies, covering 93.82% of the city5. In 2013, to meet the grassroots needs for environmental protection, the Environmental Protection Bureau of Chongqing set up environmental protection agencies at the township or subdistrict levels in each district and county (autonomous county). By early 2014, 1,012 townships (subdistricts) in Chongqing had established environmental protection agencies, and full coverage of grassroots environmental protection agencies and teams had been basically achieved. Subsequently, Chengdu established grassroots environmental protection agencies in 2014, but full coverage of grassroots environmental protection agencies was not achieved before 2015. The full coverage of grassroots environmental protection agencies in other provinces and cities has not been supported, according to the relevant documents. In addition, within the data including the years up to 2018, the authors select cities that achieved full coverage of grassroots environmental protection agencies before 2015 as the research sample when using the Synthetic Control Method (SCM). Because the SCM cannot sufficiently observe the differences in these regions due to the policy after 2015. In summary, we choose to include only cities that can be clearly supported by data and that achieved full coverage of grassroots environmental protection agencies by 2015 as the research objects. A total of five cities meet the above requirements, namely, Chongqing, Yibin, Jiaozuo, Jingmen, and Huanggang.
The process of establishing grassroots environmental protection agencies varies in different places, mainly in two ways. First, the environmental protection agencies set up in townships (subdistricts) are vertically managed by the county (city, district) environmental protection bureau. Second, the agencies are environmental protection offices or supervision units set up in and administered by the township (subdistrict) governments. Zhejiang Province, Jiangsu Province, Chongqing City, Jilin Province, and Hebei Province basically achieved provincial (municipal) coverage of grassroots environmental protection agencies in 2006, 2008, 2014, 2017, and 2018, respectively. However, most early grassroots environmental protection agencies were ill-structured and had problems such as excessive administrative intervention. Fifty-two prefecture-level cities and 423 districts (counties) had established grassroots environmental protection agencies by 2018. Table 1 reports the establishment of grassroots environmental protection agencies at the prefecture and district (county) levels.
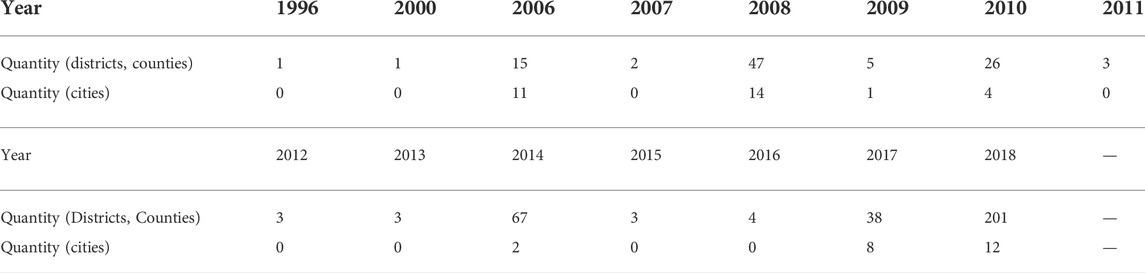
TABLE 1. Establishment of grassroots environmental protection agencies.
Figures 1A and Figures 1B plot the changing trends of industrial pollution discharge (industrial wastewater discharge and industrial S O 2 emission, respectively) in provinces with and without the coverage of grassroots environmental protection agencies. It can be seen from the mean difference (provinces basically covered by environmental protection agencies minus the provinces not covered by environmental protection agencies) in Figure 1A that industrial wastewater discharge per unit of GDP decreased to a considerable extent. Therefore, the effect of grassroots environmental protection agencies in pollution reduction can be demonstrated. However, Figure 1B does not show similar trends, indicating that the reduction effect of these agencies in reducing pollution needs more precise analysis.
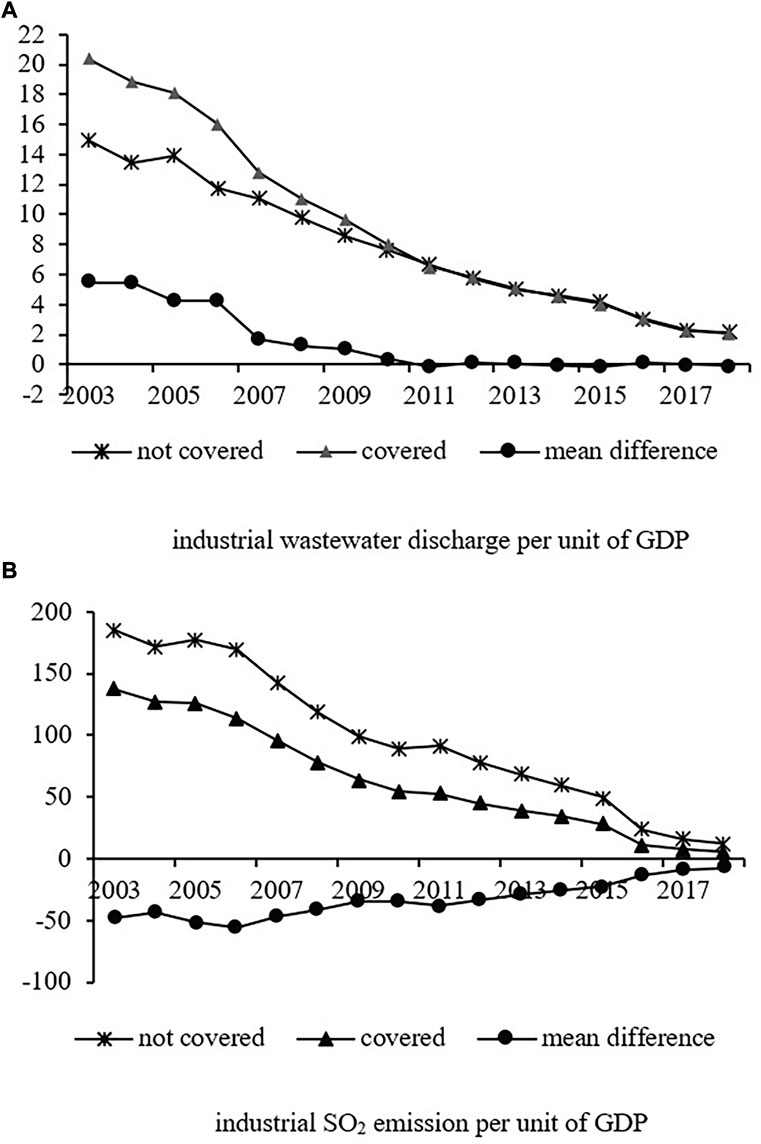
FIGURE 1. Changing trends in industrial pollutants.
2.2 Data sources and research design
This paper uses provincial- and municipal-level data to empirically test the effects of grassroots environmental protection agencies in different regions. The empirical test has two steps: 1) testing the effects in pollution control by the grassroots environmental protection agencies in different areas by estimating the impact of these agencies on local pollution discharge; 2) further testing the impact of grassroots environmental protection agencies on GDP and total industrial output to analyze the sustainability of the policies and possible pathways. The synthetic control method is the primary test method in this paper. This section briefly introduces the synthetic control method and describes the main variables and sample data.
2.2.1 Synthetic control method
The synthetic control method (SCM) is a data-driven, nonparametric method proposed by Abadie and Gardeazabal (2003) to assess the economic costs of terrorist conflict in the Basque Country. Compared with conventional regression methods, the SCM overcomes the problems of subjective sample selection and policy endogeneity (Abadie et al., 2010). It has been widely applied to the evaluation of policies from California’s (Abadie et al., 2010), adjustment of administrative divisions (Hall et al., 2020), and trade liberalization (Olper et al., 2018) to the one-child policy (Gietel-Basten et al., 2019). The method has also been widely used in the environmental field. Zhang et al. (2016) adopted the approach to evaluate the impact of the Beijing Olympics in 2008 on the air quality in the city. Chen et al. (2022) used the method to investigate the effects of China’s S O 2 Emissions Trading Pilot Scheme (SETPS) on the emission intensity of S O 2. Zhang et al. (2022) studied the influence of the Air Pollution Control and Prevention Action Plan (APPA) on air pollution using this method. Since this study only covers five cities, it is not possible to construct treatment and control groups by using city-level data. Therefore, other policy evaluation methods, such as differences in differences and regression discontinuity, cannot be used. In addition, enterprise-level data cannot meet the requirements of this study. Specifically, China’s industrial enterprise database has only been updated through 2013, while the policy covers the period from 2010 to 2014. At the same time, due to the large scale of listed enterprises, grassroots environmental protection agencies have limited power to constrain them, so the use of data from listed companies is ruled out. In summary, SCM was used in this study. The SCM works as follows.
Suppose that there are J+1 regions, and only the first region is affected by the policy, so that the remaining J regions are the control group. Let
We conclude that:
We need to estimate
where
The SCM approximates the characteristics of the treatment group through the weighted average of the control group to estimate
Suppose an optimal weight
If
2.2.2 Data and variables
As most provincial- and municipal-level grassroots environmental protection agencies were established after 2010, the SCM requires a more extended period of estimation to achieve better results (Gardeazabal and Vega-Bayo, 2017). Thus, provincial- and municipal-level data from 2003 to 2018 are used in this paper to analyze the effect of grassroots environmental protection agencies in pollution reduction. The data are collected from the China City Yearbook, China Statistical Yearbook on Environment, provincial/municipal Statistical Yearbooks, provincial/municipal statistical communiques on national economic and social development, and provincial/municipal reports on the state of the environment. Based on the study of Chen et al. (2021), per capita GDP (pgdp), population density (density), level of openness (fdi), level of secondary industry development (industry), level of industrial structure (depth), and fiscal budget expense (expense) are selected as predictor variables. The level of investment in environmental management (E.I.) is added as a provincial-level predictor variable. Industrial wastewater discharge (wwd) and industrial sulfur dioxide emissions (S O 2) are the explained variables6. In addition, in this paper, the amount of foreign direct investment denominated in U.S. dollars is converted to RMB at the current year’s exchange rate, and nominal GDP is converted to real GDP. Variable descriptions are shown in Table 2.
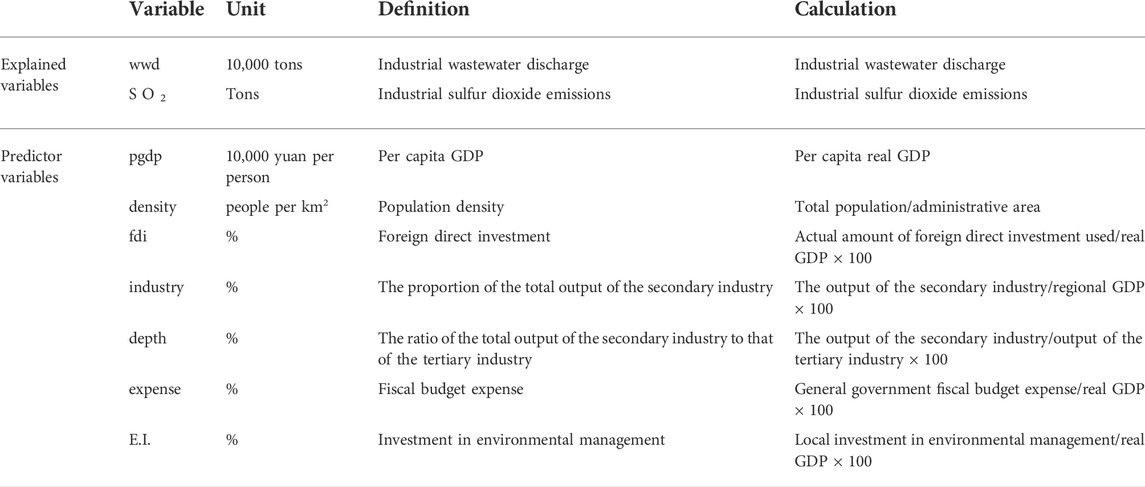
TABLE 2. Variable descriptions.
Abadie et al. (2015) pointed out that the units that are susceptible to policy intervention or particular shocks should be excluded from the control group. It is essential to select units with characteristics similar to those of the treatment group. For example, Jiaozuo is located in the northwest part of Henan Province and is one of the major cities in the central Henan Urban Agglomeration centered on Zhengzhou. Therefore, other cities in the Central Plains Economic Zone are selected as the control group in the synthetic control for Jiaozuo. The selection basis of the treatment groups can be found in Part 2, and the details of the treatment group and control group are shown in Table 3.
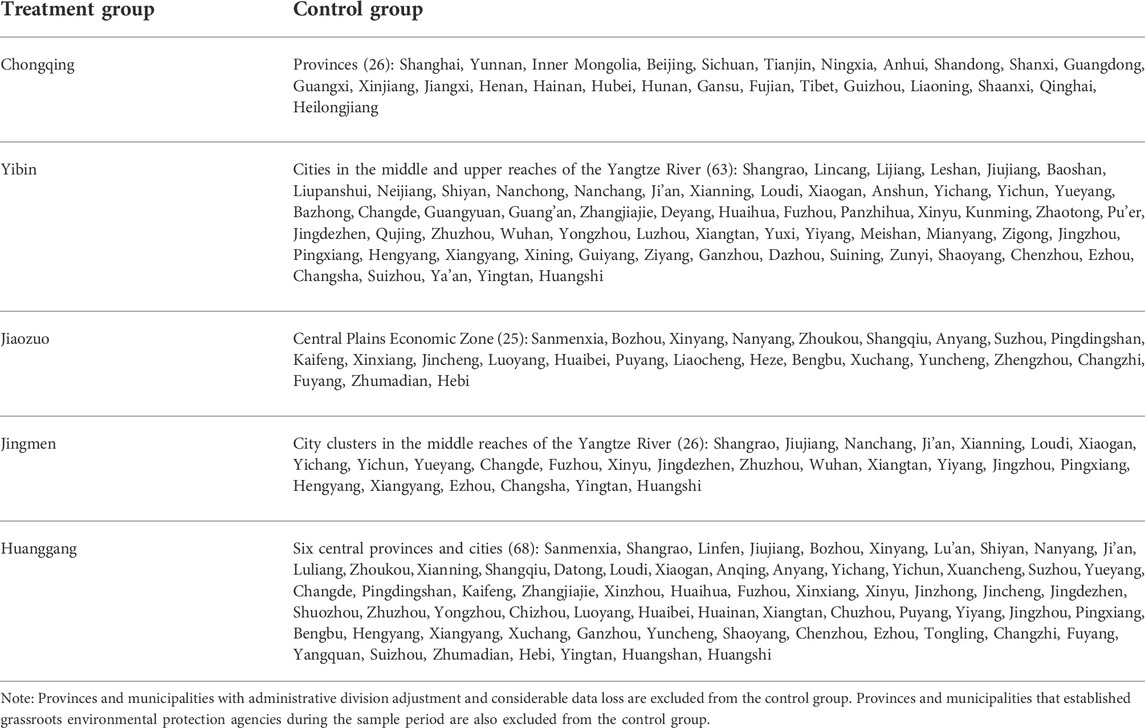
TABLE 3. Treatment group and control group.
3 Results and analysis
3.1 The effect of grassroots environmental protection agencies in reducing pollution discharge
Based on the SCM, this study tests the reduction effects of the grassroots environmental protection agencies in Chongqing, Yibin, Jiaozuo, Jingmen, and Huanggang.
First, we use Chongqing as the treatment group. The synthetic value of Chongqing is simulated with the provinces shown in Table 3. Industrial wastewater discharge and industrial S O 2 emissions of the actual Chongqing and the synthetic Chongqing are presented in Figure 2Aa and Figure 2Ab, respectively. The figure suggests that the synthetic effect on industrial wastewater discharge is not ideal, and the synthesis of industrial S O 2 emissions well approximates the emission trend in Chongqing before the implementation of the policy. The two lines diverge after the implementation of the policy. Compared with synthetic Chongqing, actual Chongqing has a steeper decreasing trend in its industrial S O 2 emissions. The difference between the two lines is the reduction effect of grassroots environmental protection agencies. Figure 2Ac plots the yearly estimates of this reduction effect of grassroots environmental protection agencies (i.e., the annual gaps in industrial S O 2 emissions between actual Chongqing and synthetic Chongqing). The effect of grassroots environmental protection agencies in reducing industrial S O 2 emissions peaked 2 years after full coverage was achieved.
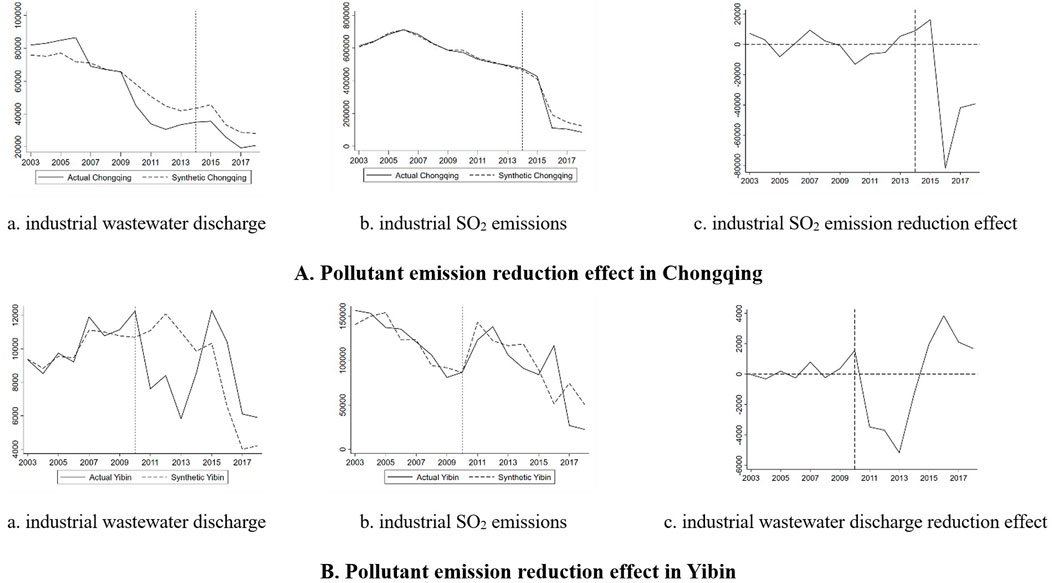
FIGURE 2. Pollutant emission reduction effect in Chongqing and Yibin.
To better observe the long-term effect of grassroots environmental protection agencies in emission reduction, this paper conducts synthetic control analysis of Yibin, Jiaozuo, Jingmen, and Huanggang. These four cities carried out the overall construction of grassroots environmental protection agencies in 2010.
According to measurements of pollution discharge in Yibin before and after the implementation of the policy (see Figure 2Ba), the establishment of grassroots environmental protection agencies effectively reduced industrial wastewater discharge. This study estimates the effect of grassroots environmental protection agencies in emission reduction and plots Figure 2Bc. The figure suggests that from 2011, the effect increased year by year and peaked in 2013. After that, the effect decreased year by year to zero in 2015. Figure 2Bb shows that grassroots environmental protection agencies did not significantly reduce industrial S O 2 emissions. The reason might be that Yibin had already greatly invested in improving air quality before implementing the policy. Air pollution has been a major problem plaguing the development of Yibin. The city was among the top ten cities with the highest air pollution in China in 2004 and 2005, with S O 2 as the main pollutant. The city invested approximately RMB 1.3 billion from 2004 to 2006 to improve air quality and reduce air pollution7. Its air quality improved year on year. Compared with the establishment of township environmental protection agencies, the comprehensive regulation of air pollution in Yibin is obviously more effective in reducing industrial S O 2 emissions, so the above results are not significant.
Similar to Yibin’s situation, Jiaozuo was also plagued by severe air pollution during its development and was listed as one of the top ten cities with the highest air pollution in China in 2004. To solve this problem, the city took measures such as shutting down small boilers in 2005 to improve air quality. However, it still ranked among the top ten emitters of S O 2 in China. The effect of environmental policies was insignificant, so it would not greatly affect the effects of the policy to establish grassroots environmental protection agencies. Figure 3Ab suggests that industrial S O 2 emissions in Jiaozuo started to decrease in 2005. After the full coverage of grassroots environmental protection agencies was achieved in 2010, the industrial S O 2 emissions of actual Jiaozuo greatly diverged from those of synthetic Jiaozuo. Figure 3Ac suggests that the effect of grassroots environmental protection agencies in reducing industrial S O 2 emissions increased and then decreased with appropriate policy adjustments. The effect dropped to a low level in 2016. However, Figure 3Aa shows that the establishment of grassroots environmental protection agencies did not significantly impact industrial wastewater discharge in Jiaozuo.
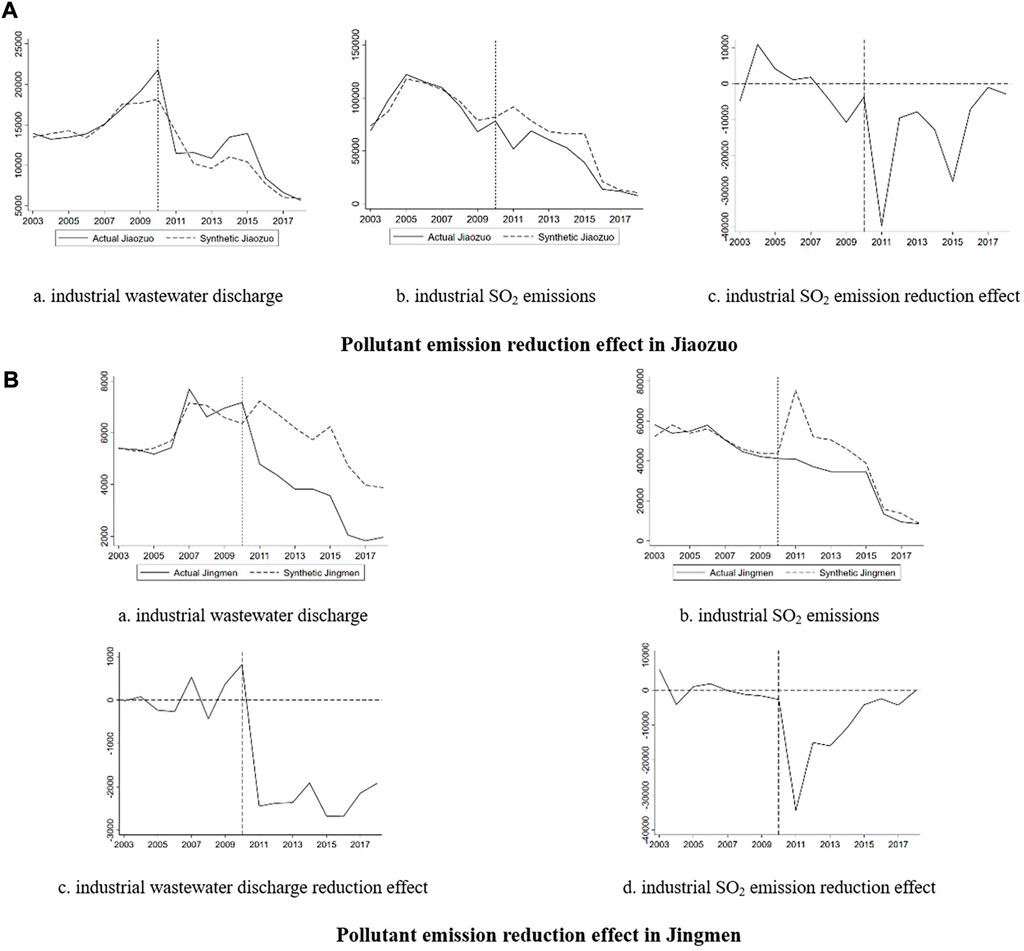
FIGURE 3. Pollutant emission reduction effect in Jiaozuo and Jingmen.
Figure 3Ba and Figure 3Bb plot the changing trends of industrial wastewater discharge and industrial S O 2 emissions of actual Jingmen and synthetic Jingmen before and after the implementation of the policy. The figure shows that after the establishment of grassroots environmental protection agencies, actual Jingmen discharged of both pollutants diverged from those of the synthetic Jingmen. This means that the establishment of grassroots environmental protection agencies reduced the discharge of the two pollutants. In terms of the estimated reduction (see Figure 3Bc and Figure 3Bd), the effect of grassroots environmental protection agencies in reducing industrial wastewater discharge remained at a high level, and that in reducing industrial S O 2 emissions first increased and then decreased year by year. News reports on Jingmen before 2010 show that the city had a serious water pollution problem. The establishment of environmental protection agencies in industrial cities had a notable effect on reducing industrial wastewater discharge.
Similarly, we use cities in the six central provinces as the control group to synthesize the pollution emissions of Huanggang (see Figure 4a and Figure 4b)8. From the perspective of the synthetic situation, the effect is entirely satisfactory. Compared with the situation in synthetic Huanggang, the actual industrial S O 2 emissions in Huanggang were not significantly reduced by the establishment of grassroots environmental protection agencies but industrial wastewater discharge was greatly reduced. From Section 2, we know that grassroots environmental protection agencies covered 93.82% of Huanggang’s administrative area, with only 60 agencies in 2010. Each agency is responsible for multiple townships, resulting in slower and less efficient law enforcement. Huanggang’s SO2 pollution has not been effectively addressed in the implementation of the policy. Other cities are also understaffed, which is the main reason grassroots environmental protection agencies do not play a full role. This study also plots the yearly gaps in industrial wastewater discharge between actual Huanggang and synthetic Huanggang (see Figure 4c). The figure shows that after the full coverage of grassroots environmental protection agencies was achieved in 2010, the effect of reducing industrial wastewater discharge first increased and then exhibited a declining trend after 2011. The effect dropped to zero in 2017.

FIGURE 4. Pollutant emission reduction effect in Huanggang.
3.2 Robustness tests
As mentioned above, establishing grassroots environmental protection agencies has certain effects on reducing pollution discharge in Chongqing, Yibin, Jiaozuo, Jingmen, and Huanggang. However, whether these effects on emission reductions are driven by chance or caused by other unobserved factors needs to be further tested. Similar to the study of Abadie et al. (2010), the present study uses placebo tests and permutation tests to evaluate the robustness of the empirical results. In addition, it uses the difference-in-differences (DID) method to assist the analysis.
3.2.1 Placebo tests
A placebo test works as follows. The SCM is applied to a city from the control group to test whether the same reductions as those in the treatment group can be seen if the policy is implemented in the selected city. As the selected city has not carried out the overall construction of grassroots environmental protection agencies, the effect of the policy should be different from that in the treatment group. Otherwise, the fact that the SCM can demonstrate the reduction effects of grassroots agencies cannot be proven.
The synthetic value of other provinces (municipalities directly under the central government, autonomous regions) that have not carried out the overall construction of grassroots environmental protection agencies is used as synthetic Chongqing. Among the control groups, Ningxia had the highest synthetic weight of 0.41. Figures 5a presents the placebo test for Ningxia. The synthetic Ningxia well approximates the industrial S O 2 emissions of the actual Ningxia before 2014, and after 2014, the changing trend in emissions induced by the presence of grassroots agencies in Ningxia is different from that in Chongqing. Therefore, the conclusion that grassroots environmental protection agencies reduce industrial S O 2 emissions in Chongqing is robust.
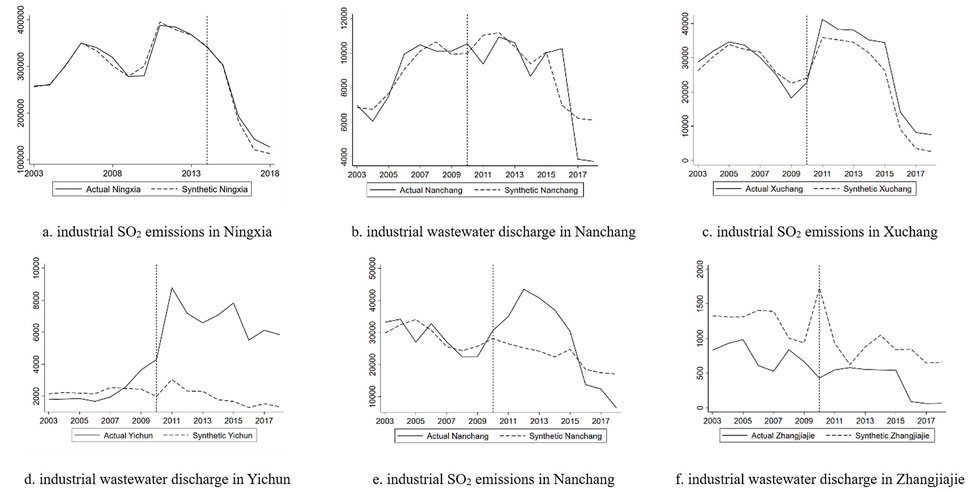
FIGURE 5. Placebo test results.
Similar placebo tests are conducted for Yibin, Jiaozuo, Jingmen, and Huanggang. Table 4 shows the cities with the highest weights in synthetic Yibin, Jiaozuo, Jingmen, and Huanggang. Figures 5B–F plot the placebo tests for the cities with the highest weights. The results show that the changing trends of pollution discharges in actual Nanchang and actual Xuchang were consistent with those of their synthetic counterparts before and after 2010. This indicates that the placebo cities for Yibin and Jiaozuo had different emission reduction effects from those in the corresponding treatment group. However, for Jingmen and Huanggang, the actual and synthetic pollution discharges of the placebo cities diverge notably, so the situation of pollution discharge before 2010 is not correctly approximated. Therefore, the robustness of the reduction effects in Jingmen and Huanggang cannot be confirmed. To further test the significance of the policy effects, the paper then conducts permutation tests for the treatment group.
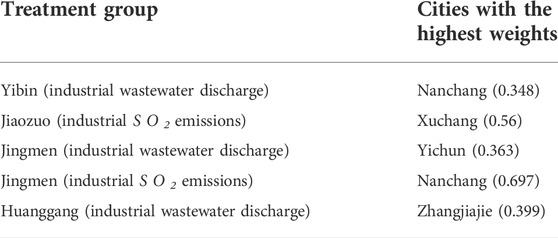
TABLE 4. Cities with the highest weights in the synthetic treatment group and their weights.
3.2.2 Permutation tests
The permutation test method was proposed by Abadie and Gardeazabal (2003). The SCM is applied to each region in the control group, supposing that all regions in the control group have constructed grassroots environmental protection agencies. Next, the study estimates the policy effects on the control group and compares the estimates with the policy effects in the treatment group. If the policy effects in the control group are significantly different from other policy effects, the effects of grassroots environmental protection agencies in emission reduction are significant. Meanwhile, we suppose the mean squared prediction error (MSPE) in a region before the implementation of the policy is large. In that case, the synthetic control method cannot provide a good fit for the actual pollution discharge before implementing the policy. As a result, the pollution discharge changes after policy implementation cannot be sufficiently interpreted. Therefore, regions with MSPE greater than twice that of the treatment group are excluded from the permutation tests.
Figure 6a shows the estimated effects in reducing industrial S O 2 emissions in Chongqing and other control groups. The solid line indicates Chongqing, and the dashed lines indicate other control regions. The degree of change in the gap between the actual and synthetic values of industrial S O 2 emissions in Chongqing was not significantly different from that in the control group before 2014. After 2014, however, the gap between Chongqing and other regions started to widen. The line of Chongqing diverges from those of other regions, indicating that the establishment of grassroots environmental protection agencies inhibits industrial S O 2 emissions in Chongqing. For other regions, the probability of having the same results as Chongqing’s is 1/18 (=5.6%), suggesting that the full coverage of grassroots environmental protection agencies has a significant effect in reducing industrial S O 2 emissions in Chongqing at the 10% level.
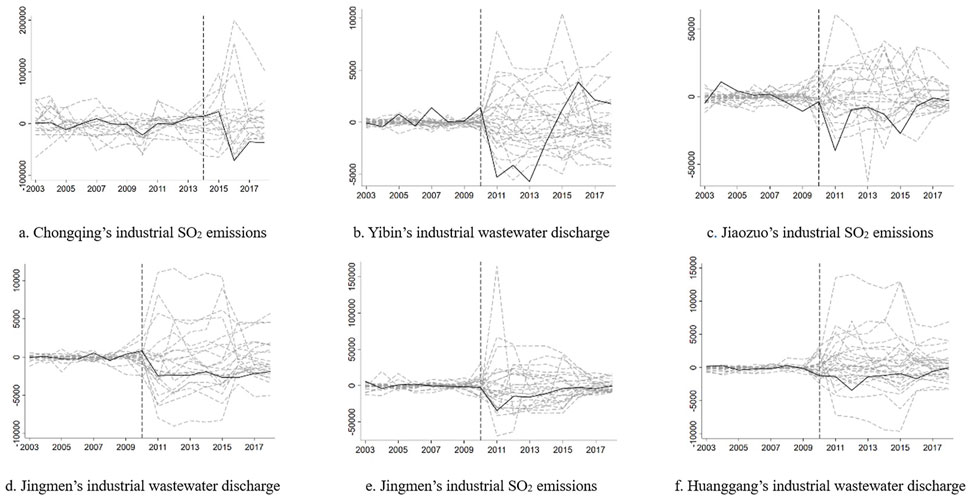
FIGURE 6. Permutation test results.
Similarly, Figures 6B–F show the results of the permutation tests for Yibin’s industrial wastewater discharge, Jiaozuo’s industrial S O 2 emissions, Jingmen’s industrial wastewater discharge and industrial S O 2 emissions, and Huanggang’s industrial wastewater discharge. In particular, there are 63 and 68 cities in the control groups for synthetic Yibin and synthetic Huanggang, respectively. This paper uses systematic sampling (with a sampling interval of 2) to select 32 and 34 control groups for permutation tests. As shown in Figure 6B and Figure 6C, the gaps between the actual and synthetic values of industrial pollution discharge in Yibin and Jiaozuo were not significantly different from those of other regions before 2010. The lines of Yibin and Jiaozuo diverge from those of other regions after the full coverage of grassroots environmental protection agencies was achieved in 2010. For a random region, the probabilities of having the same results as those of Yibin and Jiaozuo are 1/28 (=3.6%) and 1/24 (=4.2%), respectively, suggesting that the reduction effects of the grassroots environmental protection agencies in Yibin and Jiaozuo are significant at the 5% level. Figures 6D–F show the results of the permutation tests for Jingmen’s industrial wastewater discharge, Jingmen’s industrial S O 2 emissions, and Huanggang’s industrial wastewater discharge. For other regions, the probabilities of having the same results are 9/23 (=39.1%), 9/26 (=34.6%), and 5/29 (=17.2%), respectively. The values indicate that they are not small probability events, suggesting that the reduction effects of the grassroots environmental protection agencies in Jingmen and Huanggang are not significant.
Based on the empirical analysis and robustness tests, this paper concludes that grassroots environmental protection agencies have a significant effect on inhibiting industrial pollution discharge in Chongqing, Yibin, and Jiaozuo. For Jingmen and Huanggang, although grassroots environmental protection agencies can reduce industrial pollution discharge, the effect is insignificant. The reason might be the influence of other environmental management policies, but these factors cannot be excluded by the SCM. For example, Huanggang implemented a river chief system in 2009 to manage the city’s key waters in a comprehensive manner. The system may be more effective in reducing industrial wastewater discharge than grassroots environmental protection agencies.
3.2.3 DID regression of data on industrial enterprises above designated size
The DID method is used to estimate the impact of the establishment of grassroots environmental protection agencies on the pollution discharge of industrial enterprises, further verifying the robustness of the empirical results. The DID model is set as follows:
where polluteit is the amount of pollution discharged by the enterprise, including industrial wastewater discharge and industrial S O 2 emissions. If the enterprise is influenced by grassroots environmental protection agencies, we have treati = 1. If the time is after the policy is implemented, we let timet = 1. Therefore,
Columns 1) to 6) in Table 5 show the regression results with industrial wastewater discharge as the explained variable. Column 1) shows the regression results for enterprises’ wastewater discharge without control variables, showing that effect on emission reduction is not significant. With the control variable (Column (2)) added, however, the effect is significantly negative at the 1% level, further verifying the robustness of the results obtained through the SCM. The next step is the heterogeneity analysis. First, key polluting industries and nonkey polluting industries are classified according to the Environmental Information Disclosure Guidance for Listed Companies and the Management List of Environmental Protection Verification Industries for Listed Companies released by the Ministry of Ecology and Environment. The test results of the two categories are shown in Columns 3) and (4), suggesting that grassroots environmental protection agencies significantly reduce the industrial wastewater discharge of key polluting industries, and their reduction effects in industrial enterprises in nonkey polluting industries are not significant. Second, according to the criteria for the sizes of industrial enterprises set by the National Bureau of Statistics of China9, enterprises are classified into large and small categories based on their revenues. Columns 5) and 6) show the regression results of the two groups. It can be seen that grassroots environmental protection agencies significantly reduce the wastewater discharge of small enterprises, and their effects on the emissions reduction of large enterprises are not significant. The results are in line with the intuition that grassroots environmental protection agencies, as ground-level organizations, are more binding on smaller enterprises.
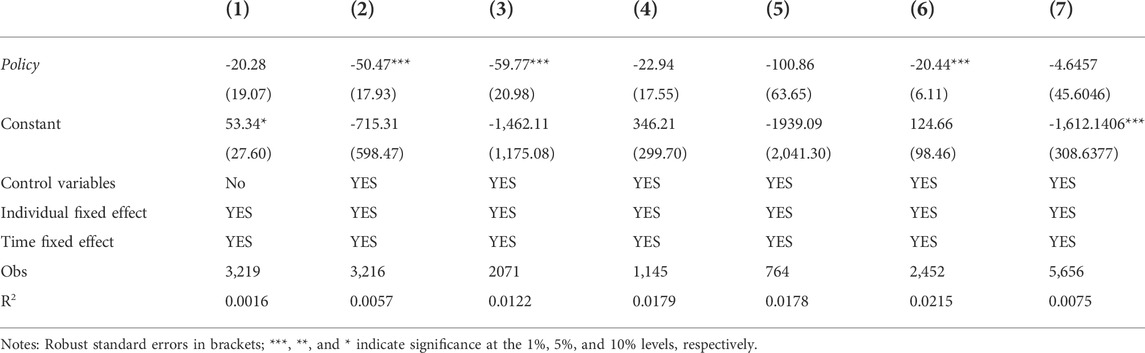
TABLE 5. Regression results for industrial pollutant emissions.
As an essential prerequisite for the validity of the DID model is that the parallel trend assumption is met; this paper uses the event study method to test the parallel trend assumption. The baseline year is set as 2010 for the event study. The test results of the parallel trend assumption, as shown in Figure 7A, suggest that the policy effect before the construction of grassroots environmental protection agencies is not significantly different from zero and significantly negative after the construction. The parallel trend assumption is met, as the results are consistent with those of the baseline regression.
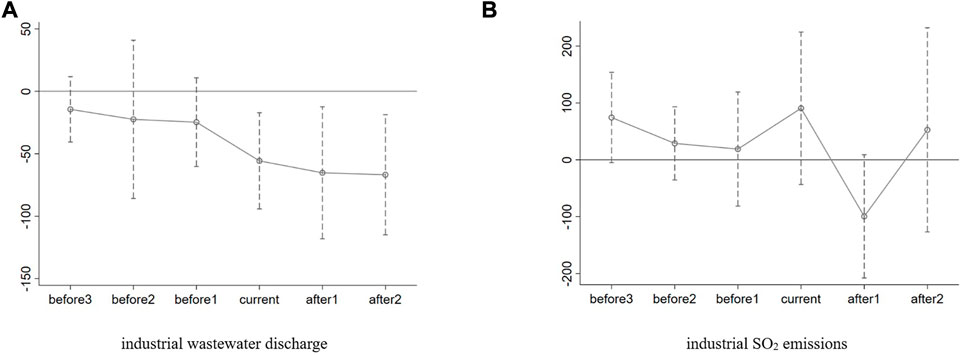
FIGURE 7. Parallel trend test for enterprises’ industrial pollutant emissions. Note: The dashed line perpendicular to the horizontal axis indicates the 95% confidence interval for the estimated regression coefficient. The horizontal axis indicates the year of policy implementation. Before indicates “before the policy implementation,” and after indicates “after the policy implementation”.
The same regression is conducted on Jiaozuo, as shown in Column 7) in Table 5. Figure 7B shows the test results of the parallel trend assumption. It can be seen that the effect of grassroots environmental protection agencies on industrial enterprises’ S O 2 emissions is negative but not significant. The results are not consistent with those of the SCM. The reason might be that the database of environmental statistics for industrial enterprises only contains samples of enterprises above the designated size for intense monitoring, different from the full sample data used for the SCM. However, the grassroots environmental protection agencies are more likely to target small and medium-sized enterprises, so the results estimated from the database of environmental statistics for industrial enterprises are not as reliable as those from the baseline regression.
4 further analysis
4.1 The impact of the establishment of grassroots environmental protection agencies on economic growth
Section 4 suggests that the establishment of grassroots environmental protection agencies has had some positive impact on the environmental situation in several regions, but their economic costs remain unclear. If the establishment has a negative impact on the local economy, its sustainability could be questioned. In such a context, this study draws on the idea of Chen et al. (2021) and uses per capita actual GDP as an explained variable to further investigate the economic influences of the establishment of grassroots environmental protection agencies. Figure 8A shows the change curves of the per capita real GDP of actual Chongqing, Yibin, and Jiaozuo and their synthetic counterparts, suggesting that the establishment of grassroots environmental protection agencies in Chongqing and Jiaozuo did not have a negative impact on economic growth. For Yibin, however, its per capita GDP was lower than that of its synthetic counterpart after 2012. Figure 8B presents the policy effects. To test whether the decline in per capita real GDP is significant, this paper conducts a permutation test on the decline in the per capita GDP of Yibin (see Figure 8C). The results show that seven other cities’ per capita real GDP in the control group decreased more extensively than that of Yibin. The probability of having a decline in the per capita real GDP similar to that of Yibin is 8/33 (24.2%), indicating that the negative economic effect of the construction of grassroots environmental protection agencies is not significant.

FIGURE 8. Synthetic control results of economic growth.
Based on the above tests, this study concludes that the establishment of grassroots environmental protection agencies does not have a significant negative impact on economic growth while reducing pollution discharge, which facilitates the sustainable development of the local economy.
4.2 The impact of the establishment of grassroots environmental protection agencies on economic structure
One way to improve the environmental situation through environmental protection policies is to reduce the share of industrial production, which is directly reflected in effects on enterprises including closure and restrictions during environmental regulation (Shao et al., 2021; Wang et al., 2022). The impact of environmental regulation on industrial output has drawn academic attention. Therefore, this study tests the effects of the establishment of grassroots environmental protection agencies on the share of the total industrial output. Figure 9A and Figure 9B show the proportions of the actual and synthetic total industrial output in the real GDP of Yibin and Jiaozuo, respectively. The results show that the ratios of the total industrial output of the two cities to the real GDP dropped to some extent after the establishment of grassroots environmental protection agencies. The decreases were smaller after 2014. To verify the statistical significance of the declines in the above proportions, this paper performs a permutation test. Figure 9Ac and Figure 9Bc show that although the establishment of grassroots environmental protection agencies has affected the proportion of gross industrial output value in GDP, these effects are not statistically significant. Based on the empirical results in Section 4.1, it can be found that the establishment of grassroots environmental protection agencies has not had a sufficient impact on local economic activities.
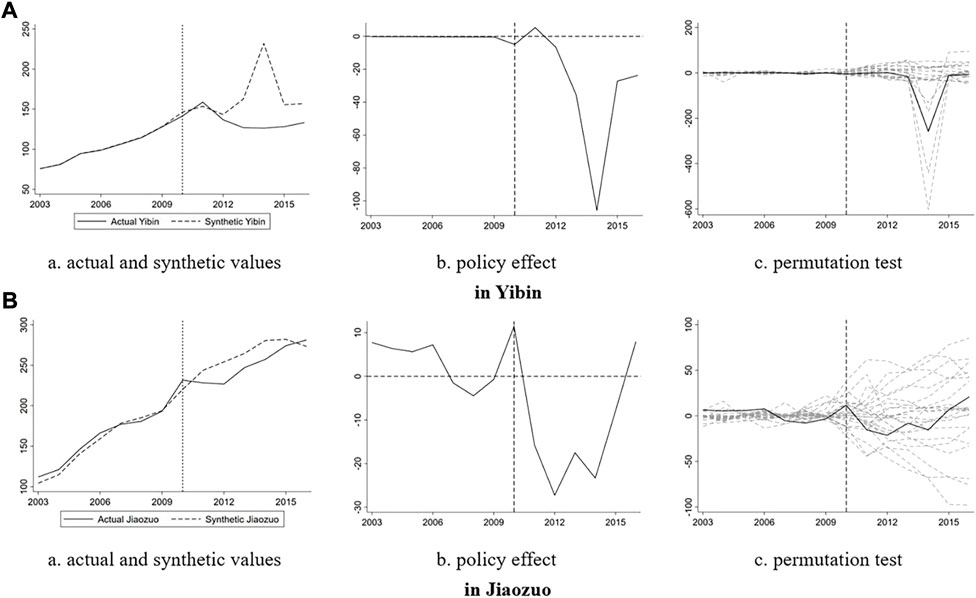
FIGURE 9. Actual and synthetic total industrial output/GDP.
5 Conclusions
This paper uses the establishment of grassroots environmental protection agencies in cities such as Chongqing, Yibin, and Jiaozuo as cases and collects provincial- and municipal-level panel data from 2003 to 2018. It adopts the SCM to empirically investigate the impact of the establishment of grassroots environmental protection agencies on environmental pollution and economic growth. This study found that (1) grassroots environmental protection agencies reduced pollution discharge to a certain extent and had a positive impact on environmental improvement. In addition, there is regional heterogeneity in the effect of grassroots environmental protection agencies in reducing the discharge of various pollutants. The policy effects are not significant in places with a poor system of environmental protection agencies and inadequate staffing. 2) This paper adopts the DID method to further analyze the impact of the establishment of grassroots environmental protection agencies on the wastewater discharge of industrial enterprises above a size designated by the government for close observation. The results are consistent with those of the SCM method. In addition, the inhibiting effect of the establishment of grassroots environmental protection agencies on the wastewater discharge of enterprises is heterogeneous in terms of industry and size. In other words, the grassroots agencies significantly reduce the wastewater discharges of small industrial enterprises and of those in the key polluting industries. The effect on the reduction of wastewater discharge from large industrial enterprises and those in the nonkey polluting industries is not significant. 3) This paper has not found a significant negative impact of the establishment of grassroots environmental protection agencies on local economic growth and economic structure.
This paper also has some limitations. Grassroots environmental protection agencies are located in townships and subdistricts and are more likely to improve the environment by controlling domestic sewage, solid pollutants, and agricultural pollution sources. Due to the lack of such data, however, this paper has not analyzed this issue.
Grassroots environmental supervision is the “last kilometer” of environmental protection, and grassroots environmental protection agencies bear an important duty. This paper investigates the impact of the establishment of grassroots environmental protection agencies on pollution discharge through case studies. The possibility and importance of promoting grassroots environmental protection agencies in other provinces and cities across the country are illustrated. However, environmental law enforcement by grassroots environmental protection agencies generally suffers from inadequate management staff, excessive administrative intervention, and a lack of authority. These problems hinder the effectiveness of the agencies. The local practice of grassroots environmental protection agencies has been promoted nationwide. During the process, it is necessary to train personnel and solve problems such as insufficient managerial staff and a lack of authority. By doing so, local governments can promote grassroots environmental work and fully utilize the functions of related agencies.
Data availability statement
The original contributions presented in the study are included in the article/Supplementary Material, further inquiries can be directed to the corresponding author.
Author contributions
PD, LZ, and YZ conceived the ideas and designed the research framework; PD performed the literature research; LZ and YZ performed the data collection and result calculation; LZ, YZ, and LY led the writing of the manuscript; All authors read and approved the final manuscript.
Conflict of interest
PD was employed by the Company China Railway First Survey and Design Institute Group Co., Ltd.
The remaining authors declare that the research was conducted in the absence of any commercial or financial relationships that could be construed as a potential conflict of interest.
Publisher’s note
All claims expressed in this article are solely those of the authors and do not necessarily represent those of their affiliated organizations, or those of the publisher, the editors and the reviewers. Any product that may be evaluated in this article, or claim that may be made by its manufacturer, is not guaranteed or endorsed by the publisher.
Footnotes
1Source: the National Bureau of Statistics of China (http://www.stats.gov.cn/).
2Source: The Environmental Performance Index (EPI) 2020 by the Yale Center for Environmental Law and Policy and the Center for International Earth Science Information Network (CIESIN) at Columbia University’s Earth Institute (https://epi.yale.edu/).
3Grassroots environmental protection agencies refer to those established in townships, subdistricts, and other grassroots administrative units, such as township (street) environmental protection offices and environmental protection bureaus.
4It has been renamed national-level township with a beautiful ecology.
5Source: https://www.cenews.com.cn/news/zrst/201009/t20100919_664030.html.
6In 2010, industrial soot emissions and industrial dust emissions were merged into one category, and the statistical caliber of each administrative unit was inconsistent, so the effect on reducing this type of emissions was not investigated.
7Source: http://scnews.newssc.org/system/2006/12/10/010210333.shtml.
8Huanggang and Jingmen belong to the urban agglomeration in the middle reaches of the Yangtze River, but the synthetic value of other cities in the same agglomeration as a control group provides a poor comparison for Huanggang.
9Source: http://www.stats.gov.cn/tjgz/tzgb/201801/t20180103_1569254.html.
References
Abadie, A., Diamond, A., and Hainmueller, J. (2015). Comparative politics and the synthetic control method. Am. J. Political Sci. 59 (2), 495–510. doi:10.1111/ajps.12116
Abadie, A., Diamond, A., and Hainmueller, J. (2010). Synthetic control methods for comparative case studies: Estimating the effect of California's tobacco control program. J. Am. Stat. Assoc. 105 (490), 493–505. doi:10.1198/jasa.2009.ap08746
Abadie, A., and Gardeazabal, J. (2003). The economic costs of conflict: A case study of the Basque country. Am. Econ. Rev. 93 (1), 113–132. doi:10.1257/000282803321455188
Cai, X., Lu, Y., Wu, M., and Yu, L. (2016). Does environmental regulation drive away inbound foreign direct investment? Evidence from a quasi-natural experiment in China. J. Dev. Econ. 123, 73–85. doi:10.1016/j.jdeveco.2016.08.003
Cao, Y., and You, J. (2017). The contribution of environmental regulation to technological innovation and quality competitiveness: An empirical study based on Chinese manufacturing enterprises. Chin. Manag. Stud. 11, 51–71. doi:10.1108/cms-12-2016-0252
Chen, J., Huang, S., Shen, Z., Song, M., and Zhu, Z. (2022). Impact of sulfur dioxide emissions trading pilot scheme on pollution emissions intensity: A study based on the synthetic control method. Energy Policy 161, 112730. doi:10.1016/j.enpol.2021.112730
Chen, Y., Dou, S., and Xu, D. (2021). The effectiveness of eco-compensation in environmental protection-a hybrid of the government and market. J. Environ. Manag. 280, 111840. doi:10.1016/j.jenvman.2020.111840
Cheng, Z., Li, L., and Liu, J. (2017). The emissions reduction effect and technical progress effect of environmental regulation policy tools. J. Clean. Prod. 149, 191–205. doi:10.1016/j.jclepro.2017.02.105
Dong, K., Sun, R., Dong, C., Li, H., Zeng, X., and Ni, G. (2018a). Environmental Kuznets curve for PM2.5 emissions in Beijing, China: What role can natural gas consumption play? Ecol. Indic. 93, 591–601. doi:10.1016/j.ecolind.2018.05.045
Deng, J., Zhang, N., Ahmad, F., and Draz, M. U. (2019). Local government competition, environmental regulation intensity and regional innovation performance: An empirical investigation of Chinese provinces. Int. J. Environ. Res. Public Health 16 (12), 2130. doi:10.3390/ijerph16122130
Dong, K., Hochman, G., Kong, X., Sun, R., and Wang, Z. (2019). Spatial econometric analysis of China’s PM10 pollution and its influential factors: Evidence from the provincial level. Ecol. Indic. 96, 317–328. doi:10.1016/j.ecolind.2018.09.014
Gardeazabal, J., and Vega‐Bayo, A. (2017). An empirical comparison between the synthetic control method and Hsiao et al.'s panel data approach to program evaluation. J. Appl. Econ. Chichester. Engl. 32 (5), 983–1002. doi:10.1002/jae.2557
Gietel-Basten, S., Han, X., and Cheng, Y. (2019). Assessing the impact of the “one-child policy” in China: A synthetic control approach. PLoS one 14 (11), e0220170. doi:10.1371/journal.pone.0220170
Greenstone, M., and Hanna, R. (2014). Environmental regulations, air and water pollution, and infant mortality in India. Am. Econ. Rev. 104 (10), 3038–3072. doi:10.1257/aer.104.10.3038
Greenstone, M., List, J. A., and Syverson, C. (2012). The effects of environmental regulation on the competitiveness of US manufacturing (No. w18392). National Bureau of Economic Research.
Grossman, G. M., and Krueger, A. B. (1995). Economic growth and the environment. Q. J. Econ. 110 (2), 353–377. doi:10.2307/2118443
Gu, G., Zheng, H., Tong, L., and Dai, Y. (2022). Does carbon financial market as an environmental regulation policy tool promote regional energy conservation and emission reduction? Empirical evidence from China. Energy Policy 163, 112826. doi:10.1016/j.enpol.2022.112826
Hall, J. C., Matti, J., and Zhou, Y. (2020). The economic impact of city–county consolidations: A synthetic control approach. Public Choice 184 (1), 43–77. doi:10.1007/s11127-019-00699-z
He, G., Wang, S., and Zhang, B. (2020). Watering down environmental regulation in China. Q. J. Econ. 135 (4), 2135–2185. doi:10.1093/qje/qjaa024
Hering, L., and Poncet, S. (2014). Environmental policy and exports: Evidence from Chinese cities. J. Environ. Econ. Manag. 68 (2), 296–318. doi:10.1016/j.jeem.2014.06.005
Jefferson, G. H., Tanaka, S., and Yin, W. Environmental regulation and industrial performance: Evidence from unexpected externalities in China. Available at SSRN 2216220, 2013.
Keiser, D. A., and Shapiro, J. S. (2019). Consequences of the clean water Act and the demand for water quality. Q. J. Econ. 134 (1), 349–396. doi:10.1093/qje/qjy019
Liu, G., Dong, X., Kong, Z., and Dong, K. (2021). Does national air quality monitoring reduce local air pollution? The case of PM2. 5 for China. J. Environ. Manag. 296, 113232. doi:10.1016/j.jenvman.2021.113232
Liu, M., Shadbegian, R., and Zhang, B. (2017). Does environmental regulation affect labor demand in China? Evidence from the textile printing and dyeing industry. J. Environ. Econ. Manag. 86, 277–294. doi:10.1016/j.jeem.2017.05.008
Lu, Y., Wu, M., and Yu, L. (2012). Evidence from a Natural Experiment in China. (May 1, 2012).Is there a pollution haven effect? Evidence from a natural experiment in China.
Olper, A., Curzi, D., and Swinnen, J. (2018). Trade liberalization and child mortality: A synthetic control method. World Dev. 110, 394–410. doi:10.1016/j.worlddev.2018.05.034
Shao, W., Yin, Y., Bai, X., and Taghizadeh-Hesary, F. (2021). Analysis of the upgrading effect of the industrial structure of environmental regulation: Evidence from 113 cities in China. Front. Environ. Sci. 9, 692478. doi:10.3389/fenvs.2021.692478
Tang, H., Liu, J., and Wu, J. (2020). The impact of command-and-control environmental regulation on enterprise total factor productivity: A quasi-natural experiment based on China's "two control zone" policy. J. Clean. Prod. 254, 120011. doi:10.1016/j.jclepro.2020.120011
Testa, F., Iraldo, F., and Frey, M. (2011). The effect of environmental regulation on firms' competitive performance: The case of the building & construction sector in some E.U. regions. J. Environ. Manag. 92 (9), 2136–2144. doi:10.1016/j.jenvman.2011.03.039
Wang, L., Wang, Z., and Ma, Y. (2022). Heterogeneous environmental regulation and industrial structure upgrading: Evidence from China. Environ. Sci. Pollut. Res. 29 (9), 13369–13385. doi:10.1007/s11356-021-16591-7
Wang, W., Xiao, W., and Bai, C. (2022). Can renewable energy technology innovation alleviate energy poverty? Perspective from the marketization level. Technol. Soc. 68, 101933. doi:10.1016/j.techsoc.2022.101933
Xie, Y., Li, Z., Zhong, H., Feng, X. L., Lu, P., Xu, Z., et al. (2021). Short-Term Ambient Particulate Air Pollution and Hospitalization Expenditures of Cause-Specific Cardiorespiratory Diseases in China: A Multicity Analysis. The Lancet Regional Health-Western Pacific 15, 100232. doi:10.1016/j.lanwpc.2021.100232
Yin, P., Brauer, M., Cohen, A. J., Wang, H., Li, J., Burnett, R. T., et al. (2020). The effect of air pollution on deaths, disease burden, and life expectancy across China and its provinces, 1990–2017: An analysis for the global burden of disease study 2017. Lancet Planet. Health 4 (9), e386–e398. doi:10.1016/s2542-5196(20)30161-3
Zhang, B., Chen, X., and Guo, H. (2018). Does central supervision enhance local environmental enforcement? Quasi-experimental evidence from China. J. Public Econ. 164, 70–90. doi:10.1016/j.jpubeco.2018.05.009
Zhang, H., Sun, X., Wang, X., and Yan, S. (2022). Winning the blue sky defense war: Assessing air pollution prevention and control action based on synthetic control method. Int. J. Environ. Res. Public Health 19 (16), 10211. doi:10.3390/ijerph191610211
Keywords: grassroots environmental protection agency, pollution reduction, synthetic control method, economic growth, DID
Citation: Ding P, Zhang Y, Yue L and Zhou L (2022) Environmental and economic effects of grassroots environmental protection agencies in China: An analysis based on the synthetic control method. Front. Environ. Sci. 10:1039967. doi: 10.3389/fenvs.2022.1039967
Received: 08 September 2022; Accepted: 31 October 2022;
Published: 14 November 2022.
Edited by:
Kangyin Dong, University of International Business and Economics, ChinaReviewed by:
Shihu Zhong, Shanghai National Accounting Institute, ChinaXiaoxin Guo, Shanghai Academy of Social Sciences, China
Zisheng Song, Royal Institute of Technology, Sweden
Copyright © 2022 Ding, Zhang, Yue and Zhou. This is an open-access article distributed under the terms of the Creative Commons Attribution License (CC BY). The use, distribution or reproduction in other forums is permitted, provided the original author(s) and the copyright owner(s) are credited and that the original publication in this journal is cited, in accordance with accepted academic practice. No use, distribution or reproduction is permitted which does not comply with these terms.
*Correspondence: Lei Zhou, emhvdWxlaWNlckBtYWlsLnNkdS5lZHUuY24=