- 1China Building Material Test and Certification Group Co., Ltd., Beijing, China
- 2Institute of Urban Safety and Environmental Science, Beijing Academy of Science and Technology, Beijing, China
Coating products are widely used for the interior decoration of residential property. However, there is growing concern regarding their odor emissions and their impact on indoor air quality (IAQ). Most manufacturers and government agencies set odor intensity limits to control the odor of coating products, including their raw materials. However, it is difficult to determine product performance by means of their odor intensity index. Although evaluating odor intensity requires odor assessors to distinguish between different intensity levels, low consensus and reproducibility represent challenges that are difficult to avoid. As the odor concentration index only requires odor assessors to ascertain whether the odor is felt or not, the reproducibility of the evaluation results is relatively better. Moreover, suitable methodologies for determining odor concentrations in volatile coating product emissions have rarely been reported. Therefore, establishing an evaluation method for odor concentration of coating products and exploring its key influencing factors should bridge this gap. We examined the influence of the airbag material on the recovery rate of typical volatile organic compounds (VOCs) using direct injection by GC-MS and established that their adsorption effects were in the order: PET > PVF > PTFE. We then explored the influences of the sample curing and odor emission times on odor concentration. The solvent-based and water-based coatings reached equilibrium after 8 h and 16 h curing, respectively, and after 8 h and 12 h odor emission, respectively. The odor concentrations of real coating samples were measured and compared against their odor intensities. The odor concentration method more accurately and reliably discriminated coating products than the odor intensity approach. Thus, to assist manufacturers in improving coating formulations to reduce the odor impact of coating products, we used headspace gas chromatography to determine the odor substances in water- and solvent-based coatings and analyzed the odor contribution of various volatile compounds using the odor activity value (OAV) method. Butyl acetate, ethylbenzene, and 1-methoxy-2-propyl acetate were the key odorants in solvent-based coatings while 1-butanol, ethylbenzene, and butyl acetate were the key odorants in water-based coatings.
1 Introduction
Modern urban residents spend approximately 80% of their lives indoors (Hppe, 2002; Du, 2014; Andrade et al., 2018). The importance of the environmental performance of interior building materials has increased with consumer awareness of environmental protection and health. Long-term volatile organic compound (VOC) exposure may lead to odor-related nuisances such as anxiety and inattentiveness (Jones, 1999; Chino et al., 2009; Piccardo et al., 2022). Odor pollution of indoor air reduces work efficiency and may cause economic loss (Cantuaria et al., 2009). Certain countries and jurisdictions have established limits on the concentrations of VOCs released by materials into indoor air. However, the indoor odor pollution problem has not been fully resolved because the olfactory thresholds of certain odorants lie far below the detection limits of currently available measuring instruments (Uhde et al., 2007; Spackman, 2020). Certain researchers and institutions believe that odor evaluation complements chemical assessments in indoor air quality control (Blanes-Vidal, 2009). Odor intensity and acceptability have been adopted by several popular product labeling systems (Piringer et al., 1999; Xu et al., 2022) such as DICL (Denmark), M1 (Finland), and Blue Angel and AGBB (Germany) certification.
Wood, interior wall, and floor coatings are widely used in interior decoration. However, they are major contributors to indoor air pollution. Numerous coatings meet VOC emissions standards. Odor pollution nonetheless occurs especially in winter, when indoor air temperatures are high and there is no nighttime ventilation. Odors emitted from coating products are more obvious and unpleasant in closed environments. Therefore, sensory evaluation of coating products and analysis of their key odorants are essential.
Current sensory evaluation methods for coatings and other building materials mainly assess odor intensity, hedonic tone, and acceptability (Hansen et al., 1991; Knudsen et al., 2007; Senitkova, 2014; Capíková et al., 2017; Kozicki et al., 2022). The ISO 16000–28:2020 standard is widely used to evaluate odor. Fang et al. (1999) reported that the sensory emissions of waterborne coatings significantly increase with relative humidity. Yeganeh et al. (2006) assessed the changes in the acceptability of various single and combined building materials at different dilution ratios. Kolarik et al. (2006) stated that photocatalytically active coatings exposed to light increase air acceptability. However, the odor concentrations in the volatile emissions of building material products have seldom if ever been analyzed. Odor concentration is the factor by which an odorant sample is diluted with odorless air to its olfactory threshold. Odor concentration is more reliable than odor intensity at representing the contributions of odor compounds to indoor air odor pollution and indicating the difficulty of removing odors by ventilation. EN 13725–2003 and ASTM E679-04 are highly reproducible test methods for measuring odor concentrations. However, few researchers have applied the foregoing techniques to evaluate coating product odors.
Odor adsorption by airbag materials is a key factor affecting odor evaluation because it has an impact on odorant composition. The airbags widely supplied and consumed on the market are made of PET (polyethylene terephthalate, nalophan™), PVF (polyvinyl fluoride, Tedlar™), and PTFE (polytetrafluoroethylene, Teflon™) (Beauchamp et al., 2008; Mochalski et al., 2014). Zarra et al. (2012) investigated odorants storage stability in three types of sampling bags often used to determine odor concentrations. Whereas Teflon bags were the most stable for this purpose, Nalophan bags were less reliable. Harreveld et al. (2012) examined odor concentration reduction in PET, PVF, and montmorillonite (MMT) airbags. The MMT airbags had obviously adsorbed the odor compounds. Nevertheless, the adsorption effect of airbag materials on compounds typically released by building products has rarely been studied or reported. Toluene, ethyl acetate, acetone, and ethanol were chosen for the present research. These four compounds are typical pollutants released from the building materials and are often used as solvents in coating products (Gallego et al., 2008; Dodson et al., 2017; Goodman et al., 2018); however, the adsorption of other types of pollutants such as aldehydes, terpenes, and alkanes needs to be further investigated.
Coatings are subjected to multiple physicochemical processes after they are applied. The pretreatment conditions of the coating samples may also affect odor evaluation. These include (1) the curing time between the completion of the coating application to insertion of the coating in the airbag, and (2) the odor emission time wherein the coating sample releases the odor into the airbag.
Several studies have investigated the health and indoor air quality (IAQ) effects of VOCs released from coating products. Ulker et al. (2021) summarized the studies on the release of contaminants from furniture coated with paints and their health effects. Benzene, toluene, xylene, and styrene are the common VOCs. Short-term exposure to these compounds can cause eye, nose, and throat irritation; dizziness; and headaches, while prolonged exposure can lead to neurological effects such as reduced attention, short-term memory, and increased cancer risk. Qi et al. (2019) investigated the quality of indoor air in furniture painting workrooms and detected high levels of ethyl acetate, n-butyl acetate, sec-butyl acetate, toluene, xylene, and ethylbenzene. The concentrations of these pollutants far exceeded the limits set by World Health Organization. Auvinen et al. (2008) measured the pollutant release from six photocatalytic coatings using a dynamic environmental test chamber and found that the coatings were not effective in degrading formaldehyde and VOCs, and also produced a variety of byproducts such as formaldehyde, acetaldehyde, and acetone at levels that were harmful to humans. Zhou et al. (2020) constructed a VOC emission model for coatings and validated it with literature data. However, the key odorants in the volatile emissions of coating products have seldom been explored. Chang et al. (1998) reported that hexanal emitted during alkyd paint curing (drying) is a key odorant. Ziemer et al. (2000) demonstrated that the esters in coating solvents significantly contribute to their odor emissions. Wang et al. (2020) used gas chromatography-olfactometry-mass spectrometry (GC-O-MS) on coated Phoebe neurantha (Hemsl.) Gamble wood and revealed that toluene, m-xylene, and benzaldehyde were the key odorants.
Owing to the increasing consumer demand for low-odor coating products, government agencies and manufacturers need more reliable and multidimensional evaluation methods for controlling the odor of such products. In the present study, we proposed a method to evaluate the odor concentration of coating products in a closed environment, which has not been applied in previous studies. We also investigated the key factors of the method, including the adsorption effect of different airbag materials, curing time of the samples, and odor emission time. In order to provide manufacturers with more information pertaining to the improvement of the odor performance of coating products, we used headspace gas chromatography-mass spectrometry (GC-MS) to identify and quantify major VOCs released by the coating products and then analyzed and compared their relative odor contributions using the odor activity value (OAV) method.
2 Materials and methods
2.1 Determination of volatile organic compounds recovery rates in airbags
To evaluate the adsorption effect of the odorants on the airbag materials, 1 μl of each chromatographically pure VOC was injected into 3-L PET, PVF, and PTFE airbags (Dalian Delin Gas Packing Co., Ltd., Dalian, China) and the changes in VOC concentration were measured at different times. The airbags used had a special Teflon fitting with silicon septum to prevent the entry of the ambient air. The injection of chromatographically pure VOC compounds and the collection of gas samples for GC-MS determination were performed by sticking a syringe into the Teflon fitting.
The experiment was performed thrice in parallel. The recovery rate (R) was used as the evaluation index and calculated as follows:
where R is the recovery rate of odor compound in the airbag, Creal is the actual VOC concentration in the airbag (mg m−3), and Ctheory is the theoretical concentration of the odor compound in the airbag (mg m−3).
Gas chromatography-mass spectrometry (GC/MS-QP2020; Shimadzu Corp., Kyoto, Japan) was used in direct injection mode to determine the VOC concentrations. Each sample was injected with a 1-ml gas syringe (Shimadzu Corp., Kyoto, Japan), and the injection volume was 1 ml. The desorbed VOCs were introduced into the GC-MS at a 10:1 split ratio. The GC oven temperature was held at 50°C for 1 min and programmed to increase from 50°C to 150°C at 10°C/min followed by a hold at 150°C for 10 min.
2.2 Influences of pretreatment conditions
2.2.1 Test sample preparation
The interior wall coating samples were collected from China Testing & Certification International Group Co., Ltd. (Beijing, China). Interior wall coatings were painted on a 10-cm2 substrate board according to the actual application quantity. The substrate board was composed of an odorless material such as stainless steel. The actual volume of the coating painted onto the substrate board and the coating product curing methods reflected the real construction process.
2.2.2 Gas preparation
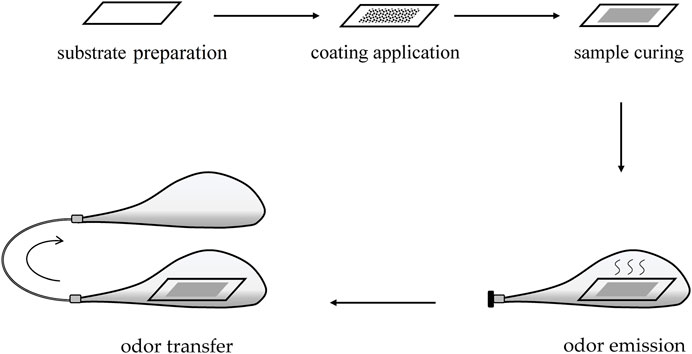
After the substrate boards were coated with the samples, they were stored at constant temperature and relative humidity (23°C and 50% RH) to cure and then placed in different types of 10-L airbags. Each of these was sealed with a sealing clip, 10 L odorless high-purity nitrogen or clean air was injected into its gas port, and its air valve was closed. The airbags were stored in a constant-temperature oven at 23°C to allow for odor emission. The odorant gas in the airbag was transferred by extrusion from the exhaust port to a new airbag and the latter was connected to a dynamic dilution olfactometer for measurement. The gas preparation process is shown in Figure 1.
2.2.3 Odor test room
All sensory experiments were performed in an odor test room fitted with temperature and humidity control equipment to maintain the environment at 23 ± 2°C and 50% ± 5% RH. The odor test room must be clean and odor-free so that it does not interfere with the sensory experiments.
2.2.4 Determination of odor concentration
Odor concentrations were evaluated by a panel of eight qualified odor assessors ages 18–45 with normal olfactory function. They were screened with n-butanol according to DIN EN 13725–2003.
The collected odor sample was continuously diluted by a dynamic dilution olfactometer until there was a 50% probability that the odor assessor in the panel will not be able to identify the odor stimulus. At this point, the dilution factor of the odor sample was the value of the odor concentration. The specific test procedure referred to DIN EN 13725–2003.
A dynamic dilution olfactometer (TO8; Olfasense GmbH, Kiel, Germany) was used to measure odor concentrations based on a three-point forced-choice method meeting the requirements of DIN EN 13725–2003.
2.3 Chemical concentration and volatile organic compounds analysis
2.3.1 Determination of concentrations of VOCs emitted from coating products
The test samples (10 cm2 substrate board) were placed in 1-L headspace vials (Entech Instruments LLC, Henderson, NV, United States). The headspace vials were placed upright, the pipes connecting the clean air were extended to their bases, the clean air flow rate was set to 1 L/min, ventilation was maintained, and the samples were quickly placed in the vials after 15 min. The side of each sample was placed towards the center of each headspace vial. After sample injection, the vials were ventilated for 10 min, quickly sealed with headspace caps, and maintained at 25 ± 2°C for 24 h.
The headspace vials were placed on a large-volume headspace sampler connected to a three-stage cold trap concentration device (No. 7150; Entech Instruments LLC, Henderson, NV, USA) for which the test conditions are shown in Table 1. The desorbed VOCs were directly introduced into a GC/MS in splitless mode.
The VOCs were separated on a DM-5 capillary column (60 m × 0.25 mm × 0.25 μm). The GC oven temperature was held at 50°C for 5 min, programmed to increase from 50°C to 250°C at 10°C/min, and held at 250°C for 10 min. The collected air samples were qualitatively measured according to retention time and MS and quantified according to the peak areas of the characteristic ions in the compound. The concentrations of compounds not included in the standard curve establishment link were qualitatively calculated by MS using their corresponding toluene coefficients.
2.3.2 Volatile organic compounds analysis
For each compound emitted by the coating products, the OAV was calculated by dividing its concentration by its odor threshold. The odor threshold required for the calculation was quoted from the literature. OAV was calculated as follows:
where OAV is the odor activity value, C is the concentration of odor pollutant measured by the instrument, and COT is the odor threshold for the odor pollutants.
3 Results and discussion
3.1 Adsorption curves of airbag materials
The airbag material adsorption effect is a key factor in odor evaluation. The volatile organic compounds (VOCs) ethyl acetate, toluene, ethanol, and acetone are released by typical building materials and were selected for this experiment.
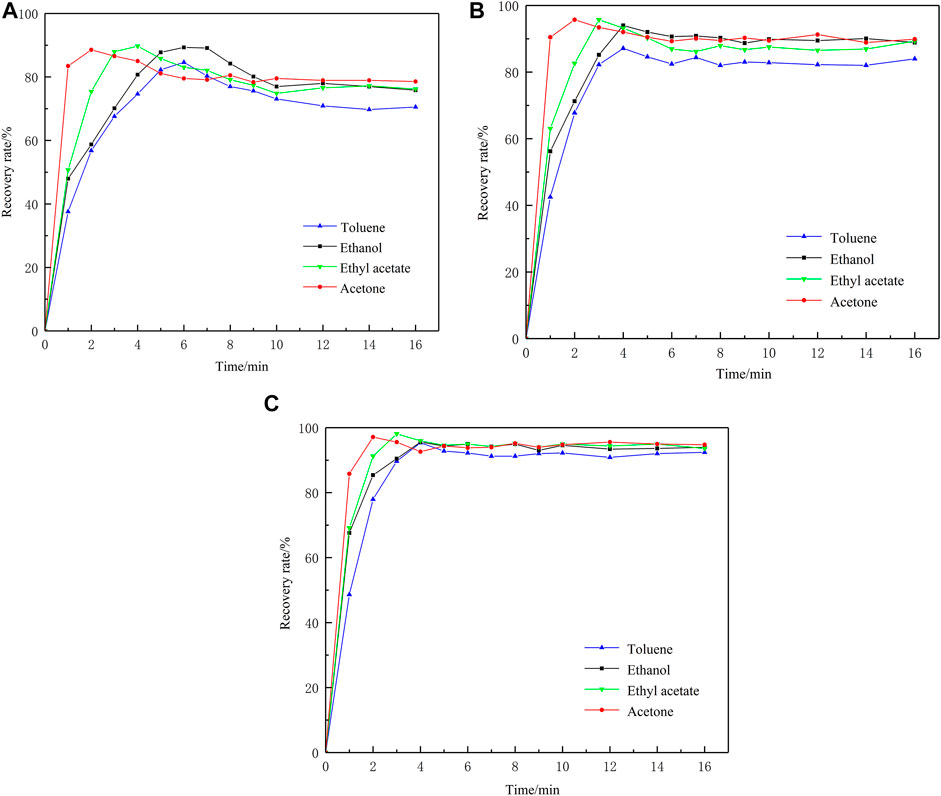
Chromatographically pure VOCs were injected into PET, PVF, and PTFE airbags. Changes in VOC concentration within the airbags at various time points were quantified and the recovery of each VOC was calculated. Recovery rates (R) were calculated with Eq. 2 and the results are shown in Figure 2.
Figure 2 shows that all four compounds rapidly volatilized after being injected into the airbags. The acetone and ethyl acetate concentrations increased the most rapidly and all were volatilized and uniformly mixed within 3 min. Acetone and ethyl acetate have relatively higher saturated vapor pressures (24 kPa and 13 kPa, respectively, at 20°C). Subsequently, the concentrations of all four compounds gradually decreased and eventually stabilized because of the airbag material adsorption effect. At the latter time point, fluctuation in the recovery rate was <2%. As the three types of airbags differently adsorbed the VOCs, their adsorption curves also differed.
When the VOCs were completely volatilized in the PET airbag, their concentrations gradually started to decrease and stabilized after 12 min. The decline in the recovery rate was in the range of 10%–15%. For the PVF and PTFE airbags, the VOC concentrations stabilized after 6 min and the recovery rates decreased by 3%–8%. Therefore, the VOCs reached equilibrium relatively faster in the PVF and PTFE than the PET airbags. Moreover, the PVF and PTFE airbags adsorbed comparatively less fully volatilized VOCs than the PET airbags.
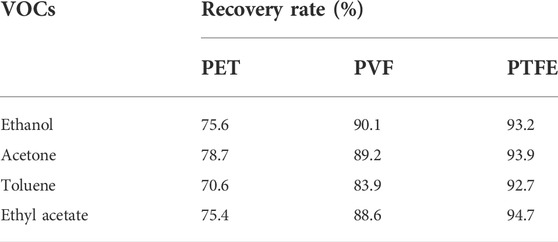
Table 2 shows the VOC recovery rates at equilibrium. The four VOCs had the lowest recovery rates (70.6%–78.7%) in the PET airbags and the highest recovery rates (92.7%–94.7%) in the PTFE airbags. Therefore, PTFE had a relatively lower adsorption effect on the VOCs and was comparatively more suitable as a container for building material odor emissions.
3.2 Effect of sample curing time on odor concentration
Once coating products are applied, they pass through three stages (Keddie, 1997; Ma et al., 2005). (1) The water or organic solvent in the coating product rapidly volatilizes and the coating solidifies. (2) The film-forming compound in the coating undergoes physicochemical changes and forms a tight coating. At this stage, certain unfilmed higher-boiling auxiliary compounds and internal solvents are gradually released. (3) The coating properties stabilize and the volatiles enter a slow-release cycle. The odor evaluation must reliably reflect the actual situation to ensure that it is repeatable. The coating product odor evaluations must be performed at Stage (3).
The effect of coating curing time on the final odor concentration was then explored. The methods for determining the odor concentration are described in Sections 2.2.1, 2.2.2. Four solvent-based and four water-based coatings were selected. The samples were applied to odorless substrates and at 23°C and 50% RH for 1, 2, 4, 8, 12, 16, and 24 h. The sample-coated substrate plates were then placed in sealed airbags for 8 h and the odor concentrations were measured (Figure 3).
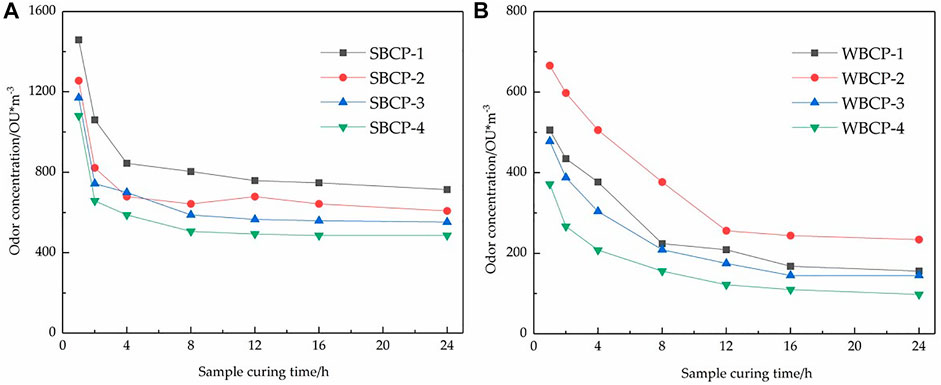
FIGURE 3. Effect of sample curing time on solvent-based (A) and water-based (B) coating product odor concentrations.
Figure 3 shows that the solvent-based coatings passed through Stage (1) within 0–3 h. The odor concentrations rapidly dropped and the solvent-based coatings entered Stages (2) and (3) after 8 h. Thereafter, the decline in odor concentration slowed down. The water-based coatings passed through Stage (1) within 0–8 h and entered Stages (2) and (3) after 16 h. The odor concentrations slowly decreased. The duration of Stage (1) was determined mainly by the heat of vaporization of the medium. As a rule, water has a higher heat of vaporization than organic solvents. Hence, Stage (1) was significantly shorter for the solvent-based than the water-based coatings. To obtain reproducible odor concentrations, measurements must be taken after 16 h curing time.
3.3 Effect of odor emission time on odor evaluation
Four solvent-based and four water-based coatings were selected for this experiment. All eight coating samples were applied to the substrate and cured at 23°C and 50% RH for 16 h. Then, all eight samples were placed in 10-L PTFE airbags for 1, 2, 4, 8, 12, 16, 20, and 24 h and the odor concentrations were measured. The times at which the sample-coated substrates were placed in the airbags were taken as the odor emission times.
Figure 4 shows that the odor concentration gradually increased and then stabilized with odor release time. The VOCs in the coating films were gradually released into the airbags. As the concentrations of the VOCs in the airbags gradually increased, the resistance of the VOCs to mass transfer from the coating film to the gas phase gradually increased and eventually reached equilibrium. For the solvent-based coatings, the odor concentrations rose rapidly within 0–4 h, slowly increased after 4 h, and gradually reached equilibrium after 8 h. For the water-based coatings, the odor concentrations gradually increased over 0–12 h and reached equilibrium after 12 h. Differentiation of the coating products with various odor performances gradually increased with emission time. For the solvent-based and water-based coatings, discrimination of the odor concentrations among the four samples was very difficult for the first 2 h and 4 h, respectively. Therefore, the odor concentrations should be measured after the samples have been released into the airbags for >12 h.
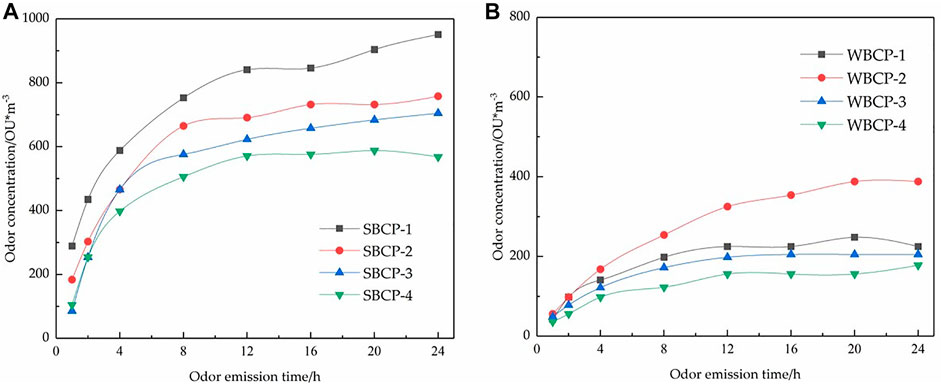
FIGURE 4. Effect of odor emission time on solvent-based (A) and water-based (B) coating product odor concentrations.
3.4 Coating product odor evaluation
Odor intensity is generally used to evaluate coating product odor performance. The present study introduced a method of determining odor concentrations. Two methods were compared by measuring the odor intensities and concentrations of ten selected water-based coating samples as follows.
(1) Sample odor intensities were determined by a method in the ISO 16000–28:2020 standard.
(2) Odor concentration was determined as follows. Samples were coated onto odorless glass substrate plates, cured 16 h, and placed in 10-L PTFE airbags. The latter were then filled with nitrogen or clean air and the odors were released for 12 h. The gas samples in the airbags were transferred to clean airbags and connected to a dynamic dilution olfactory analyzer. The odor concentrations were determined according to the EN 13725–2003 method.
For all ten coating products, coefficients of variation were used to distinguish between the foregoing methods. The coefficients of variation were calculated as shown in Eq. 3:
where
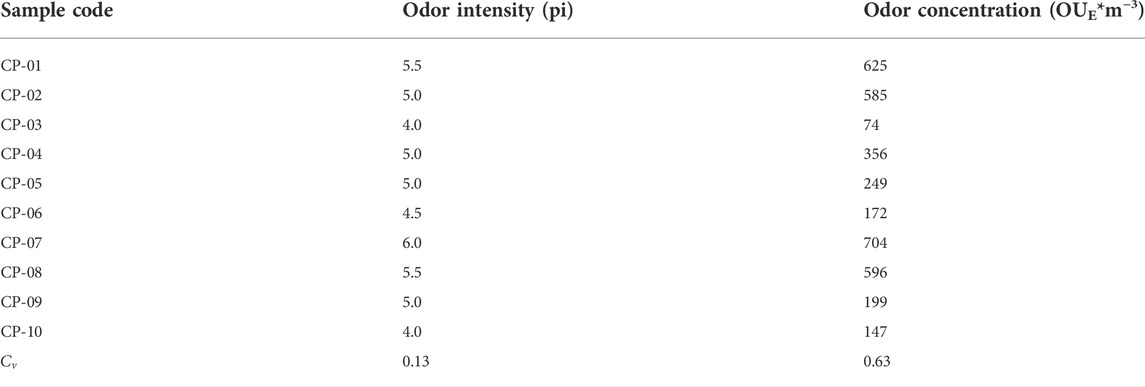
As shown in Table 3, the coefficient of variation for the odor intensities (0.13) was significantly smaller than that for the odor concentrations (0.63). This discrepancy indicates that odor concentrations are relatively more effective than odor intensities at discriminating coating products. For the CP-02, CP-04, CP-05, and CP-09 coatings, the odor intensities were all 5.0 pi whereas the odor concentrations were all distributed within the range of 199–585 OUE/m3.
Though the odors released by all four coatings were equal in terms of stimulating the human olfactory organ, they differed in terms of the amounts of clean air required to eliminate them. Hence, coating products with high odor concentrations are more likely to be odor nuisances. Thus, odor concentration is also important supplementary information for consumers of coating products or other building materials.
3.5 Key odorants released by coating products
Here, four water-based and four solvent-based coating products were selected to measure VOC emissions. Odor contributions were assessed by calculating the OAVs of each VOC. OAV is calculated according to Eq. 1.
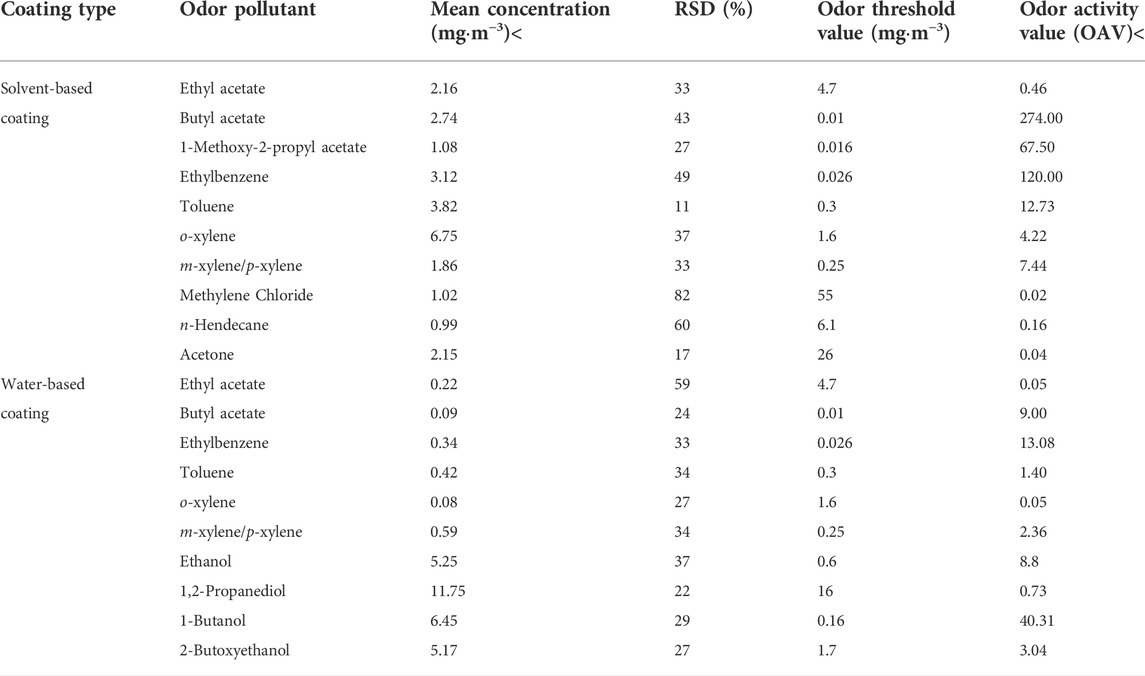
Table 4 shows significant difference among the solvent-based and water-based coatings in terms of the VOCs they released. The main VOCs released by the solvent-based coatings were o-xylene (6.75 mg m−3), toluene (3.82 mg m−3), ethylbenzene (3.12 mg m−3), butyl acetate (2.74 mg m−3), ethyl acetate (2.16 mg m−3), acetone (2.15 mg m−3), and others. The main VOCs released by the water-based coatings were 1,2-propanediol (11.75 mg m−3), 1-butanol (6.45 mg m−3), ethanol (5.25 mg m−3), 2-butoxyethanol (5.17 mg m−3), m-xylene/p-xylene (0.59 mg m−3), toluene (0.42 mg m−3), and others.
Ethyl acetate, butyl acetate, ethylbenzene, toluene, o-xylene, and m-xylene/p-xylene were detected in both solvent-based and water-based coatings. However, their concentrations greatly differed. The compounds most commonly emitted by solvent-based coatings were monoaromatic hydrocarbons and esters. The compounds most commonly emitted by water-based coatings were alcohols and ethers. Hence, solvent-based and water-based coatings have different odor performances.
Figure 5A shows that in descending order of concentration, the odor contributions to the solvent-based coatings were butyl acetate, ethylbenzene, 1-methoxy-2-propyl acetate, toluene, methylene/p-xylene, and o-xylene. Though the concentration of o-xylene was relatively high (6.75 mg m−3), it contributed comparatively little to the odor and its OAV accounted for only 20%. In contrast, the concentration of butyl acetate was comparatively low (2.74 mg m−3) but it contributed relative more to the odor and its OAV accounted for 50%.
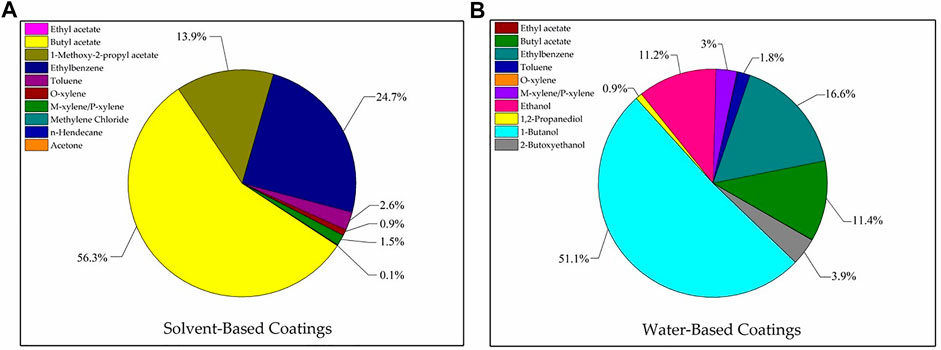
FIGURE 5. Odor contribution of VOCs emitted from solvent-based coatings (A) and water-based coatings (B).
Figure 5B shows that in descending order of concentration, the odor contributions to the water-based coatings were 1-butanol, ethylbenzene, butyl acetate, ethanol, 2-butoxyethanol, and m-xylene/p-xylene. Though 1,2-propanediol had the highest concentration (11.75 mg m−3), it contributed very little to the odor as it had a high odor threshold. Substances with OAV <1 have only a moderate impact on the odor. The alcohol n-butanol is widely used to solubilize water-based coatings and serves as a raw material for butyl acrylate production. Here, n-butanol had a significant impact on the water-based coating odor.
4 Conclusion
Our study aimed to develop a method for evaluating the odor concentration of coating products in a closed environment and explore the key factors affecting the odor evaluation. In addition, our research determined the key odorants of coating products. Our work can be briefly summarized as follows:
(1) PTFE airbags had the lowest VOC adsorption. PVF airbags moderately adsorbed VOCs while PET airbags strongly adsorbed them. Therefore, PTFE airbags should be used to ensure the accuracy of the odor concentration determinations.
(2) The odor concentrations rapidly increased before 12-h emission time and slowly increased thereafter. The odor concentrations rapidly decreased before the 16-h curing time but their rates of decrease declined thereafter. Therefore, to ensure the repeatability of odor concentration measurements for interior wall coatings, the emission and curing times should be set to >12 h and >16 h, respectively.
(3) Odor concentration measurements more effective distinguish odorant VOCs than odor intensity measurements. The former are relatively more convenient for manufacturers because they facilitate detailed quality classifications of product odor performance.
(4) The main VOCs released by the solvent-based coatings were o-xylene, toluene, ethylbenzene, butyl acetate, ethyl acetate, acetone, and others. The main VOCs released by the water-based coatings were 1,2-propanediol, 1-butanol, ethanol, 2-butoxyethanol, m-xylene/p-xylene, toluene, and others. In descending order of concentration, the odor contributions of the VOCs to the solvent-based coatings were butyl acetate, ethylbenzene, 1-methoxy-2-propyl acetate, toluene, m-xylene/p-xylene, and o-xylene. In descending order of concentration, the odor contributions of the VOCs to the water-based coatings were 1-butanol, ethylbenzene, butyl acetate, ethanol, 2-butoxyethanol, and m-xylene/p-xylene.
Our study has one major limitation; the objects analyzed were mainly interior wall coatings and wood coatings. Different types of coatings, such as anti-corrosion coatings and fireproof coatings, may release different key odor substances; alternatively, curing and odor release times may vary. These aspects need to be investigated further. Therefore, in the future, we plan to expand the scope of our research and study the key odor substances of other types of coating products or building materials. Further, we also plan to study the odor performance of different formulations of building materials; this may provide more valuable information to manufacturers.
Data availability statement
The original contributions presented in the study are included in the article/Supplementary Material, further inquiries can be directed to the corresponding author.
Author contributions
Conceptualization, YP, HG, and SL; methodology, QL, SL, ZG, and NL; writing—original draft preparation, YP, NL, and HG; writing—review and editing, YP and HG; supervision and project administration, ZG, HG, WH, and HC.
Funding
This work was supported by a grant from the Frontier Exploration Fund of China Building Materials Academy (Grant No. ZD-10) and a grant from BJAST High-level Innovation Team Program (Grant No. HIT202001).
Acknowledgments
We would like to thank Editage (www.editage.cn) for English language editing.
Conflict of interest
Authors YP, SL, HG, ZG, QL, WH, and HC are employed by China Building Material Test and Certification Group Co., Ltd.
The remaining author declares that the research was conducted in the absence of any commercial or financial relationships that could be construed as a potential conflict of interest.
The handling editor [CW] declared a past collaboration with the authors [YP and NL].
Publisher’s note
All claims expressed in this article are solely those of the authors and do not necessarily represent those of their affiliated organizations, or those of the publisher, the editors and the reviewers. Any product that may be evaluated in this article, or claim that may be made by its manufacturer, is not guaranteed or endorsed by the publisher.
References
Andrade, A., and Dominski, F. H. (2018). Indoor air quality of environments used for physical exercise and sports practice: Systematic review. J. Environ. Manag. 206, 577–586. doi:10.1016/j.jenvman.2017.11.001
Auvinen, J., and Wirtanen, L. (2008). The influence of photocatalytic interior paints on indoor air quality. Atmos. Environ. 42, 4101–4112. doi:10.1016/j.atmosenv.2008.01.031
Beauchamp, J., Herbig, J., Gutmann, R., and Hansel, A. (2008). On the use of Tedlar bags for breath-gas sampling and analysis. J. Breath. Res. 2, 046001. doi:10.1088/1752-7155/2/4/046001
Blanes-Vidal, V. (2015). Air pollution from biodegradable wastes and non-specific health symptoms among residents: Direct or annoyance-mediated associations? Chemosphere 120, 371–377. doi:10.1016/j.chemosphere.2014.07.089
Cantuaria, M. L., Brandt, J., Løfstrøm, P., and Blanes-Vidal, V. (2017). Public perception of rural environmental quality: Moving towards a multi-pollutant approach. Atmos. Environ. 170, 234–244. doi:10.1016/j.atmosenv.2017.09.051
Capíková, A., Tesařová, D., Hlavaty, J., Ekielski, A., and Mishra, P. K. (2020). GC-FID and olfactometry-assisted assessment of odors from polymeric foams under normal and repeated-use conditions. Adv. Polym. Technol. 2020, 4097414. doi:10.1155/2020/4097414
Chang, J. C., and Guo, Z. (1998). Emissions of odorous aldehydes from alkyd paint. Atmos. Environ. 32, 3581–3586. doi:10.1016/S1352-2310(98)00075-2
Chino, S., Kato, S., Seo, J., and Ataka, Y. (2009). Study on emission of decomposed chemicals of esters contained in PVC flooring and adhesive. Build. Environ. 44, 1337–1342. doi:10.1016/j.buildenv.2008.07.003
Dodson, R. E., Udesky, J. O., Colton, M. D., McCauley, M., Camann, D. E., Yau, A. Y., et al. (2017). Chemical exposures in recently renovated low-income housing: Influence of building materials and occupant activities. Environ. Int. 109, 114–127. doi:10.1016/j.envint.2017.07.007
Du, Z., Mo, J., and Zhang, Y. (2014). Risk assessment of population inhalation exposure to volatile organic compounds and carbonyls in urban China. Environ. Int. 73, 33–45. doi:10.1016/j.envint.2014.06.014
Fang, L., Clausen, G., and Fanger, P. O. (1999). Impact of temperature and humidity on chemical and sensory emissions from building materials. Indoor Air 9, 193–201. doi:10.1111/j.1600-0668.1999.t01-1-00006.x
Gallego, E., Roca, X., Perales, J. F., and Guardino, X. (2009). Determining indoor air quality and identifying the origin of odour episodes in indoor environments. J. Environ. Sci. 21, 333–339. doi:10.1016/s1001-0742(08)62273-1
Goodman, N. B., Wheeler, A. J., Paevere, P. J., Selleck, P. W., Cheng, M., and Steinemann, A. (2018). Indoor volatile organic compounds at an Australian University. Build. Environ. 135, 344–351. doi:10.1016/j.buildenv.2018.02.035
Hansen, L. F., Nielsen, G. D., Tottrup, J., Abildgaard, A., Jensen, O. F. D., Hansen, M. K., et al. (1991). Biological determination of emission of irritants from paint and lacquer. Indoor Air 1, 95–110. doi:10.1111/j.1600-0668.1991.01-12.x
Harreveld, A. P. T. (2003). Odor concentration decay and stability in gas sampling bags. J. Air & Waste Manag. Assoc. 53, 51–60. doi:10.1080/10473289.2003.10466121
Hppe, P. (2002). Different aspects of assessing indoor and outdoor thermal comfort. Energy Build. 34, 661–665. doi:10.1016/S0378-7788(02)00017-8
Jones, A. P. (1999). Indoor air quality and health. Atmos. Environ. 33, 4535–4564. doi:10.1016/S1352-2310(99)00272-1
Keddie, J. L. (1997). Film formation of latex. Mater. Sci. Eng. R Rep. 21, 101–170. doi:10.1016/S0927-796X(97)00011-9
Knudsen, H. N., Clausen, P. A., Wilkins, C. K., and Wolkoff, P. (2007). Sensory and chemical evaluation of odorous emissions from building products with and without linseed oil. Build. Environ. 42, 4059–4067. doi:10.1016/j.buildenv.2006.05.009
Kolarik, J., and Toftum, J. (2012). The impact of a photocatalytic paint on indoor air pollutants: Sensory assessments. Build. Environ. 57, 396–402. doi:10.1016/j.buildenv.2012.06.010
Kozicki, M. (2022). Identification of olfactory nuisance of floor products containing bitumens with the TD-GC-MS/O method. Materials 15, 959. doi:10.3390/ma15030959
Ma, Y., Davis, H. T., and Scriven, L. E. (2005). Microstructure development in drying latex coatings. Prog. Org. Coatings 52, 46–62. doi:10.1016/j.porgcoat.2004.07.023
Mochalski, P., King, J., Unterkofler, K., and Amann, A. (2013). Stability of selected volatile breath constituents in Tedlar, Kynar and Flexfilm sampling bags. Analyst 138, 1405–1418. doi:10.1039/c2an36193k
Piccardo, M. T., Geretto, M., Pulliero, A., and Izzotti, A. (2022). Odor emissions: A public health concern for health risk perception. Environ. Res. 204, 112121. doi:10.1016/j.envres.2021.112121
Piringer, M., and Schauberger, G. (1999). Comparison of a Gaussian diffusion model with guidelines for calculating the separation distance between livestock farming and residential areas to avoid odour annoyance. Atmos. Environ. 33, 2219–2228. doi:10.1016/S1352-2310(98)00240-4
Qi, Y., Shen, L., Zhang, J., Yao, J., Lu, R., and Miyakoshi, T. (2019). Species and release characteristics of VOCs in furniture coating process. Environ. Pollut. 245, 810–819. doi:10.1016/j.envpol.2018.11.057
Senitkova, I. (2014). Impact of indoor surface material on perceived air quality. Mater. Sci. Eng. C 36, 1–6. doi:10.1016/j.msec.2013.11.032
Spackman, C. (2020). In smell's shadow: Materials and politics at the edge of perception. Soc. Stud. Sci. 50, 418–439. doi:10.1177/0306312720918946
Uhde, E., and Salthammer, T. (2007). Impact of reaction products from building materials and furnishings on indoor air quality-A review of recent advances in indoor chemistry. Atmos. Environ. 41, 3111–3128. doi:10.1016/j.atmosenv.2006.05.082
Ulker, O. C., Ulker, O., and Hiziroglu, S. (2021). Volatile organic compounds (VOCs) emitted from coated furniture units. Coatings 11, 806. doi:10.3390/coatings11070806
Wang, Q., Zeng, B., Shen, J., and Wang, H. (2020). Effect of lacquer decoration on VOCs and odor release from P. neurantha (Hemsl.) Gamble. Sci. Rep. 10, 9565.
Xu, L., Hu, Y., and Liang, W. (2022). Composition and correlation of volatile organic compounds and odor emissions from typical indoor building materials based on headspace analysis. Build. Environ. 221, 109321. doi:10.1016/j.buildenv.2022.109321
Yeganeh, B., Haghighat, F., Gunnarsen, L., Afshari, A., and Knudsen, H. (2006). Evaluation of building materials individually and in combination using odour threshold. Indoor Built Environ. 15, 583–593. doi:10.1177/1420326X06072735
Zarra, T., Reiser, M., Naddeo, V., Belgiorno, V., and Kranert, M. (2012). A comparative and critical evaluation of different sampling materials in the measurement of odour concentration by dynamic olfactometry. Chem. Eng. Trans. 30, 307–312. doi:10.3303/CET1230052
Zhou, X., Gao, Z., Wang, X., and Wang, F. (2020). Mathematical model for characterizing the full process of volatile organic compound emissions from paint film coating on porous substrates. Build. Environ. 182, 107062. doi:10.1016/j.buildenv.2020.107062
Keywords: airbag, coating product, key odorant, odor activity value, odor concentration
Citation: Pei Y, Liu N, Liu S, Guan H, Guo Z, Li Q, Han W and Cai H (2022) Investigation of odor emissions from coating products: Key factors and key odorants. Front. Environ. Sci. 10:1039842. doi: 10.3389/fenvs.2022.1039842
Received: 08 September 2022; Accepted: 27 September 2022;
Published: 10 October 2022.
Edited by:
Chuandong Wu, University of Science and Technology Beijing, ChinaReviewed by:
Li Weifang, Tianjin Academy of Environmental Protection Sciences (TAES), ChinaMingquan Huang, Beijing Technology and Business University, China
Copyright © 2022 Pei, Liu, Liu, Guan, Guo, Li, Han and Cai. This is an open-access article distributed under the terms of the Creative Commons Attribution License (CC BY). The use, distribution or reproduction in other forums is permitted, provided the original author(s) and the copyright owner(s) are credited and that the original publication in this journal is cited, in accordance with accepted academic practice. No use, distribution or reproduction is permitted which does not comply with these terms.
*Correspondence: Yipu Pei, cGVpeWlwdUBjdGMuYWMuY24=
 Yipu Pei
 Ning Liu2