 Jingjing Liu
 Zhuqi Guo1
 Longlong Wang
- 1School of Mechanical and Precision Instrument Engineering, Xi’an University of Technology, Xi’an, China
- 2School of Remote Sensing and Information Engineering, Wuhan University, Wuhan, China
The aerosol observations in Xi’an (34.25°N, 108.983°E), a typical urban site in Northwest China, were conducted using a sky-radiometer from January 2015 to March 2018. Multi-year variations of aerosol optical properties (AOPs) and lidar ratios (LRs) were simultaneously analyzed and calculated. In particular, LRs in 340 nm were compared and validated using the UV-Raman lidar (RL) measurements. During the study period, aerosol optical depth at 500 nm (AOD500) had significant seasonal variation, with a maximum value of 0.68 in winter and a minimum value of 0.59 in autumn. Ångström exponent (AE) exhibited different seasonal variation patterns, and the minimum (0.81) and maximum (1.06) values appeared in spring and summer, respectively. The spectral difference between AE400–675 and AE675–870 indicated that high AOD675 values (>1.0) were affected by accidental factors (e.g., dust weather in spring and winter) and the accumulation of fine particle aerosols across all seasons. The relationship between AOD500 and AE400–870 was used to distinguish different aerosol types. Overall, mixed aerosols (MX) accounted for the largest contribution (ranging from 40.14% in autumn to 69.9% in spring), followed by biomass-burning or urban/industrial aerosols (BB/UI) (with the smallest value of 19.9% in spring, and the largest value of 43.66% in winter). Single-scattering albedo (SSAs) experienced weak seasonal variation, with a minimum in winter and a maximum in spring. The seasonal aerosol volume size distributions (VSDs) generally exhibited the trimodal patterns. The particle radius (R) of less than 0.5 μm is considered as fine mode, the coarse mode is R greater than 2.5 μm, and the middle mode is located somewhere in between them. The real CRI were ∼1.41–1.43, with no significant difference among different seasons. Besides, the LRs derived by combining sky-radiometer with Mie-scattering theory changed greatly with weather from 49.95 ± 8.89 in summer to 63.95 ± 6.77 in autumn, which were validated by RL with the errors within a certain height range of less than 10%. We confirmed the feasibility of using the LR of UV band from sky-radiometer as a reference value for the Fernald or Klett method.
1 Introduction
Aerosols can affect the radiation balance of the Earth-atmosphere system by directly absorbing and scattering shortwave and longwave radiation (Charlson et al., 1992; Eck et al., 2005; IPCC, 2013), and also indirectly modify cloud microphysical properties and hence cloud radiation properties, number and cloud lifetime, thereby affecting climate (Twomey et al., 1984; Albrecht, 1989). At present, the impact of aerosols on global and regional climate remains a high research priority (Ramanathan et al., 2008; IPCC, 2013). Despite the contribution of numerous investigations toward the understanding of aerosols and their climate effects, there are still huge uncertainties in related studies due to the differences of temporal and spatial distributions and the interactions between aerosols and other atmospheric processes (Dubovik et al., 2002; Nakajima et al., 2003; Ramanathan et al., 2005; Li et al., 2011). Therefore, it is critical to quantify the aerosol optical properties (AOPs) in different regions, especially for urban areas in Northwest China, which are affected by both high anthropogenic pollution and long-distance transportation.
In general, ground-based active and passive remote sensing instruments provide reliable vertical profiles and column integrated aerosol optical properties. Their long-term continuous observations can improve our understanding of global and regional AOPs and their impact on the Earth’s climate (Holben et al., 2001; Kaufman et al., 2002; Sanap and Pandithurai, 2014). The sun-photometer or sky-radiometer has been confirmed to be the best-suited passive methods for measuring aerosols (Dubovik et al., 2000). Therefore, different observation networks have been established around the world, e.g., AERONET (Holben et al., 1998; Dubovik et al., 2000), SKYNET (Nakajima et al., 2020) established by United States and Japan, respectively, and CARSNET (Che et al., 2009; Che H. Z. et al., 2015), CSHNET (Xin et al., 2007) and SONET (Li et al., 2018) developed by China. Therefore, with the global and regional development of monitoring network, AOPs of many areas in China and around the world have been studied and reported (Hsu et al., 1999; Torres et al., 2002; Xia et al., 2004; Eck et al., 2005; Tripathi et al., 2005; Kim et al., 2007; Bi et al., 2013; Wang et al., 2014; Che H. et al., 2015; Ma et al., 2016; Xin et al., 2016; Su et al., 2018).
In addition, active lidar is commonly used due to its advantages of detecting the vertical distribution of aerosols. Lidar observation networks have been established in Europe (EARLINET) and Asia (AD-NET) for long-term continuous observation of aerosols, thereby advancing our knowledge of aerosols and their influence on climate (Murayama et al., 2001; Ansmann et al., 2003). However, the lidar ratio (LR) can affect the accuracy of optical parameters derived from active elastic lidar. Thus, the accurate LRs of different aerosol types (e.g., urban/industrial, marine, desert dust and biomass-burning) are important to ensure the accurate inversion of extinction coefficient and backscattering for elastic lidar (Ansmann, 2006). So, LRs of different aerosol types based on observations with sun-sky radiometer at different source regions around the globe have been presented (Shin et al., 2018). Nevertheless, the results of these methods need further verification and confirmation (Holben et al., 2001; Shin et al., 2018). Raman lidar (RL) has the advantage of independently retrieving the extinction and backscattering coefficients without assuming the LR. So, the LRs of all the aerosol types can be extracted directly from RL measurement, which are essential for verifying LRs obtained by sky-radiometer. For example, Müller et al. (2004), Müller et al. (2007) reported that the LRs of Saharan dust aerosols retrieved by AERONET was larger than that measured directly by lidar (Schuster et al., 2012). presented the LRs in the dust source regions of the northern Africa and the Arabian Peninsula by combining AERONET and CALIPSO observations, and indicated that the results were consistent with the Raman lidar observations (Tesche et al., 2009; Mamouri et al., 2013). However, direct measurements and studies of AOPs (especially for LR) were rarely conducted using RL and sky-radiometer in Northwest China, especially in heavy polluted urban regions (Cao et al., 2012; Su et al., 2018). Besides, LR is highly sensitive to regions and aerosol sources (Shin et al., 2018).
This paper presents some results of long-term AOPs including LR collected at Xi’an using a ground-based sky-radiometer and LR validated by simultaneous measurements of a RL system through several case studies. Section 2 briefly describes the study site, instrument and inversion method used in this paper. The statistical analysis of the AOPs and LR, and the comparison with the RL are presented in Section 3. Some discussions and conclusions are given in Section 4.
2 Measurements and methodology
2.1 Site description
Xi’an, the capital of Shaanxi Province and the largest city in Northwest China, has a population of about 12.9 million and a population density of 1,282 person/km2. It is located in the middle of the Guanzhong Plain, adjacent to the Loess Plateau to the north, and the Qinling Mountains to the south. It belongs to the warm temperate, semi-humid continental monsoon climate, and the northeast wind prevails all year round. The rapid development of industry, urbanization and tourism in recent years has caused a dramatic increase in anthropogenic emissions, resulting in frequent occurrence of haze weather and poor diffusion of pollutants coupled with the unique topographical environment and climatic conditions in this region (Su et al., 2018). In addition, due to the prevailing monsoonal winds, it is often affected by dust storms transported from the western and northwestern Chinese deserts (Cao et al., 2005). Therefore, Xi’an can be considered as a typical city in Northwest China with significant air pollution problems influenced by both anthropogenic and natural aerosol sources (Zhang et al., 2002).
2.2 Sky-radiometer
The sky-radiometer (POM-02) was installed at the Jinhua schoolyard Xi’an University of Technology (XAUT) in January 2015. It is located at the East 2nd ring road of Xi’an city in Shaanxi Province in the northwestern China (34.25°N, 108.98°E; 396.9 m above sea level). It was manufactured by PREDE Co. Ltd. In Japan. The spectral observations of the direct Sun and diffuse sky radiances are set at 315 nm, 340 nm, 380 nm, 400 nm, 500 nm, 675 nm, 870 nm, 940 nm, 1,020 nm, 1,627 nm and 2200 nm. Among them, the 315 nm and 940 nm channels can be used to calculate the total ozone column content (Khatri et al., 2014) and water vapor column content (Campanelli et al., 2014), respectively. The 1627nm and 2200 nm channels can be applied to obtain the optical characteristics of the cloud, while the remaining channels can be utilized to provide aerosol optical parameters. The installation has been operational since January 2015. The calibration and validation were performed using the traditional Langley method, the improve Langley method and the integrating sphere (Campanelli et al., 2004). Depending on the wavelength, the accuracy of the method ranged 1–2.5%. The Skyrad package (Version4.2; Nakijima et al., 1996) was used to process and analyze the POM-02 measurements. And, the cloud screening algorithm developed by Khatri et al. (2014) was carried out in this manuscript, which mainly includes three steps: test with irradiance data, spectral variability test, and statistical analyses test, respectively. The uncertainty of optical properties retrieved have also been reported (Che et al., 2008; Nakajima et al., 2020). The absolute uncertainty of retrieved aerosol optical depth (AOD) was estimated to be about 0.01–0.02 for λ ≥ 500 nm and a larger value of about 0.03 for shorter wavelengths. Mean values of SSA retrieved from the PREDE sky-radiometer were significantly larger than those from the Cimel Sun photometer, with differences between 0.03 and 0.07, and the difference of real parts of RI obtained using the two instruments does not exceed 2.6%. The clear sky observations of POM-02 from January 2015 to March 2018 were selected and the observation details (i.e., daily or monthly atmospheric conditions) are shown in Table 1. Notably, the observation days in September, October, and November were so few, which could not fully represent the properties of aerosols in autumn over Xi’an region. Nonetheless, all available data would be discussed and findings for these months should be handled with care. Here the daily average of AOPs are calculated when the number of effective aerosol observations per day is more than three, and then the monthly average and seasonal average are obtained.
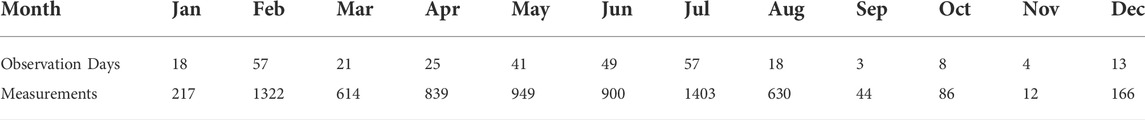
TABLE 1. Effective observation days and measurements per month using sky-radiometer in Xi’an.
2.3 Raman lidar
Figure 1 shows a schematic diagram of a RL system developed by XAUT, which is used to measure the vertical profile and LR of aerosols at 354.7 nm in study. The detection principle is that an Nd:YAG laser after triple frequency emits light into the atmosphere with an eye-safe wavelength of 354.7 nm. The returned lidar signal interacting with the clouds and aerosols in the atmosphere is received by a telescope with a diameter of 250 mm and redirected into new lidar spectroscopy system. The system employs a dichroic mirror (DM) as the main spectroscopic device to reduce the influence of solar background radiation, and uses the filters (Fs) with a bandwidth of 1 nm and a peak rejection ratio of 65% to obtain the wavelength of interest and suppress strong elastic signals. The combination of DM and Fs can achieve high-efficiency signal extraction and acquire a 108 of rejection rate of elastic Mie-Rayleigh signals. The returned signal is divided into three signals. The first is the Mie-scattering signal obtained by reflection from DM1 and then by the F1 filter with the center wavelength of 354.7 nm, which is used to monitor the backscattering signals of molecular and aerosol. The second is that the signal emitted by DM1 is reflected by DM2 and filtered by F2 to obtain a Raman signal with a central wavelength of 386.7 nm for nitrogen molecules. Finally, the combination of DM2 and F3 is used for the Raman signal detection of water vapor molecules with a wavelength of 407 nm. Besides, SHG, THG, and PMT in Figure 1 represent second harmonic generation, third harmonic generation and photomultiplier tube, respectively.
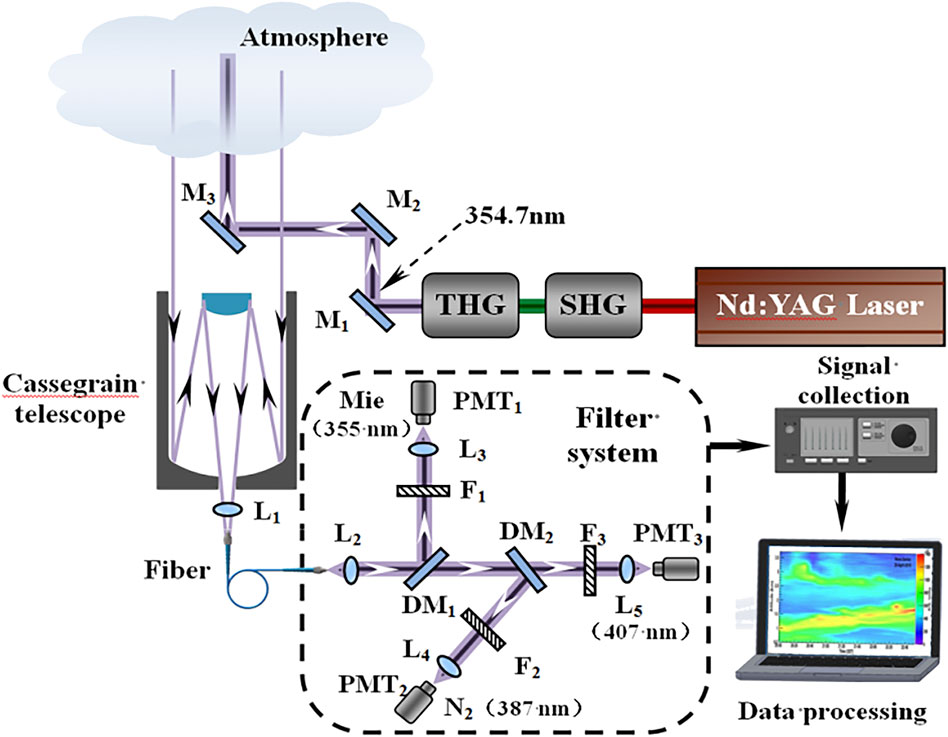
FIGURE 1. A schematic diagram of Raman lidar system.
2.4 Lidar ratio
2.4.1 Lidar ratios retrieved from sky-radiometer
LR (S) is defined as the ratio of aerosol extinction (σa) and backscatter coefficient (βa), which is given by:
The scattering and extinction of light by a single aerosol particle is determined by the parameter r and refractive index m (RI). The overall optical properties of a particle system are determined by the individual particle optical properties as a set of particle spectral distributions:
where rm and rM represent the minimum and maximum aerosol particle radiuses, respectively; Qext and Qb represent the extinction and backscatter efficiencies, respectively. dN(r)/dlnr represents the aerosol number spectrum, which has a relationship with the aerosol volume spectrum distribution (VSD) dV(r)/dlnr. The latter can be expressed as:
Aerosol extinction coefficient and backscatter coefficient are calculated based on Eqs 2–4 by combining Mie-scattering theory and aerosol VSD and RI derived from sky-radiometer. So, LR can be retrieved by sky-radiometer and Mie-scattering theory using Eq. 1.
2.4.2 Lidar ratios retrieved from Raman lidar
Raman lidar can obtain the extinction and backscattering coefficients of aerosols without assuming LRs derived from the received elastic scattering [P (λL,z)] and N2 vibrational Raman signals [P (λR,z)], which are expressed as:
Where λL and λR represent the received wavelengths of the Mie channel (354.7 nm) and the N2 vibrational Raman channel (386.7 nm), respectively; CR and CM represent the system constant of Raman and Mie channels;
Based on Eq. 5, the aerosol extinction coefficient αa can be retrieved:
where k is the aerosol wavelength exponent, and k is generally assume to be 1 for the tropospheric aerosol.
The aerosol backscattering coefficient βa can be retrieved by combining Eqs 6–7, which is given by:
Where zc is the reference height.
To this end, LR can be derived using RL measurements by combining Eqs 7-8. Specifically, the LR derived from RL observations is limited while the sky-radiometer can obtain a large amount of LR data. Therefore, LRs from sky-radiometer are verified and analyzed by comparing with RL-derived results over the Xi’an area in this paper. This would provide a reference value for the inversion of extinction coefficient and backscatter profiles for elastic backscatter lidar which require an a priori estimate.
3 Results
Here we investigate and analyze the variations and characteristics of AOPs (e.g., AOD, AE (Ångström exponent), VSD, SSA (single-scattering albedo), ASY (asymmetry factor), RI and LR) derived from sky-radiometer observation data over the XAUT site during 2015–2018. Moreover, the accuracy of the sky-radiometer-derived LRs is validated and evaluated using inversion results of the RL system.
3.1 AOD and angström exponent
Figure 2 shows the monthly and seasonal averages of AOD and AE at XAUT site from January 2015 to February 2018 and Figure 3 shows the frequency distribution of AOD and AE during this period. Higher values of AOD500 occurred in October 2016 (0.87) and March 2018 (0.81), while lower values happened in May (0.35) and November (0.32) 2017. The average AOD500 in winter was about 0.68 ± 0.36, slightly higher than those in other seasons (spring: 0.6 ± 0.36; summer: 0.59 ± 0.33; autumn: 0.62 ± 0.4). The 3-year average AOD400 in Xi’an was about 0.75 ± 0.42, comparable to the values of other economic regions, such as 0.71 in Beijing (Yu et al., 2017) and 0.74 in Shanghai (Cheng et al., 2015). The high AOD in Xi’an indicates the heavy overall aerosol loading and frequent weather pollution in this region. As the largest city in Northwest China, industrial and human activities (e.g., industrial pollution, traffic emissions and residential heating) are the main reasons for high AOD values and severe pollution. Secondly, long-distance transport of dust aerosols from the Loess Plateau may also lead to an increase in atmospheric AOD. Thirdly, in the harvest seasons (such as summer and autumn), a large amount of straw is often burned from nearby farmland, resulting in frequent occurrence of haze conditions (Xia et al., 2013). The 3-year average AE value was about 0.94 ± 0.34, close to the results of Beijing (Li et al., 2018), indicating the dominance of fine-mode particles in the Xi’an area. The higher values of the monthly mean of AE occurred in July 2015 (1.18), and July 2017 (1.20), while the lower values were in April 2017 (0.77) and February 2016 (0.7). On the seasonal average, the AE values were the lowest in spring (0.81), but higher in summer (1.06) and autumn (1.03). It is known that a high AE indicates the dominance of fine particles, while a low AE value indicates that coarse particles are dominant. The low AE value in spring in Xi’an could be related to the long-distance transport of dust aerosols from the northern and northwestern China (Su et al., 2018).
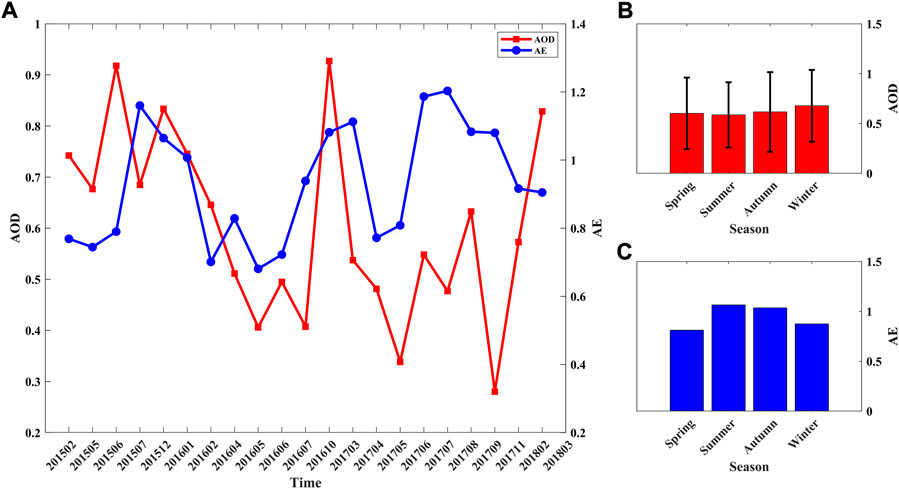
FIGURE 2. The monthly (A) and seasonal averages (B, C) AOD and AE during 2015 and 2018.
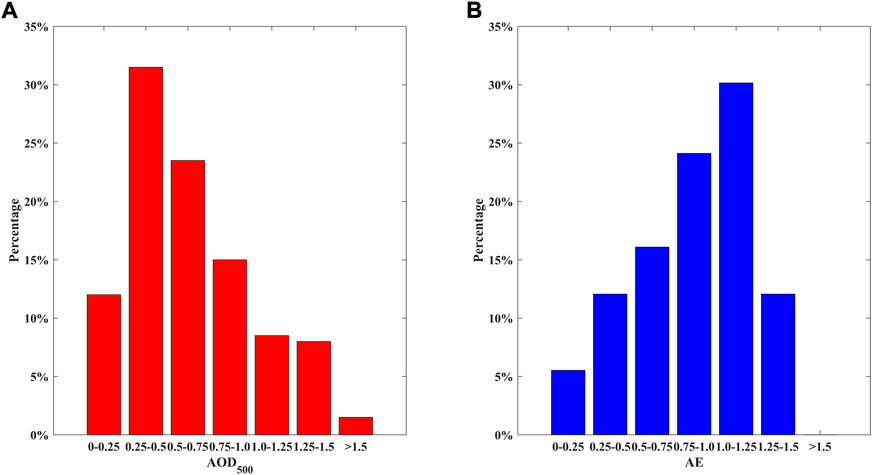
FIGURE 3. The frequency distribution AOD (A) and AE (B).
Figure 4 shows the dependence of the daily mean values of AOD on wavelength, where the average, maximum and minimum values are marked with different symbols, respectively. It reveals that daily mean values of AOD decreased with the increase of wavelength. For example, the AOD340 daily average varied from 0.08 to 2.66 with a mean of 0.72; and the AOD500 daily average ranged from 0.07 to 1.99 with a mean of 0.54. This is consistent with the changing characteristics of AOD in other continental urban areas, mainly because anthropogenic emissions are the main source of aerosols in urban areas (Che H. Z. et al., 2015).
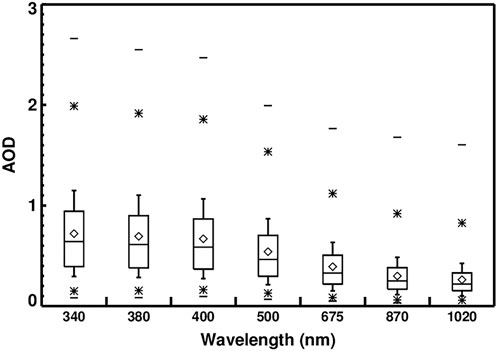
FIGURE 4. AOD at different wavelengths in XAUT during 2015–2018. The horizontal line in the middle of the box represents the median, while the upper and lower horizontal lines represent the 25th and 75th percentiles, respectively. The diamond represents the mean; the uppermost and lowest short lines represent the maximum and minimum values; and the asterisks represent the 1–99% range.
Some studies have demonstrated the feasibility of using optical and microphysical properties under different wavelengths to differentiate aerosol types (e.g. Dubovik et al., 2002). Currently, the most common and widely used method is the combination of AOD and aerosol size to distinguish different aerosol types (Pace et al., 2006; Kaskaoutis et al., 2007; Patel and Kumar, 2015, 2016). Specifically, different cluster regions can be categorized using the scatter plots of AOD500 and AE400-870. They are based on different thresholds selected according to physically aerosol parameters, and different regions represent different aerosol types (Kaskaoutis et al., 2011; Kumar et al., 2015). The selection of thresholds could differ in different study areas due to differences in aerosol loadings, meteorological conditions and emission sources. Since Xi’an is a densely populated and highly industrialized region, the AOD500 is quite high even without heavy pollution. Therefore, the thresholds chosen for the clean continental (CC) aerosols representing the background state over Xi’an are AOD500 < 0.3 and AE400-870 > 0.9, while long-distance transported desert dust (DD) aerosols corresponds to AOD500 > 0.7 and AE400–870 < 0.7. Cases that do not belong to any of the above categories are called mixed type (MX). Figure 5 shows the scatter plots of the AOD500 and AE400–870 for all seasons. Apparently, the range of ordinate AE varied greatly, indicating that the aerosol characteristics in Xi’an area can vary greatly, and the aerosol in the atmosphere can experience several different types of mixing. Table 2 displays the contributions of various aerosol types in different seasons. The MX aerosols accounted for the largest contribution over XAUT site which ranged from 40.14% (in autumn) to 69.9% (in spring), followed by BB/UI aerosols with wide range from19.9% (in spring) to 43.66% (in winter). In addition, CC aerosol holds a considerable proportion in the study region that peaked in summer (21.24%), indicating the relatively clean atmosphere and good air quality in Xi’an in summer. DD aerosol occurred mainly in spring (3.08%) and winter (6.63%). It is worth noting that the proportion of aerosol types in autumn is highly uncertain due to a limited observation data. Overall, these results suggest that the aerosols produced by local production, biomass burning, or transportation pollution in the Xi’an area are the dominant aerosols in the whole year, followed by dust aerosol.
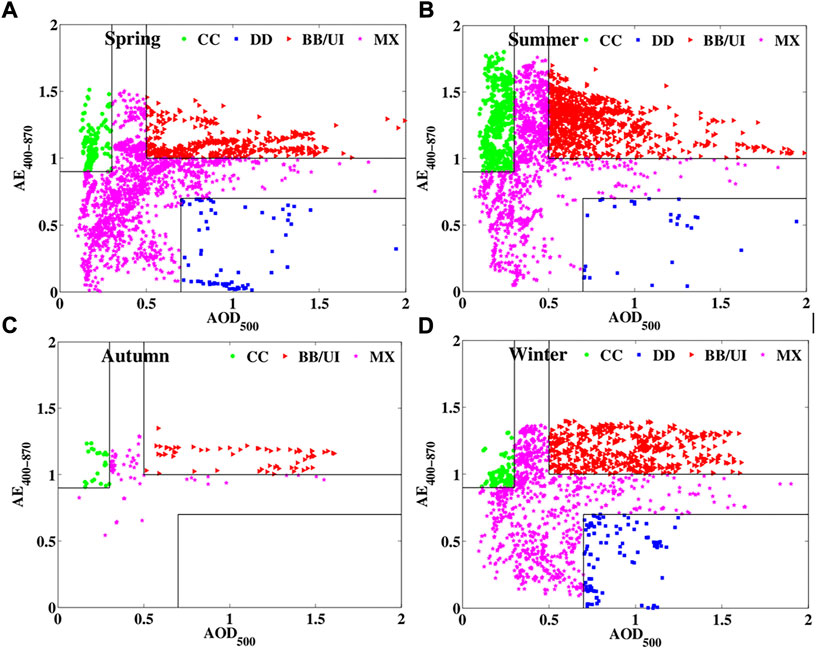
FIGURE 5. Different aerosol types (green: CC; blue: DD; red: BB/UI; purple: MX) were discrimination based on the relationships of AOD500 and AE400-870 in different seasons (Spring (A), Summer (B), Autumn (C), Winter (D)).

TABLE 2. Proportions of aerosol types in different seasons.
In addition, the size of fine aerosols and their contribution to AOD were analyzed using the graphical method (developed by Gobbi et al. (2007), which can be used to analyze the mixture of polluting aerosols and dust and distinguish the hygroscopic growth of aerosols from cloud contamination. In Figure 6, different colors indicate different AOD675 ranges. The solid black lines represent the size (Rf) of the fine mode in the aerosol size distribution, and the dashed blue lines represent the contribution (η) of the fine-mode aerosol to the total AOD675. δAE denotes the difference between AE400-675 and AE675-870, which is more sensitive to Rf than the η curves. δAE∼0 indicates the presence of cloud contamination or the contribution of coarse aerosols to total AOD of above 90%. Conversely, it represents an increase in fine-mode aerosol (Rf) and the percentage of fine-mode aerosol to total AOD675 (Gobbi et al., 2007). The relatively high AOD675 value (>1.0) in spring (see Figure 5A) was mainly related to the coarse particles (δAE>0, AE<0.3, η< 30%) and fine particles (δAE<0, AE>0.8,η>70%) in some typical examples, which was mainly driven by the dust event in spring and the hygroscopic growth of fine particles. However, in summer, the contribution of fine particles increased (Rf ∼ 0.15–0.25 μm, η>80%), and the high AOD675 value was primarily affected by the hygroscopic growth of fine particles which was weaker in autumn compared with summer (Figure 5C), mainly due to the relatively low water vapor content in atmospheric in autumn. The particle size range corresponding to higher AOD values mostly concentrated in 0.15–0.20 μm and η was around 70%–90%. Meanwhile, it is found that the AODs were affected by coarse and fine particles growth in winter. The relationship of AOD and relative humidity from 2015 to 2018 is also shown in Figure 7, which show the positive dependencies of AOD on relative humidity. In summary, the high value of AOD in Xi’an was affected by accidental factors, e.g., dust weather in spring and winter, and the accumulation of fine particle aerosols, which has been found in all seasons and was related with the hygroscopic growth of fine mode aerosols in summer and autumn, and aerosols growth in stable weather in winter. This finding further validates the results shown in Table 2 and Figure 5.
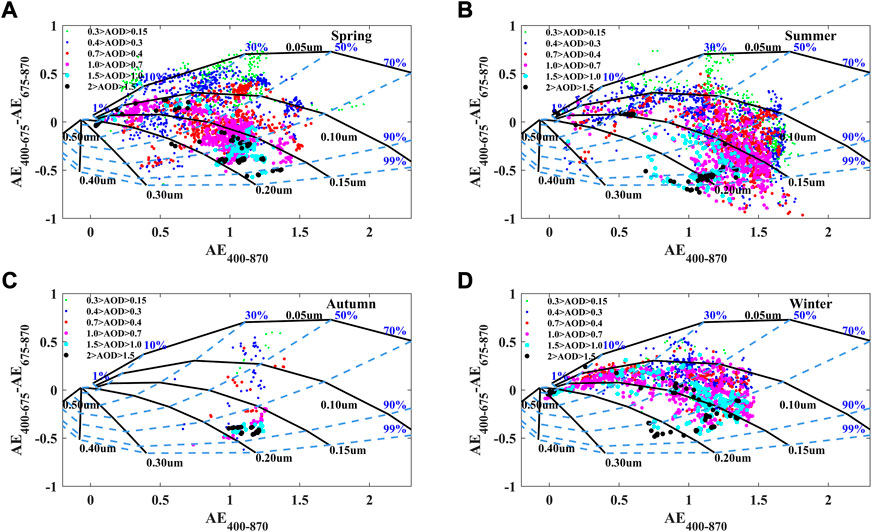
FIGURE 6. Seasonal (Spring (A), Summer (B), Autumn (C), Winter (D)) means Ångström exponent differences, δAE = AE400-675-AE675-870 as a function of AE400-870 and AOD675. Different colored dots indicate different AOD ranges.
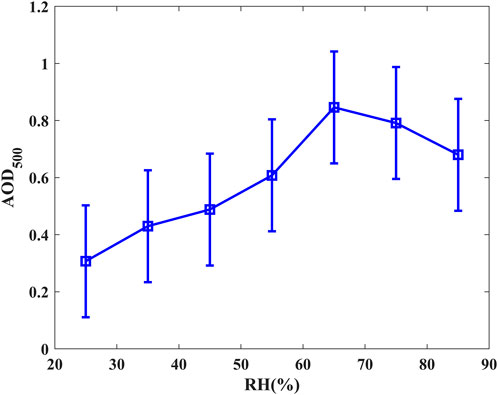
FIGURE 7. The relationship of AOD and relative humidity from 2015 to 2018. AOD are averaged for seven relative humidity bins ranging from 20% to 90%, and the vertical lines indicate standard deviation.
3.2 Aerosol volume size distributions
The VSD is closely related to atmospheric conditions, and directly determines the properties of parameters (e.g., aerosol effective radius, optical depth, etc.) (Eck et al., 2010; Sinha et al., 2012). In a sense, aerosol VSD is also an important parameter in models and observations. Earlier studies suggested that the uncertainty of VSD is about 15% (Kaskaoutis et al., 2013). Figure 8 presents the seasonal average of VSDs in Xi’an and the vertical bars indicating the standard deviation of VSD. The figure shows some complex patterns and typical seasonal distribution differences. The overall VSD can be divided into two modes, i.e., fine mode (particle size (R) < 0.6 μm) and coarse mode (R > 0.6 μm), similar to those obtained by others in different situations (Dubovik et al., 2002; Singh et al., 2004; Alam et al., 2011, 2012; Adesina et al., 2014, 2017; Wang et al., 2014; Patel et al., 2017). The more subdivided results show that there was a typical bimodal distribution in winter, and a trimodal distribution in spring, summer and autumn. The peak radiuses of fine-mode and coarse-mode particles in the bimodal distribution in winter were centered with the dominance of coarse particles, at 0.25 μm and 5μm, respectively. The trimodal distribution in other seasons was a fine mode with R < 0.6μm, an intermediate mode located between 0.6 μm and 2.5μm, and a coarse mode with R > 2.5 μm. The summer VSD in the fine mode was higher than other seasons, indicating the relatively high fine-particle aerosols in summer compared with those in other seasons. This could be related to the enhanced chemical reaction of the atmosphere (Song et al., 2002) promoting the formation of ultrafine and fine particles, and the increase of the relative humidity in summer accompanied by the growth in number of particles with a radius >0.1 μm (Liu et al., 2011). Under the coarse mode, there was a characteristic of being higher in spring and winter than other two seasons. The main reasons could be due to the transportation of relatively large size dust particles in spring (Wang et al., 2010), serious weather pollution in Xi’an area during winter, resulting in large aerosol particles. It is worth noting that the particle radius is greater than 10 μm occurred in every season, which probably related to cloud contamination (Kudo et al., 2021).
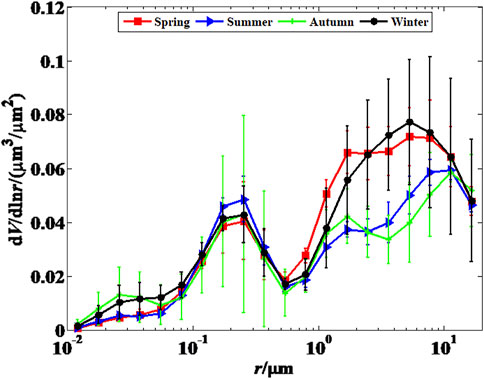
FIGURE 8. Seasonal mean aerosol volume size distributions for spring (red), summer (blue), autumn (green) and winter (black) at XAUT station.
3.3 CRI, single-scattering albedo and ASY
Generally speaking, the real and imaginary parts of CRI represent the scattering and absorption effects of aerosol particles, respectively. Figure 9A displays the change of real CRI as a function of wavelength in different seasons, revealing that the real CRI exhibited significant seasonal variations, and the spectral dependence of real CRI was less obvious. There was a weak growth trend in the 400–870 nm, mainly due to the strong scattering of coarse particles in the near-infrared band (Wang et al., 2014). The average values of real CRI at 500 nm were 1.45 ± 0.04, 1.42 ± 0.06, 1.48 ± 0.05, and 1.45 ± 0.04 from spring to winter, respectively. Especially, lower values in summer indicate the presence of fine-mode absorbing particles (Alam et al., 2011, 2012; Che et al., 2013).
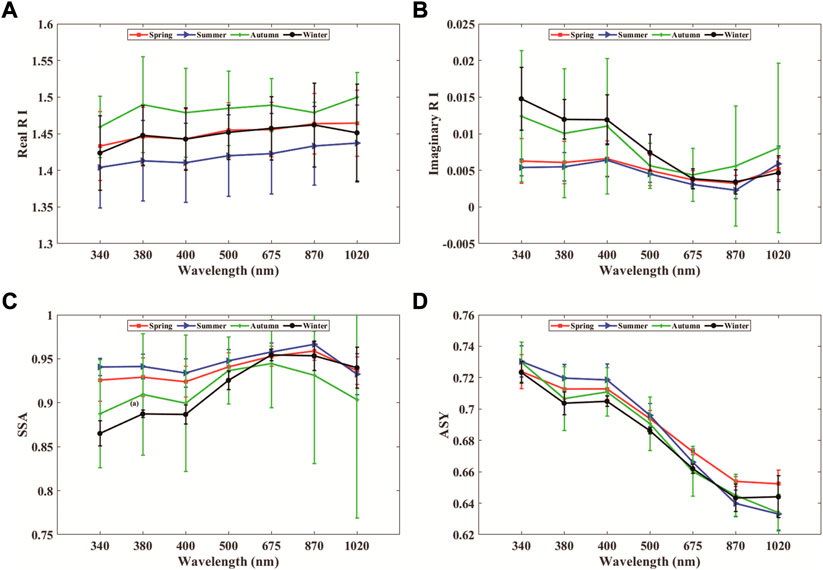
FIGURE 9. Seasonal averaged of real (A) and imaginary of RI (B), SSA (C), and ASY (D) at seven wavelength.
Seasonal mean values and the change of the imaginary CRI as a function of wavelength are shown in Figure 9B. Relative to the results in Figure 9C, its imaginary CRI and SSA experienced opposite trends as wavelength (in line with the theoretical basis). Similar to Wang et al. (2014), the imaginary CRIs were highly sensitive to the wavelength, which declined rapidly at 400–675 nm and started to increase from 870 nm to 1020 nm. The average values of imaginary CRI500 in the four seasons were 0.0050 ± 0.0021, 0.0045 ± 0.0011, 0.0056 ± 0.0031, and 0.0074 ± 0.0025, respectively. Similar seasonal variation has also been observed in Beijing (Yu et al., 2017; Su et al., 2018). The higher values of the imaginary CRI could be related to the large amount of absorbing aerosols produced by central heating in winter, while the lower value confirms the existence of scattering aerosols in the atmosphere in spring (Singh et al., 2004; Adesina et al., 2017).
SSA is defined as the ratio of scattering and extinction of aerosol particles, and is often used to reflect the scattering and absorption characteristics of particles in terms of cooling or warming. Different aerosol particles contain different spectral variation of SSA (Alam et al., 2012; Patel et al., 2017). For instance, sulfate aerosols are pure scattering aerosols, while black carbon aerosols are absorption-dominant aerosols. Spectral variation in SSA differed substantially during different seasons, revealing the changing seasonal characteristics of SSA under different wavelengths. SSAs (Figure 9C) in Xi’an area were relatively high during spring and summer, mainly attributed to fine pollution aerosols and high water vapor content in the atmosphere besides dust aerosol transportation in spring (similar to Singh et al. (2004)). The low SSA winter was mainly caused by the large number of carbonaceous particles brought by centralized heating and anthropogenic activities. The standard deviations of SSA in autumn is significantly larger than other reason, which are probably related to the limited observation data. Meanwhile, the variation of SSA with wavelength also exhibited a significant seasonal variation. The overall trend increased with wavelength, indicating stronger scattering in the visible and near-infrared spectrum (Dubovik et al., 2002). In detail, SSAs continued to increase from 400 nm to 870 nm in spring, summer and winter, indicating the presence of aerosol particles with high scattering effect from visible to the near-infrared spectrum (Sokolik and Toon, 1999). After that, they declined slightly from 870 nm to 1020 nm across different seasons (Wang et al., 2014). In addition, the SSA value reached the lowest level in winter from 340 nm to 675 nm, mainly caused by the strong absorption capacity and wavelength dependence of carbonaceous aerosols which made the absorption cross-section to drop significantly from UV to VIS (Kirchstetter et al., 2004; Feng et al., 2013). Similar to previous observations in the Yangtze River Delta of China (Liu et al., 2012), the difference in autumn is that SSAs increased with wavelength in the range 400–675 nm, and declined with wavelength in the range 675–1020 nm.
Figure 10 shows the seasonal average of real RI, imaginary RI, and SSA at 500 nm for BB/UI and DD aerosol, based on the classification in Figure 5. Compared with BB/UI, the real RIs of DD are larger, but the imaginary RIs have smaller values in spring, summer, and winter, indicating that DD has stronger scattering and weaker absorption. The imaginary RIs and SSAs of BB/UI have strong seasonal variation. Especially for summer, the imaginary RI is weak and the SSA is larger than 0.95. The high SSA values observed in the BB/UI aerosols were possibly related to the aging of smoke plume during transport and hygroscopic growth (Yu et al., 2013).
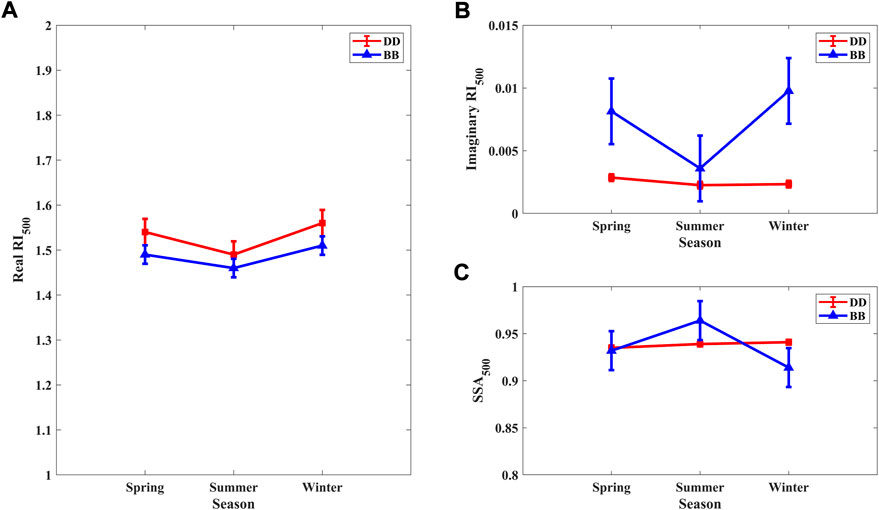
FIGURE 10. Seasonal averages of real RI (A), imaginary RI (B), and SSA (C) at 500 nm for BB/UI and DD aerosols.
The ASY represents the first-order moment of the scattering phase function, which describes the scattering direction of light after interacting with aerosol particles. It is related to particle size and composition, and is a key parameter that determines aerosol radiative forcing. ASYs range from 0.1 in very clean conditions to 0.75 in polluted and cloud-free atmosphere (Zege et al., 1991). Figure 9D shows the variation of ASY with wavelength in different seasons, decreasing from a maximum value of 0.74 for short wavelengths to a minimum value of 0.62 for long wavelengths, which exhibited the same change trend for all seasons with a continuous downward trend in the visible band and a slight upward trend after 870 nm. The peak values of ASY in summer and spring occurred at 340–500 nm and 500–1,020 nm, respectively. The significant decline of ASY in summer and autumn indicates suggesting that absorbing anthropogenic aerosols are dominant (Alam et al., 2011, 2012; Bibi et al., 2017). However, lower decrease in spring and winter suggests the presence of coarse-mode scattering aerosols (mainly dust) in fine-mode absorbing aerosols (Alam et al., 2012).
3.4 Lidar ratio
Using the aerosol VSD and CRI inversion of the sky-radiometer, combined with the Mie-scattering theory, the daily aerosol LRs in Xi’an area from 2015 to 2018 are retrieved. To compare with the results of 355 nm Raman lidar, the closest wavelength of sky-radiometer to the lidar system (340 nm) is selected in this paper. Figure 11A displays a monthly change of aerosol LRs in 340 nm over Xi’an region. It reveals the large fluctuation of aerosol LRs in Xi’an at different time, indicating the huge changes in the monthly aerosol composition and microphysical characteristics in Xi’an. Among them, the higher values occurred in September (85.35 ± 26.48) and January (69.88 ± 13.25), while the lowest value happened in May (41.40 ± 8.61). Figure 11B illustrates the seasonal variation distribution of the aerosol LRs in 340 nm. It shows the aerosol LRs in different seasons at averages of 57.41 ± 6.00, 49.95 ± 8.89, 63.95 ± 6.77, and 63.24 ± 20.15, respectively. The reason why the aerosol LR bottomed in spring might be related to the frequent dust weather occurrence in Xi’an accompanied by the mixing of a large amount of dust aerosol in the air. Besides, previous studies have confirmed that the LR of large DD is generally lower than other aerosols (Franke et al., 2001; Ansmann et al., 2005). The higher aerosol LRs in autumn and winter could be due to the increased concentration of small carbon-containing aerosol particles in the air mainly from concentrated heating with high absorption (Franke et al., 2001; Ansmann et al., 2005). However, the LRs in autumn need to be further validated and analyzed due to so few effective observation data. Figure 11C shows the annual distribution of the 340 nm LRs in Xi’an during 2015–2018. We would like to point out the effective measurements of 2 months (i.e., February and March) in 2018. It can be seen that the highest aerosol LR in 2017 was 60.22 ± 14.54, and the results for the other 3 years differed little, which were 51.57 ± 13.64 (2015), 52.38 ± 14.15 (2016), and 55.73 ± 9.74 (2018), respectively. The reason why the LR in 2017 was relatively high might be related to the serious air pollution and the complicated types of aerosols in that year (Su et al., 2018). Figure 11D shows the spectral variations of LRs, and the average values from 36.55 ± 13.40 at 870 nm to 61.16 ± 25.92 at 340 nm, with the characteristics of LRs of overall decline at shorter wavelengths (340–870 nm) and increase at longer wavelengths (870–1,020 nm).
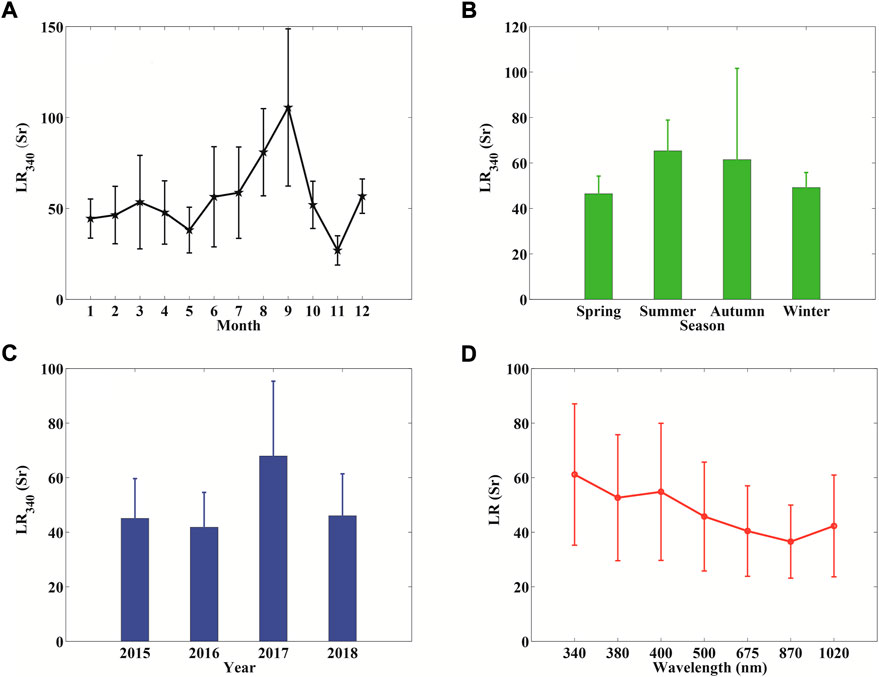
FIGURE 11. Monthly (A), seasonally (B), yearly mean (C) and spectral variations of lidar ratios (D).
Furthermore, according to the method of classifying aerosols based on AOD and AE, the average aerosol LRs of different types are obtained. Here we emphasize more on the effects of nonsphericity of mineral dust which cannot be taken into account in the calculation of LR of dust aerosol (owing to Mie-scatter theory used in this paper is only suitable to spherical particles). The results reveal that the average value of the LRs was 45.57 ± 17.48 for clean aerosol. The LR of BB/UI aerosol was 60.87 ± 12.18, close to the LR of 62 detected in Balis et al. (2000). Besides, the LR of DD and MX were 52.24 ± 14.30 and 47.06 ± 11.21, respectively.
3.5 Case study: Comparative analysis of lidar ratios
In this paper, the LRs and their errors inverted by the sky-radiometer are compared and analyzed with the LRs (355 nm) derived from Raman lidar system. There is negligible difference in extinction and backscatter between the two wavelengths. Figure 12 shows the distribution of aerosol backscatter, extinction coefficient and LR profiles at 355 nm with different measurement time, respectively. To realize collaborative observation and comparison of sky-radiometer and lidar, the observation time interval of two instruments is kept within 6 min (see Table 3). We think that uniform atmosphere condition can be observed by the two instruments when the difference in measurement time is small. Overall, the effective detection height of backscatter coefficient can exceed 8km, while the extinction coefficient can only reach about 3 km. Figure 11A shows the backscatter coefficients at Feb. 02, 2018 with a loft layer within the height of 2.0–3.0 km. It can be seen that the profile of the aerosol backscatter coefficient had a certain fluctuation within the height of 5–6 km at Mar. 27, 2018, and a maximum value near 5.2 km. Figure 11B shows that extinction coefficients at 355 nm were highly variable which varied from 0.2km−1 to 0.4 km−1 in the lofted particle layer. The maximum values still occurred at around 2.5 km height and displayed the lofted layer in 2.0 km and 3.0 km with extinction coefficients of 0.4 km−1 and 0.3 km−1 at 15:44 and 15:59 27 Mar. 2018, respectively. They showed the tendency of the lofted layer to rise and fall with time. Figure 12C shows the comparison of the LR from 355 nm RL measurements with the column-averaged of the sky-radiometer at three different measurement times. The LR from sky-radiometer was determined according to Eqs 1–5 which indicate different aerosol characteristics. Ansmann et al. (2005) showed that LR decreases with particle size and increases with relative contribution of absorption to total extinction. Moreover, LR is generally lower for larger particles with lower light absorption (roughly 20–30 sr), and larger for small particles with highly absorbing urban aerosol (about 70–100 sr) (Franke et al., 2001). Similar phenomenon can be seen in Figure 12C, where LRs increase at the range of 50–100 sr as extinction coefficient increases from lofted layer. In detail, the column averaged LRs of 67.63 sr, 64.75 sr and 56.42 sr were obtained from the three lidar measurements. The column averaged LRs from sky-radiometer are 53.61, 60.84 and 62.8 sr for the spherical particle model, respectively. Table 3 shows the relative error between the average value in the observation altitude range of Raman lidar and the LR derived from sky-radiometer, and the height ranges that the relative errors of the two detection methods are less than 10% and 20% at different times. It can be seen that the average LRs within the effective detection height of RL inversion at different times are large than the LR of sky-radiometer inversion, and the relative errors are within 6%–20%. This finding is consistent with theory and other studies (Ferrareet al., 2001; Müller et al., 2004; Müller et al., 2007). The main reason is that the aerosol LRs of the entire atmosphere are inverted using sky-radiometer, while RL detects aerosol information from lower and middle atmosphere. Besides, errors of VSD and CRI probably enter into the calculation of the LR in the case of the sky-radiometer data. Overall, the relative error between the LR of the sky-radiometer and the Raman lidar inversion is generally less than 20% at an altitude of approximately 1–2 km. Therefore, the LRs at this altitude from the sky-radiometer inversion can be used as the hypothetical value for the inversion parameters of the lidar Fernald method.
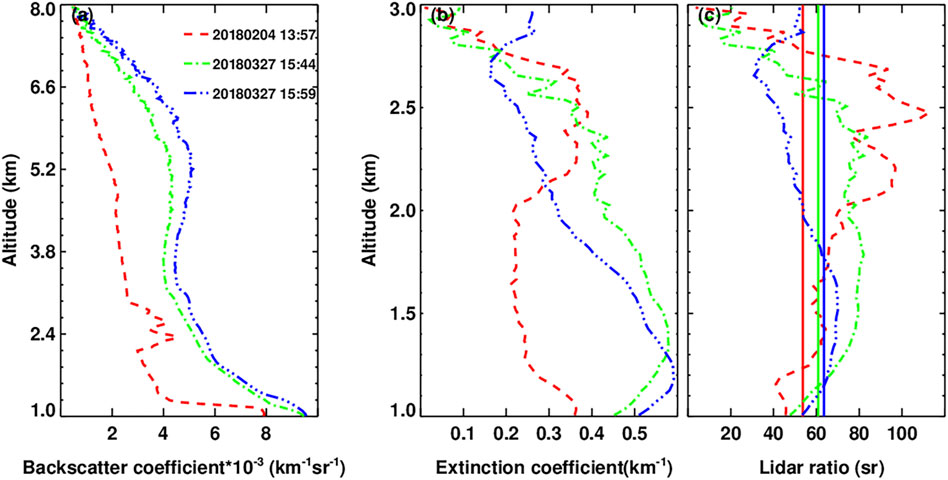
FIGURE 12. Backscatter coefficients (A), extinction coefficients (B), and lidar ratios (C) derived from Raman-Mie lidar on Feb. 04 13:57 (red dotted line),Mar. 27 15:44 (green dotted line), and Mar. 27 15:59 (blue dotted line), 2018. Red, green and blue solid lines denote the column-averaged lidar ratio from sky-radiometer at different times corresponding to lidar.
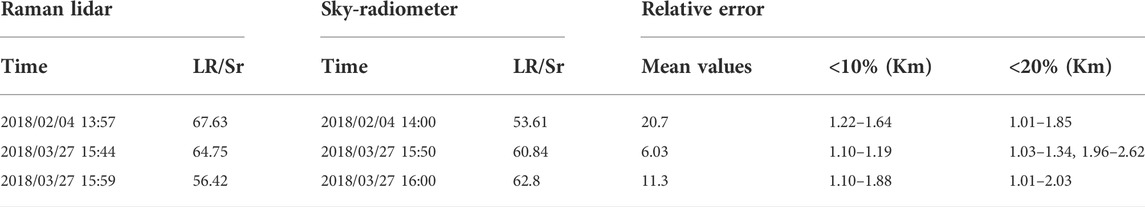
TABLE 3. The average lidar ratios and relative errors inverted using two detection methods.
4 Discussions and conclusions
Based on sky-radiometer, this study derived and analyzed aerosol micro-physics parameters (AOD, AE, SSA, VSD, VOL, CRI, and LR) in Xi’an region during 2015–2018. By combining the aerosol VSD and CRI inversion of the sky-radiometer and the Mie-scattering theory, we retrieved the daily aerosol LRs in Xi’an area from 2015 to 2018. The characteristics of the aerosol LR were analyzed statistically, and the results were used for comparison and analysis with RL.
AOD500 has a pronounced seasonal variation and the averaged AOD500 in winter was slightly higher than those in other seasons. The 3-year averaged AE value indicates the dominance of fine-mode particles in the Xi’an area and the lowest value occurred in spring. The MX aerosols accounted for the largest contribution over XAUT site, followed by BB/UI aerosols. CC aerosol held a considerable proportion which peaked in summer. The high AOD in Xi’an indicates the heavy overall aerosol loading and frequent weather pollution in this region, mainly driven by accidental factors (e.g., dust weather in spring and winter) and accumulation of fine particle aerosols across all seasons. There were a bimodal distribution in winter, and a trimodal distribution in other seasons. The summer VSD in the fine mode was higher than other seasons, and there was a characteristic of being higher in spring and winter compared to other two seasons under the coarse mode. Difference with the real CRI showed significant seasonal variations, and the imaginary CRIs were highly sensitive to the wavelength.
The cause of the lowest aerosol LR in spring might be due to the frequent dust weather occurrence in Xi’an. The higher aerosol LRs in autumn and winter could be due to the increased concentration of small carbon-containing aerosol particles in the air mainly from concentrated heating with high absorption. There was some error between the LR of the Raman lidar and sky-radiometer inversion, about 6%–20%. This could be that the observation wavelength of the Raman lidar is 355nm, while the wavelength of the sky-radiometer is 340 nm. Previous studies pointed out that the aerosol LRs correspond to different wavelengths differently. Raman lidar detects low- and mid-level atmosphere, while the sky-radiometer observes the entire layer atmosphere. Hence, some bias could be introduced in the sky-radiometer retrievals because cloudy days (thus, comparatively high aerosol water content) are underrepresented. During the inversion of the aerosol optical-physical parameters using the sky-radiometer, inaccurate calibration results of the instrument, VSD and CRI reverse errors can lead to an error of LR. Similarly, inaccurately derived extinction and backscatter coefficients can also result in an error of LR.
Data availability statement
The raw data supporting the conclusions of this article will be made available by the authors, without undue reservation.
Author contributions
LJ, HD, and GZ designed and write the paper; WJ and YQ were responsible for the design and observations of lidar system; GZ and WL contributed to data processing; LJ and ZL contributed to original draft preparation and editing; All authors have read and agreed to the published version of the manuscript.
Funding
Supported by the National Natural Science Foundation of China (Nos. 41975045, 61705180, 41875034) and the Young Talent Support Program Project (2021) of Shaanxi University Association for Science and Technology (No. 20210701).
Conflict of interest
The authors declare that the research was conducted in the absence of any commercial or financial relationships that could be construed as a potential conflict of interest.
Publisher’s note
All claims expressed in this article are solely those of the authors and do not necessarily represent those of their affiliated organizations, or those of the publisher, the editors and the reviewers. Any product that may be evaluated in this article, or claim that may be made by its manufacturer, is not guaranteed or endorsed by the publisher.
References
Adesina, A. J., Kumar, K. R., Sivakumar, V., and Griffith, D. (2014). Direct radiative forcing of urban aerosols over pretoria (25.75°S, 28.28°E) using AERONET sun photometer data: First scientific results and environmental impact. J. Environ. Sci. 26, 2459–2474. doi:10.1016/j.jes.2014.04.006
Adesina, A. J., Piketh, S., Kumar, K. R., and Venkataraman, S. (2017). Characteristics of columnar aerosol optical and microphysical properties retrieved from the sun photometer and its impact on radiative forcing over Skukuza (South Africa) during 1999–2010. Environ. Sci. Pollut. Res. 24, 16160–16171. doi:10.1007/s11356-017-9211-2
Alam, K., Thomas, T., Thomas, B., and Hussain, M. (2012). Aerosol optical and radiative properties during summer and winter seasons over Lahore and Karachi. Atmos. Environ. X. 50, 234–245. doi:10.1016/j.atmosenv.2011.12.027
Alam, K., Tratmann, T., and Blaschke, T. (2011). Aerosol optical properties and radiative forcing over mega-city Karachi. Atmos. Res. 101, 773–782. doi:10.1016/j.atmosres.2011.05.007
Albrecht, B. (1989). Aerosols, cloud microphysics, and fractional cloudiness. Science 245, 1227–1230. doi:10.1126/science.245.4923.1227
Ansmann, A., Bosenberg, J., Chaikovsky, A., Comeron, A., Eckhardt, S., Eixmann, R., et al. (2003). Long-range transport of saharan dust to northern Europe: The 11–16 october 2001 outbreak observed with EARLINET. J. Geophys. Res. 108, 4783. doi:10.1029/2003jd003757
Ansmann, A., Engelmann, R., Althausen, D., Wandinger, U., Hu, M., Zhang, Y., et al. (2005). High aerosol load over the Pearl River Delta, China, observed with Raman lidar and Sun photometer. Geophys. Res. Lett. 32, L13815. doi:10.1029/2005GL023094
Ansmann, A. (2006). Ground-truth aerosol lidar observations: Can the Klett solutions obtained from ground and space be equal for the same aerosol case? Appl. Opt. 45, 3367–3371. doi:10.1364/ao.45.003367
Balis, D., Papayannis, A., Galani, E., Marenco, F., Santacesaria, V., Hamonou, E., et al. (2000). Tropospheric LIDAR aerosol measurements and sun photometric observations at Thessaloniki, Greece. Atmos. Environ. X. 34 (6), 925–932. doi:10.1016/s1352-2310(99)00317-9
Bi, J. R., Huang, J. P., Fu, Q., Ge, J. M., Shi, J. S., Zhou, T., et al. (2013). Field measurement of clear-sky solar irradiance in badain jaran desert of northwestern China. J. Quant. Spectrosc. Radiat. Transf. 122, 194–207. doi:10.1016/j.jqsrt.2012.07.025
Bibi, H., Alam, K., and Bibi, S. (2017). Estimation of shortwave direct aerosol radiative forcing at four locations on the indo-gangetic plains: Model results and ground measurement. Atmos. Environ. X. 163, 166–181. doi:10.1016/j.atmosenv.2017.05.043
Campanelli, M., Nakajima, T., Khatri, P., Takamura, T., Uchiyama, A., Estellés, V., et al. (2014). Retrieval of characteristic parameters for water vapour transmittance in the development of ground-based sun–sky radiometric measurements of columnar water vapour. Atmos. Meas. Tech. 7, 1075–1087. doi:10.5194/amt-7-1075-2014
Campanelli, M., Nakajima, T., and Olivieri, B. (2004). Determination of the solar calibration constant for a sun-sky radiometer, proposal of an in-situ procedure. Appl. Opt. 43, 651–659. doi:10.1364/ao.43.000651
Cao, J. J., Lee, S. C., Zhang, X. Y., Judith, C., Chow, J. C., An, Z. S., et al. (2005). Characterization of airborne carbonate over a site near Asian dust source regions during spring 2002 and its climatic and environmental significance. J. Geophys. Res. 2005, D03203. doi:10.1029/2004jd005244
Cao, J. J., Wang, Q. Y., Chow, J. C., Watson, J. G., Tie, X. X., Shen, Z. X., et al. (2012). Impacts of aerosol compositions on visibility impairment in xi’an, China. Atmos. Environ. X. 59, 559–566. doi:10.1016/j.atmosenv.2012.05.036
Charlson, R. J., Schwartz, S. E., Hales, J. M., Cess, D., Coakley, J. A., Hansen, J. E., et al. (1992). Climate forcing by anthropogenic aerosols. Science 255, 423–430. doi:10.1126/science.255.5043.423
Che, H., Zhang, X. Y., Xia, X., Goloub, P., Holben, B., Zhao, H., et al. (2015b). Ground-based aerosol climatology of China: Aerosol optical depths from the China aerosol remote sensing network (CARSNET) 2002–2013. Atmos. Chem. Phys. 15 (13), 7619–7652. doi:10.5194/acp-15-7619-2015
Che, H. Z., Shi, G. Y., Uchiyama, A., Yamazaki, A., Chen, H., Goloub, P., et al. (2008). Intercomparison between aerosol optical properties by a PREDE skyradiometer and CIMEL sunphotometer over Beijing, China. Atmos. Chem. Phys. 8 (12), 3199–3214. doi:10.5194/acp-8-3199-2008
Che, H. Z., Xia, X. G., Zhu, J., Li, Z., Dubovik, O., Holben, B., et al. (2013). Column aerosol optical properties and aerosol radiative forcing during a serious haze-fog month over North China Plain in 2013 based on ground-based Sun photometer measurements. Atmos. Chem. Phys. 14, 2125–2138. doi:10.5194/acp-14-2125-2014
Che, H. Z., Zhang, X. Y., Chen, H. B., Damiri, B., Goloub, P., Li, Z. Q., et al. (2009). Instrument calibration and aerosol optical depth validation of the China Aerosol Remote Sensing Network. J. Geophys. Res. 114, D03206. doi:10.1029/2008JD011030
Che, H. Z., Zhao, H. J., Wu, Y. F., Xia, X. G., Zhu, J., Wang, H., et al. (2015a). Analyses of aerosol optical properties and direct radiative forcing over urban and industrial regions in Northeast China. Meteorol. Atmos. Phys. 127, 345–354. doi:10.1007/s00703-015-0367-3
Cheng, T. T., Xu, C., Duan, J. Y., Wang, Y. F., Leng, C. P., Tao, J., et al. (2015). Seasonal variation and difference of aerosol optical properties in columnar and surface atmospheres over Shanghai. Atmos. Environ. X. 123, 315–326. doi:10.1016/j.atmosenv.2015.05.029
Dubovik, O., Holben, B., Eck, T. F., Smirnov, A., Kaufman, Y. J., King, M. D., et al. (2002). Variability of absorption and optical properties of key aerosol types observed in worldwide locations. J. Atmos. Sci. 59, 590–608. doi:10.1175/1520-0469(2002)059<0590:voaaop>2.0.co;2
Dubovik, O., Smirnov, A., Holben, B. N., King, M. D., Kaufman, Y. J., Eck, T. F., et al. (2000). Accuracy assessments of aerosol optical properties retrieved from Aerosol Robotic Network (AERONET) Sun and sky radiance measurements. J. Geophys. Res. 105, 9791–9806. doi:10.1029/2000jd900040
Eck, T. F., Holben, B. N., Dubovik, O., Smirnov, A., Goloub, P., Chen, H. B., et al. (2005). Columnar aerosol optical properties at AERONET sites in central eastern Asia and aerosol transport to the tropical mid‐Pacific. J. Geophys. Res. 110, 5274. doi:10.1029/2004JD005274
Eck, T. F., Holben, B. N., Sinyuk, A., Pinker, R. T., Goloub, P., Chen, H., et al. (2010). Climatological aspects of the optical properties of fine/coarse mode aerosol mixtures. J. Geophys. Res. 115, D19205. doi:10.1029/2010JD014002
Feng, Y., Ramanathan, V., and Kotamarthi, V. R. (2013). Brown carbon: A significant atmospheric absorber of solar radiation? Atmos. Chem. Phys. 13 (17), 8607–8621. doi:10.5194/acp-13-8607-2013
Ferrare, R. A., Turner, D. D., Heilman, L., Feltz, W. F., Dubovik, O., and Tooman, T. P. (2001). Raman lidar measurements of the aerosol extinction-to-backscatter ratio over the Southern Great Plains. J. Geophys. Res. 106, 20333–20347. doi:10.1029/2000JD000144
Franke, K., Ansmann, A., Müller, D., Althausen, D., Wagner, F., and Scheele, R. (2001). One-year observations of particle lidar ratio over the tropical Indian Ocean with Raman lidar. Geophys. Res. Lett. 28, 4559–4562. doi:10.1029/2001gl013671
Gobbi, G. P., Kaufman, Y. J., Koren, I., and Eck, T. F. (2007). Classification of aerosol properties derived from AERONET direct sun data. Atmos. Chem. Phys. 7, 453–458. doi:10.5194/acpd-6-8713-2006
Holben, B. N., Eck, T. F., Slutsker, I., Tanré, D., Buis, J. P., Setzer, A., et al. (1998). Aeronet – a federated instrument network and data archive for aerosol characterization. Remote Sens. Environ. 66, 1–16. doi:10.1016/S0034-4257(98)00031-5
Holben, B. N., Tanré, D., Smirnov, A., Eck, T. F., Slutsker, I., Abuhassan, N., et al. (2001). An emerging ground-based aerosol climatology: Aerosol optical depth from AERONET. J. Geophys. Res. 106, 12067–12097. doi:10.1029/2001JD900014
Hsu, N. C., Herman, J. R., Torres, O., Holben, B. N., Tanre, D., Eck, T. F., et al. (1999). Comparisons of the TOMS aerosol index with Sun-photometer aerosol optical thickness: Results and applications. J. Geophys. Res. 104 (D6), 6269–6279. doi:10.1029/1998JD200086
IPCC (2013). Climate change 2013, the scientific basis. New York, NY, USA: Cambridge University Press.
Kaskaoutis, D. G., Kambezidis, H. D., Hatzianastassiou, N., Kosmopoulos, P. G., and Badarinath, K. V. S. (2007). Aerosol climatology: On the discrimination of aerosol types over four AERONET sites. Atmos. Chem. Phys. Discuss. 7, 6357–6411. doi:10.5194/acpd-7-6357-2007
Kaskaoutis, D. G., Kharol, S. K., Sinha, P. R., Singh, R. P., Kambezidis, H. D., Sharma, A. R., et al. (2011). Extremely large anthropogenic-aerosol contribution to total aerosol load over the Bay of Bengal during winter season. Atmos. Chem. Phys. 11, 7097–7117. doi:10.5194/acp-11-7097-2011
Kaskaoutis, D. G., Sinha, P. R., Vinoj, V., Kosmopoulos, P. G., Tripathi, S. N., Misra, A., et al. (2013). Aerosol properties and radiative forcing over Kanpur during severe aerosol loading conditions. Atmos. Environ. X. 79, 7–19. doi:10.1016/j.atmosenv.2013.06.020
Kaufman, Y. J., Tanré, D., and Boucher, O. (2002). A satellite view of aerosols in the climate system. Nature 419, 215–223. doi:10.1038/nature01091
Khatri, P., Takamura, T., Yamazaki, A., and Uchiyama, A. (2014). Use of 315 nm channel data of the sky radiometer to estimate the columnar ozone concentration: A preliminary study. J. Meteorological Soc. Jpn. 92A, 185–194. doi:10.2151/jmsj.2014-A12
Kim, S. W., Yoon, S. C., Kim, J., and Kim, S. Y. (2007). Seasonal and monthly variations of columnar aerosol optical properties over East Asia determined from multi-year modis, lidar, and AERONET sun/sky radiometer measurements. Atmos. Environ. X. 41 (8), 1634–1651. doi:10.1016/j.atmosenv.2006.10.044
Kirchstetter, T. W., Novakov, T., and Hobbs, P. V. (2004). Evidence that the spectral dependence of light absorption by aerosols is affected by organic carbon. J. Geophys. Res. 109 (D21), 4999. doi:10.1029/2004jd004999
Kudo, R., Diémoz, H., Estellés, V., Campanelli, M., Momoi, M., Marenco, F., et al. (2021). Optimal use of the Prede POM sky radiometer for aerosol, water vapor, and ozone retrievals. Atmos. Meas. Tech. 14 (5), 3395–3426. doi:10.5194/amt-14-3395-2021
Kumar, K. R., Yin, Y., Sivakumar, V., Kang, N., Yu, X., Diao, Y., et al. (2015). Aerosol climatology and discrimination of aerosol types retrieved from MODIS, MISR and OMI over Durban (29.88°S, 31.02°E), South Africa. Atmos. Environ. X. 117, 9–18. doi:10.1016/j.atmosenv.2015.06.058
Li, Z., Li, C., Chen, H., Tsay, S. C., Holben, B., Huang, J., et al. (2011). East Asian studies of tropospheric aerosols and their impact on regional climate (EAST-AIRC): An overview. J. Geophys. Res. 116, D00K34. doi:10.1029/2010JD015257
Li, Z. Q., Xu, H., Li, K. T., Li, D., Xie, Y., Li, L. Q., et al. (2018). Comprehensive study of optical, physical, chemical, and radiative properties of total columnar atmospheric aerosols over China: An overview of sun–sky radiometer observation network (SONET) measurements. Bull. Am. Meteorol. Soc. 99, 739–755. doi:10.1175/bams-d-17-0133.1
Liu, J. J., Zheng, Y. F., Li, Z. Q., Flynn, C., and Cribb, M. (2012). Seasonal variations of aerosol optical properties, vertical distribution and associated radiative effects in the Yangtze Delta region of China. J. Geophys. Res. 2012 (D16), 117. doi:10.1029/2011JD016490
Liu, P. F., Zhao, C. S., Göbel, T., Hallbauer, E., Nowak, A., Ran, L., et al. (2011). Hygroscopic properties of aerosol particles at high relative humidity and their diurnal variations in the North China Plain. Atmos. Chem. Phys. 11 (7), 3479–3494. doi:10.5194/acp-11-3479-2011
Ma, Y. Y., Gong, W., Wang, L. C., Zhang, M., Chen, Z. Y., Li, J., et al. (2016). Inversion of the haze aerosol sky columnar AVSD in central China by combining multiple ground observation equipment. Opt. Express 24 (8), 8170–8185. doi:10.1364/OE.24.008170
Mamouri, R. E., Ansmann, A., Nisantzi, A., Kokkalis, P., Schwarz, A., and Hadjimitsis, D. (2013). Low Arabian dust extinction to backscatter ratio. Geophys. Res. Lett. 40, 4762–4766. doi:10.1002/grl.50898
Müller, D., Ansmann, A., Mattis, I., Tesche, M., Wandinger, U., Althausen, D., et al. (2007). Aerosol-type-dependent lidar ratios observed with Raman lidar. J. Geophys. Res. 112 (D16), D16202. doi:10.1029/2006JD008292
Müller, D., Mattis, I., Wehner, B., Althausen, D. U., Wandinger, D., Ansmann, A., et al. (2004). Closure study on optical and microphysical properties of a mixed urban and Arctic haze air mass observed with Raman lidar and Sun photometer. J. Geophys. Res. 109, D13206. doi:10.1029/2003JD004200
Murayama, T., Sugimoto, N., Uno, I., Kinoshita, K., Aoki, K., Hagiwara, N., et al. (2001). Ground-based network observation of Asian dust events of April 1998 in East Asia. J. Geophys. Res. 106, 18345–18359. doi:10.1029/2000JD900554
Nakajima, T., Campanelli, M., Che, H., Estellés, V., Irie, H., Kim, S. W., et al. (2020). An overview of and issues with sky radiometer technology and SKYNET. Atmos. Meas. Tech. 13 (8), 4195–4218. doi:10.5194/amt-13-4195-2020
Nakajima, T., Sekiguchi, M., Takemura, T., Uno, I., Higurashi, A., Kim, D., et al. (2003). Significance of direct and indirect radiative forcings of aerosols in the East China Sea region. J. Geophys. Res. 108 (D23), 8658. doi:10.1029/2002JD003261
Nakajima, T., Tonna, G., Rao, R., Boi, P., Kaufman, Y., and Holben, B. (1996). Use of sky brightness measurements from ground for remote sensing of particulate polydispersions. Appl. Opt. 35, 2672–2686. doi:10.1364/ao.35.002672
Pace, G., Sarra, A. di., Meloni, D., Piacentino, S., and Chamard, P. (2006). Aerosol optical properties at Lampedusa (Central Mediterranean). 1. Influence of transport and identification of different aerosol types. Atmos. Chem. Phys. 6, 697–713. doi:10.5194/acp-6-697-2006
Patel, P. N., Dumka, U. C., Kaskaoutis, D. G., Babu, K. N., and Mathur, A. K. (2017). Optical and radiative properties of aerosols over desalpar, a remote site in Western India: Source identification, modification processes and aerosol type discrimination. Sci. Total Environ. 575, 612–627. doi:10.1016/j.scitotenv.2016.09.023
Patel, P. N., and Kumar, R. (2016). Dust induced changes in ice cloud and cloud radiative forcing over a high altitude site. Aerosol Air Qual. Res. 16 (8), 1820–1831. doi:10.4209/aaqr.2015.05.0325
Patel, P. N., and Kumar, R. (2015). Estimation of aerosol characteristics and radiative forcing during dust events over Dehradun. Aerosol Air Qual. Res. 15, 2082–2093. doi:10.4209/aaqr.2015.02.0077
Ramanathan, V., Agrawal, M., Akimoto, H., Aufhammer, M., Devotta, S., Emberson, L., et al. (2008). Atmospheric Brown clouds and regional climate change, Part I of atmospheric Brown clouds: Regional assessment report with focus on Asia, Project atmospheric Brown cloud. Nairobi, Kenya: United National Environment Programme.
Ramanathan, V., Chung, C., Kim, D., Bettge, T., Buja, L., Kiehl, J. T., et al. (2005). Atmospheric Brown clouds: Impacts on South Asian climate and hydrological cycle. Proc. Natl. Acad. Sci. U. S. A. 102, 5326–5333. doi:10.1073/pnas.0500656102
Sanap, S. D., and Pandithurai, G. (2014). Inter-annual variability of aerosols and its relationship with regional climate over Indian subcontinent. Int. J. Climatol. 35, 1041–1053. doi:10.1002/joc.4037
Schuster, G. L., Vaughan, M., MacDonnell, D., Su, W., Winker, D., Dubovik, O., et al. (2012). Comparison of CALIPSO aerosol optical depth retrievals to AERONET mea-surements, and a climatology for the lidar ratio of dust. Atmos.Chem. Phys. 12, 7431–7452. doi:10.5194/acp-12-7431-2012
Shin, S. K., Tesche, M., Kim, K., Kezoudi, M., Tatarov, B., Müller, D., et al. (2018). On the spectral depolarisation and lidar ratio of mineral dust provided in the AERONET version 3 inversion product. Atmos. Chem. Phys. 18, 12735–12746. doi:10.5194/acp-18-12735-2018
Singh, R. P., Dey, S., Tripathi, S. N., Tare, V., and Holben, B. (2004). Variability of aerosol parameters over Kanpur, northern India. J. Geophys. Res. 109, 1–14. doi:10.1029/2004JD004966
Sinha, P. R., Kaskaoutis, D. G., Manchanda, R. K., and Sreenivasan, S. (2012). Characteristics of aerosols over hyderabad in southern peninsular India: Synergy in the classification techniques. Ann. Geophys. 30, 1393–1410. doi:10.5194/angeo-30-1393-2012
Sokolik, I. N., and Toon, O. B. (1999). Incorporation of mineralogical composition into models of the radiative properties of mineral aerosol from UV to IR wavelengths. J. Geophys. Res. 104 (D8), 9423–9444. doi:10.1029/1998JD200048
Song, Y., Tang, X. Y., Zhang, Y. H., Hu, M., Fang, C., Zhen, L. M., et al. (2002). Effects on fine particles by the continued high temperature weather in beijing. Environ. Sci. 23 (4), 33–36. doi:10.3321/j.issn:0250-3301.2002.04.007
Su, X. L., Cao, J. J., Li, Z. Q., Li, K. T., Xu, H., Liu, S. X., et al. (2018). Multi-year analyses of columnar aerosol optical and microphysical properties in xi’an, a megacity in northwestern China. Remote Sens. (Basel). 10, 1169. doi:10.3390/rs10081169
Takamura, T., and Nakajima, T. (2004). Overview of SKYNET and its activities. Opt. Puray. Apl. 37, 3303–3308.
Tesche, M., Ansmann, A., Müller, D., Althausen, D., Mattis, I., Heese, B., et al. (2009). Vertical profiling of Saharan dust with Raman lidars and airborne HSRL in southern Morocco during SAMUM. Tellus B Chem. Phys. Meteorology 61, 144–164. doi:10.1111/j.1600-0889.2008.00390.x
Torres, O., Bhartia, P. K., Herman, J. R., Sinyuk, A., Ginoux, P., and Holben, B. N. (2002). A long-term record of aerosol optical depth from toms observations and comparison to AERONET measurements. J. Atmos. Sci. 59 (3), 398–413. doi:10.1175/1520-0469(2002)059<0398:altroa>2.0.co;2
Tripathi, S. N., Dey, S., Chandel, A., Srivastava, S., Singh, R. P., and Holben, B. N. (2005). Comparison of modis and aeronet derived aerosol optical depth over the ganga basin, India. Ann. Geophys. 23 (4), 1093–1101. doi:10.5194/angeo-23-1093-2005
Twomey, S. A., Piepgrass, M., and Wolfe, T. L. (1984). An assessment of the impact of pollution on global cloud albedo. Tellus, B. 36B, 356–366. doi:10.1111/j.1600-0889.1984.tb00254.x
Wang, P., Che, H. Z., Zhang, X. C., Song, Q. L., Wang, Y. C., Zhang, Z. H., et al. (2010). Aerosol optical properties of regional background atmosphere in Northeast China. Atmos. Environ. X. 44, 4404–4412. doi:10.1016/j.atmosenv.2010.07.043
Wang, Z. Z., Liu, D., Wang, Z. E., Wang, Y. J., Khatri, P., Zhou, J., et al. (2014). Seasonal characteristics of aerosol optical properties at the SKYNET Hefei site (31.90° N, 117.17° E) from 2007 to 2013: First long-term AOP over Hefei. J. Geophys. Res. Atmos. 119, 6128–6139. doi:10.1002/2014jd021500
Xia, X. A., Zong, X., and Sun, L. (2013). Exceptionally active agricultural fire season in mideastern China in June 2012 and its impact on the atmospheric environment. J. Geophys. Res. Atmos. 118, 9889–9900. doi:10.1002/jgrd.50770
Xia, X. G., Chen, H. B., and Wang, P. C. (2004). Aerosol properties in a Chinese semiarid region. Atmos. Environ. X. 38, 4571–4581. doi:10.1016/j.atmosenv.2004.04.015
Xin, J. Y., Gong, C. S., Wang, S. G., and Wang, Y. S. (2016). Aerosol direct radiative forcing in desert and semi-desert regions of northwestern China. Atmos. Res. 171, 56–65. doi:10.1016/j.atmosres.2015.12.004
Xin, J. Y., Wang, Y. S., Li, Z. Q., Wang, P. C., Hao, W. M., Nordgren, B., et al. (2007). Aerosol optical depth (AOD) and angstrom exponent of aerosols observed by the Chinese Sun Hazemeter Network from August 2004 to September 2005. J. Geophys. Res. 112, D05203. doi:10.1029/2006JD007075
Yu, X. N., Lü, R., Liu, C., Yuan, L., Shao, Y. X., Zhu, B., et al. (2017). Seasonal variation of columnar aerosol optical properties and radiative forcing over Beijing, China. Atmos. Environ. X. 166, 340–350. doi:10.1016/j.atmosenv.2017.07.011
Yu, X. N., Shi, C. Z., Ma, J., Zhu, B., Li, M., Wang, J., et al. (2013). Aerosol optical properties during firework, biomass burning and dust episodes in Beijing. Atmos. Environ. X. 81, 475–484. doi:10.1016/j.atmosenv.2013.08.067
Zege, E. P., Ivanov, A. P., and Katsev, I. L. (1991). Image transfer through a scattering medium. New York: Springer-Verlag.
Keywords: aerosol optical properties, Raman lidar, lidar ratio, sky-radiometer, xi’an
Citation: Liu J, Guo Z, Zhou L, Wang L, Wang J, Yan Q and Hua D (2022) Inversion and analysis of aerosol optical properties and lidar ratios based on sky-radiometer and Raman lidar measurements in Xi’an, China. Front. Environ. Sci. 10:1039559. doi: 10.3389/fenvs.2022.1039559
Received: 08 September 2022; Accepted: 10 October 2022;
Published: 26 October 2022.
Edited by:
Hainan Gong, Institute of Atmospheric Physics, (CAS), ChinaReviewed by:
Ming Zhang, China University of Geosciences Wuhan, ChinaXiaoyan Wang, Fudan University, China
Jianrong Bi, Lanzhou University, China
Copyright © 2022 Liu, Guo, Zhou, Wang, Wang, Yan and Hua. This is an open-access article distributed under the terms of the Creative Commons Attribution License (CC BY). The use, distribution or reproduction in other forums is permitted, provided the original author(s) and the copyright owner(s) are credited and that the original publication in this journal is cited, in accordance with accepted academic practice. No use, distribution or reproduction is permitted which does not comply with these terms.
*Correspondence: Dengxin Hua, ZGVuZ3hpbmh1YUB4YXV0LmVkdS5jbg==