 Zhijun Feng
 Shiwen Zhang
 Bin Yang1
95% of researchers rate our articles as excellent or good
Learn more about the work of our research integrity team to safeguard the quality of each article we publish.
Find out more
ORIGINAL RESEARCH article
Front. Environ. Sci. , 05 October 2022
Sec. Toxicology, Pollution and the Environment
Volume 10 - 2022 | https://doi.org/10.3389/fenvs.2022.1039470
This article is part of the Research Topic Soil and Sediment Pollution, Processes and Remediation, Volume II View all 17 articles
It is important to clarify the iron-copper interaction pattern to effectively extract the characteristic bands and improve the inversion accuracy of copper content in soil. In this study, based on experimental samples, spectral feature analysis and analysis of variance (ANOVA) were used to deeply uncover the iron-copper interaction pattern. And used natural samples to build a random forest model to analyze the effect of interaction patterns on inversion accuracy. The results of the study showed that the effect of iron content in soil on spectral reflectance varied with copper content in soil, and similarly, the effect of copper content in soil on spectral reflectance varied with iron content in soil. The effect of iron, copper and their interaction on the spectral reflectance of soil varied with the wavelength. In the wavelength from 400 to 2,500 nm, the effect of iron on the spectral features was more than copper, and in the characteristic wavelength of iron (600–700 nm), even more than 5 times that of copper, the effect of iron on the spectral reflectance played a major role, and the iron content in soil must be considered in the inversion of copper content in soil. The Pearson correlation coefficient method was used as the selected characteristic wavelength, the selected wavelength was used as the independent variable, and the copper content in the soil was the dependent variable. Inversion model was built by the random forest algorithm, and the determination coefficient was 0.73. Under the condition of considering the interaction, the coefficient of determination was 0.87. It was shown that the characteristic wavelength was selected by considering the iron-copper interaction, which can better characterize the response signal of copper in soil. This paper provided a new idea for the accurate inversion of copper content in soil, which can provide technical support for the rapid detection of copper content in soil.
Soil is an important resource for human survival and agricultural production (Maitra et al., 2021) Along with the rapid development of industrialization, heavy metal elements continue to accumulate in the soil through sewage discharge, atmospheric fallout and other means, resulting in soil heavy metal pollution (Yang et al., 2021; Zhang et al., 2021), which even have a serious impact on the growth of crops and easily enter the human body through the food chain, posing a great threat to human health (Qin et al., 2021). Therefore, extensive testing of heavy metal content in soil is of great significance to safeguard agricultural production, protect human health and ecosystem security (Lin et al., 2022).
In recent years, hyperspectral remote sensing technology with its advantages of dynamics and high efficiency has been widely used in many fields such as agriculture, geology and food detection (Lu et al., 2020; Ren et al., 2022), and there have been many studies in heavy metal contamination of soils. Li et al. (2021) used single spectral transformation index and multi-spectral transformation index to invert the arsenic (As) content in soil by different spectral transformation methods and achieved good inversion results; Guo et al. (2021) used principal components analysis (PCA) to reduce the dimensionality of hyperspectral data, and Partial Least Square Regression, Support Vector Machines, Artificial Neural Network and Random Forest (RF) models were used to estimate the Cadmium content in soil, and it was found that PCA-RF outperformed other counterparts. Although the above-mentioned studies have successfully used hyperspectral to heavy metal content in soil estimate, most of the improvement of estimate accuracy was through spectral transformation and model improvement, the spectral features of some heavy elements were easily masked by organic matter, carbonate, hygroscopic moisture, iron and manganese oxides, etc. Higher accuracy is often not achieved by direct estimation (He et al., 2019). Some scholars had also conducted corresponding studies for this kind of problems. Zhang et al. (2020a) proposed a method for estimate based on the characteristic spectra of iron oxide, this method reduced data redundancy and improved the estimation accuracy of lead (Pb) content in soil. Jiang et al. (2018) explored the response regulation of soil cadmium (Cd) and spectral characteristics through the preparation of class standardized samples, found that estimation accuracy can be significantly improved based on class standardized samples, which can provide a priori knowledge for estimation of heavy metal in soil content in a model of multi-element confounding pollution; Zhang et al. (2020b) introduced water-salt interactions into the water-salt theory model, the accuracy of spectral reflectance estimation is significantly improved.
In summary, scholars have studied the influence of a single heavy metal on spectral characteristics, however, there were few reports on the interaction of different heavy metals on soil spectral characteristics and their effect on estimation accuracy, there was a symbiotic and aggregation relationship between iron and copper elements in the soil (Chen et al., 2022), and the correlations between soil Fe and soil Cu components were significant (Gong et al., 2010), the 3d orbitals of soil Fe was half-filled, it had a higher energy level response, and the 3d orbitals of both soil Fe and soil Cu are unfilled and have a similar energy level response to spectral reflectance (Cheng et al., 2018), therefore, which can hide the spectral information of copper, leading to low accuracy in direct estimate of copper content in soil (Lin et al., 2021), Therefore, it was significant to clarify the interaction of iron and copper and their on the spectral reflectance of soil for the extraction of effective spectral features of copper in soil. In this paper, spectral feature analysis and analysis of variance (ANOVA) were used to deeply reveal the interaction of iron and copper based on experimental samples, and used natural samples to analyze the effect of interaction to estimate of copper content in soil, which can provide technical support for the direct estimation of copper content in soil.
Soil collection included laboratory preparation of standardized samples and natural soil sampling of the mine site. Soil within the surface layer (0–15 cm) was collected at the same location in the mine area for about 15 kg, mixed and brought back in a special sealed bag for laboratory preparation of standardized samples. Natural soil samples were collected by the five-point sampling method, the collected soil samples were brought back in special sealed bags. First, the soil sample was dried naturally, then the impurities were removed, and finally the soil sample was ground and sieved through 100 mesh sieve. Each of the treated natural soil samples from the mine site was divided into 2 parts, of which one of them was used to monitor heavy metal content, soil iron content was determined by the atomic absorption spectrophotometer (JC-17002) and soil copper content was determined by flame atomic absorption spectrophotometry, another one was used for laboratory testing of its soil composition content and one was used for soil spectral reflectance collection.
The soil samples collected for the preparation of standardized samples were passed through a 10 mesh sieve, removing grass roots, stones and other debris, pass through 100 mesh nylon sieve after natural dried and ground, the treated soil was mixed well to ensure consistent background values of the soil samples. Added a small amount of distilled water to moisten the soil sample, soil organic matter was removed by adding 30% H2O2 solution to eliminate the effect of soil organic matter on the spectral reflectance of the soil, the soil organic matter was continuously monitored during the removal process to ensure full removal. The removed soil sample was dried and placed in a container, and added sodium citrate and sodium bicarbonate solution, heated up to 80°C in a water bath, then added sodium disulfite to remove iron in soil, and this operation was repeated continuously, and iron content in soil was monitored continuously during the repetition until all iron content in soil was removed.
The iron content in soil gradient was set to 0, 2, 3.5, 5, 6.5, and 10% according to the types of soil in China and the Chinese soil database provided by the Institute of Soil Research, Chinese Academy of Sciences, and the iron content in natural soil samples. Reference to the actual situation in the study area and the soil environmental quality soil pollution risk control standards for agricultural land issued by the Ministry of Ecology and Environment, the copper content in soil gradient was set as 50 mg/kg, 70 mg/kg, 80 mg/kg, 90 mg/kg, 100 mg/kg, and 120 mg/kg; to facilitate the calculation of two-factor ANOVA, the iron content in soil was divided into three groups of 0%–3%, 3%–6% and 6%–10%, and the copper content in soil was divided into three groups of 50–80 mg/kg, 80–100 mg/kg and 100–120 mg/kg, and a total of 9 was set of experimental data with the same number of samples in each group, and the spectral reflectance of all experimental samples was obtained.
Indoor soil spectral data were acquired using a FieldSpec 4 spectrometer from ASD, United States, which was equipped with color RS3 software. The instrument has a wavelength range of 350–2,500 nm, covering the full range from visible to near infrared. Considered the susceptibility to external light in the acquisition of spectra, indoor spectra were acquired in a dark room without light, used a 12 V, 50 W tungsten bulb to provide a stable light source and a 25° bare fiber optic lens for spectral data acquisition. For indoor soil spectral data acquisition, the spectrometer needed to be preheated for half an hour. For soil spectral data acquisition, the soil sample needed to be laid flat in a Petri dish with a black flannel under the Petri dish. The distance of the light source from the Petri dish was 60 cm, and the angle with the horizontal direction was 45°. The fiber optic lens was positioned 7 cm directly above the Petri dish. To reduce the interference of external factors, a whiteboard correction was conducted after acquiring the spectra of 5 soil samples. Twenty spectral curves were obtained for each soil sample, and the average value was taken as the spectral data of the soil sample after excluding the abnormal (noisy) curves.
Spectral data acquisition process will be affected by many factors, in addition to external environmental factors (such as atmospheric humidity, temperature and components, etc.) and the soil sample itself (such as soil color, mechanical composition, microaggregates, soil formation conditions, surface roughness, humidity, etc.), also influenced by the difference in response of the spectrometer itself to different wavelengths, these make the correlation between the original spectral reflectance and the measured object is low and does not meet the demand of spectral prediction. Therefore, the first order differential (FDR) pre-processing transform is performed on the soil spectral data (Luo, et al., 2022) Eq. 1.
In the formula,
Pearson’s correlation coefficient (PCC) can better find the sensitivity of soil heavy metals to spectral reflectance (Shu, et al., 2021) The characteristic spectral bands were extracted by correlation analysis for estimating content of heavy metal in soil. The spectral reflectance was subjected to Pearson correlation analysis with the heavy metal content, and the characteristic bands were selected according to their significance levels.
According to the statistical definition of the interaction, the Iron-Copper interaction can be explained by the fact that the spectral reflectance of soil changes depending on the copper content in soil when the iron content in soil is the same, and similarly, the spectral reflectance of soil changes depending on the iron content in soil when the copper content in soil is the same.
ANOVA is a statistical method to analyze the effect of explanatory variables on the explained variables (Hong and Hyundoo, 2021). ANOVA can be divided into one-factor ANOVA and two (multi) factor ANOVA according to the categories, and the two-factor ANOVA that only considers the main effect without considering the interaction effect is the non-repetitive two-factor ANOVA, the repeated two-factor ANOVA that considers both main effects and interaction effects is a repeated two-factor ANOVA; and the interaction effect that considers both the effect of the explanatory variables on the explanatory variables alone and the effect of the combination of the explanatory variables on the explanatory variables, which is the Iron-Copper interaction in this paper. The F-test in ANOVA is a numerical representation which is used to test the significance of the degree of influence of the explanatory variables on the explained variables, and its significance is concretely expressed by the F-value, a larger F-value indicates a more significant effect of the explanatory variable on the explained variable. Therefore, the repeated two-factor ANOVA was used quantitatively analysis the effects of iron, copper and their interactions on soil spectral reflectance, that was, the effect of iron, copper and interaction on the spectral reflectance was expressed numerically using the F-value.
Random forest (RF) is a classifier that uses multiple trees to train and predict samples, and is one of the most widely used algorithms in Bagging integrated learning (Agrawal and Petersen, 2021). Random forest constructs a large number of decision trees and then averages them. The calibration of the decision tree starts with a single node containing all the training samples, then the heterogeneity measure in the resultant node is minimized using predictive features and a threshold that splits the node into two nodes until all the end nodes are isomorphic. Since the partitioning of each node variable in the decision tree is chosen randomly, there is almost no correlation between each decision tree, which can better avoid overfitting (Tan et al., 2019). The implementation process of the RF algorithm was done in Matlab R2018b, and the accuracy of the algorithm was evaluated using the coefficient of determination (R2) and root mean square error (RMSE), the closer R2 is to 1, the more stable the algorithm is, the smaller RMSE is, and the higher the algorithm accuracy is.
Based on the data of iron content and copper content in soil the experimental samples, the samples with the same iron content but different copper content in soil were screened and the corresponding spectral reflectance graphs were plotted (Figure 1), so as to analyze the relationship between different copper content and spectral reflectance at the same iron content.
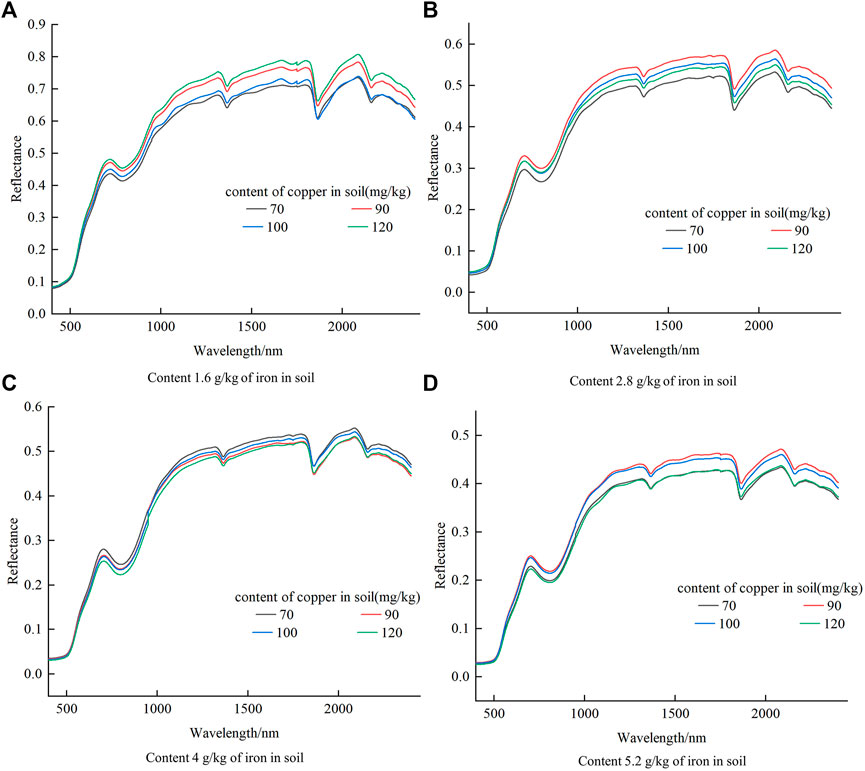
FIGURE 1. Variation curves of soil spectral characteristics with copper content for four identical iron content cases.
In general, the spectral reflectance and iron content in soil were negatively correlated, that was, as the iron content in soil increases, the spectral reflectance decreases (Peng et al., 2013). As shown in Figure 1, the maximum reflectance gradually decreased with increasing of iron content in soil, which was consistent with the negative correlation between spectral reflectance and soil content in soil, which indicated that change of copper content in soil had a smaller effect on the spectral characteristics than change of iron content in soil. The pattern of the effect of the change of iron content in soil on the spectral reflectance was different for different iron contents in soil. When the content was 1.6 g/kg of iron in soil, the spectral reflectance was the smallest when the copper content was the smallest; the spectral reflectance rate was the largest when the copper content was the largest. When the content was 4 g/kg of iron in soil, the spectral reflectance was the smallest when the copper content was the largest and the spectral reflectance was the smallest when the copper content was the largest. The above analysis showed that the relationship between spectral reflectance and copper content in soil varies depending on the iron content.
To analyze the relationship between different iron contents and spectral reflectance at the same copper content, the spectral reflectance curves with different iron contents at the same copper content were plotted (Figure 2).
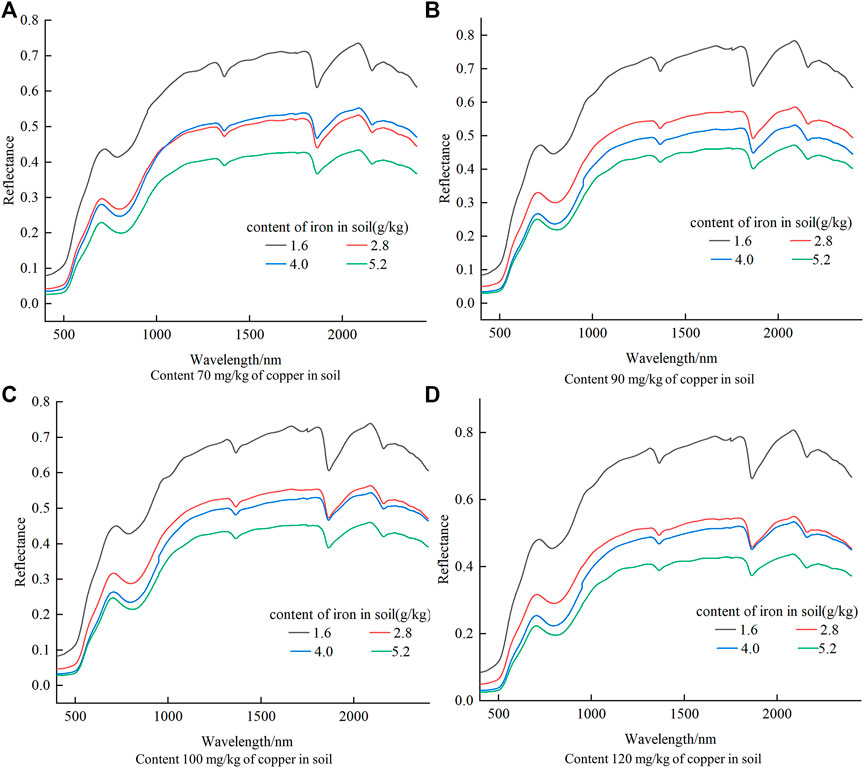
FIGURE 2. Variation curves of soil spectral characteristics with iron content for four identical copper content cases.
As can be seen from Figure 2, the spectral reflectance was all maximum when the iron content was the smallest and minimum when the iron content was the largest, which satisfied the negative correlation between the spectral reflectance and iron content in soil, and the spectral reflectance basically decreased strictly with the increase of iron content in the case of different copper content in soil, which indicated that the change of copper content in soil had less effect on the spectral reflectance, which was consistent with the study that the absorption coefficient of hydrated iron ions in water on spectral reflectance was stronger than that of hydrated copper ions in water on spectral reflectance (Deng et al., 2016; Liang et al., 2016), and the conclusion of these two literatures also proves that the greater effect of iron in soil on spectral characteristics than copper is not due to the influence of content (magnitude). The pattern of the effect of changing iron content in soil on the spectral reflectance was different when the copper content was different, and the maximum spectral reflectance was different when the copper content was different, with the maximum spectral reflectance at content 120 mg/kg of copper in soil and the minimum spectral reflectance at content 100 mg/kg of copper in soil. The above analysis showed that the relationship between spectral reflectance and iron content in soil varies depending on the copper content.
It is also shown in Figure 2 that the spectral reflectance decreased with increasing iron content in 400–1,000 nm when the copper content in soil was 70 mg/kg, while the spectral reflectance was lower in 1,000–2,450 nm at content 2.8 g/kg of iron in soil than at content 4 g/kg of iron in soil, when the copper content in soil was 90 mg/kg, 100 mg/kg and 120 mg/kg, respectively. The spectral reflectance decreased strictly with the increase of iron content, which indicated that the variability of the relationship between spectral reflectance and iron content in soil at different wavelengths also differs depending on the copper content. Therefore, the inversion accuracy of iron content in soil using the characteristic band of iron may be affected under the condition that copper in soil was not considered.
One-dimensional spectra can only analyze the general pattern of soil spectral reflectance changing with soil iron content and copper content in soil, and cannot accurately analyze the changes of fine features in the spectra, while two-dimensional correlation spectra can extend the soil spectral signal to the second dimension, and improve the spectral resolution by analyzing the differences in vibrational behaviors of molecules of different component groups, separating overlapping peaks, and probing the interactions between different functional groups (Yang et al., 2019), making weak peaks and overlapping peaks in the one-dimensional spectra are more obvious. The two-dimensional correlation spectroscopy technique was used to resolve the changes in the fine features of the spectra using the iron content and copper content in soil as external perturbation conditions, respectively, and finding the characteristic information of the correlation spectra under micro perturbation. The results are shown in Figure 3.
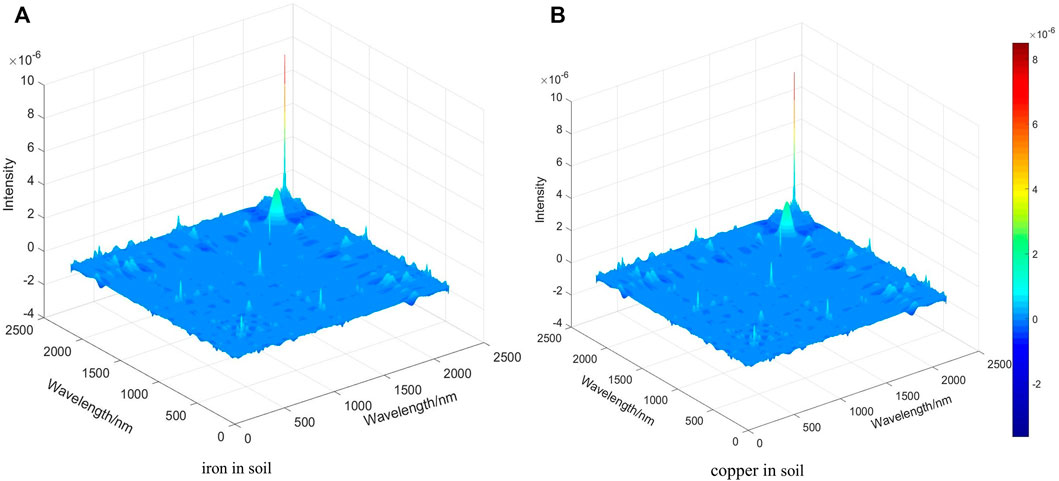
FIGURE 3. 3D correlation synchronous and asynchronous spectrograms.
The two-dimensional correlation spectroscopy theory shown that its two-dimensional correlation spectrogram is symmetric about the diagonal, where the peaks located on the main diagonal are called autocorrelation peaks, which are the autocorrelation of group vibrations in response to external perturbations and represent the autocorrelation intensity of reflectance intensity changes in a specific band (Hou and Wu, 2022). These peaks, which are generated due to spectral autocorrelation and are usually positive, represent the sensitivity to external perturbation factors (iron content and copper content in soil), with a redder color indicating a higher sensitivity and a bluer color indicating a lower sensitivity. Cross peaks, which can be positive or negative, are also present in the two-dimensional correlation spectrogram, usually symmetric about the main diagonal, representing possible inter- or intra-molecular interactions between the two functional groups, and these interactions are usually closely related to the variation of the external disturbance factors (iron content and copper content in soil) (Liu et al., 2020).
From Figure 3, four more obvious autocorrelation peaks and one cross peak appeared in both figures in the two-dimensional correlation spectra, and the locations of the autocorrelation peaks and cross peaks were basically the same. The autocorrelation peaks correspond to the gene vibration peaks at 600–700 nm, 1,300–1,400 nm, 1,650–1850 nm, and 2,100–2,200 nm, which were consistent with the absorption peaks of the original spectra. From the intensity of the autocorrelation peaks, the highest intensity of the autocorrelation peaks in both plots was found near 2,200 nm, indicating that there was a strong autocorrelation near 2,200 nm, and it was most sensitive to the microturbulence of iron content and copper content in soil. The microturbulence of both iron content and copper content had a consistent effect on the intensity of changes in the soil spectral signal when the iron content and copper content were changed.
The F-test in ANOVA is a numerical representation which is used to test the significance of the degree of influence of the explanatory variables on the explained variables, so the F-action can quantitatively calculate the effect of iron content and copper content in soil on the spectral reflectance. The F values are shown in Figure 4.
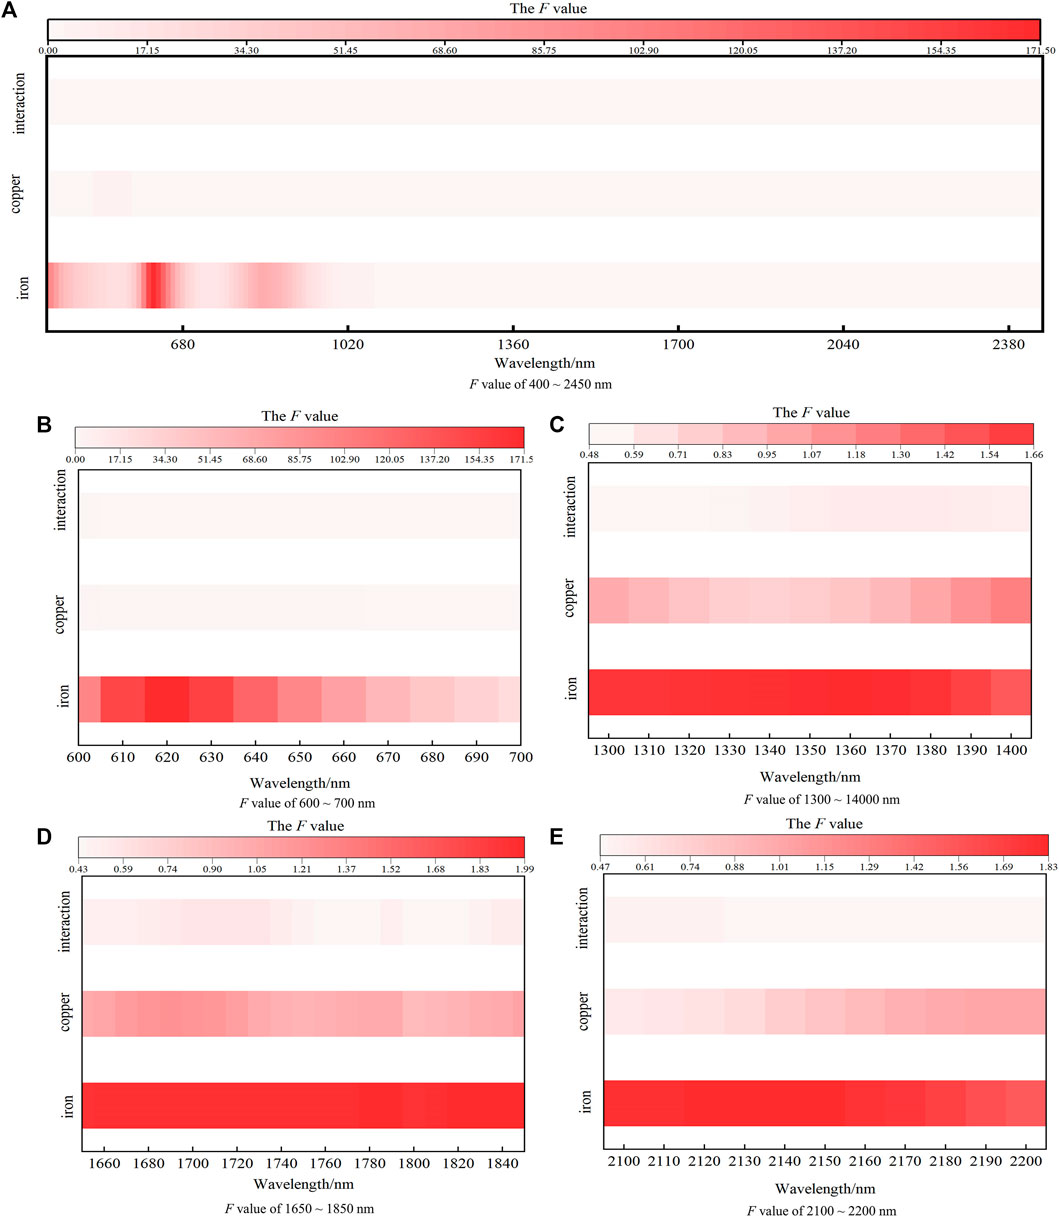
FIGURE 4. F-values in the full band and in the peak band of gene vibrations corresponding to the automatic peak.
Figure 4 represented the contribution of iron, copper and their interaction on the soil spectral reflectance by F-value. The maximum value of the effect of iron on the soil spectral reflectance in the band 600–700 nm was 171.44 and the minimum value was 23.20, indicating that the effect of iron on the soil spectral characteristics in the band 600–700 nm was the largest and the minimum effect was more than 20 times the value of the effect of copper and interaction, and the value of the effect of copper on the soil spectral reflectance was similar to that of the interaction, but greater than that of the interaction. Therefore, in the 600–700 nm band, iron played a major role in the spectral characteristics of soil, which was consistent with the fact that the 600–700 nm band was the characteristic band of iron. Therefore, when estimated the iron content in soil with this characteristic band, it was not necessary to consider the effect of copper content in soil and its interaction, and when estimated the copper content in soil, the effect of iron content in soil on spectral characteristics of copper must be considered. In the bands 1,300–1,400 nm, 1,650–1850 nm and 2,100–2,200 nm, the values of iron and copper on spectral reflectance of soil were similar, and the effect of iron on soil spectral reflectance had less influence on the estimation of copper content in soil; in the bands 1,340–1,370 nm and 2,100–2,130 nm, the values of the effect of copper on spectral reflectance of soil. Therefore, the effect of interaction on the estimation of copper content in soil should be considered when estimation of copper content in soil was performed.
The overall analysis shown that in the 600–700 nm band, the effect of iron on spectral reflectance of soil was the largest, which was more than 20 times the effect of copper on spectral characteristics of soil, indicating that this band is the characteristic band of iron, which was consistent with the study of Wang et al. (2021), therefore, the band in this range should be excluded in the estimation of copper content in soil; The effect of soil iron on the estimation of copper content in soil can be disregarded in the bands with small values of soil iron, but the effect of interaction on the inversion of copper content in soil should be considered when the effect of interaction on the spectral reflectance and the effect of soil copper are similar, so the bands in which the effect of interaction on the spectral reflectance was greater than the effect of copper should be excluded. In summary, when estimation of copper content in soil, characteristic bands of copper should be selected according to the principle that copper had a greater effect on the spectral reflectance and iron and interaction had a relatively smaller effect on the spectral reflectance, so as to extract a more effective characteristic band for copper content in soil estimation.
The selection of the characteristic bands is the key to the accuracy of the estimation of the prediction model (Chen et al., 2022), and in this paper, Pearson’s correlation coefficient (PCC) was first used to select the spectral characteristic bands (p < 0.01), and the bands with highly significant correlation between copper content in soil and spectral reflectance of soil were selected for the estimation of copper content in soil, The results are shown in Figure 5.
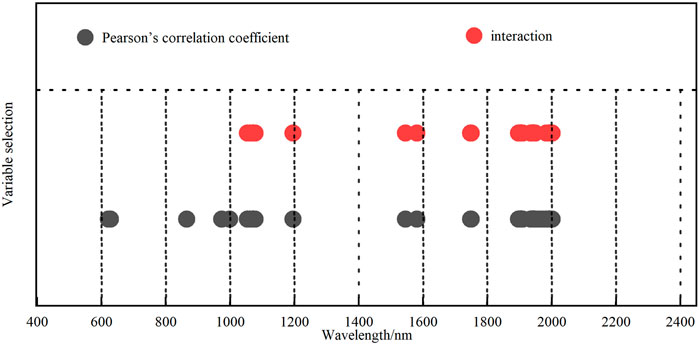
FIGURE 5. Characteristic variable of selection.
As can be seen from Figure 5, the characteristic bands of copper content in soil screened by using PCC algorithm were distributed in the vicinity of 600 nm, 800–1,200 nm, 1,600 nm, 1800 nm and 1900–2000 nm, and the characteristic bands were widely distributed, among which the vicinity of 600 nm and 800 nm were the characteristic bands of soil iron. From the quantitative calculation results in Figure 4, it can be obtained that the Within the characteristic band, the influence of soil iron on the spectral characteristics was more than 5 times than the influence of soil copper on the spectral characteristics, which had a greater impact on the direct estimation of copper content in soil and should be excluded, while within 1900–2000 nm, in the bands 1950 nm, 1956 nm, 1963 nm, 1974 nm, and 1982 nm, the influence of iron-copper interaction on the spectral reflectance was greater than that of copper on the spectral reflectance, so them should be excluded.
In this paper, the PCC algorithm and the feature bands selected by the interaction were used as input variables to estimate the copper content in soil with the RF model, and by comparing the effects of the feature bands selected by PCC and the interaction on the accuracy of the model, and then verified the necessity of considering the interaction on the accuracy improvement of copper content in soil. The results are shown in Figure 6.
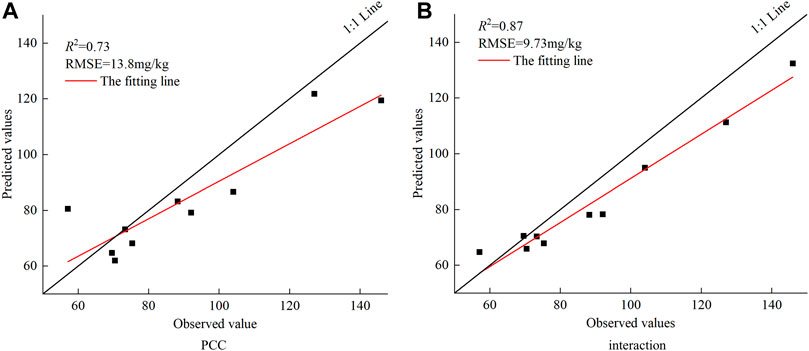
FIGURE 6. Scatter plots between observed values and predicted values of the content of copper in soil.
Figure 6 showed that the R2 of the model was 0.73 and the RMSE was 13.8 mg/kg when using only the feature bands selected by the PCC algorithm for soil Cu content estimation, and the R2 of the model was 0.87 and the RMSE was 9.73 mg/kg when considering the interaction. The accuracy of the validation set was significantly improved, and the coefficient of determination R2 increased by 19% and the RMSE decreased by 32%, indicating that considering the interaction can effectively improve the accuracy of the inversion of copper content in soil when estimation of copper content in soil.
Soil spectral characteristics are a comprehensive reflection of soil physicochemical properties, and different soil components have different responses to different bands, which is the basis for achieving quantitative estimation of soil physicochemical properties. However, the characteristic bands are not in one-to-one correspondence with soil constituents, and some bands may be characteristic bands of multiple elements, and substances with high response to spectral characteristics can mask the spectral characteristics of substances with low response, resulting in the characteristic bands of low-response substances not being easily extracted. Iron and copper in soil are companions, and they have similar effects on the spectral characteristics through the response of 3d unfilled orbital energy levels (Cheng et al., 2018). The iron content in soil is determined to affect the inversion of copper content in soil based on spectral characteristic analysis and ANOVA, which was similar to the results of Shen et al. (2019). From the definition of interaction in statistics, the interaction can be explained by the fact that the soil spectrum is altered by the difference in copper content when the iron content in the soil is constant, and similarly, the soil spectrum is altered by the difference in iron content when the copper content is the same, which indicated that the interaction is real. The extent of iron on the spectrum in some bands is more than 7 times greater than that of copper, for example, in the 620 nm band, the extent of iron on the spectrum is more than 100 times greater than that of copper, so the presence of these bands will affect the estimation accuracy of copper when estimation of copper content in soil; in the band 1930–2000 nm, the effect of interaction on the spectrum is greater than that of copper on the spectrum.
Accurate estimation of soil composition is essential for soil testing, and hyperspectral can achieve rapid detection of soil composition, but there are many hyperspectral bands, and selection of effective spectral bands is the key to ensure the estimation accuracy. Usually, the selection of characteristic bands is performed by correlation analysis, but there are many material components in soil, and only by correlation analysis, it can cause duplication of information among hyperspectral bands, and for some substances that have a greater influence on spectral reflectance, such as water and organic matter (Ge, 2021; Sun et al., 2022), the inversion accuracy is higher because they are less influenced by other substances when estimation with characteristic bands, but for spectral substances with relatively small influence on the reflectance, such as copper, etc., some of the characteristic bands selected by using only Pearson correlation coefficients will overlap with those of substances such as iron, and the influence of iron on the spectral reflectance is greater than that of copper, resulting in lower accuracy in the direct estimation of copper content. In this study, the original feature band selection method and interaction were combined to select the feature band with the greatest influence of copper and the least influence of iron for the estimation, and the accuracy of the estimation of copper content was better improved.
This study focuses on the effect of iron content in soil on the estimation of copper content in soil. Although it has been established that iron content is a major factor affecting copper content estimation, more research is needed to determine the relationship between copper content and spectral reflectance, and how it is affected by other intrinsic soil properties such as soil type, soil color, and soil organic matter, for further potential applications under field conditions. Nevertheless, it is feasible to achieve high accuracy estimation of copper content as long as the bands that are sensitive to copper content but less influential to the collection of other factors can be identified. With this, subsequent studies on the influence of other influencing factors on copper content in soil provide technical and theoretical support for the direct estimation of copper content.
In this paper, based on the interaction law derived from experimental samples, the random forest algorithm was used to verify with natural samples, and the following conclusions were drawn.
(1) The one-dimensional spectral feature analysis concludes that the spectral reflectance and iron content in soil satisfy a negative correlation, and the effect law of iron content in soil change on soil spectral reflectance was different when copper content in soil was different; similarly, the relationship between copper content in soil and spectral reflectance of soil can be different with iron content in soil, the effect of iron content in soil on soil spectral reflectance played a major role; the effect law of iron and copper content in soil on soil spectral reflectance can change with the ratio of iron and copper; The two-dimensional correlation analysis yielded that the effects of iron and copper on the soil spectral characteristics were similar, and both formed four autocorrelation peaks and one cross peak, and the positions of the four autocorrelation peaks and one cross peak were similar; therefore, the mutual effect between iron and copper needed to be considered when estimation of copper content in soil.
(2) Quantitative analysis of the four autocorrelation peaks by ANOVA can be concluded that the action value of iron content in soil on spectral reflectance of soil within the four autocorrelation peaks was the largest, and the F action value of iron content in soil on spectral reflectance of soil in the 600–700 nm band was even 5 times higher than those of copper content in soil, and the values of copper content in soil and interaction on soil spectral reflectance were similar.
(3) The R2 of PCC-RF model was 0.73, and the R2 of the model built under the condition of considering iron and the Iron-Copper interaction was 0.87. The results shown that the accuracy of the model for the spectral estimation of copper content in soil can be effectively improved when considering the interaction, and the R2 of its model reaches the standard of a good model, which can be used for the quantitative estimation of copper content in soil.
The original contributions presented in the study are included in the article/Supplementary Material, further inquiries can be directed to the corresponding author.
ZF: Designed the study and writing original draft. SZ: Supervision, discussion, writing-reviewing and editing. BY, TZ, and TR: Grammar modification and polishing.
This research was supported by the Natural Resources Science and Technology Project of Anhui Province (2020-K-8).
The authors declare that the research was conducted in the absence of any commercial or financial relationships that could be construed as a potential conflict of interest.
All claims expressed in this article are solely those of the authors and do not necessarily represent those of their affiliated organizations, or those of the publisher, the editors and the reviewers. Any product that may be evaluated in this article, or claim that may be made by its manufacturer, is not guaranteed or endorsed by the publisher.
Agrawal, A., and Petersen, M. R. (2021). Detecting arsenic contamination using satellite imagery and machine learning. Toxics 9 (12), 333. doi:10.3390/toxics9120333
Chen, D. S., Zhang, F., Tan, M. L., Chan, N. W., Shi, J. C., Liu, C. J., et al. (2022). Improved Na+ estimation from hyperspectral data of saline vegetation by machine learning. Comput. Electron. Agric. 196, 106862. doi:10.1016/j.compag.2022.106862
Chen, F. J. (2020). Studies on Cu and Zn Content of Agricultural land Soil based on the hyper-spectrum estimation model. Chengdou: Chengdu University of Technology.
Cheng, h., Wan, Y., Chen, Y. Y., Wan, Q. J., Shi, T. Z., Shen, R. L., et al. (2018). Study on the characteristics and mechanism of visible and near infrared reflectance spectra of soil heavy metals. Spectrosc. Spectr. Analysis 38 (3), 771–778. doi:10.3964/j.issn.1000-0593(2018)03-0771-08
Deng, R. R., Liang, Y. H., Gao, Y. K., Qin, Y., and Liu, X. L. (2016). Measuring absorption coefficient spectrum (400—900 nm) of hydrated and complex ferric ion in water. Natl. Remote Sens. Bull. 20 (01), 35–44. doi:10.11834/jrs.20164278
Ge, X. Y., Ding, J., Jin, X., Wang, J., Chen, X., Li, X., et al. (2021). Estimating agricultural soil moisture content through UAV-based hyperspectral images in the arid region. Remote Sens. (Basel). 13 (8), 1562. doi:10.3390/rs13081562
Gong, S. Q., Wang, X., Shen, R. P., Liu, Z. B., and Li, Y. M. (2010). Study on heavy metal element content in the coastal saline soil by hyperspectral remote sensing. Remote Sens. Technol. Appl. 25 (02), 169–177. doi:10.11873/j.issn.1004-0323.2010.2.169
Guo, F., Xu, Z., Ma, H. H., Liu, X. J., Yang, Z., and Tang, S. Q. (2021). A comparative study of the hyperspectral inversion models based on the PCA or retrieving the Cd content in the soil. Spectrosc. Spectr. Analysis 41 (05), 1625–1630. doi:10.3964/j.issn.1000-0593(2021)05-1625-06
He, J. L., Han, C. S., Wei, R., Zhou, Z. Y., and Dong, Q. L. (2019). Research on indirect hyperspectral estimating model of heavy metal Cd based on partial least squares regression. Remote Sens. Nat. Resour. 31 (04), 96–103. doi:10.6046/gtzyyg.2019.04.13
Hong, G., and Hyundoo, J. (2021). F-value time-frequency analysis: Between-within variance analysis. Front. Neurosci. 15, 729449. doi:10.3389/fnins.2021.729449
Hou, L., and Wu, Y. P. (2022). Applications of Two-dimensional correlationinfrared spectroscopy in the characterization of polymers. Acta Polym. Sin. 53 (05), 522–538. doi:10.11777/j.issn1000-3304.2021.21362
Jiang, X. L., Zou, B., Tu, Y. L., Feng, H. H., and Chen, X. (2018). Quantitative Estimation of Cd concentrations of type standard soil samples using hyperspectral data. Spectrosc. Spectr. Analysis 38 (10), 3254–3260. doi:10.3964/j.issn.1000-0593(2018)10-3254-07
Li, Z. Y., Deng, F., He, J. L., and Wei, W. (2021). Hyperspectral estimation model of heavy metal arsenic in soil. Spectrosc. Spectr. Analysis 41 (09), 2872–2878. doi:10.3964/j.issn.1000-0593(2021)09-2872-07
Liang, Y. H., Deng, R. R., Gao, Y. K., Qin, Y., and Liu, X. L. (2016). Measuring absorption coefficient spectrum (400—900 nm) of copper ions in water. Natl. Remote Sens. Bull. 20 (01), 27–34. doi:10.11834/jrs.20165132
Lin, H., Wang, Z. W., Liu, C. J., and Dong, Y. B. (2022). Technologies for removing heavy metal from contaminated soils on farmland: A review. Chemosphere 305, 135457. doi:10.1016/j.chemosphere.2022.135457
Lin, N., Liu, H. L., Meng, X. F., Liu, H. Q., and Yang, J. J. (2021). Hyperspectral estimation of heavy metal contents in black soil region. Trans. Chin. Soc. Agric. Mach. 52 (03), 218–225. doi:10.6041/j.issn.1000-1298.2021.03.024
Liu, Y. C., Li, Y. Y., Peng, Y. K., Yan, S., Wang, Q., and Han, D. H. (2020). Application of Two-Dimensional correlation spectra in the identification of adulterated rice. Spectrosc. Spectr. Analysis 40 (05), 237–242. doi:10.3964/j.issn.1000-0593(2020)05-1559-06
Lu, B., Dao, P. D., Liu, J. G., He, Y. H., and Shang, J. L. (2020). Recent advances of hyperspectral imaging technology and applications in agriculture. Remote Sens. (Basel). 12 (16), 2659. doi:10.3390/rs12162659
Luo, L. L., Chang, Q. R., Gao, Y. F., Jiang, D. Y., and Li, F. L. (2022). Combining different transformations of ground hyperspectral data with unmanned aerial vehicle (UAV) images for anthocyanin estimation in tree peony leaves. Remote Sens. (Basel). 14 (9), 2271. doi:10.3390/rs14092271
Maitra, S., Brestic, M., Bhadra, P., Shankar, T., Praharaj, S., Palai, J. B., et al. (2021). Bioinoculants-natural biological resources for sustainable plant production. Microorganisms 10 (1), 51. doi:10.3390/microorganisms10010051
Peng, J., Li, X., Zhou, Q., Shi, Z., Ji, W. J., and Wang, J. Q. (2013). Influence of iron oxide on the spectral characteristics of organic matter. Natl. Remote Sens. Bull. 17 (06), 1396–1412. doi:10.11834/jrs.20132273
Qin, G. W., Niu, Z. D., Yu, J. D., Li, Z. H., Ma, J. Y., and Xiang, P. (2021). Soil heavy metal pollution and food safety in China: Effects, sources and removing technology. Chemosphere 267, 129205. doi:10.1016/j.chemosphere.2020.129205
Ren, Z. L., Zhai, Q. P., and Sun, L. (2022). A novel method for hyperspectral mineral mapping based on clustering-matching and nonnegative matrix factorization. Remote Sens. (Basel). 14 (4), 1042. doi:10.3390/rs14041042
Shen, Q., Xia, K., Zhang, S. W., Kong, C. C., Hu, Q. Q., and Yang, S. W. (2019). Hyperspectral indirect inversion of heavy-metal copper in reclaimed soil of iron ore area. Spectrochimica Acta Part A Mol. Biomol. Spectrosc. 222, 117191. doi:10.1016/j.saa.2019.117191
Shu, M. Y., Zuo, J. Y., Shen, M. Y., Yin, P. F., Wang, M., Yang, X. H., et al. (2021). Improving the estimation accuracy of SPAD values for maize leaves by removing UAV hyperspectral image backgrounds. Int. J. Remote Sens. 42 (15), 5864–5883.
Sun, M. Y., Li, Q., Jiang, X. Z., Ye, T. T., Li, X. J., and Niu, B. B. (2022). Estimation of soil salt content and organic matter on arable land in the yellow river delta by combining UAV hyperspectral and landsat-8 multispectral imagery. Sensors 22 (11), 3990. doi:10.3390/s22113990
Tan, K., Ma, W. B., Wu, F. Y., and Du, Q. (2019). Random forest–based estimation of heavy metal concentration in agricultural soils with hyperspectral sensor data. Environ. Monit. Assess. 191 (7), 446. doi:10.1007/s10661-019-7510-4
Wang, J. H., Zuo, L., Li, Z. Z., Mu, H. Y., Zhou, P., Yang, J. J., et al. (2021). A detection method of trace metal elements in black soil based on hyperspectral technology: Geological implications. J. Geomechanics 27 (03), 418–429. doi:10.12090/j.issn.1006-6616.2021.27.03.038
Yang, H. R., Wang, F. E., Yu, J., Huang, K., Zhang, H. C., and Fu, Z. H. (2021). An improved weighted index for the assessment of heavy metal pollution in soils in Zhejiang, China. Environ. Res. 192, 110246. doi:10.1016/j.envres.2020.110246
Yang, W. M., Liu, G., Ou, Q. H., An, R., Li, J. M., Fu, Z. Q., et al. (2019). Study on natural aging legume seeds by infrared spectroscopy combined with curve fitting. Chin. J. Anal. Chem. 47 (12), 2004–2016. doi:10.19756/j.issn.0253-3820.181610
Zhang, Q., Zhang, F. F., and Huang, C. M. (2021). Heavy metal distribution in particle size fractions of floodplain soils from Dongchuan, Yunnan Province, Southwest China. Environ. Monit. Assess. 193 (2), 54. doi:10.1007/s10661-020-08836-8
Zhang, X., Wang, Y. B., Sun, W. C., Huang, C. P., and Zhang, M. (2020a). Inversion of Pb content in soil based on iron oxide characteristic spectrum and improved genetic algorithm. Trans. Chin. Soc. Agric. Eng. 36 (16), 103–109. doi:10.11975/j.issn.1002-6819.2020.16.013
Keywords: soil, spectral analysis, iron-copper interaction, characteristic band selection, estimation of copper content
Citation: Feng Z, Zhang S, Yang B, Zhou T and Rui T (2022) Iron-copper interaction in soil spectra and its effect on the estimation of copper content. Front. Environ. Sci. 10:1039470. doi: 10.3389/fenvs.2022.1039470
Received: 08 September 2022; Accepted: 16 September 2022;
Published: 05 October 2022.
Edited by:
Jun Zhou, University of Massachusetts Lowell, United StatesReviewed by:
Chuncai Zhou, Hefei University of Technology, ChinaCopyright © 2022 Feng, Zhang, Yang, Zhou and Rui. This is an open-access article distributed under the terms of the Creative Commons Attribution License (CC BY). The use, distribution or reproduction in other forums is permitted, provided the original author(s) and the copyright owner(s) are credited and that the original publication in this journal is cited, in accordance with accepted academic practice. No use, distribution or reproduction is permitted which does not comply with these terms.
*Correspondence: Shiwen Zhang, bWFtaW4xMTkwQDEyNi5jb20=
Disclaimer: All claims expressed in this article are solely those of the authors and do not necessarily represent those of their affiliated organizations, or those of the publisher, the editors and the reviewers. Any product that may be evaluated in this article or claim that may be made by its manufacturer is not guaranteed or endorsed by the publisher.
Research integrity at Frontiers
Learn more about the work of our research integrity team to safeguard the quality of each article we publish.