 Nabila Khurshid
 Asma Fiaz2
94% of researchers rate our articles as excellent or good
Learn more about the work of our research integrity team to safeguard the quality of each article we publish.
Find out more
ORIGINAL RESEARCH article
Front. Environ. Sci., 25 October 2022
Sec. Environmental Economics and Management
Volume 10 - 2022 | https://doi.org/10.3389/fenvs.2022.1039128
This article is part of the Research TopicCarbon Neutrality Approaches in Buildings and Agriculture SectorsView all 12 articles
Despite the fact that Pakistan’s contribution to GHG emissions is low (0.8%) when compared to other countries but it is one of the hardest hit by climate change. The present study is an attempt to identify the impact of climate change on economic growth. The non-linear autoregressive distributional lag (NARDL) technique is used to estimate the asymmetric effect of climate change on the economic growth of Pakistan. Annual data covering the years 1980–2021 are used for empirical analysis. It is noteworthy to reiterate that CO2 emissions and mean temperature pose asymmetrical results concerning economic growth, both in the long-run and short-run. CO2_POS and CO2_NEG have a negative impact on economic growth, whereas MEANT_POS has a positive impact on economic growth and MEANT_NEG has a negative impact. Precipitation has a positive and significant long-term influence on economic growth. Research findings indicate that comprehensive mitigation policies at the nationwide and worldwide levels are required to limit human-caused climate change in Pakistan. At national level, tree planting projects and safeguard greenery at all costs while at international level, policies needed for adoption of mitigation strategies to control climate change.
Climate change is widely acknowledged as having major consequences for water supplies, agricultural growth, ecology, the health of humans and animals, forestry systems, and socioeconomic sectors (Nordhaus, 1991; Stern, 2006; Tol, 2008). Climate change is predicted to have a greater impact on emerging and impoverished countries than on affluent countries (Gemenne et al., 2014). Climate anomalies are becoming the norm as human-caused climate change exacerbates natural catastrophes worldwide, with the poor bearing the brunt of the repercussions despite being the major cause (Nordhaus, 1991; Stern, 2006). The industrial discharge of Green House Gases (GHGs) grew rapidly after Industrialization. GHGs have a strong warming propensity and a lengthy lifespan (decades to centuries) which can contribute to global warming (Ma et al., 2021; Syed et al., 2022).
The accumulation of GHSs will undoubtedly contribute to global warming (IPCC, 2007a). It should be realised that the climate is not a continuous, unchanging reality even when left alone (Weiss and Bradley, 2001). Carbon dioxide (CO2) accounted for around three-quarters of total GHG emissions in 2018 (World Bank, 2021). As a result, such high levels of CO2 emissions are frequently cited as a primary driver of global warming, and lowering CO2 emissions is typically seen as the most pressing issue for global economies (Liu and Wang, 2022; Murshed et al., 2022). Globally, the researchers discovered that each additional 1°C of day-to-day temperature fluctuation was associated with a 5% reduction in regional economic growth rate in any given year. Even at the regional level, where yearly rates might vary by 16 percentage points each year, this is a significant shift. Forecasts show that if effective CO2 emission reduction measures are not implemented, the global temperature would rise by 3–4 degrees Celsius over pre-industrial levels (NOAA, 2017; Kurramovich et al., 2022). The following map shows how big swings in day-to-day temperature hit economic growth. This map shows the percentage point change in economic growth rates for each extra 1C0 of day-to-day temperature variability in any year.
Algorithm 1. Graph construction.
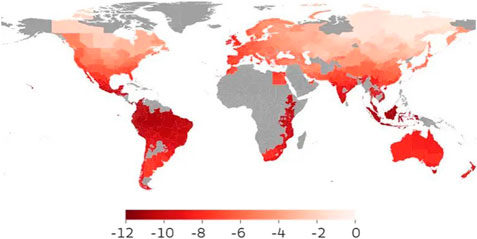
Source: Nature Climate Change/Maximilian Kotz.
The climate change argument arises from a succession of warnings from scientists and others, all of which indicate that human-caused climate change is an impending threat to civilization (Stern 2006; IPCC 2007a). Millions of people may face health consequences, crop production in the low latitudes may decline, water supplies may dwindle, precipitation in arid regions may decrease, extreme events may increase exponentially, and 20%–30% of species may face extinction (Stern, 2006; IPCC, 2007b). Worse, catastrophic disasters such as the collapse of the polar ice sheets might cause major storm surge, flooding hundreds of millions of individuals (Dasgupta et al., 2009). If GHSs are not dramatically cut today, economic development and well-being may suffer (Stern, 2006).
Climate change economic research has long shown that the market economy of agriculture, coastal resources, energy, forestry, tourism, and water is vulnerable to climate change (Pearce et al., 1996). Agriculture and forestry account for a larger share of the economies of developing countries in general. They are also more likely to occur in lower altitudes, in which the consequences on these industries would be more significant. These latitudes are too hot, so profitable agricultural activities are usually difficult, and it is alarming that any further increase in warming will lower production levels even further. Low latitude countries may bear up to 80% of the consequences of climate change (Mendelsohn et al., 2006).
To improve social welfare, sustainable economic growth and development are required. It implies that environmental sustainability should be safeguarded rather than economic progress occurring at the price of environmental damage. It has been emphasized that environmental deterioration is a difficult issue in the process of economic growth. Because environmental deterioration has a direct influence on people’s living standards and the operation of the economy. According to empirical studies, lower levels of development are related to climatic conditions that impact economic production (Burke et al., 2015; Kalkuhl and Wenz, 2020). Reduced or even stagnated economic development would be a huge problem, especially for developing countries. It may, however, have distributional consequences in wealthy countries by disproportionately harming poorer regions within nations or more vulnerable sectors of populations (Hirabayashi et al., 2013; Prudhomme et al., 2014).
In the literature, there are various plausible methods for climate change to affect economic growth. Climate change’s negative impact on economic growth is supported by both theoretical and empirical evidence. For starters, environmental deterioration caused by attrition, inundation, drought, the extinction of rare taxa, and mortality caused by extreme weather all have long-term ramifications for economic growth. Second, the means necessary to mitigate the effects of climate change would constrain investing in both financial and physical infrastructure, R&D, and intellectual capital, slowing development (Pindyck, 2011; Ali, 2012). The relationship might theoretically be formed using macroeconomic and microeconomic characteristics. Macroeconomic consequences include the impacts on agricultural production and the country’s economic propensity to develop (for example, through changing investing or institutions that encourage economic output development) (Dell et al., 2012). The interaction between the microeconomic analysis component and numerous variables like physical and mental productivity levels, conflicts, and well-being may all have an impact on the economy (Gallup et al., 1999).
Pakistan, being a warm area, is particularly sensitive to atmospheric changes since it is located in a geographical zone where temperatures exceed the global average. The nation is predominantly dry and semi-arid (approximately 60% of the land receives less than 250 mm of rain per year, with the remaining 24% receiving between 250 and 500 mm); the rivers are mostly supplied by Hindu Kush-Karakoram Himalayan glaciers. They are rapidly disappearing because of global warming; the economy is agrarian and hence particularly vulnerable (Syed et al., 2022). The variability of monsoon weather and rainfall each year has resulted in huge floods and widespread droughts in Pakistan in recent years. As a result of the problems, Pakistan’s groundwater resources, storm surge security, energy security, and agricultural sectors are all jeopardized (Boone, 2008). According to Figure 1, mean rainfall in Pakistan’s dry plains and the coastal belt has dropped by 10%–15% since 1960, leading to the continued deterioration of the country’s wetlands and mangrove ecosystems. The majority of other regions have seen a slight increase, both during the monsoon and dry seasons.
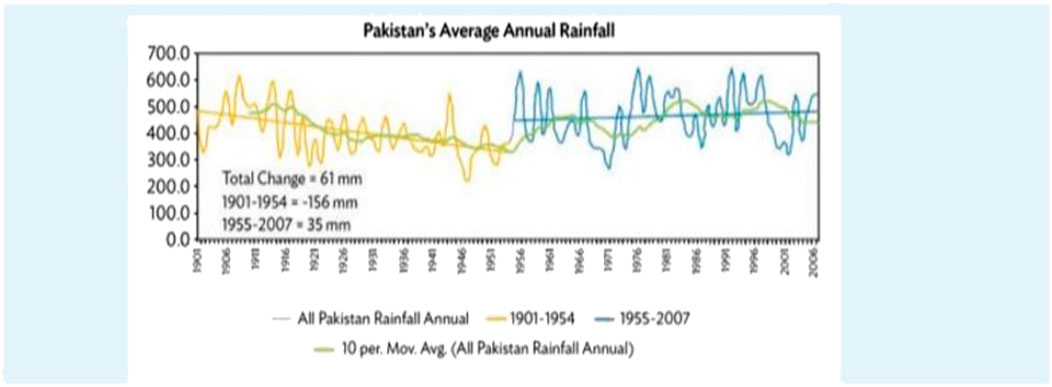
FIGURE 1. Historical precipitation in Pakistan, adapted from ADB (2017).
Furthermore, rising temperatures have created a noteworthy shift in monsoon patterns as well as an increase in the number of hurricanes in northern Pakistan in recent years, with agricultural consequences. Pakistan is the world’s sixth most susceptible country to climate change (Ahmed et al., 2020). Figure 2 shows the future projection of the rise in temperature in Pakistan. It can be seen that the future rise in average temperature in Pakistan is significantly greater than the world temperature which is a very alarming situation.
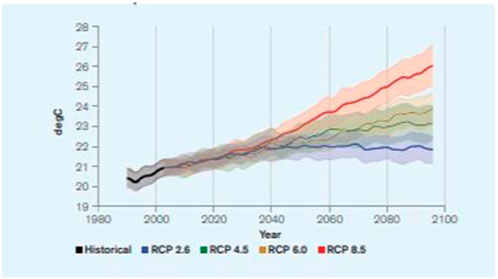
FIGURE 2. Historic and projected average annual temperature in Pakistan under RCP2.6 (blue) and RCP8.5 (red). The values shown represent the median of 30+ GCM model ensemble with the shaded areas showing the 10–90th percentiles.
Climate abrupt changes have been a vital concern for Pakistan because of its faster-growing population and the resultant increase in urbanization (Anwar et al., 2020).
GHGs from the heavy use of fossil resources are recognized as the primary cause due to their influence on heat retention in the upper atmosphere. This increase in global temperature exacerbated the phenomenon of global warming, resulting in climate change worldwide consequences. Over 25 million people are employed in Pakistan’s agriculture-based economy. Pakistan is ranked as the world’s fifth most populous economy where the population growth rate is more than 2.83% (GoP, 2021).
In general, when agricultural output rises, so does industrial output, because agricultural and industrial output are inextricably linked (Graue, 1930). The link between the agricultural and industrial sectors has long-term implications since higher agricultural production leads to reduced prices and farm consolidation. The industrial sector makes use of extra manpower that the agricultural sector does not require (Lewis, 1972). According to the general economic growth theory, this process leads the entire economy to grow. In contrast, the short-run relationship is very different from the long-run relationship. Agricultural commodity price fluctuations are directly related to the general health of the economy and the expansion of the industrial sector. Reduced agricultural revenue leads to lesser demand for industrial goods, and the economy suffers as a result. The importance of the agricultural sector in business cycles shows that business cycles are very much dependent on agricultural activities in economies.
The rising realization that Pakistan contributes the minimum to the environmental impact while suffering the most devastating consequences of climate change motivates Pakistan to understand the ramifications. This is due not just to economic losses associated with decreased agricultural output, but also to increases in sickness, mortality, and social instability. Countries face opportunity costs when they spend money on climate adaptation rather than on technological advancement or capital investment. We should take action to prevent human-caused climate change, as these changes have a significant impact on agricultural productivity. This is a highly concerning issue for developing countries whose economies rely on agriculture. The Figure 3 below depicts the climatic variance impact on agricultural trade through 2050 in Pakistan.
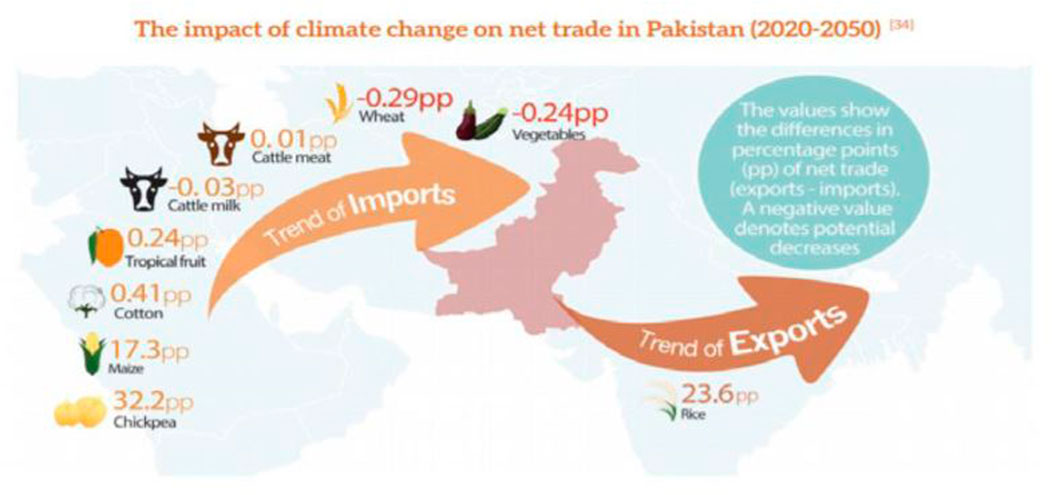
FIGURE 3. Climate knowledge portal (Chaudhary, 2017).
According to Naeem et al. (2012), Burke et al. (2015), Liu (2022), Liu and Wang (2022) the impact of climatic variation on economic growth can be asymmetric. Therefore, the main objective of this study is to investigate the asymmetric impact of CO2 and temperature on the economic production of Pakistan. In case of Pakistan there is rarely any study available that investigates the nonlinear relationship between climate change and economic growth. This study will also contribute to provide effective policies that will helps in the reduction of economic loss due to climate change. This research also provides the answers to the following questions: Are temperature, precipitation, and CO2 are important factors that effects Pakistan’s economic growth? Do CO2 and temperature have asymmetric impact on economic growth of Pakistan?
There is much disagreement on the primary drivers of climate change and the influence of climate change on global economic growth. The body of knowledge on the relationship between environmental sustainability and economic growth has developed dramatically. This section provides an updated assessment of how climate change impacts economies, as well as an evaluation of key empirical and theoretical literature on the relationship between climate change and economic development.
Wade and Jennings (2016) investigate the worldwide economic impacts of climate change. According to them, as global temperatures increase, rising operating expenses would harm the global economy, with studies suggesting a worst-case annual effect of 1% GDP growth. According to research, the impact would be disproportionately unfavourable for developing countries, and the long-term financial consequences of climate change can only be mitigated by cooperating to enact strong carbon emission restrictions. Berlemann and Wenzel (2018) explore the short- and long-run growth impacts of rainfall using a large panel dataset spanning more than 150 countries from 1951 to 2013. They discover extensive and highly strong empirical evidence for long-term negative growth consequences of rainfall deficits in poor and rising countries that are not driven by the Sub-Saharan African subsample. Stock’s (2020) research on Climate Change, Climate Policy, and Economic Growth included temperature, CO2 emissions, and GDP. According to the study, rising temperatures cause a wide range of climatic changes, including droughts, hotter days, and more powerful rainfalls and storms, all of which vary locally. The principal driver of this warming is anthropogenic carbon dioxide (CO2) emissions from the combustion of fossil fuels. Baig et al. (2022) investigated the asymmetrical dynamic connection between climatic change and rice production in regard to other explanatory factors. On time series data from India from 1991 to 2018, the researchers employed the nonlinear autoregressive distributed lag (NARDL) model and the Granger causality approach. According to the NARDL findings, mean temperature has a detrimental long-term influence on rice yield while having a positive short-term impact. Furthermore, positive shocks in rainfall and carbon emissions have long-term and short-term negative and severe consequences on rice yield. In contrast, negative rainfall shocks have a significant long-term and short-term influence on rice yield. There is a feedback impact between mean temperature, decreasing rainfall, rising carbon emissions, and rice yield, according to the Granger causality test. Khan et al. (2020) assessed the economic impact of climate change-induced agricultural output loss in Pakistan using a combination of global climate, crop, and economic models. Climate change-induced reductions in wheat and rice crop productivity would cost Pakistan $19.5 billion in real GDP by 2050, according to the estimates, with commodities prices rising and domestic private consumption declining dramatically. However, the decline in agricultural output affects not only the economic agents working in the country’s agriculture sector, but it also has a multiplier effect on the industrial and commercial sectors. A major increase in commodity prices would provide a huge challenge to the entire country’s livelihood, especially for city dwellers. Kiley (2021) utilised quantile regressions to determine if climate change increases the likelihood of severe economic recession. Temperature has a significant and consistent influence on economic growth risks across all dimensions.
The current research used the Cobb-Douglas Production function for estimation for finding out the impact of climatic changes on economic growth. These effects are then added together to get an estimation of the overall shift in social wellbeing induced by climate change (Fankhauser and Tol, 2005; Niamir et al., 2020). Dell et al. (2008) integrated climate variations into the equation; this approach would be used as a benchmark in the ongoing study since it establishes a conceptual framework for including climate variations in the economic development model. Take into account the following model:
Where Y represents GDP, L represents labor force, A represents technology, and can alternatively be referred to as labor productivity, T represents climatic impacts, and K represents physical capital. The direct consequences of climate change on economic growth are captured in Eq. 1 while Eq. 3 captures the impact of climate on other factors that drive GDP growth indirectly. It is worth noting that Eq. 1 directly ties climate change to GDP, but Eq. 2 relates climate change to labor productivity, which in turn affects GDP growth. After taking logs of Eq. 1 and differencing concerning time, the following equation can be derived.
Where GDP growth rate is used, direct effects of climate change on economic growth are represented as
The following conceptual frame has been developed based on past literature for current research.
Algorithm 2. Graph construction.
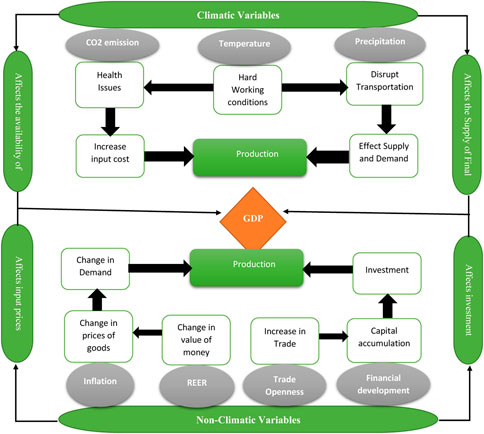
Source: Author Own creation.
Detail regarding different variables used in the current study is presented in Table 1 along with data sources.
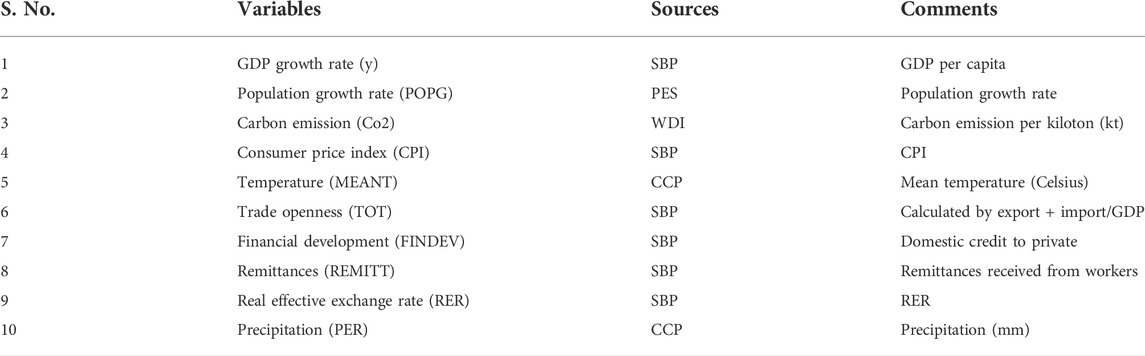
TABLE 1. Data sources.
Real effective exchange rate (REER) is the measurement of domestic currency against the weighted average of several foreign currencies, divided by the price deflator. Depreciation of domestic currency makes exports cheaper and imports expensive and vice versa. The extent of price elasticity determines the effect of price movements in the services sector (Sahoo and Dash, 2014). Depreciation of REER results in an increase in exports for both developed and developing countries (Gnangnon, 2021). According to Kandil and Mirzaie, (2002) the REER affect the economic growth through various channels. The first channel affects the demand of the goods and services by raising imports and decreasing exports because of appreciation. As a result, aggregate demand is contracting. The second channel is that appreciation reduces demand for the dollar because agents expect the REER to recover to its expected steady-state value. We have used REER as a key independent variable for our model.
Remittances (REM) are the transfer of a portion of a migrant’s earnings in the form of cash or commodities to assist their family. The increase in remittances will increase the foreign reserves of the country and help in the appreciation of the currency. Mim and Ali (2012) through channels of saving and investment, remittances have a direct impact on the economic growth. Remittances can support the accumulation of human capital, implying that human capital is an effective avenue via which remittances influence the expansion of the GDP. The proxy variable used for remittances is Personal remittances received as a % of GDP which is also used by Munawar and Baig (2019) and Stojanov et al. (2019).
Trade openness (TO) is the sum of imports and exports normalized by GDP. The proxy variable used for Trade Openness is trade as a ratio of GDP (Keho, 2017). According to Wong (2007) trade openness impacts the economic growth through access to better and cheaper technology equipment, economies of scale, and spillover effects. The production of goods and services in an open economy can have access to foreign technology and innovation that result in a boost of production.
An inflation is a situation of declining purchasing power of a specific country currency over a specific period.
The population of Pakistan has grown at a rate of 2.1% due to an extremely high birthrate. As is well known, national income is divided by the whole population to determine per capita income. The population growth is shown in the low per capita income.
The average air temperature throughout a specific time period, typically a day, a month, or a year, as measured by a thermometer that has been properly exposed. The mean temperature is often calculated for the year and for each month in climatological tables.
Carbon dioxide emissions, also known as CO2 emissions, are those caused by the burning of fossil fuels and the production of cement and other goods. They also include gas flaring and carbon dioxide created during the use of solid, liquid, and gas fuels.
The economic growth will be calculated using Eq. 4 which is the Supper Reduced form of the baseline model used is specified as:
Where Y represents GDP while RER, CPI, LTF, FD, Popg, CRM, TOT, CO2, MTEMP, and Prep denote real effective exchange rate, consumer price index, remittances, financial development, Population growth, and terms of trade, CO2 emissions, mean temperature, and precipitation respectively.
The current study used the NARDL model to estimate the asymmetric effect of climate change on economic growth. NARDL is the updated version of the Autoregressive Distributive Lag model (ARDL) of Pesaran et al. (2001).
The ARDL model was used to examine the symmetric influence of variables in both the short and long term, but it does not account for the asymmetric relationship between variables. By applying partial sum decomposition of the independent variables, NARDL can tolerate asymmetric effects in both long-run equilibrium and short-run dynamic coefficients. Because of its simplicity and ease of interpretation, the NARDL model is frequently utilized in the research in a variety of domains, including economics (Cho et al., 2006). The following ARDL equation shows the linear relationship between Climate change and economic growth:
Respecify the above equation above we get the ARDL Cointegration model equation as follows.
Where q is the lag of independent variables. η = Short-term representation of Variables.
The analysis normally begins with a check of the order of integration of all variables to assure a non-spurious estimation and that no variable is integrated in order larger than one I(1); otherwise, the limits test for cointegration will be invalid. To avoid erroneous regression, the ADF unit root test established by (Dickey and Fuller, 1979) is used to assess the stationarity of time series data. Our model’s variables are a combination of stationary at a level I(0) and non-stationary, integrated with order one. CMR, CO2, CPI, Meant, and Per are all stationary at a level I(0), but all other variables are I(1), with no I(2) variables.
Eqs 5, 6 show a symmetric connection between explanatory variables. Given the importance of non-linearity in that both positive and negative increases in MEANT and CO2 may have distinct effects. So, the NARDL model is more suited to reflect the asymmetric influence of these positive and negative changes (Shin et al., 2014). Climate change variables are split into MEANT POS and MEANT NEG, CO2 POS, and CO2 NEG in the NARDL technique. As a result, the model is as follows:
MEANT
CO2
As we are using a nonlinear framework in our study and there is a probability of nonlinear impact in the time-series data. Therefore, we make a nonlinear model as follows:
Where,i = lag identityt = time
In this study, we employed Phillips and Perron’s (1988) (Fisher-PP) and Augmented Dicky Fuller (ADF) tests to examine the propensity of a unit root test across a series of data. Table 2 shows the results of unit root testing. According to the findings, variables such as CPI, MEANT, and PER are stable at the level in both tests, indicating that they do not require differencing due to zero-order integration. However, after initial differencing, the other variables, which included GDPER, CO2, FINDEV, REER, REMIT, and TOT, remained steady.
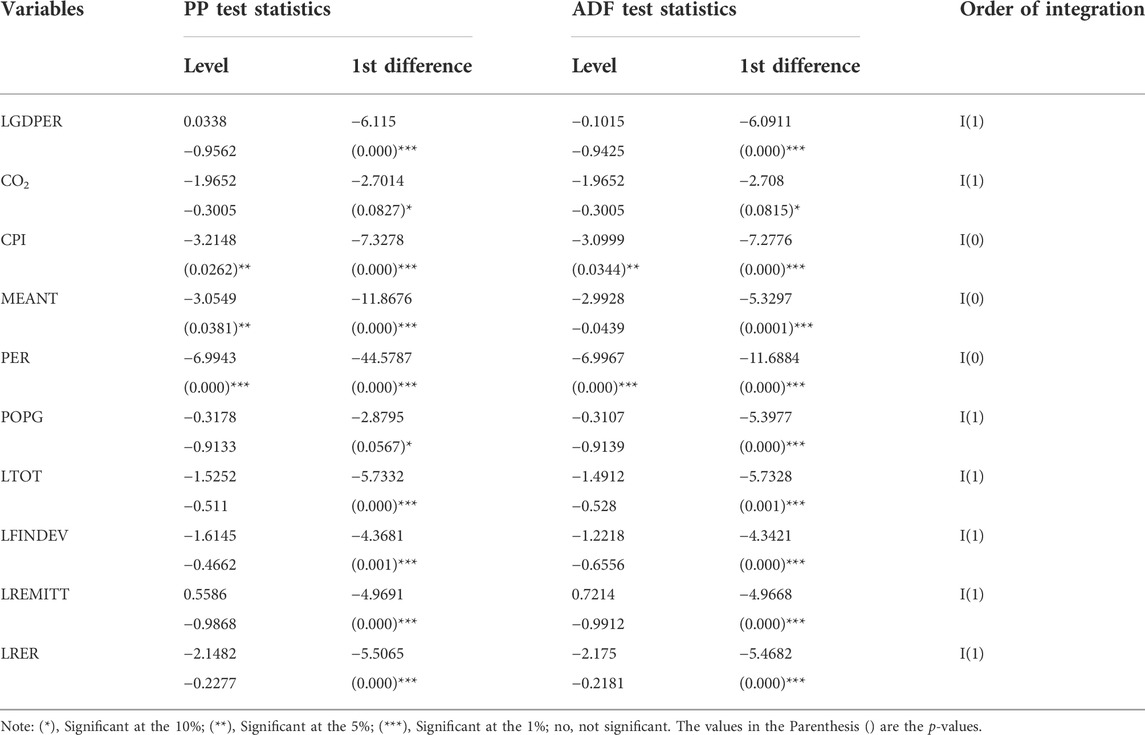
TABLE 2. Results of PP and ADF test.
To study the cointegration connection between variables by imposing zero constraints on one lag variable. As indicated in Table 3, the computed F-statistics is eleven, which is larger than the upper bond values I(1) critical value (i.e., 2.77) at a 10% significant level. As a result, the null hypothesis of no cointegration is rejected, implying that GDP growth, carbon emissions, precipitation, average temperature, trade openness, inflation rate, Population growth rate, financial development, real effective exchange rate, and remittances have a long-run connection.
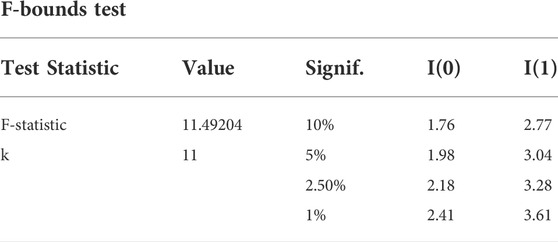
TABLE 3. Bound test.
Table 4 depicts the short-run results of the NARDL model. According to the results, CO2_NEG and CO2_ POS have significant effects on the GDP level. 1 unit increase in the carbon emissions is likely to decrease GDP growth by 1.935 units, Ejuvbekpokpo (2014) found the same as our findings that CO2 and economic growth are negatively related to each other. The increase in CO2 emission effects the health of the labor, which as a results cause decline in the productivity of labor and negatively effects GDP as well. Further, a 1 unit decrease in the mean CO2 emissions also reduces the GDP by 2.6290. Ghosh (2010) found that the decrease in CO2 emission will likely diminish the GDP growth. The CO2 at a certain level is feasible for the agricultural production however lower than that will affect the agricultural production. On the other hand, MEANT_POS increased GDP by 0.1094, and MEANT-NEG decreases GDP by 0.1315. Since excessive cold can impede some activities just as much as extreme heat, greater temperatures in colder regions or during colder seasons may boost economic activity Colacito et al. (2018). Other controlled variables including CMR, CPI, TOT, POPG, and PER show a positive impact on GDP growth. Further, CO2_POS, LFINDEV, LREER, LREMITT, and LTOT become significant after one lag period. The results of the ECM model show that the value of the ECM coefficient is negative and significant (−0.706). In practical results, the value of ECM should be negative and significant in the long run relationship which can be seen above indicating the cointegration among variables. This value of ECM indicates that around 84% of deviations are adjusted per year. This shows the stability, and the speed of adjustment is quick. In other words, the ECM coefficient is very large which means that the adjustment of short deviation around the long run time path is very quick. Anyhow the ECM model is considered stable, and the endogenous variables are the elasticities that indicate the short-run impact on services sector output. The value of ECM (−0.8415) indicates that the last year shocks disequilibrium as compared to the long-run equilibrium in the present year.
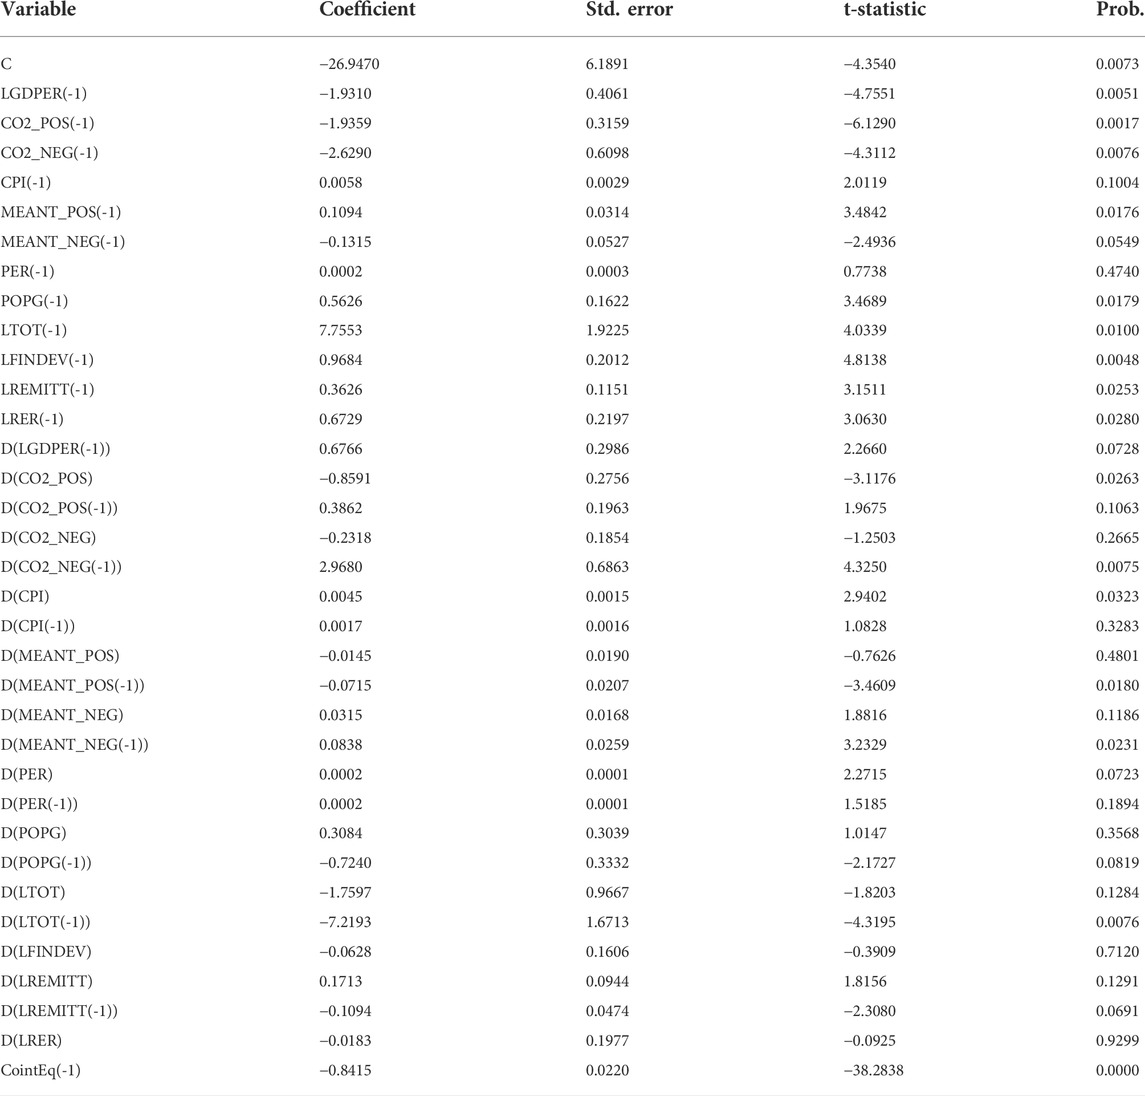
TABLE 4. Short-run results.
Table 5 shows the long-term results of the NARDL model. Empirical results depict that there is an asymmetric association between climatic factors (temperature and Carbon emissions) and economic growth. According to our findings, CO2 emissions have asymmetry in magnitude, but MEANT has asymmetry in sign. The CO2 emission coefficient demonstrates that increases and decreases in CO2 emissions hurt economic development, i.e., a 1 unit increase in the carbon emission will likely decrease the GDP growth by 1.0025 percent whereas a 1 unit decrease in the carbon emission caused 1.35 percent to decline in the GDP growth. These findings are consistent with those of Porter and Brown (2009), who discovered that carbon emissions had a negative and substantial influence on economic growth. They asserted that the negative impact is due to decreased land and labor productive capacity because of rising carbon emissions. The negative impact of CO2 on the level of GDP in the Pakistan economy is caused by a decrease in aggregate output. Our findings on CO2 emissions’ positive relationship with GDPG are corroborated by literature, which indicated that because of globalization, both companies and individuals will develop quicker. As a result, agricultural production must increase to provide food security and a continuous supply of raw materials to the industrial sector (Schneider and Smith, 2009). As a result, higher agricultural production raises carbon dioxide emissions (Celikkol Erbas and Guven Solakoglu, 2017). Indeed, improper agricultural practices such as agricultural production in unsuitable areas to increase output, pesticides and chemical fertilizers, irrigation, soil processing, mistakes in plant hormone use, stubble burning, and dumping of unsuitable animal waste into the soil all contribute to increased CO2 emissions from crop production (Waheed et al., 2018). So, an increase in agricultural production increases GDPG and CO2 emissions as well.
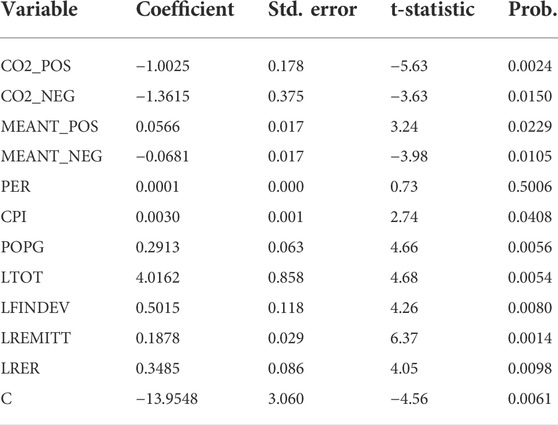
TABLE 5. Long-run results.
Climate change is a socioeconomic as well as an environmental issue. Too much heat or cold can have an impact on human behavior, efficiency, and, worst of all, mortality. MEANT coefficient shows that asymmetric effect on economic growth.1 unit increase in temperature increases economic growth by 0.0566 percent whereas 1 unit decrease in temperature decreases economic growth by 0.0681 percent. According to (Colacito et al., 2018) positive impact of the rise in temperature on GDP growth is due to its variance from region to region. Higher temperatures in colder regions or during colder seasons may have a positive effect on economic activity because the extreme cold can be just as difficult to perform as extreme heat. So, the rise in temperature in colder areas could be more productive for economic activities due to less effect of cold. The positive impact of the temperature rise is also due to boost of some industries in hotter weather, like rising in the demand of refrigerator, air-conditions, Increased summer temperatures have a positive impact on some industries, such as rise in the demand of refrigerator, air-conditions, the solar industry, utilities, and mining, may benefit from increased energy consumption during hotter days. Our study is also supported by the results of Berge et al. (2017). Our result further documented the MEANT_NEG pose a negative impact on economic growth. Several well-documented studies show that extreme weather hurts agricultural yields and worker productivity. These have an impact on household welfare and may lead to an increase in poverty incidence (Lee et al., 2016). The decline in the temperature hurts the agricultural sector. Weather uncertainty in Pakistan causes loss of crops due to which the output of agricultural products declines. Heavy rainfalls in the region cause a decline in temperature and many times it causes flooding that as a result destroys the crops. According to Burke et al. (2015), the regions with already cold weather are also productive and they yield more production but when temperatures decline more than a certain level it causes a decline in the output. Further, PER causes a positive but insignificant effect on economic growth. Past studies (Porter and Brown, 2009; Akram and Hamid, 2015) also showed the positive link between precipitation and economic growth which primarily is caused by the agricultural sector.
Our findings show that there is a positive relationship between CPI and economic growth, as a1 unit increase in CPI will cause a 0.0030% increase in GDPG, thus as the rate of inflation rises, GDP Declines (Asif, 2013). Our findings are consistent with those of Hussain and Malik (2011), who discovered that both factors had a positive and substantial influence on each other. Our findings are consistent with the Tobin portfolio-shift effect, which states that a high inflation rate causes consumers to invest more in physical capital while decreasing their real balance holdings.
Our research also shows that POPg had a beneficial and considerable impact on economic growth. Our findings are consistent with those of Ali et al. (2013) and Afzal (2009), who found that population expansion had a beneficial influence on economic growth. According to them, population expansion is not a serious concern; rather, it may aid economic growth because of the large workforce available and the division of labor.
In our analysis, LTOT plays a significant role in promoting GDP growth. The co-efficient of variable LTOT reveals that it has a significant positive impact on GDPPER. The coefficient is significant at the 1% level, implying that increasing LTOT boosts growth. The TOT co-efficient is high, indicating that a 1% change in LTOT results in a 4.0162 percent increase in GDP growth. As a result, developing countries like Pakistan must accelerate trade liberalization to achieve high economic growth. They should not be concerned about the weak arguments in favor of protectionism. This result agrees with Ghosh and Phillips (1998), Leyaro (2015), and Tahir and Khan (2014).
The growth of GDP is positively impacted by financial development, as is to be expected. An increase in financial development by 1% causes an increase in GDP growth by 0.5015%. The availability of financing is extremely important for GDP growth. The increase in finance will lead to an increase in investment and production and as a result the GDP will grow. Therefore, it is advised that policymakers extend the lending of finance to highlight its contribution to economic growth (Tahir et al., 2021).
On the other hand, the LREMMIT indicates a favorable and large impact on the output of the services sector. Results indicate that a 1% increase in LREMMIT causes a 0.1878% increase in the GDP. Empirical data are currently accessible that support our findings. Numerous research has discovered the beneficial effects of remittances on GDP, including Lucas (2005) and Glytsos (2002). Like this, the study by Catrinescu et al. (2009) demonstrates that REMMIT has a favorable effect on output productivity. They discovered that the REMITT influences the GDP through consumption and investment. Investment rises by 3% because of the growth in remittance revenue (Osili, 2004). Remittances from overseas raise the beneficiaries’ standard of living, which increases demand for and investment in the economy (Mim and Ali, 2012). According to a study by Woodruff and Zenteno (2001), 20% of remittances are used to fund microenterprises that experience rapid development and productivity. Our investigation suggests similar findings to those of these studies.
The results further indicate the positive impact of LRER. A 1%increase in the value of the rupee is likely to raise GDP growth by 0.3485%. A stronger domestic currency encourages businesses to adopt more advanced technology to boost production and, consequently, profits by increasing imports of the machinery and raw materials required for the development and growth of the economy. The opportunity to purchase cheaper raw materials encourages an expansion in production. These findings concur with those of Johnson and Koyama (2017).
Table 6 shows the results of granger causality test. It is observed that unidirectional causal relationship was running from LGDPER, LREER, LREMITT, LTOT, PER, POPG, CMR, CO2, CPI. Hence these causal relationships support the elasticity of NARDL for each series.
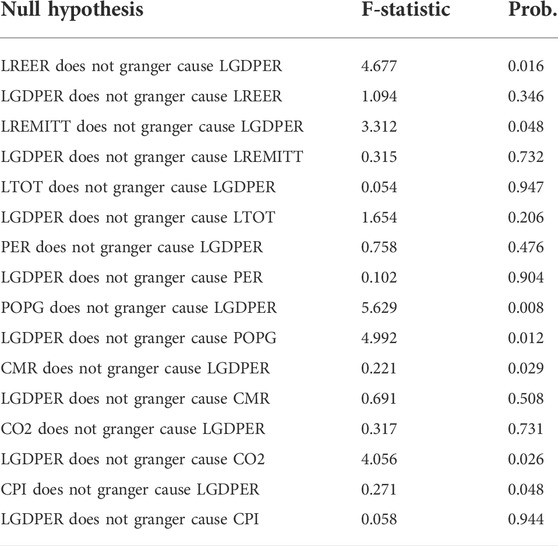
TABLE 6. Granger causality tests.
CUSUM and CUSUM of the square test were initially presented by Brown et al. (1975). This test is based on a plot of the sum of recursive residuals. The plotting charts in this test show two straight red lines. While one blue line is between these two, red lines represent the percentage of the critical link. If blue lines cross red lines, then we refused each of the predicted variables which suggests that our data is nonlinear. However, if the plot stays inside two straight lines, we do not reject projected variables which indicate that our data is linear. CUSUM test identified us to indicate whether the coefficient of the variables is changing systematically or not, however on the other hand cumulative test helps to show if the coefficient of regression is changing unexpectedly. CUSUM Square graphs have been illustrated in Figure 4. Because the plots stay between the critical lines at a 5% level of significance, we infer that the model is stable. Hence, we must assume that parameters are also stable because the blue line is existing inside the red line. CUSUM of squares is inside the critical limits of 0.05% which shows the structural stability of the model and overall goodness of fit.
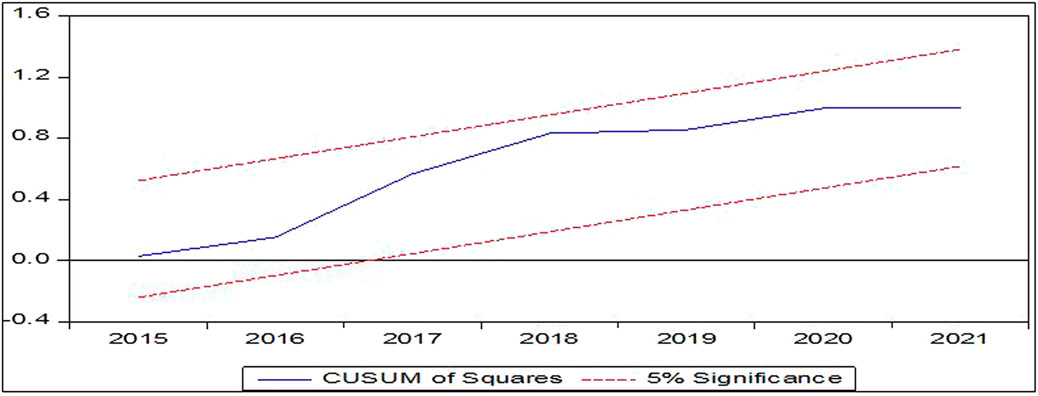
FIGURE 4. CUSUM square graph.
It is worth noting that the physical elements of Pakistan cause a broad variety of climate changes. This climate volatility may have an impact on Pakistan’s economic growth due to significant rainfall at one time and a drought condition at another, as well as floods and rising temperatures. As a result, climate change has had a negative impact on several areas of the economy. It is critical to understand the potential influence of climate change on economic growth in order to develop appropriate mitigation techniques and policies. In light of these considerations, the current study conducted time series research on the asymmetric relationship between climate change and economic growth in Pakistan. For this, we made use of the annual time series data collection for the years 1980 through 2021. The findings indicate that CO2 and MEANT have an asymmetric influence on economic growth. CO2 emissions have a negative long-term influence on GDP growth, but precipitation has a favorable long-term benefit. The mean temperature coefficient demonstrates that both increases and decreases in mean temperature are expected to favorably benefit Pakistan’s economic growth. The negative effects of CO2 result from reduced labor and land productivity due to an increase in carbon emissions. The detrimental effects of a decline in total output on Pakistan’s economy’s GDP level. As a result of the nation’s trade liberalization, more and more affordable used cars are being imported. As a result, the number of metric tons of automotive emissions has increased, endangering the environment. Plant fumes and portable generators, which are also imported in significant numbers because of the country’s inconsistent electricity supply, are other sources of carbon emissions. Our findings are validated by (Azomahou et al., 2006; Ajmi et al., 2015; Salahuddin and Gow, 2016; Dogan and Aslan, 2017). However, the mean temperature coefficient indicates that both a rise and a drop in mean temperature are expected to have a favorable impact on Pakistan’s economic development. However, the impact of the temperature fall on GDP growth is minimal. Our research indicates that a 1 unit rise in temperature can result in 0.0566 units rise in GDP. According to Riccardo et al. (2018), the fact that the influence of temperature rise on GDP growth varies by location is what accounts for this. In fact, because extreme cold can be just as difficult to perform as excessive heat, greater temperatures in colder places or during colder seasons may have a favorable impact on economic activity. Therefore, the economic operations in colder regions may be more productive as a result of the cold’s diminished effects. According to the study findings, if climate change is not regulated, Pakistan’s economic growth will be significantly curtailed. It argues for the need for a coordinated and comprehensive strategy addressing the implementation of prevention measures to control climate change because climate change will have a large negative influence on economic growth if it is not handled. Reduced economic growth will also result in a reduction in social welfare. Even though the poor contribute little to climate change, they bear the brunt of its consequences due to their reliance on agribusiness and inability to pay for preventative and mitigation measures. As a result, climate change mitigation is critical not just for economic growth but also for human well-being. However, Pakistan can only do so much to prevent climate change because its contribution to GHG emissions is modest in comparison to developed nations. Hence, two types of policy recommendations were presented. On the national level, The Pakistani government must increase tree planting projects and safeguard greenery at all costs. The problem is expected to worsen as the temperature rises and the population grows. Farmers must be taught cutting-edge agricultural and horticulture practices. On an international level, there is a need for an international policy regarding the adoption of mitigation strategies to control climate change.
Publicly available datasets were analyzed in this study. This data can be found here: https://data.worldbank.org/country/pakistan, https://www.sbp.org.pk/departments/stats/pakEconomy_HandBook/index.htm.
NK: conceptualization, data collection, and writeup. AF: analysis and review. KA: methodology and review. JK: data curation and proofread.
The authors declare that the research was conducted in the absence of any commercial or financial relationships that could be construed as a potential conflict of interest.
All claims expressed in this article are solely those of the authors and do not necessarily represent those of their affiliated organizations, or those of the publisher, the editors and the reviewers. Any product that may be evaluated in this article, or claim that may be made by its manufacturer, is not guaranteed or endorsed by the publisher.
Afzal, M. (2009). Population growth and economic development in Pakistan. Open Demogr. J. 2 (1), 1–7. doi:10.2174/1874918600902010001
Ahmed, W., Tan, Q., Shaikh, G. M., Waqas, H., Kanasro, N. A., Ali, S., et al. (2020). Assessing and prioritizing the climate change policy objectives for sustainable development in Pakistan. Symmetry 12 (8), 1203. doi:10.3390/sym12081203
Ajmi, A. N., Hammoudeh, S., Nguyen, D. K., and Sato, J. R. (2015). On the relationships between CO2 emissions, energy consumption and income: The importance of time variation. Energy Econ. 49, 629–638. doi:10.1016/j.eneco.2015.02.007
Akram, N., and Hamid, A. (2015). Climate change: A threat to the economic growth of Pakistan. Prog. Dev. Stud. 15 (1), 73–86. doi:10.1177/1464993414546976
Ali, S., Ali, A., and Amin, A. (2013). The impact of population growth on economic development in Pakistan. Middle-East J. Sci. Res. 18 (4), 483–491.
Ali, S. (2012). Climate change and economic growth in a rain-fed economy: How much does rainfall variability cost Ethiopia? Available at SSRN 2018233. Available at SSRN: http://ssrn.com/abstract=2018233.
Anwar, A., Younis, M., and Ullah, I. (2020). Impact of urbanization and economic growth on CO2 emission: A case of far east asian countries. Int. J. Environ. Res. Public Health 17 (7), 2531. doi:10.3390/ijerph17072531
Asif, K. (2013). Factors effecting unemployment: A cross country analysis. Int. J. Acad. Res. Bus. Soc. Sci. 3 (1), 219.
Azomahou, T., Laisney, F., and Van, P. N. (2006). Economic development and CO2 emissions: A nonparametric panel approach. J. Public Econ. 90 (6-7), 1347–1363. doi:10.1016/j.jpubeco.2005.09.005
Baig, I. A., Chandio, A. A., Ozturk, I., Kumar, P., Khan, Z. A., and Salam, M. (2022). Assessing the long-and short-run asymmetrical effects of climate change on rice production: Empirical evidence from India. Environ. Sci. Pollut. Res. 29, 34209–34230. doi:10.1007/s11356-021-18014-z
Berger, L., Emmerling, J., and Tavonig, M. (2017). Managing catastrophic climate risks under model uncertainty aversion. Manag. Sci. 63 (3), 749–765.
Berlemann, M., and Wenzel, D. (2018). Hurricanes, economic growth and transmission channels: Empirical evidence for countries on differing levels of development. World Dev. 105, 231–247. doi:10.1016/j.worlddev.2017.12.020
Boone, C. G. (2008). Environmental justice as process and new avenues for research. Environ. Justice 1 (3), 149–154. doi:10.1089/env.2008.0530
Brown, R. L., Durbin, J., and Evans, J. M. (1975). Techniques for testing the constancy of regression relationships over time. J. R. Stat. Soc. Ser. B Methodol. 37 (2), 149–163. doi:10.1111/j.2517-6161.1975.tb01532.x
Burke, M., Dykema, J., Lobell, D. B., Miguel, E., and Satyanath, S. (2015). Incorporating climate uncertainty into estimates of climate change impacts. Rev. Econ. Statistics 97 (2), 461–471. doi:10.1162/rest_a_00478
Catrinescu, N., Leon-Ledesma, M., Piracha, M., and Quillin, B. (2009). Remittances, institutions, and economic growth. World Dev. 37 (1), 81–92. doi:10.1016/j.worlddev.2008.02.004
Celikkol Erbas, B., and Guven Solakoglu, E. (2017). In the presence of climate change, the use of fertilizers and the effect of income on agricultural emissions. Sustainability 9 (11), 1989. doi:10.3390/su9111989
Chaudhary, A., Carrasco, L. R., and Kastner, T. (2017). Linking national wood consumption with global biodiversity and ecosystem service losses. Sci. Total Environ. 586, 985–994.
Cho, S. H., Bowker, J. M., and Park, W. M. (2006). Measuring the contribution of water and green space amenities to housing values: An application and comparison of spatially weighted hedonic models. J. Agric. Resour. Econ., 485–507.
Colacito, R., Hoffmann, B., and Phan, T. (2018). Temperature and growth: A panel analysis of the United States. J. Money, Credit, Bank. 51, 313–368. doi:10.1111/jmcb.12574(2-3)
Dasgupta, S., Laplante, B., Meisner, C., Wheeler, D., and Yan, J. (2009). The impact of sea level rise on developing countries: A comparative analysis. Clim. change 93 (3), 379–388. doi:10.1007/s10584-008-9499-5
Dell, M., Jones, B. F., and Olken, B. A. (2008). Climate change and economic growth: Evidence from the last half century (No. w14132). Cambridge: National Bureau of Economic Research.
Dell, M., Jones, B. F., and Olken, B. A. (2012). Temperature shocks and economic growth: Evidence from the last half century. Am. Econ. J. Macroecon. 4 (3), 66–95. doi:10.1257/mac.4.3.66
Dickey, D. A., and Fuller, W. A. (1979). Distribution of the estimators for autoregressive time series with a unit root. J. Am. Stat. Assoc. 74 (366), 427–431. doi:10.2307/2286348
Dogan, E., and Aslan, A. (2017). Exploring the relationship among CO2 emissions, real GDP, energy consumption and tourism in the EU and candidate countries: Evidence from panel models robust to heterogeneity and cross-sectional dependence. Renew. Sustain. Energy Rev. 77, 239–245. doi:10.1016/j.rser.2017.03.111
Ejuvbekpokpo, S. A. (2014). Impact of carbon emissions on economic growth in Nigeria. Asian J. Basic Appl. Sci. 1 (1), 15–25.
Fankhauser, S., and Tol, R. S. (2005). On climate change and economic growth. Resour. Energy Econ. 27 (1), 1–17. doi:10.1016/j.reseneeco.2004.03.003
Gallup, J. L., Sachs, J. D., and Mellinger, A. D. (1999). Geography and economic development. Int. regional Sci. Rev. 22 (2), 179–232. doi:10.1177/016001799761012334
Gemenne, F., Barnett, J., Adger, W. N., and Dabelko, G. D. (2014). Climate and security: Evidence, emerging risks, and a new agenda. Clim. Change 123 (1), 1–9. doi:10.1007/s10584-014-1074-7
Ghosh, A., and Phillips, S. (1998). Warning: Inflation may be harmful to your growth. Staff Pap. Int. Monet. Fund. 45 (4), 672–710. doi:10.2307/3867589
Ghosh, S. (2010). Examining carbon emissions economic growth nexus for India: A multivariate cointegration approach. Energy Policy 38 (6), 3008–3014. doi:10.1016/j.enpol.2010.01.040
Glytsos, N. P. (2002). Dynamic effects of migrant remittances on growth: An econometric model with an application to mediterranean countries, 74. Athens, Greece: Centre of Planning and Economic Research.
GoP (2021). Economics survey 2020–21. Available at http://www.finance.gov.pk/survey/chapter_20/PES_2020_21.pdf.
Graue, E. (1930). The relationship of business activity to agriculture. J. Political Econ. 38 (4), 472–478. doi:10.1086/254124
Hirabayashi, Y., Mahendran, R., Koirala, S., Konoshima, L., Yamazaki, D., Watanabe, S., et al. (2013). Global flood risk under climate change. Nat. Clim. Chang. 3 (9), 816–821. doi:10.1038/nclimate1911
Hussain, S., and Malik, S. (2011). Inflation and economic growth: Evidence from Pakistan. Int. J. Econ. Finance 3 (5), 262–276. doi:10.5539/ijef.v3n5p262
IPCC (2007a). Climate change 2007 the physical science basis. The intergovernmental panel on climate change. Cambridge, UK: Cambridge University Press.(Intergovernmental panel on climate change).
Johnson, N. D., and Koyama, M. (2017). States and economic growth: Capacity and constraints. Explor. Econ. Hist. 64, 1–20. doi:10.1016/j.eeh.2016.11.002
Kalkuhl, M., and Wenz, L. (2020). The impact of climate conditions on economic production. Evidence from a global panel of regions. J. Environ. Econ. Manag. 103, 102360. doi:10.1016/j.jeem.2020.102360
Kandil, M., and Mirzaie, A. (2002). Exchange rate fluctuations and disaggregated economic activity in the US: Theory and evidence. J. Int. Money Finance 21 (1), 1–31. doi:10.1016/s0261-5606(01)00016-x
Keho, Y. (2017). The impact of trade openness on economic growth: The case of Cote d’Ivoire. Cogent Econ. Finance 5 (1), 1332820. doi:10.1080/23322039.2017.1332820
Khan, M. A., Tahir, A., Khurshid, N., Husnain, M. I. U., Ahmed, M., and Boughanmi, H. (2020). Economic effects of climate change-induced loss of agricultural production by 2050: A case study of Pakistan. Sustainability 12 (3), 1216. doi:10.3390/su12031216
Kurramovich, K. K., Abro, A. A., Vaseer, A. I., Khan, S. U., Ali, S. R., and Murshed, M. (2022). Roadmap for carbon neutrality: The mediating role of clean energy development-related investments. Environ. Sci. Pollut. Res. 29 (23), 34055–34074. doi:10.1007/s11356-021-17985-3
Lee, M., Villaruel, M. L., and Gaspar, R. E. (2016). Effects of temperature shocks on economic growth and welfare in Asia, 501. Philippines:Asian Development Bank Economics Working Paper Series.
Lewis, W. A. (1972). “Reflections on unlimited labor,” in International economics and development (Academic Press), 75–96.
Leyaro, V. (2015). Threshold and interaction effects in the trade, growth, and inequality relationship (No. 2015/009). Finland: WIDER Working Paper.
Liu, L. (2022). The dynamics of early-stage transmission of COVID-19: A novel quantification of the role of global temperature. Gondwana Research. doi:10.1016/j.gr.2021.12.0102022
Liu, L., and Wang, Q. (2022). Is the effect of human activity on air pollution linear or nonlinear? Evidence from wuhan, China, under the COVID-19 lockdown. Cities 127, 103752. doi:10.1016/j.cities.2022.103752
Lucas, R. E. (2005). International migration to the high-income countries: Some consequences for economic development in the sending countries. Confronting Globalization. The Hague: Kluwer, 157–190.
Ma, Q., Murshed, M., and Khan, Z. (2021). The nexuses between energy investments, technological innovations, emission taxes, and carbon emissions in China. Energy Policy 155, 112345. doi:10.1016/j.enpol.2021.112345
Mendelsohn, R., Dinar, A., and Williams, L. (2006). The distributional impact of climate change on rich and poor countries. Environ. Dev. Econ. 11 (2), 159–178. doi:10.1017/s1355770x05002755
Mim, S. B., and Ali, M. S. B. (2012). Through which channels can remittances spur economic growth in MENA countries? Economics 6 (1). doi:10.5018/economics-ejournal.ja.2012-33
Munawar, S., and Baig, M. A. (2019). Impact of remittance on economic growth of Pakistan. Rev. Manag. Sci. 1 (1), 27–46.
Murshed, M., Apergis, N., Alam, M. S., Khan, U., and Mahmud, S. (2022). The impacts of renewable energy, financial inclusivity, globalization, economic growth, and urbanization on carbon productivity: Evidence from net moderation and mediation effects of energy efficiency gains. Renew. Energy 196, 824–838. doi:10.1016/j.renene.2022.07.012
Naeem, U. A., Hashmi, H. N., Shamim, M. A., and Ejaz, N. (2012). Flow variation in Astore river under assumed glaciated extents due to climate change. Pak. J. Eng. Appl. Sci.
National Oceanic & Atmospheric Administration (NOAA). (2017). CarbonTracker CT2015. Available at https://www.esrl.noaa.gov/gmd/ccgg/carbontracker/CT2015/.
Niamir, L., Ivanova, O., and Filatova, T. (2020). Economy-wide impacts of behavioral climate change mitigation: Linking agent-based and computable general equilibrium models. Environ. Model. Softw. 134, 104839. doi:10.1016/j.envsoft.2020.104839
Nordhaus, W. D. (1991). The cost of slowing climate change: A survey. Energy J. 12 (1). doi:10.5547/issn0195-6574-ej-vol12-no1-4
Osili, U. O. (2004). Migrants and housing investments: Theory and evidence from Nigeria. Econ. Dev. Cult. change 52 (4), 821–849. doi:10.1086/420903
IPCC (2007b). “(Intergovernmental panel on climate change). Climate change 2007: Synthesis report,” in Contribution of working groups I, II and III to the fourth assessment report of the intergovernmental panel on climate change. Editors R. K. Pachauri, and A. Reisinger (Switzerland: IPCC Geneva), 446.
Pearce, D., Cline, W., Achanta, A., Fankhauser, S., Pachauri, R., Tol, R., et al. (1996). “The social cost of climate change: Greenhouse damage and the benefits of control,” in Climate change 1995: Economic and social dimensions of climate change. Intergovernmental panel on climate change (Cambridge, UK: Cambridge University Press).
Pesaran, M. H., Shin, Y., and Smith, R. J. (2001). Bounds testing approaches to the analysis of level relationships. J. Appl. Econ. Chichester. Engl. 16 (3), 289–326. doi:10.1002/jae.616
Pindyck, R. S. (2011). Fat tails, thin tails, and climate change policy. Rev. Environ. Econ. Policy 5 (2), 258–274. doi:10.1093/reep/rer005
Porter, A., and Brown, H. J. (2009). Energy consumption, economic growth and prices; A reassessment using panel vecm for developed and developing countries. Energy Policy 35, 2481–2490.
Prudhomme, C., Giuntoli, I., Robinson, E. L., Clark, D. B., Arnell, N. W., Dankers, R., et al. (2014). Hydrological droughts in the 21st century, hotspots and uncertainties from a global multimodel ensemble experiment. Proc. Natl. Acad. Sci. U. S. A. 111 (9), 3262–3267. doi:10.1073/pnas.1222473110
Ricardo, H. D. D. R. B. (2018). Forecasting tourism demand for Lisbon s region: A data mining approach. (PhD dissertation).
Sahoo, P., and Dash, R. K. (2014). India's surge in modern services exports: Empirics for policy. J. Policy Model. 36 (6), 1082–1100. doi:10.1016/j.jpolmod.2014.10.006
Salahuddin, M., and Gow, J. (2016). The effects of internet usage, financial development and trade openness on economic growth in South Africa: A time series analysis. Telematics Inf. 33 (4), 1141–1154. doi:10.1016/j.tele.2015.11.006
Schneider, U. A., and Smith, P. (2009). Energy intensities and greenhouse gas emission mitigation in global agriculture. Energy Effic. 2 (2), 195–206. doi:10.1007/s12053-008-9035-5
Shin, Y., Yu, B., and Greenwood-Nimmo, M. (2014). “Modelling asymmetric cointegration and dynamic multipliers in a nonlinear ARDL framework,” in Festschrift in honor of peter schmidt (New York, NY: Springer), 281–314.
Stock, J. H. (2020). Climate change, climate policy, and economic growth. NBER Macroecon. Annu. 34 (1), 399–419. doi:10.1086/707193
Stojanov, R., Němec, D., and Žídek, L. (2019). Evaluation of the long-term stability and impact of remittances and development aid on sustainable economic growth in developing countries. Sustainability 11 (6), 1538. doi:10.3390/su11061538
Syed, A., Raza, T., Bhatti, T. T., and Eash, N. S. (2022). Climate Impacts on the agricultural sector of Pakistan: Risks and solutions. Environ. Challenges 6, 100433. doi:10.1016/j.envc.2021.100433
Tahir, M., and Khan, I. (2014). Trade openness and economic growth in the Asian region. J. Chin. Econ. Foreign Trade Stud. 7, 136–152. doi:10.1108/jcefts-05-2014-0006
Tahir, T., Luni, T., Majeed, M. T., and Zafar, A. (2021). The impact of financial development and globalization on environmental quality: Evidence from South asian economies. Environ. Sci. Pollut. Res. 28 (7), 8088–8101. doi:10.1007/s11356-020-11198-w
Tol, R. S. (2008). Why worry about climate change? A research agenda. Environ. values 17 (4), 437–470. doi:10.3197/096327108x368485
Wade, K., and Jennings, M. (2016). The impact of climate change on the global economy. Schroders Talk. Point.
Waheed, R., Chang, D., Sarwar, S., and Chen, W. (2018). Forest, agriculture, renewable energy, and CO2 emission. J. Clean. Prod. 172, 4231–4238. doi:10.1016/j.jclepro.2017.10.287
Weiss, H., and Bradley, R. (2001). What drives societal collapse? Science 291, 609–610. doi:10.1126/science.1058775
Wong, S. A. (2007). “Productivity and trade openness: Micro-level evidence from manufacturing industries in Ecuador 1997–2003,” in APEA 2007 conference.
Woodruff, C. M., and Zenteno, R. (2001). Remittances and microenterprises in Mexico. UCSD, graduate School of international Relations and pacific studies working paper.
World Bank. (2021). World dev. Indic. Available at http://databank.worldbank.org/data/reports.2021.
Keywords: economic growth, CO2 emissions, asymmetries, NARDL, Pakistan
Citation: Khurshid N, Fiaz A, Khurshid J and Ali K (2022) Impact of climate change shocks on economic growth: A new insight from non-linear analysis. Front. Environ. Sci. 10:1039128. doi: 10.3389/fenvs.2022.1039128
Received: 07 September 2022; Accepted: 11 October 2022;
Published: 25 October 2022.
Edited by:
Guangdong Wu, Chongqing University, ChinaReviewed by:
Lu Liu, Southwestern University of Finance and Economics, ChinaCopyright © 2022 Khurshid, Fiaz, Khurshid and Ali. This is an open-access article distributed under the terms of the Creative Commons Attribution License (CC BY). The use, distribution or reproduction in other forums is permitted, provided the original author(s) and the copyright owner(s) are credited and that the original publication in this journal is cited, in accordance with accepted academic practice. No use, distribution or reproduction is permitted which does not comply with these terms.
*Correspondence: Nabila Khurshid, bmFiaWxha2h1cnNoaWRAY29tc2F0cy5lZHUucGs=
Disclaimer: All claims expressed in this article are solely those of the authors and do not necessarily represent those of their affiliated organizations, or those of the publisher, the editors and the reviewers. Any product that may be evaluated in this article or claim that may be made by its manufacturer is not guaranteed or endorsed by the publisher.
Research integrity at Frontiers
Learn more about the work of our research integrity team to safeguard the quality of each article we publish.