 Xiaoling Zhang
 Decai Tang
 Shanyou Kong3*
 Valentina Boamah
94% of researchers rate our articles as excellent or good
Learn more about the work of our research integrity team to safeguard the quality of each article we publish.
Find out more
ORIGINAL RESEARCH article
Front. Environ. Sci. , 20 October 2022
Sec. Environmental Economics and Management
Volume 10 - 2022 | https://doi.org/10.3389/fenvs.2022.1037654
Trade has contributed to economic development and has brought countries or regions of the world closer together, but it has also had a significant impact on the global environment, particularly in terms of carbon dioxide emissions. Does an increase in a country’s trade necessarily contribute to an increase in its carbon emissions? This paper examines the impact of changes in the position of major countries in the world trade network on their carbon emission levels. In terms of research methodology, this paper achieves an innovation by adopting a complex network approach to analyze the structural characteristics of the trade relationship networks of major countries or regions in the world, providing a new perspective for the study of the relationship between trade development and carbon emissions. The results of the study show that: trade relations among countries are relatively stable from 2000 to 2020, trade ties among members of regional integration organizations are increasing, the top ten countries in terms of importance are mainly developed countries, and China has very close trade relations with most countries. Based on the analysis of structural characteristics, the impact of changes in the network status of each country on its ocarbon emissions is analyzed, using indicators such as the degree centrality of each node as the independent variable and its domestic carbon emission level as the dependent variable. It is found that developed countries have a significant positive impact on in-going degree centrality, and insignificant impact on out-going degree centrality and betweenness centrality. In contrast, developing countries have a significant positive impact on out-going degree centrality and a negative impact on carbon emissions by betweenness centrality, and this conclusion tells us that not all export growth will contribute to higher levels of carbon emissions in the country. Eigenvector centrality has a negative effect on carbon emissions for both developing and developed countries, and closeness to centrality has no effect on carbon emissions while closeness centrality has no effect on carbon emissions. The results of this study again show that the influence of developed countries is greater than that of developing countries on carbon emissions; therefore, the role of developed countries can be taken into account in subsequent studies on carbon emission reduction.
In 2021, global exports will total US$22.284 trillion, up 26.3% year-on-year and 17.3% compared to 2019, the year before the epidemic. The surge in world trade shows that the world economic order is being restored, but trade development is accompanied by increasing pressure on the environment. 2021 has seen frequent episodes of severe weather around the world, with abnormally high temperatures in many places. The main cause of global warming is carbon dioxide emissions from burning fossil fuels (Quilcaille, et al., 2018). 2019 global carbon dioxide emissions are at the same level as in 2018, and for the first time in 10 years, growth stops for the first time [IEA World Energy Development Report (2020)]. In 2021, a post-epidemic economic rebound allowed global carbon emissions to largely return to the levels prior to the 2019 New Crown epidemic pandemic, reversing the temporary reduction in 2020 due to the New Crown epidemic (BP World Energy Statistics Yearbook 2022). It is, therefore, necessary to study the relationship between trade and carbon emissions. Studies have shown that there is an inverted “U” shaped relationship between trade liberalization and environmental regulation (Duan, et al., 2022), and that there is a causal relationship between trade volumes and carbon emissions (Sinha and Sen, 2016). The positive link between international trade and carbon emissions is facilitated by technology so free trade agreements are beneficial for carbon emissions in high-income countries (Yao, et al., 2019), and trade development is beneficial for carbon performance in developing countries (Li, et al., 2022). There are many studies on trade and carbon emissions, but most of them are based on the relationship between trade volume and carbon emissions, while no research has been found on the relationship between the trade status of each country and carbon emissions, and this study fills this gap. This paper adopts a social network approach, incorporating the entire world trade network into a network system, and studies the position of the world’s major countries in the trade network and the network’s status. This paper uses a social network approach to study the position of the world’s major countries in the trading network and the impact of changes in network position on their carbon emissions.
The trading system is complex and consists of interactions between countries or regions. Changes in the politics and economics of each country or region within this system affect themselves and have knock-on effects on countries or regions outside its country or region. This makes the trading system a complex system that requires new research tools to analyze trade as a system (Serrano and Boguna, 2003).
Complex networks as a complex network analysis tool and complexity theory provide a research paradigm for international trade research. The application of the complex networks approach to the study of international trade reveals the mechanisms of international trade formation and evolutionary patterns from a global perspective. It explains the patterns of interactions in trade between countries (regions) and their impact on the structure and function of the system. (Lee, et al., 2013; He and Deem, 2010).
The use of complex networks in the trading system academic research many (Amador and Cabral, 2017; Garcia-Perez et al., 2016; Ge, et al., 2016; Hatfield, et al., 2018) for the study of international trade networks. Starting from the unweighted network, ignoring the impact of trade direction, and the amount on the relationship between the two, only consider the existence of import and export relationships between trading countries or regions from the perspective of the number of relationships to analyze the topological nature of the global trade network, and the position of each economy in the trade network (WANG, et al., 2009).
Subsequently, the study of directed networks and weighted directed networks began (Zhou, et al., 2020; Hou, et al., 2018). At that time, the choice of weights was also various methods commonly used in trade flow networks based on export volumes, but also based on import and export volumes to calculate and obtain the trade competition index or complementarity index, establish a competitive or complementary network (Wang, et al., 2022, Zhou, et al., 2022; Yu and Niu, 2022), and analyze the competitive position of each economy and its complementary position with other countries. This allows the analysis of economic linkages between economies and the prediction of trade possibilities. Nowadays, complex networks have been widely used as a research method for studying various trade networks. However, most are limited to studies of the characteristics of trade networks and simply differ in the methods used to build them.
Environmental changes have prompted scholars to focus on carbon emissions, and many studies on carbon emissions have been conducted (Adebayo, et al., 2022; Shah, et al., 2022; Liu, et al., 2022; Tang, et al., 2022). Through numerous studies, it has been found that there is a consistency between economic growth rates and carbon emission growth rates (Zhao B et al., 2022), with urbanization and urban sprawl driving an increase in transportation, construction, and industrial spending, thus contributing to an increase in carbon emissions (Cheng and Hu, 2022; Yan, et al., 2022).
Research on carbon emission transfer networks generated employing commodity distribution found that due to advanced technology and relatively reasonable industrial structure, economically developed regions are capable of accomplishing the expected carbon emission reduction, while economically relatively backward regions are not (Zhao X et al., 2022). Still, emission reduction achieved in this way tends to cause developed regions to transfer high-emission industries to backward regions, thus increasing the carbon emission reduction pressure on backward regions, which is not conducive to overall carbon emissions reduction.
To reduce overall carbon emissions, scholars have found that by increasing investment in clean energy (Shi, et al., 2022), increasing the proportion of clean energy use, improving production technology, upgrading industrial structure, adopting integrated power generation (Zhang, et al., 2022) and enhancing carbon emission efficiency and energy intensity (Xiang, et al., 2022; Zhang, et al., 2022), the goal of carbon emission reduction can truly be achieved, thus contributing to the sustainable development of the environment (Gao, et al., 2021). There are also many studies on carbon emissions but many examine the factors influencing carbon emissions and their performance from the perspective of industry heterogeneity or regional heterogeneity.
The relationship between trade and carbon emissions has been a popular topic of academic research, with some scholars arguing that increased exports must increase energy consumption and that there is a causal relationship between trade volumes and carbon emissions (Sinha and Sen, 2016; Khan, et al., 2022; Aller, et al., 2015).
However, Nasir, et al. (2021), (Adebayo et al., 2021; Shahbaz, et al., 2013), through a study on the relationship between trade openness and carbon emissions in Australia, Indonesia, and Argentina, found that trade openness would have a positive impact on carbon dioxide emissions as a whole in the long run, as trade openness allows developing economies to gain technological advances that are conducive to improving the efficiency of carbon emissions.
Therefore, some scholars suggest that the development of FTAs is conducive to environmental improvement in high-income countries because high-income countries reduce their carbon emission levels by improving technology or shifting high-polluting industries, while the environmental standards of low- and middle-income countries are relatively lax. Their environmental systems are less rigorous than those of high-income countries, leading to the development of FTAs being detrimental to their environmental improvement (Yao, et al., 2019; Acheampong, et al., 2019; Hung, et al., 2022).
Synthesizing scholars’ research on trade, trade networks, and carbon emissions, we find that there are many studies on the three. However, most of the studies on trade networks are based on various methods to build networks and carry out analysis of network characteristics, while most of the studies on carbon emissions also focus on influencing factors and carbon emission efficiency. This paper fills a gap in the research on the association between trade networks and carbon emissions using complex networks and econometric methods. This paper takes the status indicator of each country node in the world trade network as the independent variable and the level of carbon emissions of each country as the dependent variable to study the impact of the evolution of each country’s status in the trade network on its domestic carbon emissions level. The greatest innovation of this paper is to take global trade as a system and systematically analyze the impact of the change in each country’s network status on its domestic carbon emissions from the perspective of the network.
The trade data in this paper is based on carbon dioxide emissions data from the WIOD environmental accounts database, which is recorded as of 2016. This paper takes the WIOD environmental account countries as the main basis to ensure the consistency of the two databases and correctly measure the node indicators in the trade network. It adds Singapore and other countries and finally obtains trade data from UN comtrade for 51 countries and regions from 2000–2016 trade data, 51 countries or regions with others between the trade network, all under the ZOW, so the final trade network has 52 countries or regions nodes.
As these 52 countries or regions are the world’s major countries or regions, their economic development is relatively developed compared to other countries, and trade contacts are close; building a trade network based on this will be a near fully linked network.
In this paper, 52 countries or regions between the trade volume were utilized to construct the weight relationship matrix:
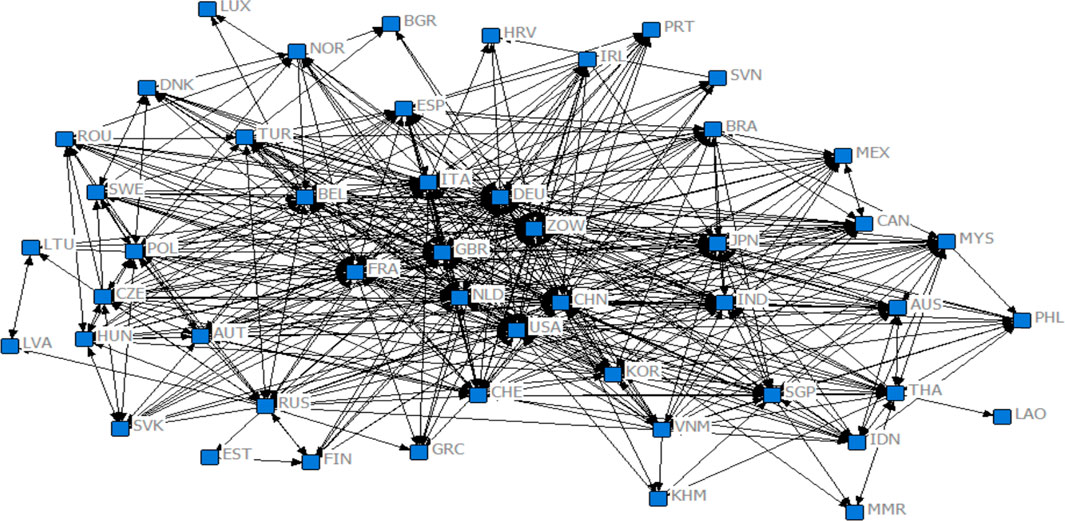
FIGURE 1. Global trade network (2020).
In social network analysis, there are many indicators to analyze the topological nature of the network, but this paper focuses on the closeness of the links between nodes in a trade network. Therefore, network density is chosen to analyze the closeness of the links between nodes as a whole, while modularity analysis analyzes the closeness of the links between nodes from a partition perspective.
Network density is a key measure of the closeness of nodes in a social network, expressed as the ratio of the actual number of links in the network to the number of links that should theoretically exist, and is generally measured using a binary adjacency matrix. The higher the network density, the closer the links between the nodes in the network, the smoother the exchange of information, and the more active the network as a whole (Hua, et al., 2022).
Newman (2006) states that a complex social network is mostly composed of several or more intra-group clusters or communities, each with common characteristics and attributes among the nodes, and the communities are connected by a few nodes (Wasserman and Faust, 1994). When the density within a community is higher than the density of the network, the nodes within the module are generally considered to be more closely connected (Liu, 2014).
The indicators of node status in social networks mainly include node centrality indicators and influence indicators, where node centrality includes degree centrality, mediator centrality, proximity centrality and eigenvector centrality. The original data in this paper are time-series data. The authors obtained the above centrality indicators by calculation and then standardized them to facilitate the analysis of changes in indicators for the same country over different periods.
(1) Degree and Degree Centrality (DC) analysis includes the degree analysis of unweighted and weighted networks. In a trade network, the degree of an unweighted network is the number of countries or regions with which a country or region trades, and the degree of a weighted network is the total exports of a country or region, which is used to indicate the importance of the nodes in the trade network. In this paper, the export value of the country or region is used as the weight to build the weighted trade network, therefore, the degree of this paper is the degree of the weighted network, and its calculation formula is as follows. (Liu, 2014):
Where:
Where the equation represents the degree of exit for country
(2) Betweenness Centrality (BC) was first proposed by the American sociologist Linton C. Freeman (Freeman, 2004). Nodal betweenness centrality refers to the percentage of the minimum value of the number of paths at a node. It is used to analyze the relationship between world trade networks (Wang, et al., 2012), expressed as follows:
In the above equation
(3) Proximity Centrality, also known as Closeness Centrality (CC), refers to the degree to which a node is close to the center. The higher the proximity centrality, the closer the node is to the center of the network and the shorter the distance from other nodes in the network (Zhang and Luo, 2017). The importance of the node from a location perspective. Its calculation formula is expressed as:
where
(4) Eigenvector Centrality (EC), which is the idea that the environment in which a node is located also reflects the importance of the node, and the importance of the node is underlined by the importance of its direct neighbors; the more important nodes are connected, the more important the node is, and the higher its eigenvector centrality is. From the perspective of propagation, eigenvector centrality is generally used to reflect the long-term influence of a node. In this paper, the higher the eigenvector centrality of a node, the more important its trading partner nodes are, and in the long run, the node’s trade capacity will continue to grow. Thus its position in the trade network will also continue to grow.
(5) The influence index indicates the strength of the contribution made by the node to the network structure. The KATZ (Katz, 1953) influence model judges the influence of each node in the network by the direct or indirect relationships it acquires. Each node in a trade network has a different choice of direct or indirect trade relationships. The more trade partners there are and the closer the relationship with the partner, the more trade resources the node will provide or acquire to other nodes and the greater its influence, and vice versa.
The influence indicators commonly used in social network analysis are the KATZ influence indicator and Huber influence indicator, and the results of both analyses are almost identical. In this paper, the KATZ influence index is chosen to analyze the influence of each node in the trade network, and the expression formula for KATZ influence analysis is
Where a represents the ‘attenuation factor’, which represents the effect between countries, and is a number between 0 and 1, with 0 representing complete attenuation and 1 representing no attenuation. In practice,
Network density is the ratio of the true number of connected edges between nodes to the theoretical maximum number of connected edges in a complex social network. It indicates how closely linked the nodes are to each other within the network. Therefore, when there are more links between nodes within a network, the denser the network is and the higher its density. Conversely, a lower network density indicates that the links between the nodes of that network are not strong, and the relationships between the nodes are not intimate.
Through Figure 2, it is easy to find that the network density after the threshold truncation of the 2000 average is not high, the lowest is in 2001, only 0.1333, and the highest is only 0.3086 (2008 network density). That is, the actual number of links between nodes is only 30% of the maximum number of theoretical links, indicating that from 2000 to 2020, most of the countries or regions between trade were lower than the average international trade volume in 2000. Only 13%–30.86% of the trade volume between countries or regions is higher than the average international trade volume in 2000.
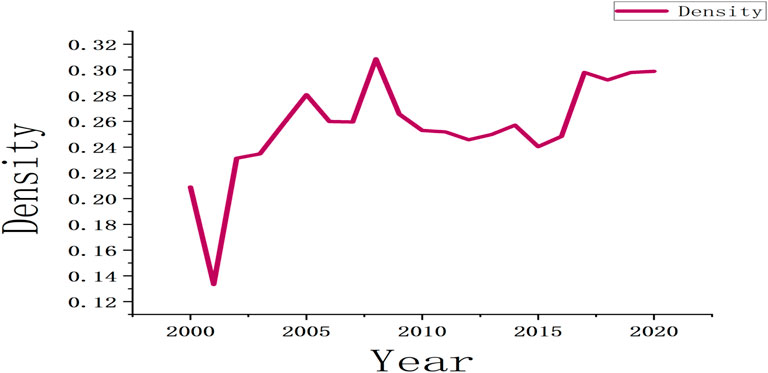
FIGURE 2. Density of world trade network from 2000 to 2020.
Block model analysis is an analysis method based on internal and external relationships. It is generally believed that the greater the density of modules, the closer the relationships within (between) modules, and the smaller the number of modules, the closer the network relationships (Moyer, et al., 2015). The number of modules in the world trade network is very stable, except for 2001, which is 7 modules. All other years are 8 modules, which indicates that from 2000–2020, the trade relations among countries or regions in the world trade network are relatively stable.
At the same time, there are obvious regional characteristics in the division of modules. Members of the same regional economic organization are more likely to be divided into one module; for example, module 1 in 2000, module 4 in 2014, and module 1 in 2020 are dominated by ASEAN member countries, and modules 6 and 7 in 2020 are dominated by Western European countries, and the members of modules 6, 7, and 8 in 2000 are all European countries.
Continuing the analysis of module densities from 2000–2020, it was found that the smallest module densities for each year were 0, indicating that trade relations between the various member countries within these modules are very fragile. In contrast, the maximum density of modules in the world trade network was 1 several times yearly (see Table 1). Except for the 5 years 2000, 2012, 2018, 2019, and 2020, the module members with the highest density in all other years contain countries such as Japan, the United States, China, and South Korea.
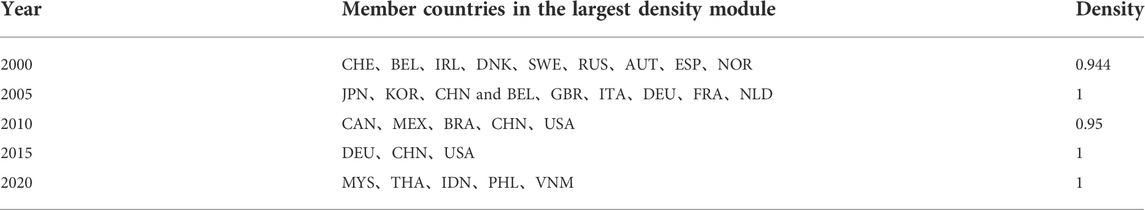
TABLE 1. Analysis of the largest modules of the world trade network density.
Through the maximum module density analysis, we also find an interesting phenomenon that the closeness between ASEAN countries is increasing. The intra-module density, dominated by ASEAN countries, was only 0.429 in 2000, increasing to 0.655 by 2010 and 1 in 2020, indicating increasing trade and closer relations between member countries within ASEAN.
The object of this paper is a trade network, and trade is directional. The import of one country is also the export of another country, so the analysis of degree centrality in this paper is divided into “in-degree centrality” and “out-degree centrality” (Abbreviated as IDC and ODC, respectively). Therefore, the degree of centrality is directly related to the import and export capacity of the country. The degree centrality analysis shows that the top 10 countries in terms of outbound and inbound centrality from 2000 to 2020 are mainly developed countries, including Germany, the United States, the United Kingdom, France, Japan, the Netherlands, etc. China is also in the top 10, with South Korea, Singapore, and Russia added in some years. (See Table 2. For reasons of space, detailed analysis data cannot be shown and can be requested from the author upon request).
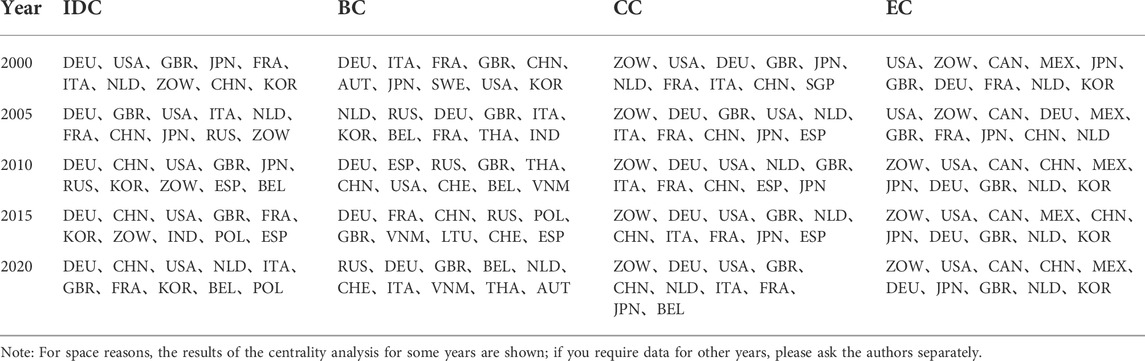
TABLE 2. Ranking of the centrality of trade network nodes in 2000, 2005, 2010, 2015, and 2020 (excerpt of top 10 nodes).
The analysis of degree centrality reveals that in several years, such as 2000–2003 and 2013, the gap between the country with the highest degree centrality and the country ranked 10th is very large; for example, Germany, the highest ranked country in terms of in-degree centrality in 2000, was 1. (In order to facilitate the comparison of each centrality indicator in different years, the centrality indicator is standardized for each year in this paperand the top-ranked centrality after standardisation is 1) however, Singapore, which ranked 10th, had an entry centrality of only 0.3667. While the United States, which had the highest out-degree centrality, and Sweden, which ranked 10th, had only 0.406. Thus, there was a huge gap between the trade volumes of the world’s major trading countries in 2000. However, with the frequent trade between countries in the world and the development of regional integration organizations, the trade volume between countries or regions has continued to climb, which is reflected in the increasing centrality of out-degree and in-degree. The gap between countries or regions and the top-ranking countries has been narrowing, with Belgium in 10th place reaching 0.55 inbound centrality in 2020, and Russia’s outbound centrality also having 0.425, a significant reduction in the gap compared to 2000.
Betweenness centrality reflects the mediating role of nodes, which in this paper refers to countries with direct trade relations with two nodes that do not have trade relations of their own. Their influence serves as a bridge between the two trading partners. The analysis of the centrality of the mediating nodes shows that Germany still ranks first many times, with a standardized centrality of 1 (see Table 2), while the gap between the second-ranked countries and Germany is large, with the largest gap being in 2009 when the second-ranked United Kingdom had a centrality of only 0.532. The top countries in terms of centrality are not all developed countries.
The closeness center is a metric that indicates how close a node is to the center of the network. The higher the value, the more central the node is to the network, and the shorter the distance between the node and the other nodes, the faster the speed of information transfer. Analyzing the proximity centrality yearly, it is found that the proximity centrality of each node is very close to each other each year, decreasing very slowly from high to low. The top 10 countries are still dominated by developed countries (see Table 2). Still, they are not limited to developed countries, for example, Lithuania, Thailand, Vietnam, India, South Korea, and Russia, which shows that non-developed countries are gradually moving into the center of the world trade network through their continuous participation in trade.
The indicator of the neighbour node’s importance to contrast the node’s importance is the eigenvector centrality. The eigenvector centrality in this paper reflects the future trend of the nodes importance. The higher the eigenvector centrality is, the more important the nodes connected to all the countries in the trade network are; that is to say, the trading partners of this node country are all in the global trade. The strong import and export capacity of these countries is bound to drive the development of the country’s trade, thus improving its status in the trade network. The eigenvector centrality reveals that the top 10 countries are still dominated by developed countries though, indicating that global trade is dominated by trade between developed countries.
In the whole network, each node’s external and received relationship selection differ. If a node receives and sends very few relationships, the node is lonely, and its influence is small. The KATZ influence not only considers the relationship that the node directly receives and sends but also considers the influence of its indirect relationship. Therefore, the KATZ influence index shows the node’s importance from the perspective of the direct or indirect relationship that the node sends and receives.
In the global trade network from 2000 to 2020, the countries with the highest influence on KATZ are still mainly developed countries, and the gap is very large. The U.S. influence index is much higher than other countries. For example, in 2020, the U.S. KATZ’s influence was 0.844, ranking second, but in Germany, the third-ranked influence was only 0.43. Therefore, the United States has an absolute advantage, and its influence is far higher than that of the top 10 countries, such as Germany, France, China, and Canada. Except for China, all the top 10 countries are developed countries. Amongst the top 15 countries are South Korea (South Korea was recognized as a developed country in 2021), India, Russia, and other countries.
The block model theory suggests that if a module’s internal (external) density is higher than the density of the network in which it is located, it is assumed that the module is closely linked internally (externally). At the same time, the density with other modules is, in most cases, higher than the network density in that year (see Table 3) (network density between 0.1333 and 0.3086 for 2000–2020). It can be assumed that China is in a module that is not only very closely connected internally but also very closely connected with external modules. This is because, as China’s economy develops and becomes more open, it trades more closely with outside countries or regions.
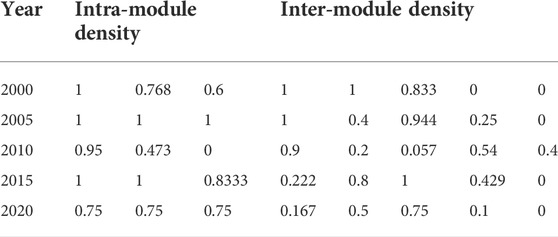
TABLE 3. Module-related densities in China.
By analyzing the centrality and KATZ influence of China’s nodes from 2000 to 2020 (see Figure 3), it is found that: China’s degree centrality and meso-centrality were highest in 2006, and the degree centrality was higher than 0.5 in all years except 2000 (2000 annual centrality of 0.4237). From 2006 onwards, the degree centrality shows a fluctuating increase, indicating that China’s external trade ties are getting closer, closely related to China’s increasingly open policy. The proximity centrality is between 0.474 (2008 CC) and 0.827 (2018 CC), indicating that China is moving closer to the center of the network in the world trade network. The median centrality fluctuates considerably, with only 7 years between 2000 and 2020, a between centrality above 0.5, and most years with a median centrality below 0.5. This indicates that China’s role as a “trade bridge” between the two countries is not strong. That is, when trade is generated between China and two countries or regions that do not have direct trade relations at the same time, China’s ability to act as a medium for information transfer between the two is not strong. The low centrality of China’s eigenvector from 2000 to 2020 (see Figure 3), which is an indicator of the importance of a node by the importance of its neighbors, is mainly due to the importance China attaches to its trade relations with neighboring countries and developing countries, which have a low status in the trade network. However, the influence of KATZ is as low as the centrality of the eigenvector. Although the results of the Katz influence calculation are as low as the eigenvector centrality, China’s Katz influence ranking is not low in the annual trade network. In some years is second only to the US or Germany (see Table 4), mainly because the influence of the US is much higher than that of other countries in the world, resulting in low analysis results for other countries’ KATZ influence.
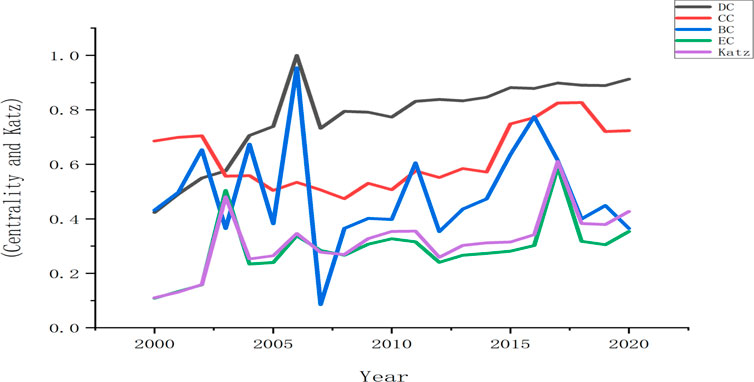
FIGURE 3. China node centality and influence from 2000 to 2020.
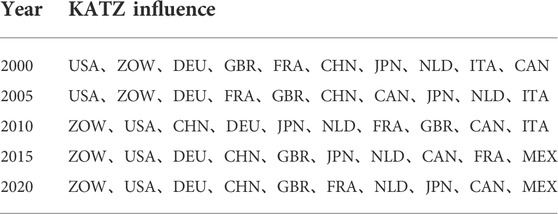
TABLE 4. 2000, 2005, 2010, 2015, and 2020 KATZ influence.
The development of a country’s trade impacts its position in the global trade network and its level of carbon emissions. Therefore, the authors of this paper argue that a country’s or region’s position in the trade network also impacts its level of carbon emissions. Based on this, the following hypotheses are proposed.
Hypothesis 1. In-degree centrality in developed countries positively affect carbon emissions, and out-degree centrality in developing countries significantly affect carbon emissions.In a global trade network, degree centrality includes in-degree centrality and out-degree centrality. In-degree centrality is determined by the node’s imports, while out-degree centrality is determined by exports. Therefore, a higher in-degree centrality of the node means that the country or region imports more into the network. The more imports, the greater the domestic consumption and the higher the level of carbon emissions. In contrast, developing countries import mainly technology-intensive products, and the more they import, the better their technological level will be, and their carbon emission efficiency will be improved (Jin, et al., 2014). The node with higher centrality of export degree indicates that the country or region exports more. Developed countries export more technology-intensive products, and their carbon emission efficiency is higher than the labor-intensive products exported by developing countries, so the increase in developed countries’ export has no significant impact on their carbon emission level, but the increase in developing countries’ export and their domestic resource depletion will have a positive impact on carbon emission.
Hypothesis 2. Betweenness centrality in developing countries negatively impacts carbon emissions.The nodes with higher betweenness centrality have a greater ability to control information as a “bridge,” which allows them to access the information of neighboring nodes more easily and helps them to improve their technology and commodity structure, and increases the efficiency of their carbon emissions (Salman, et al., 2019). Therefore, we believe that nodes in developing countries with a higher level of betweenness centrality do not have a positive impact on carbon emissions. In contrast, nodes in developed countries with a high level of technology do not significantly impact carbon emissions.
Hypothesis 3. Closeness centrality can negatively impact carbon emissions.Closeness centrality reflects how close a node is to the center of the network. The closer a node is to the center of the network, the more important it is. Therefore, countries or regions with high closeness centrality are more important in the trading network, and it can be tentatively assumed that closeness centrality negatively impacts carbon emissions.
Hypothesis 4. Eigenvector centrality negatively impacts carbon emissions.A node with higher eigenvector centrality indicates that its neighboring nodes are more important. From a development perspective, this node will move towards being an important node. Therefore, we tentatively believe that the higher the eigenvector centrality, the more important the node’s country or region tends to be in the trade network, and the lower its domestic carbon emission level.
Hypothesis 5. KATZ influence can negatively impact carbon emissions.KATZ influence reflects the node’s ability to influence other nodes within the network and the characteristics of the network. The higher the Katz influence, the greater the influence of the node in the trade network. The influence of a country or region in the trade network is closely related to the level of economic development of the country; from this perspective, we tentatively assume that Katz’s influence can negatively impact carbon emissions.
This paper focuses on analyzing the relationship between each country’s position in the world trade network and its carbon emissions. Therefore, in the empirical part, common indicators of the position of the network nodes: in-degree centrality, out-degree centrality, median centrality, proximity centrality, eigenvector centrality, and KATZ influence are chosen as explanatory variables, and carbon emissions are used as the response variable to build the following model:
where
In this study, panel models were constructed using degree, in-degree, out-degree, closeness centrality, betweenness centrality, eigenvector centrality, and KATZ as the explanatory variables and carbon emissions as the response variable from globally developed and developing countries, respectively. The panel model involves three models: mixed POOL model, fixed effects FE model, and random effects RE model. The model is first tested to facilitate the identification of the optimal model.
An F-test was conducted to compare the choice of FE and POOL models. The results implied that the FE model was superior to the POOL model at the 5% significance level. Continuing with the BP test to determine the choice of the RE model or the POOL model, the results showed that the RE model is superior relative to the POOL model at the 5% significance level. Finally, for the choice of the FE model versus the RE model, we used the Hausman test, and the final result showed no significance. Therefore, the RE model was chosen for all three models (see Table 5).
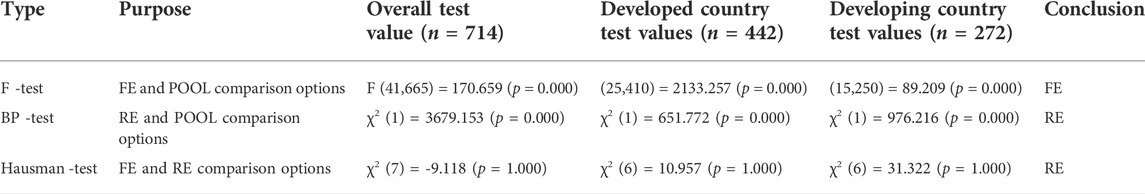
TABLE 5. Panel model test results.
This study uses the RE model as the final result, as seen in Table 6: the centrality of entry shows the intensity of imports from other country nodes in the network. The analysis results show that, from the overall analysis, country node entry centrality has a significant positive effect on national carbon emissions; i.e., an increase in a country’s imports will lead to an increase in carbon emissions. The results suggest that the imports of developed countries are mostly labor-intensive and low-technology products, which are imported mainly for residential consumption or as raw materials or intermediate products for production, thus leading to an increase in carbon emissions. In contrast, the imports of developing countries are mostly technology-intensive manufactured goods, which do not significantly affect carbon emissions.
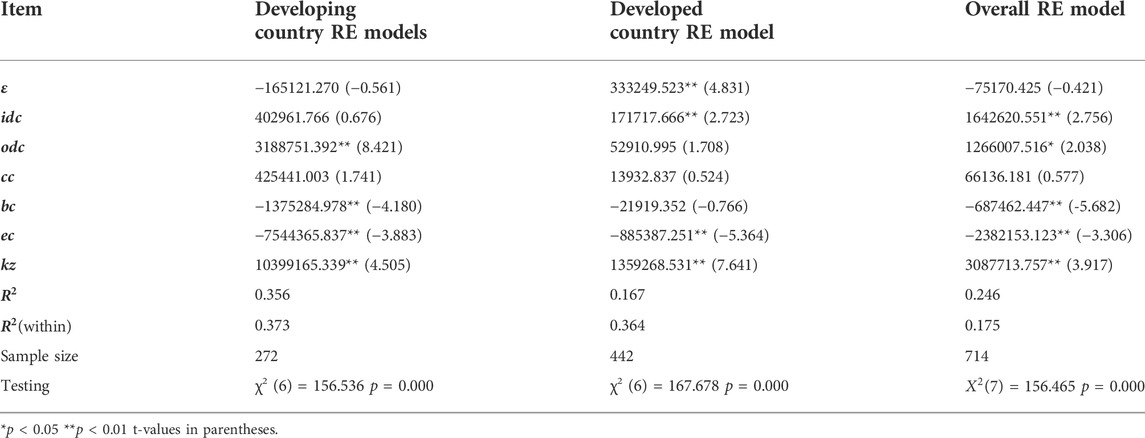
TABLE 6. Regression results of the relationship between trading network status and carbon emissions.
The results of the overall regression analysis show a 0.05 level of significance (t = 2.038, p = 0.042 < 0.05), indicating that an increase in exports also increases carbon emissions in the country. Still, the regression results for developed countries show that the effect of degree centrality on their carbon emissions is not significant, while developing countries show a 1% level of significance. This is because developed countries mainly export technology-intensive products and import raw materials or intermediate goods. At the same time, domestic inputs are more technology-based, so the impact of increased exports from developed countries on domestic carbon emissions is not as significant as that of developing countries.
Closeness centrality reflects the node’s status from the position in which it is located; the closer it is to the node in the central position. As can be seen from the results of the analysis in Table 6, the results of all three analyses show that there is no significant effect of proximity centrality on carbon emissions, whether the analysis is done as a whole or divided into developed and developing countries. This indicates that the position of the country in the trading network has no effect on the level of carbon emissions in the country.
In the overall analysis, the effect of country node betweenness centrality on national carbon emissions is significant at the 1% level of significance, and the regression coefficient is less than 0. Therefore, betweenness centrality negatively affects carbon emissions.
This is because a node with a high level of betweenness centrality indicates that the stronger the node’s role as a bridge, the more control it has over the exchange of information between its associated country nodes. Compared to other nodes, “bridge” nodes have easier access to trade, technology, and policy information from other countries’ nodes. They use this information to adjust their trade structure, thus improving production efficiency and reducing carbon emissions.
The results of both the overall and grouped analyses show that eigenvector centrality has a significant negative effect on carbon emissions; i.e., the higher the eigenvector centrality, the lower the carbon emissions. Eigenvector centrality reflects the importance of a node through its neighbors, so the more important the node with high eigenvector centrality is, the more important its neighbors are in the trade network, and the stronger its export capacity is. Nodes with high eigenvector centrality are influenced by their neighbors, and their export capacity will continue to increase. Their energy consumption will increase, and their carbon emissions will also increase. Therefore, the eigenvector centrality plays a significant negative impact on the node country’s carbon emissions.
Katz influence is a common metric for determining the influence of a node in a network. It calculates the Katz influence of a node based on the number of direct or indirect relationships which a node sends and receives to other nodes in the network. In this paper, KATZ influence is calculated based on the direct or indirect import and export relationship of countries to judge the influence of nodes in the network. Through the analysis of Table 6, it was found that KATZ shows a 1% level of significance on carbon emissions (
i. Stable performance of global trade networks, with developed countries at the core. Using complex network analysis, this paper explores the evolution of the overall structure of global trade networks and the changes in the characteristics of countries in the networks. It is found that after the data threshold, trade between countries is not close, and the trade network does not change substantially from 2000 to 2020. After examining the network chunking, it was found that it has a clear regional character, with a significant increase in linkages between regional integration organizations. The analysis of the network node centrality indicators shows that the top ranking of each centrality indicator is dominated by developed countries, which reflects the stability of the trade network from the side.
ii. China occupies a key position in the global trade network. In the analysis of the characteristics of the Chinese nodes, it was found that the results of the analysis of various indicators of the Chinese nodes are within the top 10, which fully illustrates the important position of China in the trade network and its strong influence in the trade network. In the module analysis, China is often in the same module as the US and Japan, and the intra-module density is higher than the network density in the same year, indicating that China has a close trade relationship with the US and Japan. At the same time, the density between the module where China is located and other modules is also often higher than the network density in the same year, which shows that China has a very close trade relationship with other countries.
iii. Network centrality indicators have different impacts on carbon emissions in countries at different levels of development. Based on the above analysis and considering the influence of a country’s trade network characteristics on its carbon emissions, this paper conducts an empirical analysis of 52 countries or regions. The results found that influenced by the technological level of imported and exported goods, the in-degree centrality of developed countries has a significant positive impact on carbon emissions. In contrast, the out-degree centrality of developing countries has a significant positive impact on carbon emissions. The effect of closeness centrality on carbon emissions is not significant, indicating that the position of each country node in the network does not have a significant effect on the carbon emissions of the country. Betweenness centrality has a significant negative effect on carbon emissions in developing countries, mainly due to the ease of access to information and advanced technology in countries with high betweenness centrality. Eigenvector centrality has a negative effect on carbon emissions, while Katz’s influence has a significant positive effect.
This paper uses the results of social network analysis as the explanatory variables and uses a panel model to analyze the impact of node characteristics in trade networks on carbon emissions, but is limited by the limitations of data access, as the WIOD database of carbon emissions is only updated to 2016, resulting in a panel analysis, which lags behind the development of practice. This is a shortcoming in most current carbon emissions studies.
The datasets presented in this study can be found in online repositories. The names of the repository/repositories and accession number(s) can be found in the article/supplementary material.
All authors listed have made a substantial, direct, and intellectual contribution to the work and approved it for publication.
This research was funded by A study on low carbon upgrading of high energy-consuming manufacturing industries in Jiangsu Province driven by digital, Jiangsu Social Science Foundation Project, Grant No. 22EYD006.
SK was employed by Jiangsu Seenbom Flexible Electronics Institute Co., Ltd.
The remaining authors declare that the research was conducted in the absence of any commercial or financial relationships that could be construed as a potential conflict of interest.
All claims expressed in this article are solely those of the authors and do not necessarily represent those of their affiliated organizations, or those of the publisher, the editors and the reviewers. Any product that may be evaluated in this article, or claim that may be made by its manufacturer, is not guaranteed or endorsed by the publisher.
Acheampong, A. O., Adams, S., and Boateng, E. (2019). Do globalization and renewable energy contribute to carbon emissions mitigation in sub-saharan africa? Sci. Total Environ. 677, 436–446. doi:10.1016/j.scitotenv.2019.04.353
Adebayo, T. S., Akinsola, G. D., Bekun, F. V., Osemeahon, O. S., and Sarkodie, S. A. (2021). Mitigating human-induced emissions in Argentina: Role of renewables income globalization, and financial development. Environ. Sci. Pollut. Res. 2847, 67764–67778. doi:10.1007/s11356-021-14830-5
Adebayo, T. S., Awosusi, A. A., Rjoub, H., Agyekum, E. B., and Kirikkaleli, D. (2022). The influence of renewable energy usage on consumption-based carbon emissions in mint economies. Heliyon 8, e08941–e08942. doi:10.1016/j.heliyon.2022.e08941
Aller, C., Ductor, L., and Herrerias, M. J. (2015). The world trade network and the environment. Energy Econ. 52, 55–68. doi:10.1016/j.eneco.2015.09.008
Amador, Joao, and Cabral., Sonia (2017). Networks of value added trade. World Econ. 40, 1291–1313. doi:10.1111/twec.12469
Cheng, Z., and Hu, X. (2022). The effects of urbanization and urban sprawl on Co2 emissions in China. Environ. Dev. Sustain. 29. doi:10.1007/s10668-022-02123-x
Duan, K. Y., Cao, M. Y., and Malim, N. A. K. (2022). The relationship between trade liberalization, financial development and carbon dioxide emission-an empirical analysis. SUSTAINABILITY 14, 10308–10316. doi:10.3390/su141610308
Freeman, L. C. (2004). The development of social network analysis. Vancouver, BC, Canada: Empirical Press.
Gao, P., Yue, S., and Chen, H. (2021). Carbon emission efficiency of China’s industry sectors: From the perspective of embodied carbon emissions. J. Clean. Prod. 283, 124655. doi:10.1016/j.jclepro.2020.124655
Garcia-Perez, G., Boguna, M., Allard, A., and Serrano, M. A. (2016). The hidden hyperbolic geometry of international trade: World trade atlas 1870-2013. Sci. Rep. 6, 33441. doi:10.1038/srep33441
Ge, J., Wang, X., Guan, Q., Li, W., He, Z., and Yao, M. (2016). World rare earths trade network: Patterns, relations and role characteristics. Resour. Policy 50, 119–130. doi:10.1016/j.resourpol.2016.09.002
Hatfield, J. W., Scott Kominers, D., Nichifor, A., Ostrovsky, M., and Alexander, W. (2018). “Chain stability in trading networks,” in Proceedings of the 2018 ACM Conference on Economics and Computation, June 18–22, 2018 (ACM), 197–234. doi:10.3982/TE3839
He, J., and Deem, M. W. (2010). Structure and response in the world trade network. Phys. Rev. Lett. 105, 198701–198719. doi:10.1103/PhysRevLett.105.198701
Hou, W., Liu, H., Wang, H., and Wu, F. (2018). Structure and patterns of the international rare earths trade: A complex network analysis. Resour. Policy 55, 133–142. doi:10.1016/j.resourpol.2017.11.008
Hua, L., Yang, Z., and Shao, J. (2022). Impact of network density on the efficiency of innovation networks: An agent-based simulation study. PLoS One 17, e02700877. doi:10.1371/journal.pone.0270087
Hung, N. T., Trang, N. T., and Thang, N. T. (2022). Quantile relationship between globalization, financial development, economic growth, and carbon emissions: Evidence from Vietnam. Environ. Sci. Pollut. Res. 29, 60098–60116. doi:10.1007/s11356-022-20126-z
Jin, Q-Y., Zhang, J., Gao, Y-Q., Su, X., and Fu, Y-S. (2014). Research on relationship between carbon dioxide emissions, imports, exports, and population in China. Environ. Prot. Eng. 40, 75–85. doi:10.5277/epe140206
Katz, Leo. (1953). A new status index derived from sociometric analysis. Psychometrika 18 (1), 39–43. doi:10.1007/BF02289026
Khan, H., Weili, L., and Khan, I. (2022). The role of institutional quality in fdi inflows and carbon emission reduction: Evidence from the global developing and belt road initiative countries. Environ. Sci. Pollut. Res. 29, 30594–30621. doi:10.1007/s11356-021-17958-6
Lee, Jae Woo, Eun Maeng, Seong, Ha, Gyeong-Gyun, Lee, Moon Hyeok, and Cho, Eun Seong (2013). Applications of complex networks on analysis of world trade network. J. Phys. Conf. Ser. 410, 012063. doi:10.1088/1742-6596/410/1/012063
Li, G., Hou, C., and Zhou, X. (2022). Carbon neutrality, international trade, and agricultural carbon emission performance in China. Front. Environ. Sci. 10. doi:10.3389/fenvs.2022.931937
Liu, J., Tian, J., Lyu, W., and Yu, Y. (2022). The impact of covid-19 on reducing carbon emissions: From the angle of international student mobility. Appl. Energy 317, 119136. doi:10.1016/j.apenergy.2022.119136
Moyer, D., Gutman, B., Prasad, G., Faskowitz, J., Steeg, G. V., and Thompson, P. (2015). “Blockmodels for connectome analysis,” in Proceedings Of The 11th International Symposium On Medical Information Processing And Analysis, Cuenca, Ecuador (SPIE digital library). doi:10.1117/12.2211519
Nasir, M. A., Canh, N. P., and Le, T. N. L. (2021). Environmental degradation & role of financialisation, economic development, industrialisation and trade liberalisation. J. Environ. Manag. 277, 111471. doi:10.1016/j.jenvman.2020.111471
Newman, M. E. J. (2006). Modularity and community structure in networks. Proc. Natl. Acad. Sci. U. S. A. 103, 8577–8582. doi:10.1073/pnas.0601602103
Quilcaille, Y., Gasser, T., Ciais, P., Lecocq, F., Janssens-Maenhout, G., and Mohr, S. (2018). Uncertainty in projected climate change arising from uncertain fossil-fuel emission factors. Environ. Res. Lett. 13, 044017. doi:10.1088/1748-9326/aab304
Salman, M., Long, X., Dauda, L., Mensah, C. N., and Muhammad, S. (2019). Different impacts of export and import on carbon emissions across 7 asean countries: A panel quantile regression approach. Sci. Total Environ. 686, 1019–1029. doi:10.1016/j.scitotenv.2019.06.019
Serrano, M. A., and Boguna, M. (2003). Topology of the world trade web. Phys. Rev. E 68 (1), 015101. doi:10.1103/PhysRevE.68.015101
Shah, S. A. A., Shah, S. Q. A., and Tahir, M. (2022). Determinants of Co2 emissions: Exploring the unexplored in low-income countries. Environ. Sci. Pollut. Res. 29 (32), 48276–48284. doi:10.1007/s11356-022-19319-3
Shahbaz, Muhammad, Qazi Muhammad, A. H., Aviral Kumar, T., and Nuno Carlos, L. (2013). Economic growth, energy consumption, financial development, international trade and Co2 emissions in Indonesia. Renew. Sustain. Energy Rev. 25, 109–121. doi:10.1016/j.rser.2013.04.009
Shi, R., Irfan, M., Liu, G., Yang, X., and Su, X. (2022). Analysis of the impact of livestock structure on carbon emissions of animal husbandry: A sustainable way to improving public health and green environment. Front. Public Health 10, 835210. doi:10.3389/fpubh.2022.835210
Sinha, A., and Sen, S. (2016). Atmospheric consequences of trade and human development: A case of bric countries. Atmos. Pollut. Res. 7 (6), 980–989. doi:10.1016/j.apr.2016.06.003
Tang, D., Yi, R., Kong, H., Da, D., and Boamah, V. (2022). Foreign direct investment entry mode and China’s carbon productivity based on spatial econometric model. Front. Environ. Sci. 10. doi:10.3389/fenvs.2022.922151
Wang, H., Guangle, Y. A. N., and Yanghua, X. "Symmetry in world trade network." J. Syst. Sci. Complex. 22 (2009). 280–290. doi:10.1007/s11424-009-9163-9
Wang, X. F., Xiang, L., and Chen, G. (2012). Network science: An introduction. China: Beijing: Higher Education Press.
Wang, X., Li, H., Yao, H., Chen, Z., and Guan, Q. (2022). "Network feature and influence factors of global nature graphite trade competition." Resour. Policy 60 x 153–161. doi:10.1016/j.resourpol.2018.12.012
Wasserman, Stanley, and Faust, Katherine (1994). Social network analysis and applications. United Kingdom: Cambridge University Press.
Xiang, X. W., Ma, M. D., Ma, X., Chen, L. M., Cai, W. G., Feng, W., et al. (2022). Historical decarbonization of global commercial building operations in the 21st century. Appl. ENERGY 322, 119401. doi:10.1016/j.apenergy.2022.119401
Yan, R., Xiang, X., Cai, W., and Ma, M. (2022). Decarbonizing residential buildings in the developing world: Historical cases from China. Sci. Total Environ. 847, 157679–79. doi:10.1016/j.scitotenv.2022.157679
Yao, X., Yasmeen, R., Li, Y., Hafeez, M., and Padda, I. (2019). Free trade agreements and environment for sustainable development: A gravity model analysis. Sustainability 11, 597. doi:10.3390/su11030597
Yu, S., Niu, D., Yongle, J., and Jiang, Y. (2022). Manufacturing diffusion trends from the perspective of trade network: The belt vs. the road. Marit. Policy & Manag. 49, 716–736. doi:10.1080/03088839.2022.2087238
Zhang, J. L., and Luo, Y. (2017). “Degree centrality, betweenness centrality, and closeness centrality in social network,” in Proceedings Of The 2017 2nd International Conference On Modelling, Simulation And Applied Mathematics, Berlin Germany, March 2017 (Springer Nature), 300–303.
Zhang, S. F., Ma, M. D., Li, K., Ma, Z. L., Feng, W., and Cai, W. G. (2022). Historical carbon abatement in the commercial building operation: China versus the us. ENERGY Econ. 105, 105712. doi:10.1016/j.eneco.2021.105712
Zhang, S. F., Ma, M. D., Xiang, X. W., Cai, W. G., Feng, W., and Ma, Z. L. (2022). Potential to decarbonize the commercial building operation of the top two emitters by 2060. Resour. CONSERVATION Recycl. 185, 106481. doi:10.1016/j.resconrec.2022.106481
Zhao, B., Sun, L., and Qin, L. (2022). Optimization of China's provincial carbon emission transfer structure under the dual constraints of economic development and emission reduction goals. Environ. Sci. Pollut. Res. 29, 50335–50351. doi:10.1007/s11356-022-19288-7
Zhao, X., Jiang, M., and Zhang, W. (2022). Decoupling between economic development and carbon emissions and its driving factors: Evidence from China int. J. Environ. Res. Public Health 19, 2893. doi:10.3390/ijerph19052893
Zhou, P., Ding, Y., He, Y., and Weerasinghe, R. (2020). Study on the evolution characteristics of international nickel ores trade from perspective of complex networks. E3S Web Conf. 143, 02050. doi:10.1051/e3sconf/202014302050
Keywords: trading, networks, node status, carbon emissions, correlation analysis
Citation: Zhang X, Tang D, Kong S, Wang X, Xu T and Boamah V (2022) The carbon effects of the evolution of node status in the world trade network. Front. Environ. Sci. 10:1037654. doi: 10.3389/fenvs.2022.1037654
Received: 06 September 2022; Accepted: 03 October 2022;
Published: 20 October 2022.
Edited by:
Kangyin Dong, University of International Business and Economics, ChinaCopyright © 2022 Zhang, Tang, Kong, Wang, Xu and Boamah. This is an open-access article distributed under the terms of the Creative Commons Attribution License (CC BY). The use, distribution or reproduction in other forums is permitted, provided the original author(s) and the copyright owner(s) are credited and that the original publication in this journal is cited, in accordance with accepted academic practice. No use, distribution or reproduction is permitted which does not comply with these terms.
*Correspondence: Xiaoling Zhang, emhhbmdfeGlhb2xpbmcwMDIzOThAc2p1LmVkdS5jbg==; Decai Tang, dGFuZ2RlY2FpMjAwM0AxNjMuY29t; Shanyou Kong, a29uZ3NoYW55b3VAc2VlbmJvbS5jb20=
Disclaimer: All claims expressed in this article are solely those of the authors and do not necessarily represent those of their affiliated organizations, or those of the publisher, the editors and the reviewers. Any product that may be evaluated in this article or claim that may be made by its manufacturer is not guaranteed or endorsed by the publisher.
Research integrity at Frontiers
Learn more about the work of our research integrity team to safeguard the quality of each article we publish.