 Cui Wei
 Wan An-Wei
 Sonia Kumari
- 1School of Economics and Management, Nanjing Institute of Technology, Nanjing, China
- 2Business School, Hohai University, Nanjing, China
- 3Department of Business Administration, Sukkur IBA University, Sukkur, Sindh, Pakistan
In recent years, the overtime culture has generally emerged in Chinese enterprises (CEs), the length of workers’ working hours has been lengthened, and their intensity has increased. Still, the labor income share has declined, which deserves in-depth analysis. This paper introduces a relative labor intensity indicator to estimate the trend of the labor income share based on the general factor-enhanced CES production function in China. The econometric model is then introduced to analyze in-depth the influencing factors leading to this trend using relevant data from 2001 to 2020. If the elasticity of substitution is less than 1 and capital and labor are complementary, then the labor income share tends to decrease. This is because the relative labor intensity tends to increase while the growth rate of the capital-labor ratio tends to decrease. The empirical results also show that the decrease in labor income share and labor compensation is related to monopoly and the amount of capital input. If the amount of capital input is higher and the degree of monopoly is higher, then the labor income is lower, and the share of labor income is lower. Monopolies and capital intercept most of the value created because of the increased labor intensity, and laborers receive only a small profit.
1 Introduction
Overtime work is becoming more and more common in Chinese enterprises, and overtime hours are getting longer and longer. Although workers are paid overtime, is the pay proportional to the gain? This issue is related to workers’ rights and interests and the fairness of labor-employee income distribution. Therefore, it is necessary to analyze this issue in depth.
Many companies have developed a culture of overtime work, and work systems such as “996″ and “007″ have emerged (“996″ means starting work at 9 a.m. and finishing at 9 p.m., working 6 days a week. “007″ means working from 0:00 to 24:00, 7 days a week). Workers’ work is constantly crowding out their leisure time, their working hours are getting longer, and working intensity is also growing. But does the increase in the amount of wealth created, along with the increase in the intensity of work, contribute to the increase in workers’ income? This paper calculates the labor income share based on the fund flow statements in the China Statistical Yearbook, which shows that the labor income share gradually increased and reached a maximum of 59.67% from 1979 to 1999. From 2000 onwards, labor income share declined continuously, falling to 47.03% in 2011. After that, the labor income share began to rise again, reaching 52.74% in 2017. China’s rapid economic development after reform and opening up has been called a miracle in the world’s economic development, but it has been accompanied by a decline in the labor income share. Especially in recent years, Chinese society has developed an atmosphere of intense overtime work (Peng, 2020), but the labor income share has not increased significantly, and workers have not shared the fruits of economic growth. This suggests that the labor value may be appropriated, and there may be inequitable income distribution.
The root of China’s economic growth miracle is technological progress, but technological progress can lead to monopolies (Du et al., 2020). In the 20th century, the rapid growth of the world economy was due to technological progress, and science and technology is the first productive force (Zhang et al., 2022). This rapid technological progress has led to increasingly competitive markets (Distanont & Khongmalai, 2020), manifesting itself in a proliferation of monopolies. This is because technological competition is essentially a zero-sum competition, with the most advanced science and technology initially in the hands of only a few firms. Advanced technology can significantly reduce the production costs of enterprises (Çalışkan, 2015), significantly increase their productivity and even drive the renewal of products in their own industry. In contrast, other companies in the same industry have to withdraw from the market competition because they are unable to master this new technology in a short period. On the one hand, advanced technology significantly reduces production costs, which may already be far below the average production costs of the industry; on the other hand, other companies do not have the technology to produce the new generation of products. In this way, the company with advanced technology may monopolize the market. For example, the Windows operating system developed by Microsoft Corporation occupies most of the market share of personal computer operating systems, and no company can compete with it.
Monopolies may increase the capital income share and lead to a decrease in the labor income share (Windsteiger, 2021). Scientific and technological progress is expressed in firms’ development of new production tools, equipment, and production processes, i.e. capital is the material expression of scientific and technological progress. Physical capital is one of the main factors of production, the other main factor of production being labor. Since material capital is the physical form of science and technology, the continuous progress in science and technology leads to a deepening of material capital, and the wealth created by scientific and technological progress is distributed with a bias towards the capital, resulting in a decreasing labor income share (Kumar & Stauvermann, 2021). Furthermore, relying on monopoly advantages, material capital has a discourse power in income distribution compared to labor. This may result in capital not only receiving its share of the return on investment but also appropriating a portion of labor’s income in the process of income distribution (Flanagan & Stillwell, 2018). Because an increasing proportion of capital is invested in the production process, the rate of return on its inputs should also increase. However, this also hides the fact that capital appropriates labor income. China’s labor force is working longer hours, but the labor income share and real wage have tended to decline. Ostensibly, the cause of the decline in the share of labor income and labor wages is the encroachment of capital, which may fundamentally be the result of a monopoly, but the latter cause is often overlooked. Therefore, it is necessary to analyze in depth the process and mechanism of monopoly encroachment on labor income to reveal the reasons why labor intensity has increased but labor income share has not increased in the same proportion and to find effective measures to raise workers’ income at the root.
In view of the above analysis, this paper aims to analyze the mechanism of the effect of monopoly on labor income share. Specifically, a dynamic panel model is constructed to investigate the impact of monopoly on labor income share and labor wages, respectively. The regression results of the models are used to demonstrate the erosion of labor income by monopolies. The significance of this paper is that it extends the theory of income distribution on the one hand. The combination of market structure theory and income distribution theory provides insight into the distribution rules of total social income under a monopolistic market structure; on the other hand, by analyzing the encroachment of monopoly on labor income, we find ways to alleviate the gap between labor and capital income and help to achieve a fair distribution of social income.
2 Literature review
Overtime is one of the means by which companies win in the market. The reasons that lead employees to work overtime may be the underestimation of the difficulty of the work when signing the contract, the need to deal with unexpected situations in the course of work, or the time difference with overseas customers (Upadhya, 2016). Overtime is part of East Asian culture (Allison 1994). Many Japanese workers work overtime because of the endless work and excessive expenses (Gagne, 2017), so overtime is considered part of the job. Moreover, companies strive to change the overtime system into an overtime culture and make employees actively embrace this culture (Kunda, 2009). In this way, companies reshape the mindset of employees toward work, and overtime becomes a sign of positive motivation (Gooptu, 2009).
However, while overtime can improve the economic efficiency of companies in the short term, in the long term, it may reduce the overall economic efficiency of society because workers may become ill due to prolonged work and strain. In Japan, the cumulative direct economic loss due to employee overwork reached 4.7 trillion yen between 1998 and 2009, and 14.8 trillion yen by 2020 (Neumayer, 2003). In comparison, 400,000 to 800,000 employees in the United States suffer from chronic fatigue syndrome each year, a condition that is difficult to eliminate and can last up to 20 years (Fukuda, 1994; Nisenbaum et al., 2000; Reyes et al., 2003). The direct economic cost of the disease in the United States ranges from US$2-7 billion per year, with the average loss to the individual worker ranging from US$2,342-8675 (Jason et al., 2008). Moreover, the resulting medical treatment costs $3,226 per person per year, costing the national economy $14-37 billion (Lin et al., 2011). In Australia, the cost of medical treatment for the disease is also $2,000 per patient per month, with a national cost of nearly $60 million due to fatigue (Lloyd & Pender, 1992). The cost of treatment for employees suffering from fatigue syndrome in the United Kingdom is over £600 per person per month (McCrone et al., 2003). In addition, employees in a fatigued state reduce the productivity of the company. As a result of fatigue, employee absenteeism increases, and job competency decreases (Evans-Lacko & Knapp, 2016). Even when working, employees are in an unproductive work situation for 4.1 h per week (Brogmus, 2007), which equates to an annual economic loss of $20,000 and $91.3 to the state and the individual, respectively (Reynolds, 2004). Therefore, in the long run, over time results in lower wages. Since the productivity of machines is stable, a fall in wage income means a fall in the labor income share.
An early researcher on labor income shares was Kaldor, who proposed “Kaldor’s stylized facts” that labor income shares are essentially stable in the national economy. However, Blanchard (1997) disproves this argument because the relevant data for the OEDC countries in 1980 show that labor income shares are not unstable. For example, the labor income shares of countries such as Spain, France, and Germany have continued to decline. This result has caused the academic community to rethink the issue; subsequently, many scholars have made more new findings. Data from the U.S. Bureau of Economic Analysis (BEA) show that the labor income share in the U.S. was stable from 1959 to 1979, but it began to decline in subsequent years (Van Treeck, K., 2020). In contrast, the labor income share in OECD countries fluctuates and does not have a clear trend. Hence, this may also be related to the degree of development of different countries, with poor countries’ labor income shares in a downward trend, while the opposite is true for rich countries (Gawrycka & Szymczak, 2021).
There are four main factors affecting the change in labor income share: industrial structure, market competition structure, technological progress, and economic globalization.
The impact of industrial restructuring on labor income share includes three main aspects. Firstly, industrial structure upgrading has a positive effect on labor income share. This is because industrial structural upgrading enhances the demand for high-skilled labor, i.e., the reliance on human capital, which increases the labor income share (Zhang et al., 2022). Secondly, industrial structural upgrading harms labor income share. The labor income share in the primary industry is relatively high, while the labor income share in the tertiary industry is low. So, the industrial structure upgrading will lead to a lower and lower share of labor-intensive industries along with industrialization, which will hurt the labor share (Zhou & Li, 2021). Thirdly, the labor income shares change in a “U" pattern in the process of industrial structure upgrading. The increase in the employment share of primary and tertiary industries will help to increase the labor income share, compared to the increase in the employment share of secondary industries will reduce the labor income share. And the overall labor income share will show a “U" shape change when the employment share of the three industries meets a certain proportional relationship (Cui et al., 2018; Charpe et al., 2020).
The phenomenon of imperfect competition in the market is caused by the monopoly power in the market, which is an important influencing factor of the labor income share. Because monopoly is inherently capital-biased, it favors capital in the distribution of factor returns, making capital encroach on labor benefits, which is more evident in firms with stronger monopoly power (Feldman et al., 2021; Yang, 2022). Monopolies reduce the labor income share mainly through monopoly pricing and reducing the bargaining power of labor, and may increase the labor income share if they can eliminate monopoly pricing and improve the bargaining power of labor (Mertens, 2022).
Economic globalization has an overall negative effect on labor income shares (Hung and Hammett, 2016; Young and Tackett, 2018), and the extent of the effect is related to the country’s position in the global value chain division system (Sun et al., 2021; Qalati et al., 2022). As the participation rate in the globalized division increases, the gap between capital, high-skilled labor, and medium-low-skilled labor in the compensation of production factors within industries will widen, thus reducing the labor income share (Carpa & Martínez-Zarzoso, 2022). Moreover, the further downstream the industry is in the global value chain division system, the lower the labor income share is (Lu, 2019).
Technological progress is generally biased towards the lower price of production factors (Samuelson, 1965; Young & Zuleta, 2016). A lower price of labor relative to capital induces capital-saving technological innovation; a lower price of capital relative to labor induces labor-saving technological innovation. Different directions of technological progress lead to different directions of changes in factor income shares (Jiao et al., 2021); some scholars further found that technological progress can only explain part of the direction of changes in labor income shares (Wang et al., 2021), and the other part is explained by technical efficiency (Klump et al., 2008). Summing up the above research can draw the following two main points. Firstly, labor income share is not constant. Secondly, the factors affecting the change in labor income share include economic globalization, industrial structure change, biased technological progress, and imperfect competition in the product and labor markets, but different researchers have obtained different directions of influence.
A large number of scholars have studied theories, methods, and data related to labor income shares in-depth, providing much for subsequent studies. However, there are some limitations of the existing studies. Firstly, the effect of elasticity of substitution on labor income share is significant, but few studies have analyzed it. If this effect is ignored, it may lead to disproportionate factor inputs and lower input-output efficiency. Second, the factor-augmenting technical progress growth rate of labor relative to capital may be an important factor affecting labor share, but few scholars have studied it. If this factor is ignored, it may not reveal the reason why the labor income share decreases when the work intensity increases, which is not conducive to protecting the rights and interests of workers. Based on this, this paper intends to use the generalized CES production function to study and verify the mechanisms of elasticity of substitution and the factor-augmenting technical progress growth rate of labor relative to the capital on labor income share and to empirically examine the reasons for the exploitation of labor value.
Measurement of the elasticity of substitution, the factor-augmenting technical progress growth rate of labor relative to capital, and labor income share indicators.
3 Methodology
3.1 Calculation model
3.1.1 Elasticity of substitution
In this paper, we refer to León-Ledesma et al. (2010) and set the production function in this paper as the CES production function as follows.
Where the allocation parameter
Wage is equal to the marginal output of labor in a perfectly competitive market, and capital income equals the marginal output of capital. As shown in formulas (5) and 6.
The ratio of
Eq. 8 can be obtained by calculating the logarithm of Eq. 7
The elasticity of substitution can be calculated from Eq. 8, it is
3.2 Fixed capital stock
This paper draws on Luetzel’s (1977) perpetual inventory method of measuring fixed capital stock. The following equation can express this method:
Where
Firstly, the estimation of new fixed capital in each period. This paper uses social fixed asset investment. Referring to the study of Vander et al. (2021), the intermediate value of 3%–5% ratio of the remaining value of legal prescription is 4% as the processing value of depreciation assets. Then, the new fixed capital available for the year (10) describes:
And
This paper refers to Wang et al. (2020) using the fixed capital investment price index (previous year = 1) from the China Statistical Yearbook to deflate the fixed capital investment price (current year price) to obtain the total fixed-asset investment in constant prices with 2001 as the base period, and then use Equation 11 to calculate the total fixed capital stock in constant prices with 2001 as the base period.
Secondly, the choice of economic depreciation rate of fixed capital. Considering that the economic depreciation rate is the replacement rate of fixed capital rather than the accounting statistical depreciation rate, this paper adopts the estimation method and estimation results of Luetzel (1977) on the overall economic depreciation rate of fixed capital, i.e.,
Finally, the choice of initial fixed capital. This paper draws on Young (2003), which is a common method used in most studies to estimate the initial fixed capital stock, as shown in Eq. 12.
And g is the average annual growth rate of GDP or investment growth rate in adjacent periods,
3.3 Labor income share
Labor income share is equal to the remuneration of workers divided by GDP, i.e.,
3.3.1 Factor-augmenting technical progress growth rate of labor relative to capital
According to Sun & Ji (2022), the total output is distributed only between capital and labor, and the ratio of capital income share to labor income share is
From Eqs 13, 14, 15 can be obtained.
Eqs 14, 15 are substituted into Eq. 1 to obtain
Because
So the factor-augmenting technical progress growth rate of labor relative to capital is Eq. 20.
The greater
3.4 Model construction
Industry monopolies in China are complex, and there is a situation where multiple monopolies merge (Nie & Yue, 2017). This can lead to an inequitable income distribution, with workers earning less than they pay for. There are many situations such as profit erosion of income in state-owned enterprises and capital erosion of income in private enterprises (Stanford, 2018).
To verify the effect of market monopoly on labor income share and labor compensation, this paper refers to the studies of Wang & Song (2014) and Zhao & Zhong (2017) to construct a time series model to analyze the specific impact of monopoly degree, capital income price and other relevant factors on labor income share and labor compensation, as shown in Eqs 21, 22.
t in Eqs 21, 22 denote time.
The control variables
4 Results
4.1 The result of elasticity of substitution
The relevant data from China Statistical Yearbook from 2001-2020 are substituted into Eq. 8 to calculate the results as shown in Table 1.
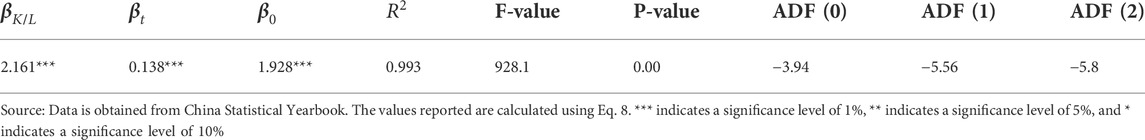
TABLE 1. Calculation results of related indicators in Eq. 8.
According to the calculation results of the relevant indicators in Table 1, the elasticity of substitution of labor and capital can be obtained as
4.2 The result of labor income share
The labor income share is calculated based on the data of labor compensation and GDP, and the calculation results are shown in Table 2.
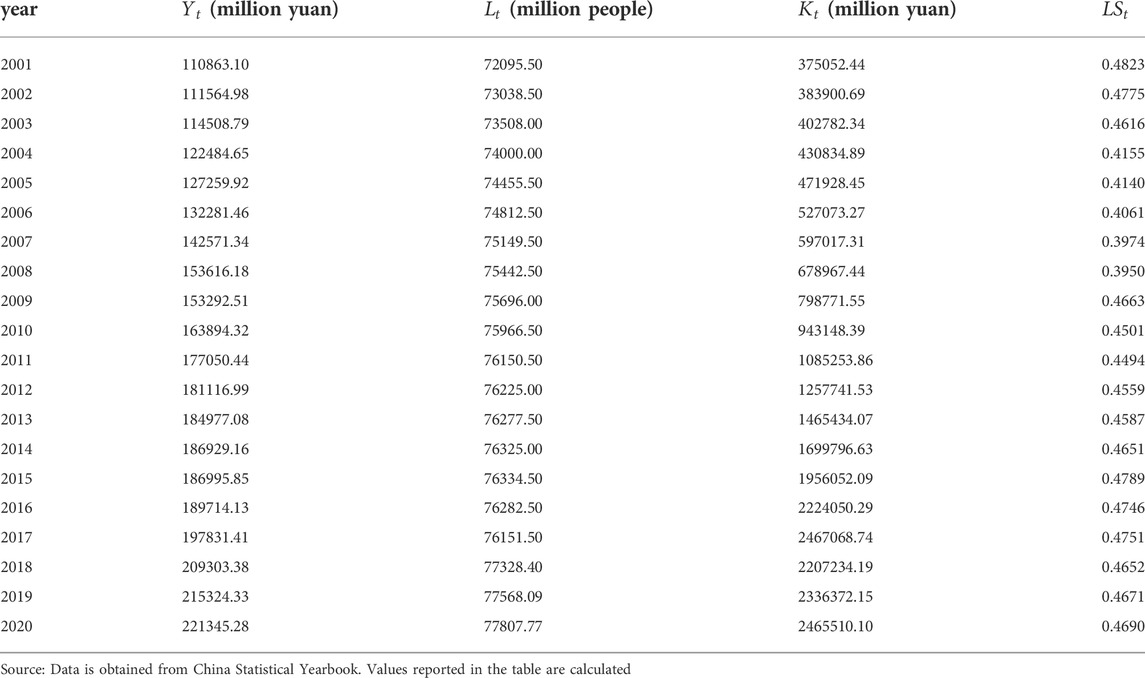
TABLE 2. Labor income share (
Based on the results of the calculation of the labor income share in Table 2, the trend of the labor income share from 2021 to 2050 is projected, as shown in Figure 1. The trend in Figure 1 shows that the labor income share will show a decreasing trend in the future. Data on labor income shares for 2022-2050 are obtained with the help of a projection function.
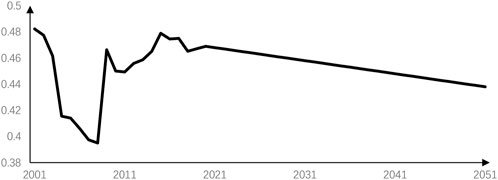
FIGURE 1. Projected changes in labor income shares, 2021-2050.
4.3 The result of factor-augmenting technical progress growth rate of labor relative to capital
Based on the data of GDP, labor force, and capital in the Chinese statistical yearbook, and the elasticity of substitution and allocation parameter calculated in the previous section, combined with Eqs 18–20, the factor-augmenting technical progress growth rate of labor relative to capital can be obtained (
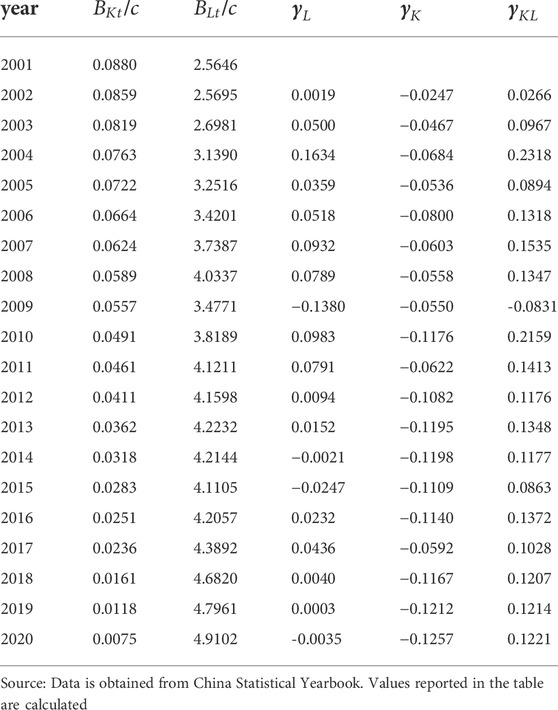
TABLE 3. The result of
In summary, the elasticity of substitution

TABLE 4. Descriptive statistics of variables
4.4 Regression results
The data of the above indicators are obtained from the “China Statistical Yearbook” from 2001 to 2021 and substituted into Eqs 21, 22, and the results are shown in Table 5.
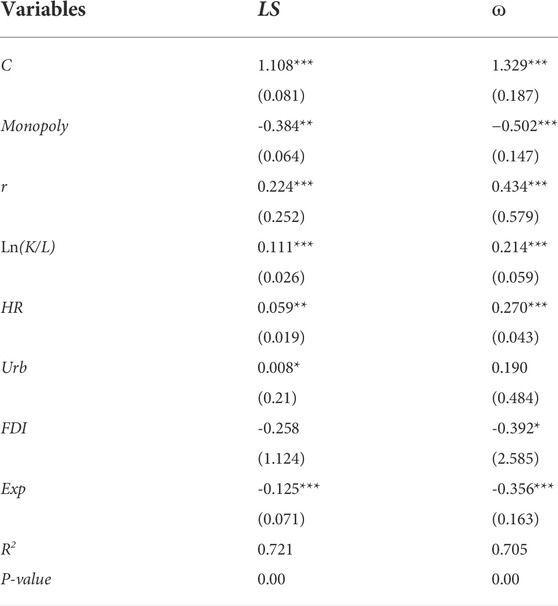
TABLE 5. Regression results for dependent variable labor income.
Data is obtained from China Statistical Yearbook. All the values are substituted into Eqs 21, 22 to get the regression results for labor income share and wage rate as the dependent variables. *** indicates a significance level of 1%, ** indicates a significance level of 5%, and * indicates a significance level of 10%.
The results show that monopoly increases by 1, labor income share decreases by 0.384, and wage level decreases by 0.502. This means monopoly is negatively correlated with both dependent variables, and the higher the degree of monopoly is, the lower the labor income share and wage level is. An increase in the interest rates or the logarithm of capital intensity by 1 unit increases the labor income share by 0.224 and 0.111, respectively, and the wage level by 0.434 and 0.214, respectively. This means that the excess input of capital in production leads to a lower marginal output of capital and higher costs, lower demand for capital for production, higher demand for labor, and higher labor income. It was also found that an increase in human capital by 1 was associated with an increase in labor income share and wage level by 0.059 and 0.27, respectively. This is consistent with the findings of most of the existing studies, where higher educational attainment is associated with greater human capital and higher labor income. However, the effects of urbanization and FDI on labor income shares and wage levels are considerably less significant. Even the effects of urbanization on wage levels and FDI on labor income shares are not significant. This is because although income levels are higher in cities compared to rural areas, farmers who move to cities do not necessarily raise their incomes and may even lose their jobs due to a lack of skills. The effect of FDI on labor income share is insignificant as it aims to maximize the return on capital and also lowers the average wage level. The change in foreign trade by 1 unit reduces the labor income share and wage level by 0.125 and 0.356 respectively, suggesting that foreign trade increases the volume of business for firms and the working time of the labor force may increase further, but the value of the extra labor created may be re-appropriated by capital using its monopoly advantage.
4.5 Robustness test
Because the sample data from 2001-2003 are relatively old and may be more different from the latest data, the regression calculation is redone after removing them, and if they are consistent with the results in Table 5, then it indicates that the regression model is stable, and the obtained results are shown in Table 6 below. This section aims to analyze the robustness of the model. And the results reported further support the results in Table 5; therefore, the relationships between the variables are robust and analyzed in detail.
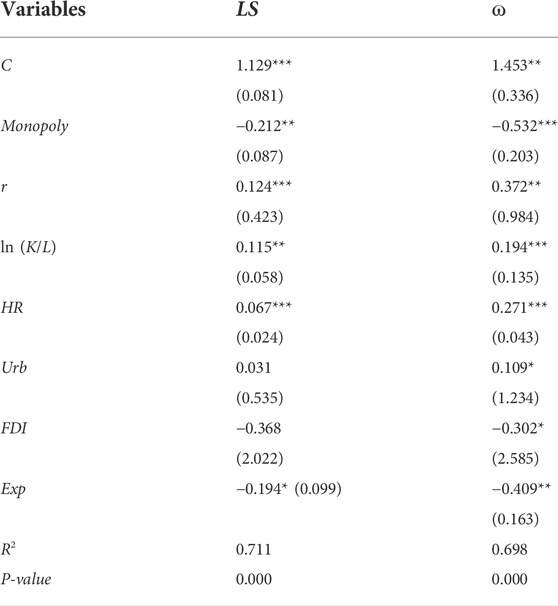
TABLE 6. Results of the robustness test.
Table 6 present the results of the robustness test that fully support the results of the main regression model results in Table 5. *** indicates a significance level of 1%, ** indicates a significance level of 5%, and * indicates a significance level of 10%.
4.6 Example of shanghai city
Furthermore, this paper uses Shanghai city data as an example to highlight the fact that monopolies reduce labor income. This is because Shanghai is one of China’s financial centers and the financial sector is one of the most monopolized industries in China. Therefore, Shanghai’s financial sector is typical for studying the relationship between monopoly and labor income. The financial sector in this paper consists of three main industries: banking, insurance, and securities.
The indicators for the dependent, independent, and control variables were selected as in the previous section. The data for these indicators were obtained from the “Shanghai Statistical Yearbook” for 2001-2021. These data were substituted into equation 19 and 20 to obtain the results in Table 7.
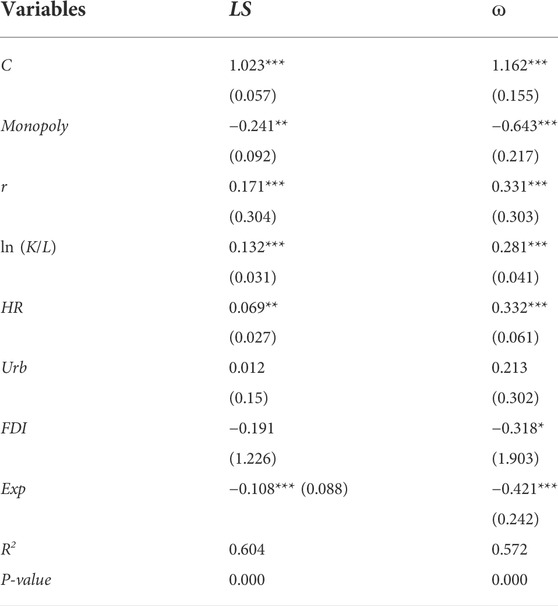
TABLE 7. The impact of monopolies in the financial sector on labor income in Shanghai.
Source: Data is obtained from the Shanghai Bureau of Statistics.
Website: https://tjj.sh.gov.cn/sjfb/index.html.
The values reported in the table are computed using regression analysis. *** indicates a significance level of 1%, ** indicates a significance level of 5%, and * indicates a significance level of 10%.
The results in Table 7 show that monopolies in the financial sector in Shanghai significantly reduce labor income share and wages. And in Table 5, an increase in monopoly by 1 reduces the labor income share and wages by 0.384 and 0.502, respectively, but in Table 7 they are reduced by a higher intensity of 0.241 and 0.643 respectively. The reason for the change in the impact of monopoly on labor income shares and wages in Table 7 compared to Table 5 is that Table 5 analyses the impact of the average degree of monopoly on labor income across industries in China, while Table 7 analyses the impact of the degree of monopoly on labor income in the financial sector in Shanghai, which has a higher degree of monopoly in China. The comparison reveals that the financial sector in Shanghai, which has a higher degree of monopoly, reduces the level of labor income more significantly. This again confirms the scientific validity of the theoretical analysis in this paper.
4.7 Discussion of findings
Monopolies have more influence in the labor market than competing businesses, and they can easily alter the wage rate. Consequently, they will pay lower wages. This study elucidates the idea that monopolies affect the labor income share in the economy. The findings highlight that monopolies are lowering labor income which suggests although there is a lot of labor-intensive activity done in monopolies, worker’s income does not increase considerably (Autor et al., 2020; Eggertsson et al., 2021; Carpa & Martínez-Zarzoso, 2022). The benefits of economic progress are not being appropriately distributed to the working class. This has an adverse effect on how they manage to maintain the essential standards of living (Lu, 2019). However, labor income shares are rising in rich countries while the majority of countries’ income shares do not follow any trend and instead display a random pattern (Gawrycka & Szymczak, 2021; Van Treeck, K., 2020). Additionally, higher capital utilization and educational achievement are linked to higher labor income. This implies that capital acquisition requires skilled workers that enhance their bargaining power (Feldman et al., 2021; Zhang et al., 2022). On the other hand, evidence supports that the general labor class lacks bargaining power which causes inefficiencies in the market. Specifically, inefficiencies in terms of increased firm profits, capital, and income inequality in the economy.
The emphasis is on whether the monopolies are driving economies in the right direction or it requires structural changes. Due to their high-profit margins and inefficient use of capital, monopolies are characterized by inefficiencies. This further indicates that resources are not used to their full potential (Antonelli & Scellato 2019). Labors are incapable to bargain their wage rates. This gives rise to incompetence and inequalities.
In this context, the literature suggests technological innovation is a possible way to break the power of monopoly, raise the labor income share and reduce income inequality (Crossa et al., 2022; Wang et al., 2021). Another possible way to raise labor income is by limiting the restrictions to entry in such markets by promoting competition (Mertens, 2022).
In terms of its basic understanding of the Chinese market following cases are important to understand. First, the Chinese government introduced an anti-trust law in 2007. This law prevents monopolies from abusing their dominant position and disrupting the market, leading to excessive pricing in the market, which in turn raises production costs for downstream producers and reduces the income of their labor force.
In addition, the Chinese government also uses its administrative power to restrict the monopoly of state-owned enterprises. For example, China’s telecommunications market is controlled by three companies. Although the three companies still form an oligopoly and have a dominant market position, the telecommunications industry has very high fixed-cost inputs, resulting in high barriers to entry and an inability to create a competitive market pattern. As a result, the Chinese government regulates these three telecommunication companies very strictly, guiding them to set reasonable market prices. As the telecommunications industry is a fundamental sector of economic activity and social life, government-guided pricing effectively reduces the production costs of other enterprises and indirectly increases the income of the labor force of these enterprises.
At the same time, China has also taken the initiative to open its market and introduce foreign companies to compete with domestic companies, creating an open environment of free competition, which has also helped to reduce the emergence of monopolies. The entry of similar foreign enterprises into China has created competitive pressure on domestic enterprises as well as providing motivation. This requires domestic enterprises to constantly innovate technologically and develop scientific management systems while offering competitive wages to laborers who might otherwise go to work for well-paying foreign companies.
Second, China’s financial market is characterized by a clear monopoly, with the four major state-owned banks - Industrial and Commercial Bank of China, Agricultural Bank of China, Bank of China, and China Construction Bank - having a clear dominant market position in the Chinese financial market, and although several joint-stock banks have been established in China, an oligopolistic market structure still exists.
Third, with the advancement of digital technology and the innovation of Internet technology, Alibaba Group has introduced financial services that not only replace most of the bank’s business but are also more convenient, efficient, and cheaper than banks. This has pushed state-owned and joint-stock banks to reduce costs and improve the quality of their services. This has reduced monopolies and raised labor income levels, with wages for labor in industries related to the digital economy increasing significantly.
And fourth, the Chinese company Huawei built up a patriotic image. The mobile phones it produced quickly captured a large share of the Chinese mobile phone market. Given this, the company builds up a good social image through patriotism and socially responsible actions. This not only helps the company to develop its market but also helps to raise the income of low-income groups.
5 Conclusion and policy implications
5.1 Conclusion
Despite China creates economic growth miracle, the labor income share has not only failed to increase in tandem but has tended to decrease. There are many reasons for this result, and this paper argues that monopoly is one of the important reasons that cannot be ignored. Therefore, this paper constructs an econometric model with labor income share and wage level as the dependent variables, monopoly as the independent variable, and interest rate, capital intensity, human capital, urbanization, FDI, and foreign trade as the control variables. The regression results of the model found that although the control variables selected in this paper affected labor income share and wage level to varying degrees, the effect of monopoly was the most significant and negligible. To test this view, the paper further uses the financial sector in Shanghai as an example because not only is Shanghai the financial center of China, but this industry is one of the most monopolistic industries, so it is chosen as the sample, and the results obtained better highlight the correlation between monopoly and labor income. The test results show that monopoly significantly reduces the share of labor income and the average wage level in the financial industry in Shanghai.
China’s income distribution system is based on the contribution of factors in production, and this system becomes an institutional factor in monopolies reducing the labor income share and wage levels, while capital deepening is a market factor. Monopoly is often tied to capital. Monopoly manifests itself in the ability of firms to control the market, i.e. the firm’s product has a high market share and sets high barriers to market entry. Moreover, because of capital deepening in China, capital receives most of the monopoly profits and also has the power to distribute them. This is because the enterprise’s capital is in the hands of the employer, whereas the labor force is individual and has difficulty forming a synergy. Although the labor force in a monopoly should share in the monopoly profits, the limited bargaining power of the individual labor force with the capitalist results in capital not only receiving a share of the monopoly profits belonging to capital but also depriving the labor force of a share of the monopoly profits.
In addition, the monopolistic firm’s monopoly position in the market also reduces the income of the non-monopolistic firm’s labor force. The monopoly has the power to set prices in the market, which allows it to drive down the purchase or sale prices of upstream and downstream enterprises in the industrial chain, resulting in limited profits for these firms. Again, it is still the capital that controls the distribution of profits, so the labor force in these firms receives lower wages. It follows that monopoly is one of the main reasons for the decline in the labor income share and the lower level of wages.
5.2 Policy implications
When viewed from a market perspective, monopolies not only reduce the productivity of monopolistic enterprises but also reduce the efficiency of the operation of the market, resulting in a waste of resources. This promotes income inequality with the reduction in the income share of labor. As Figure 1 shows, there is a downward trend in the labor income share. It is necessary to achieve income equality so that the labor class can easily manage a good standard of living. For that following practical measures are suggested.
First, technological advancement is a potential means of increasing labor income share and lowering income disparity. Second, a trained and skilled workforce can negotiate the wage rate with choices to serve in various markets. Following a need assessment of present and future needs, the government and policymakers can assist in providing training and development of a workforce with the appropriate skills. Third, the government should formulate macro-regulatory policies or legal provisions to restrict monopolies. Fourth, more taxes can be imposed, facilitating the indirect income transfer to the lower-income groups. And last, the high-income group transfers wealth to the low-income group through donations. Social welfare groups must encourage monopolies to donate to society, especially low-income groups. The main goal of enterprises is to maximize profits, and most do not have the will to donate actively to society. However, the goal of modern enterprises is no longer just to make profits but also to take social responsibility.
Further research can be conducted on the socially responsible activities of monopolies in terms of their benefits to society. And the levels of ease of entry to new businesses in such settings.
Data availability statement
The raw data supporting the conclusion of this article will be made available by the authors, without undue reservation.
Author contributions
All authors listed have made a substantial, direct, and intellectual contribution to the work and approved it for publication.
Conflict of interest
The authors declare that the research was conducted in the absence of any commercial or financial relationships that could be construed as a potential conflict of interest.
Publisher’s note
All claims expressed in this article are solely those of the authors and do not necessarily represent those of their affiliated organizations, or those of the publisher, the editors and the reviewers. Any product that may be evaluated in this article, or claim that may be made by its manufacturer, is not guaranteed or endorsed by the publisher.
References
Acemoglu, D. (2003). Labor and capital augmenting technical change. J. Eur. Econ. Assoc. 1 (1), 1–37. doi:10.1162/154247603322256756
Acemoglu, D., and Restrepo, P. (2018). The race between man and machine: Implications of technology for growth, factor shares, and employment. Am. Econ. Rev. 108 (6), 1488–1542. doi:10.1257/aer.20160696
Akaev, A., Devezas, T., Ichkitidze, Y., and Sarygulov, A. (2021). Forecasting the labor intensity and labor income share for G7 countries in the digital age. Technol. Forecast. Soc. Change 167, 120675. doi:10.1016/j.techfore.2021.120675
Allison, A. (1994). Nightwork: Sexuality, pleasure, and corporate masculinity in a Tokyo hostess club. University of Chicago Press Illinois.
Antonelli, C., and Scellato, G. (2019). Wage inequality and directed technological change: Implications for income distribution. Technol. Forecast. Soc. change 141 (C), 59–65. doi:10.1016/j.techfore.2019.01.016
Autor, D., Dorn, D., Katz, L. F., Patterson, C., and Van Reenen, J. (2020). The fall of the labor share and the rise of superstar firms. Q. J. Econ. 135 (2), 645–709. doi:10.1093/qje/qjaa004
Blanchard, O. J., Nordhaus, W. D., and Phelps, E. S. (1997). The medium run. Brookings Pap. Econ. activity 1997 (2), 89–158. doi:10.2307/2534687
Brogmus, G. E. (2007). Day of the week lost time occupational injury trends in the US by gender and industry and their implications for work scheduling. Ergonomics 50 (3), 446–474. doi:10.1080/00140130601133826
Çalışkan, H. K. (2015). Technological change and economic growth. Procedia - Soc. Behav. Sci. 195, 649–654. doi:10.1016/j.sbspro.2015.06.174
Carpa, N., and Martínez-Zarzoso, I. (2022). The impact of global value chain participation on income inequality. Int. Econ. 169, 269–290. doi:10.1016/j.inteco.2022.02.002
Charpe, M., Bridji, S., and McAdam, P. (2020). Labor share and growth in the long run. Macroecon. Dyn. 24 (7), 1720–1757. doi:10.1017/s1365100518001025
Crossa, M., and Wise, R. D. (2022). Innovation in the era of generalized monopolies: The case of the US–Mexico automotive industrial complex. Globalizations 19 (2), 301–321. doi:10.1080/14747731.2021.1882818
Cui, Y., Meng, J., and Lu, C. (2018). Recent developments in China's labor market: Labor shortage, rising wages and their implications. Rev. Dev. Econ. 22 (3), 1217–1238. doi:10.1111/rode.12391
Distanont, A., and Khongmalai, O. (2020). The role of innovation in creating a competitive advantage. Kasetsart J. Soc. Sci. 41 (1), 15–21.
Du, W., Li, M., and Wang, F. (2020). Role of rent-seeking or technological progress in maintaining the monopoly power of energy enterprises: An empirical analysis based on micro-data from China. Energy 202, 117763. doi:10.1016/j.energy.2020.117763
Eggertsson, G. B., Robbins, J. A., and Wold, E. G. (2021). Kaldor and Piketty’s facts: The rise of monopoly power in the United States. J. Monetary Econ. 124, S19–S38. doi:10.1016/j.jmoneco.2021.09.007
Evans-Lacko, S., and Knapp, M. (2016). Global patterns of workplace productivity for people with depression: Absenteeism and presenteeism costs across eight diverse countries. Soc. Psychiatry Psychiatr. Epidemiol. 51 (11), 1525–1537. doi:10.1007/s00127-016-1278-4
Feldman, M., Guy, F., and Iammarino, S. (2021). Regional income disparities, monopoly and finance. Camb. J. Regions, Econ. Soc. 14 (1), 25–49. doi:10.1093/cjres/rsaa024
Flanagan, F., and Stillwell, F. (2018). Causes and consequences of labour's falling income share and growing inequality. J. Aust. Political Econ. (81), 5–10.
Fukuda, K., Strauss, S. E., Hickie, I., Sharpe, M. C., Dobbins, J. G., and Komaroff, A. (1994). The chronic fatigue syndrome: A comprehensive approach to its definition and study. J. Chronic Fatigue Syndr. 121, 67–84. doi:10.1300/j092v01n02_06
Gagne, N. O. (2018). Correcting capitalism": Changing metrics and meanings of work among Japanese employees. J. Contemp. Asia 48 (1), 67–87. doi:10.1080/00472336.2017.1381984
Gawrycka, M., and Szymczak, A. (2021). A panel analysis of the impact of green transformation and globalization on the labor share in the national income. Energies 14 (21), 6967. doi:10.3390/en14216967
Gooptu, N. (2009). Neoliberal subjectivity, enterprise culture and new workplaces: Organised retail and shopping malls in India. Econ. Political Wkly.,44 45–54.
Guo, L., and Luo, Q. (2019). Market concentration measurement, administrative monopoly effect and efficiency improvement: Empirical data from China civil aviation industry 2001-2015. Appl. Econ. 51 (34), 3758–3769. doi:10.1080/00036846.2019.1584381
Hung, J. H. (2016). Globalization and the labor share in the United States[J]. East. Econ. J. 42 ((2)), 193–214. doi:10.1057/eej.2014.50
Jason, L. A., Benton, M. C., Valentine, L., Johnson, A., and Torres-Harding, S. (2008). The economic impact of ME/CFS: Individual and societal costs. Dyn. Med. 7 (1), 6–8. doi:10.1186/1476-5918-7-6
Jiao, Z., Sharma, R., Kautish, P., and Hussain, H. I. (2021). Unveiling the asymmetric impact of exports, oil prices, technological innovations, and income inequality on carbon emissions in India. Resour. Policy 74, 102408. doi:10.1016/j.resourpol.2021.102408
Klump, R., McAdam, P., and Willman, A. (2008). Unwrapping some euro area growth puzzles: Factor substitution, productivity and unemployment. J. Macroecon. 30 (2), 645–666. doi:10.1016/j.jmacro.2007.06.005
Knoblach, M., Roessler, M., and Zwerschke, P. (2020). The elasticity of substitution between capital and labour in the US economy: A meta regression analysis. Oxf. Bull. Econ. Stat. 82 (1), 62–82. doi:10.1111/obes.12312
Knoblach, M., and Stöckl, F. (2020). What determines the elasticity of substitution between capital and labor? A literature review. J. Econ. Surv. 34 (4), 847–875. doi:10.1111/joes.12366
Kumar, R. R., and Stauvermann, P. J. (2021). Revisited: Monopoly and long-run capital accumulation in two-sector overlapping generation model. J. Risk Financ. Manag. 14 (7), 304. doi:10.3390/jrfm14070304
Kumari, S., Oad Rajput, S. K., Hussain, R. Y., Marwat, J., and Hussain, H. (2021). Optimistic and pessimistic economic sentiments and US Dollar exchange rate. J. Finan. Eng., 2150043. doi:10.1142/s2424786321500432
Kunda, G. (2009). Engineering culture: Control and commitment in a high-tech corporation. Temple University Press.Philadelphia Pennsylvania
León-Ledesma, M. A., McAdam, P., and Willman, A. (2010). Identifying the elasticity of substitution with biased technical change. Am. Econ. Rev. 100 (4), 1330–1357. doi:10.1257/aer.100.4.1330
Lin, J. M. S., Resch, S. C., Brimmer, D. J., Johnson, A., Kennedy, S., Burstein, N., et al. (2011). The economic impact of chronic fatigue syndrome in Georgia: Direct and indirect costs. Cost. Eff. Resour. Alloc. 9 (1), 1–12. doi:10.1186/1478-7547-9-1
Liu, B., and Lai, Jieji (2021). Can the regulation of administrative monopoly improve enterprise capacity utilization? A quasi-natural experiment based on the fair competition review system. J. Finance Econ. 47 (09), 34–47.
Lloyd, A. R., and Pender, H. (1992). The economic impact of chronic fatigue syndrome. Med. J. Aust. 157 (9), 599–601. doi:10.5694/j.1326-5377.1992.tb137401.x
Lu, Y., Lu, Y., Xie, R., and Yu, X. (2019). Does global value chain engagement improve firms' wages: Evidence from China. World Econ. 42 (10), 3065–3085. doi:10.1111/twec.12805
Luetzel, H. (1977). Estimates of capital stock by industries in the Federal Republic of Germany. Rev. Income Wealth 23 (1), 63–78. doi:10.1111/j.1475-4991.1977.tb00004.x
McCrone, P., Darbishire, L., Ridsdale, L., and Seed, P. (2003). The economic cost of chronic fatigue and chronic fatigue syndrome in UK primary care. Psychol. Med. 33 (2), 253–261. doi:10.1017/s0033291702006980
Mertens, M. (2022). Micro-mechanisms behind declining labor shares: Rising market power and changing modes of production. Int. J. Industrial Organ. 81, 102808. doi:10.1016/j.ijindorg.2021.102808
Neumayer, E. (2003). Are socioeconomic factors valid determinants of suicide? Controlling for national cultures of suicide with fixed-effects estimation. Cross-cultural Res. 37 (3), 307–329. doi:10.1177/1069397103253708
Nie, H., and Yue, X. (2017). Re-Discussion on the rationality of high income of monopoly industries: Evidence from the employer-employee matched data. China Financ. Econ. Rev. 5 (1), 10–22. doi:10.1186/s40589-017-0056-0
Nisenbaum, R., Jones, A. B., Jones, J. F., and Reeves, W. C. (2000). Longitudinal analysis of symptoms reported by patients with chronic fatigue syndrome. Ann. Epidemiol. 10 (7), 458–483. doi:10.1016/s1047-2797(00)00119-8
Peng, X. (2020). The 6pm struggle: The changing meaning of work, a culture of overtime work, and corporate governmentality in urban China. Asian Anthropol. 19 (1), 39–52. doi:10.1080/1683478x.2019.1654499
Qalati, S. A., Kumari, S., Soomro, I. A., Ali, R., and Hong, Y. (2022). Green supply chain management and corporate performance among manufacturing firms in Pakistan. Front. Environ. Sci. 540. doi:10.3389/fenvs.2022.873837
Reyes, M., Nisenbaum, R., Hoaglin, D. C., Unger, E. R., Emmons, C., Randall, B., et al. (2003). Prevalence and incidence of chronic fatigue syndrome in Wichita, Kansas. Arch. Intern. Med. 163 (13), 1530–1536. doi:10.1001/archinte.163.13.1530
Reynolds, K. J., Vernon, S. D., Bouchery, E., and Reeves, W. C. (2004). The economic impact of chronic fatigue syndrome. Cost. Eff. Resour. Alloc. 2, 4–9. doi:10.1186/1478-7547-2-4
Samuelson, P. A. (1965). A theory of induced innovation along Kennedy-Weisäcker lines. Rev. Econ. Statistics 47, 343–356. doi:10.2307/1927763
Stanford, J. (2018). The declining labour share in Australia: Definition, measurement, and international comparisons. J. Aust. Political Econ. (81), 11–32. doi:10.3316/informit.811887214203350
Sun, Y., and Ji, J. (2022). Measurement and analysis of technological progress bias in China's mariculture industry. J. World Aquac. Soc. 53 (1), 60–76. doi:10.1111/jwas.12866
Sun, Z., Tang, D., and Li, Q. (2021). Competitive strategy of firms' participation in the global value chains and labor income share. Complexity 2021, 1–18. doi:10.1155/2021/8716737
Upadhya, C. (2016). Reengineering India: Work, capital, and class in an offshore economy Oxford University Press.Oxford England
Van Treeck, K. (2020). Measuring the labor income share of developing countries: Lessons from social accounting matrices. Rev. Income Wealth 66 (3), 584–612. doi:10.1111/roiw.12424
Vander Donckt, M., Chan, P., and Silvestrini, A. (2021). A new global database on agriculture investment and capital stock. Food Policy 100, 101961. doi:10.1016/j.foodpol.2020.101961
Wang, J., Hu, Y., and Zhang, Z. (2021). Skill-biased technological change and labor market polarization in China. Econ. Model. 100, 105507. doi:10.1016/j.econmod.2021.105507
Wang, R., Qi, Z., and Shu, Y. (2020). Multiple relationships between fixed-asset investment and industrial structure evolution in China–Based on Directed Acyclic Graph (DAG) analysis and VAR model. Struct. Change Econ. Dyn. 55, 222–231. doi:10.1016/j.strueco.2020.09.001
Wang, S. H., and Song, M. L. (2014). Review of hidden carbon emissions, trade, and labor income share in China, 2001–2011. Energy Policy 74, 395–405. doi:10.1016/j.enpol.2014.08.038
Windsteiger, L. (2021). Monopolistic supply of sorting, inequality, and welfare. J. Public Econ. Theory 23 (5), 801–821. doi:10.1111/jpet.12518
Yang, C. (2022). “Public power and income distribution,” in Research on normalizing income distribution order in China (Singapore: Springer), 261–303.
Young, A. (2003). Gold into base metals: Productivity growth in the People's Republic of China during the reform period. J. political Econ. 111 (6), 1220–1261. doi:10.1086/378532
Young, A. T., and Tackett, M. Y. (2018). Globalization and the decline in labor shares: Exploring the relationship beyond trade and financial flows. Eur. J. Political Econ. 52, 18–35. doi:10.1016/j.ejpoleco.2017.04.003
Young, A. T., and Zuleta, H. (2016). Golden rules of wages. South. Econ. J. 83 (1), 253–270. doi:10.1002/soej.12138
Zhang, S., Zhu, C., Li, X., Yu, X., and Fang, Q. (2022a). Sectoral heterogeneity, industrial structure transformation, and changes in total labor income share. Technol. Forecast. Soc. Change 176, 121509. doi:10.1016/j.techfore.2022.121509
Zhang, X., Zhong, S., Yao, F., Li, Y., and Li, J. (2022b). Industrial green total factor productivity in China's Yangtze River Economic Zone: Temporal and spatial difference analysis based on 108 panel data. Plos one 17 (7), e0259366. doi:10.1371/journal.pone.0259366
Zhao, X., and Zhong, S. (2017). The influence of administrative monopoly on economic development—an empirical study based on vector error correction model. Int. J. Bus. Manag. 12 (6), 182. doi:10.5539/ijbm.v12n6p182
Keywords: labor income share, elasticity of substitution, monopoly, labor intensities production function, manufacturing companies
Citation: Wei C, An-Wei W and Kumari S (2022) Do more get more: Monopoly appropriation of labor income in manufacturing companies. Front. Environ. Sci. 10:1037615. doi: 10.3389/fenvs.2022.1037615
Received: 20 September 2022; Accepted: 31 October 2022;
Published: 14 November 2022.
Edited by:
Khurram Shehzad, Southeast University, ChinaReviewed by:
Gordon Brady, Florida Southern College, United StatesSaid Khalfa Mokhtar Brika, University of Oum El Bouaghi, Algeria
Elena Cigu, Alexandru Ioan Cuza University, Romania
Copyright © 2022 Wei, An-Wei and Kumari. This is an open-access article distributed under the terms of the Creative Commons Attribution License (CC BY). The use, distribution or reproduction in other forums is permitted, provided the original author(s) and the copyright owner(s) are credited and that the original publication in this journal is cited, in accordance with accepted academic practice. No use, distribution or reproduction is permitted which does not comply with these terms.
*Correspondence: Sonia Kumari, U29uaWEua3VtYXJpQGliYS1zdWsuZWR1LnBr; Wan An-Wei, MTA0NDI1ODExOUBxcS5jb20=