
95% of researchers rate our articles as excellent or good
Learn more about the work of our research integrity team to safeguard the quality of each article we publish.
Find out more
ORIGINAL RESEARCH article
Front. Environ. Sci. , 05 January 2023
Sec. Water and Wastewater Management
Volume 10 - 2022 | https://doi.org/10.3389/fenvs.2022.1037547
This article is part of the Research Topic Sustainable Development on Water Resources Management, Policy and Governance in a Changing World View all 10 articles
 Muhammad Majeed1†Linlin Lu2†Muhammad Mushahid Anwar3
 Aqil Tariq4,5*Shujing Qin6*Mohamed E. El-Hefnawy7Mohamed El-Sharnouby8Qingting Li9Abdulrahman Alasmari10
The landscape of Pakistan is vulnerable to flood and periodically affected by floods of different magnitudes. The aim of this study was aimed to assess the flash flood susceptibility of district Jhelum, Punjab, Pakistan using geospatial model and Frequency Ratio and Analytical Hierarchy Process. Also, the study considered eight most influential flood-causing parameters are Digital Elevation Model, slop, distance from the river, drainage density, Land use/Land cover, geology, soil resistivity (soil consisting of different rocks and soil formation) and rainfall deviation. The rainfall data was collected from weather stations in the vicinity of the study area. Estimated weight was allotted to each flood-inducing factors with the help of AHP and FR. Through the use of the overlay analysis, each of the factors were brought together, and the value of drainage density was awarded the maximum possible score. According to the study several areas of the region based on the parameters have been classified in flood zones viz, very high risk, high risk, moderate risk, low risk, and very low risk. In the light of the results obtained, 4% of the study area that accounts for 86.25 km2 is at high risk of flood. The areas like Bagham, Sohawa, Domeli, Turkai, Jogi Tillas, Chang Wala, Dandot Khewra were located at the very high elevation. Whereas Potha, Samothi, Chaklana, Bagrian, Tilla Jogian, Nandna, Rawal high-risk zones and have been damaged badly in the flood history of the area. This study is the first of its kind conducted on the Jhelum District and provides guidelines for disaster management authorities and response agencies, infrastructure planners, watershed management, and climatologists.
Historically, flash floods have been more devastating to agriculture, infrastructure, animal, and human life worldwide (Relief, 2013; Braimah et al., 2014; Tariq et al., 2023). Different countries of the world are still more prone to the hazards of flash floods because of the changes in climatic conditions of the world (Das, 2019; Tariq et al., 2022e; Tariq and Mumtaz, 2022). The havoc of flash floods has been greater in those parts of the world that have not developed a system of forecast and flood effects mitigation (Kheradmand et al., 2018; Basharat et al., 2022; da Silva Monteiro et al., 2022). To avoid mass movement and reduce the aftermaths, it is crucial to develop a mapping system based on different parameters of cause and effects (Basin, 2021; Islam F. et al., 2022; Sharifi et al., 2022a; Hussain et al., 2022b). One of the major reasons for floods is heavy rainfall and the low discharge capacity of canals, rivers, and dams. To make a successful assessment of flash floods it is pertinent to have complete modeling of floods to manage the risk and mitigate the effects (Khalil et al., 2022a; 2022b; Moazzam et al., 2022).
Human is the major manipulator of the ecosystem since their origin on the surface of the earth. Land use methods and land manipulation like agriculture use and deforestation are some of the man-induced causes that affect recurrent floods (Bera et al., 2022; Fu et al., 2022; Haq et al., 2022; Prasad et al., 2022; Ullah et al., 2022). Therefore, awareness of the manipulations made by humans, susceptibility, and risk analysis is pivotal and essential to be done on an earlier basis (Costache et al., 2022; Tariq et al., 2022c; Ghaderizadeh et al., 2022; Jalayer et al., 2022). Geographic Information System (GIS) and remote sensing techniques are the most widely used techniques to know the physical and biological surface of the land and gather necessary data for flood modeling (Nashwan et al., 2019; Tariq et al., 2022a; Sadiq Fareed et al., 2022; Wahla et al., 2022). Nowadays, GIS and RS techniques have are crucial tools to develop multi-criteria zoning decision analysis (Nyaupane and Chhetri, 2009; Baqa et al., 2022; Tariq et al., 2022b). GIS techniques are used to prepare flood mapping of an area. Through remote sensing, zonation images are gathered to make a complete image with the help of Landsat 5, Landsat 7, Landsat 8, and Satellite Pour Observation Terre (SPOT) (Polychronaki et al., 2013). The Artificial Neural Network (ANN) model for flood (Abdullahi and Pradhan, 2018), imitation has widely been used for flood susceptibility and modeling in Malaysia and India. Additionally, the use of GIS has been more frequent to evaluate the most vulnerable areas to flooding. In different parts of the globe, GIS has more frequently been used to obtain flood susceptibility analysis, GIS-based frequency ratios models, and monitoring expected hazards (Waqas et al., 2021b; Hussain et al., 2022a; Khan et al., 2022; Shah et al., 2022). It is therefore apparent that amalgamation of the techniques of GIS and RS are more beneficial to obtain data in flood-related studies.
Over the years, the Analytical Hierarchy Process (AHP) in connection with GIS has got more popularity for mapping floods (Pal and Ziaul, 2017; Aslam et al., 2022; Imran et al., 2022; Moazzam et al., 2022). Also, the outcomes of GIS-based statistical calculations showed more accuracy than using spatial data alone. In flood susceptibility studies the use of logistic regression, decision tree, Shannon’s entropy model, ANN, FRM, fuzzy logic, and AHP models have frequently been used (Sharifi et al., 2022b; Felegari et al., 2022; Zamani et al., 2022). AHP is the most widely used model and is a more efficient and easily understandable model. Other methods like bivariate statistical technique and frequency ratio are the most effective methods used in the assessment of natural calamities (Yerramilli, 2012; Abbas et al., 2021; Tariq et al., 2021e).
Flood is one of the most life-threatening disasters in the world. The occurrences of inundations have increased in the Global South during the last few decades. An estimated 539,811 humans died, 361,974 sustained injuries, and over 2.8 billion were affected by floods during the decade’s between 1980 and 2009. The period between 1980 and 2016 observed a 1.6 trillion USD increase in damages. South Asia is the most affected part of the globe and accounts for more than half of the total death tolls of the world (Eckstein et al., 2019; Baloch et al., 2021; Felegari et al., 2021; Sharifi et al., 2021). Because of climate change, in the past few decades, a significant increase in the frequency and magnitude of floods (Moazzam et al., 2018) have been observed in the eastern rivers of Pakistan including the Jhelum. Since the bifurcation of United India, Pakistan has experienced devastating floods of history (Tariq et al., 2021a; Baqa et al., 2021; Hu et al., 2021). The flood of 2010 was held responsible for losses of 10 billion (USD). Keeping in view the damages of the inundation of 2010, different hydrological modeling were emphasized by the government of Pakistan. The Jhelum River basin originates from the west of the Himalayas and is one of the tributaries to the Upper Indus Basin (UIB) (Khalid et al., 2018; Ahmad et al., 2021; Ghaderizadeh et al., 2021). The climate of the Jhelum River basin receives two types of precipitations, namely the summer monsoon from India and the precipitations from westerlies circulations. Several studies suggest the Upper Indus Basin and the Himalayas as a hotspot to climate change (Chohan et al., 2015), which could significantly alter the water flow of the basin and ultimately the Jhelum River.
Flood susceptibility modeling is one of the key components of flood disaster studies (Dang et al., 2011; Siddayao et al., 2014; Moazzam et al., 2018, 2020; Kundzewicz et al., 2019). Jhelum River is the lower catchment of the Indus water basin and has experienced flood calamities periodically. So far, no flood susceptibility modeling has been performed for the Jhelum River. Flood risk modeling is a crucial part of river management and encompasses many factors such as topography, land use, slope, land cover, and rainfall intensity. Flood modeling has a pivotal role in flood risk management and hence this study is an attempt to meet the objective of flood management and risk mitigation. This study will provide a guideline to the National Disaster Management Authority Pakistan (NDMA) to manage flood disasters in Punjab and specifically in the Jhelum River of Pakistan. The main objectives of this study are to identify the zones of higher and lower risk Multi-Criteria Analysis-Analytic Hierarchy Process (MCA-AHP) and FR application. This study will help to the amalgamation of GIS and hydraulic model for the interpretation of recurrent flood hazards and reduce risk strategies developed through multiple activities.
In Pakistan, the district of Jhelum may be found to the western of the Jhelum River. It is bounded on the north by Rawalpindi, on the south by Sargodha and Gujrat, on the east by Azad Kashmir, and on the west by the district of Chakwal. The climate of the area was characterized as being semi-arid and warmly subtropical, with very warm summers and cold, snowy winters (Majeed et al., 2021b; 2022a; 2022c). The Jhelum District is a semi-mountainous range that receives an average of 880 mm of precipitation per year and has an average temperature of 23.6°C. The Jhelum River encompasses up to 247,102 acres of the surrounding plains on the mainland (Majeed et al., 2021b) (Figure 1). The elevation of the Jhelum River basin ranges from 235 to 6285 m above sea level (asl) and spreads over a drainage area of 33,342 km2 (Majeed et al., 2022c). The second-largest reservoir of Pakistan, the Mangla dam is fed by the Jhelum River basin and, therefore, plays a key role in the hydrological system of Pakistan (Majeed et al., 2022b). The slope of the basin undulates, ranging from 0˝ to 79˝. The lower plains of the basin near the Mangla dam and northeastern parts reside on a gentle slope (0″–10″) (Majeed et al., 2021a).
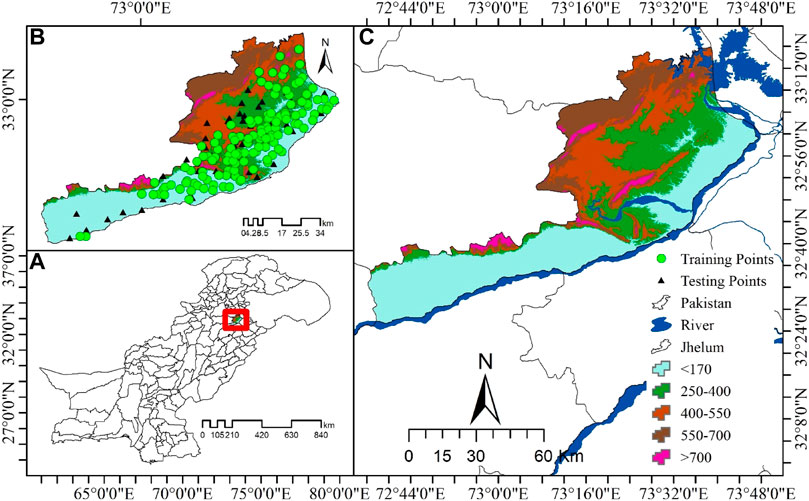
FIGURE 1. (A) Map of Pakistan, (B) Map of study area with testing and training points, (C) Location map of the study area (Jhelum), Punjab Pakistan.
To establish an accurate map of the flood susceptible areas, it is imperative to collect precise data of the previously flood-affected areas (Martinis et al., 2009). The accurate forecast of potential flash floods, in an area is possible only if we have preserved previous records of flash flood events. Some of the significant factors which determine the occurrence of flash floods, and hence the potential damage are; rainfall frequency, proximity to the stream, drainage, slope, density, soil type, and land use activities (Chen et al., 2022). All these factors are essential to be considered while planning and designing the inventory of flash floods and ultimately correct forecast. In the current study, we have taken data from 270 different zones which were previously affected and some non-affected zones. The classification of the area into different levels of potential risks is given in Figure 2.
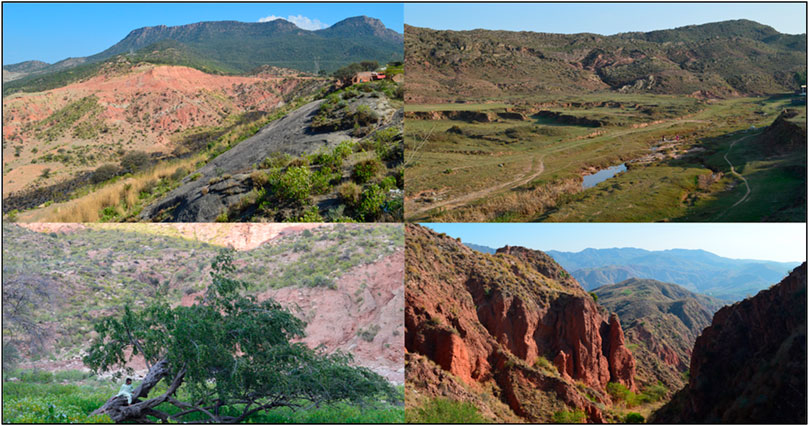
FIGURE 2. Flood risk zones of Jhelum district, Punjab Pakistan.
To conclude all the governing factors of a flood disaster, it is pivotal to classify the study area into different zones and study all the factors in different zones to draw guiding outcomes. In any area of flood risk, there are multiple factors while some of those factors operate in one zone and not in another zone (Sajjad et al., 2019). Therefore, to set a reliable picture of flood risk, a comprehensive field survey was conducted in different parts of the study area (Figure 3A). The selection of effective variables is preliminary to map flood-affected zones in any catchment area. Researchers face challenges while creating susceptibility maps (Majeed et al., 2021b; Tariq et al., 2021f; Haq et al., 2022). Therefore, we conducted a field survey to identify the potential flood-triggering variables. The most affected areas were visited, and data was collected based on the personal opinions of the residents (Table 1). We finally relied on a total of eight parameters such as elevation, slope, drainage density, distance from stream, geology, rainfall intensity, soil type, and LULC (Tariq et al., 2021d).
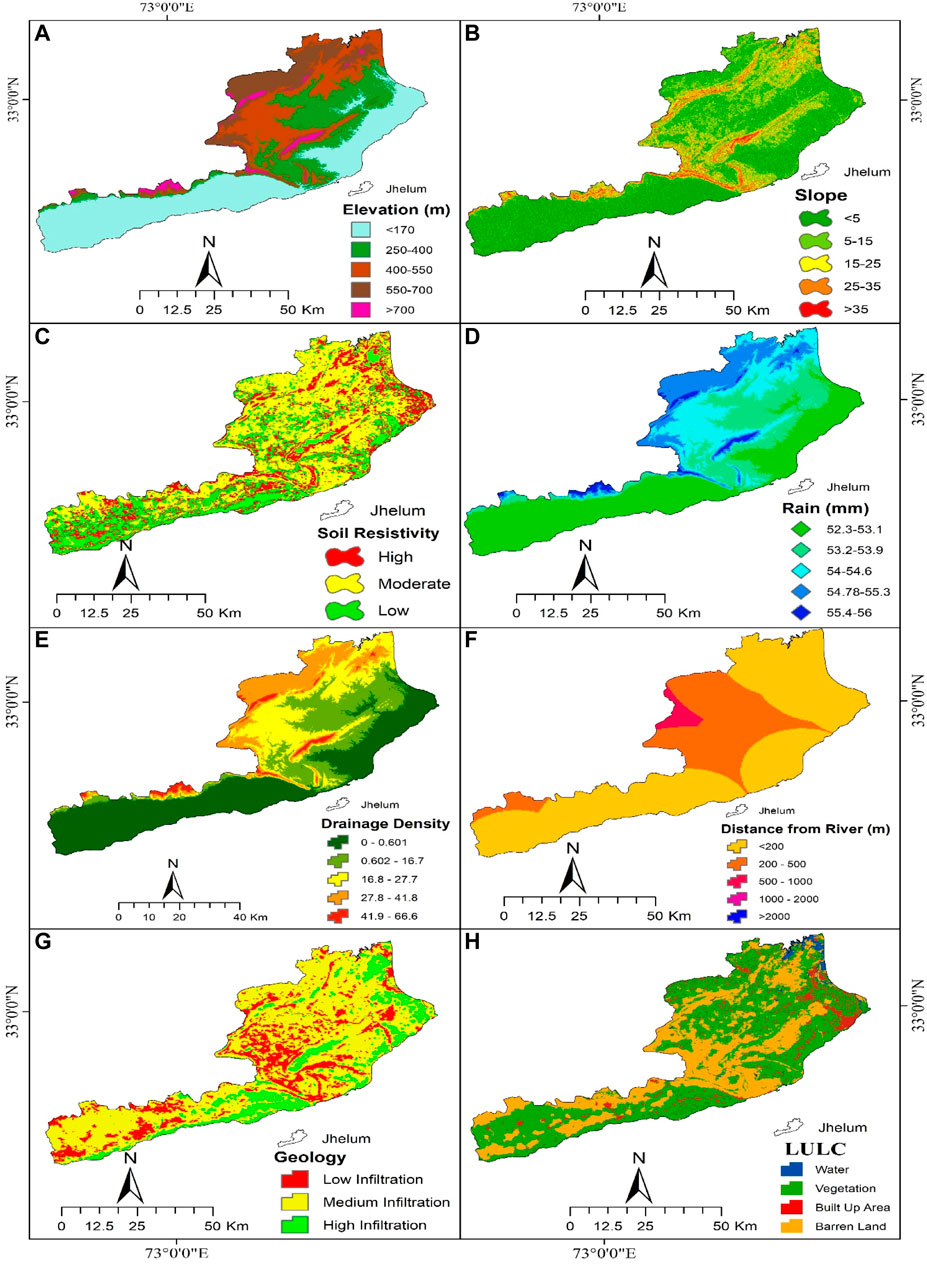
FIGURE 3. Conditions for flash flooding were mapped on maps: (A) Elevation, (B) slope, (C) soil resistivity, (D) rainfall, (E) drainage density, (F) distance from the River, (G) geology infiltration and (H) LULC.
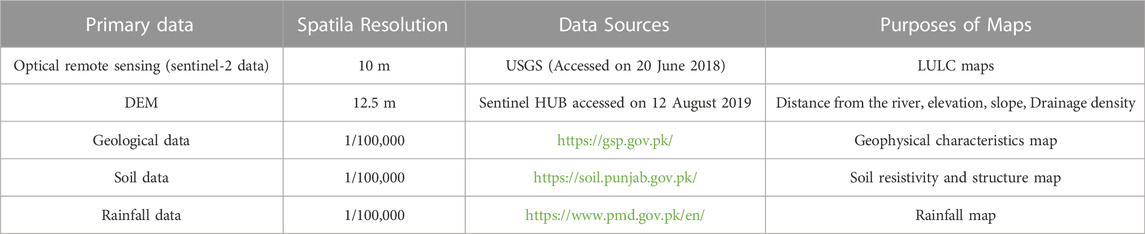
TABLE 1. The sources from which various data were gathered and their implementation purpose.
Water keeps the tendency of flow from higher to elevation to lower elevation. The data on elevation shows the changes in the structure of the ground over a catchment area (Waqas et al., 2021a). In our study, the areas with lower elevation are more susceptible than higher elevation. In lower plains, the drainage is insufficient to drain all the water off. Therefore, the influx of water accumulates more in the lower elevations and proves hazardous. The DEM was used to differentiate several aspects (Tariq et al., 2021f). The relationship between the elevation and flood and hence the most prone areas are given in Figure 3A.
The hydrology of a catchment is always subjected to many attributes, which eventually define the magnitude of the external overflow. These factors govern the overland penetration, movement, and subsurface and length of stream. The combination of slope angles defines the shape of the slope. The slope is ultimately related to the composition of the soil, lithology, the organic and inorganic composition of the soil, and drainage (Sajjad et al., 2019). With the help of arc GIS, a slope chart was prepared to give different slope classes. The outcomes of the classification of the slope and hence the classification is provided in the (Figure 3B).
Soil structure, texture, and moisture contents are the essential parameters to be considered during the flood assessment. Soil texture can markedly affect floods (Khan et al., 2011) because in sandy soil water is quickly drained and a little water is left for runoff. The clay soils induce flood more and hence the probability of flood rises when drainage of water decreases. We have designed the soil map based on the infiltration capabilities. The soil of the Jhelum district in this study has been classified into 3 classes; highly infiltrated, medium infiltrated, and less infiltrated. To assign weightage to each soil class, the soil with a high flood rate was ranked as 3 and the soil with a low rate was ranked as 1 (Figure 3C).
High rainfall is the direct cause of the heavy flood. Most of the flooding in Jhelum is recorded during summer ranging from July till September (Table 2). It is mostly because of the monsoon rainfall during the monsoon showers and high temperatures during the summer. During summer it was observed that heavy rainfall generates more runoff water (Moazzam et al., 2022). As a result, the volume of water that runs off during a downpour is crucial. Since a positive deviation in rainfall results in a flood and a negative departure in rainfall results in a drought, the variance in rainfall was employed as the starting point for the research of the flood. To mapping of the rainfall deviation, 5-year rainfall data was taken from the Meteorological department of Pakistan as. The following equation was used to calculate rainfall deviation.
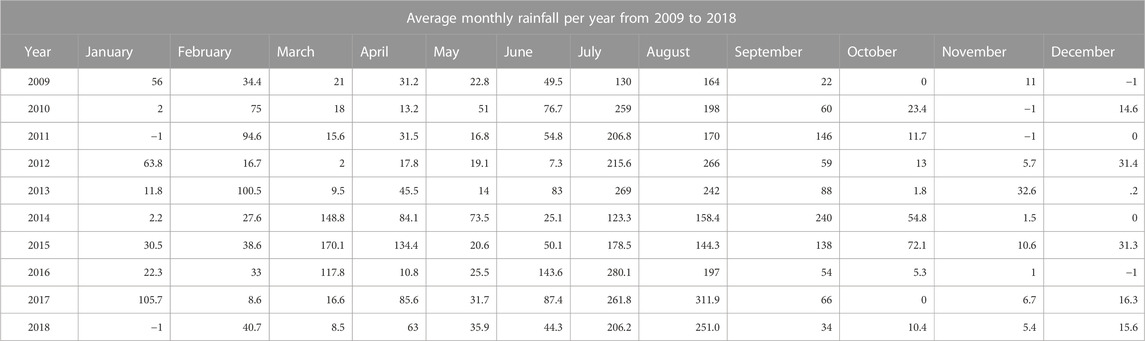
TABLE 2. Last 10-year monthly rainfall data from 2009 to 2018 in District Jhelum.
In the above equation Q = Rainfall deviation, L = recorded rainfalls, Z = the average rainfall. For mapping in this study, the IDW interpolation was used in ArcGIS (Hussain et al., 2011), as shown in the Figure 3D.
A measure of the river’s overall length relative to its total area (Tariq et al., 2022b) is expressed by drainage density. In this work, the Strahler has been followed to evaluate the stream order (Strahler, 1952). Higher weightage was given to lower drainage density areas, while lower weightage was given to the areas with efficient drainage. Based on drainage density layer the sub-groups have been divided into six classes. The areas with low drainage density have been assigned a score of 0–6, while those with a higher drainage thickness are provided with 6 (Figure 3E).
The areas which are in closeness to the river have been inundated much historically. The areas near the river are more vulnerable whether it is a normal flood or flash flood. During heavy rainfall, the areas of lower plains specifically fall prey to the deluge (Tariq et al., 2021f). In this study, the areas less at a distance less than 200 m were declared the most susceptible areas. The areas 3,000 m away are at minimum risk or no risk at all (Figure 3F).
The hydrological response is dependent mainly on the geology of a catchment (Siddiqui et al., 2018). The earth’s top layer and the successive layers down the earth define the amount of runoff. Comparatively, the impermeable layer offers more runoff than the impermeable layer. Lower basin is being composed of clay soil is highly vulnerable to flooding. This research examined the role of different layers of rock and soil in the occurrence of floods by measuring their permeability. Each layer was assigned a weightage and finally, a susceptibility guide was built up. The geological features of the basin are presented in Figure 3G.
Flood mapping is a complex process and relies on a bunch of variables. LULC is one of the variables to be considered during flood mapping. Land cover is not uniform across a catchment area and is subjected to both natural vegetation cover and man-made manipulations. Land cover such as grassland, scrubby layer, tree layer which cover the surface of the earth, play a key role in determining flood impact and hence the outcomes. Different vegetation cover has different retention capacity and therefore control the runoff to varying extent presented in Figure 3H. Thus, LULC utilization are critical variables during the flood analysis (Mahmood et al., 2016).
The technique centers on developing a matrix that depicts the relative value of each candidate solution. Policymakers use it when relevant to explain phenomena and make confident decisions. In the AHP factors are evaluated, weightage is given to each variable and factor that contributes to the flood. The AHP is one of the most acceptable multi-criteria decision-making approaches (Waqas et al., 2021a).
The frequency ratio method of analysis is widely used in hydrological research. Statistics in FR are based on the correlation between dependent and independent variables in space. The spatial association between the dependent and independent variables makes the basis of FR statistical studies (Rahman et al., 2021). In this study, the flood-inducing factor like the rainfall, topography, slope, climatic conditions, and local factors were taken as the independent factors. The frequency ratio model has been used as a successful tool in several other studies.
The conditioned flood maps used in this analysis were created in a raster format with a pixel size of 12 m. It was therefore possible to calculate frequency ratios for each class of conditioning factors by superimposing the inventory map on top of the maps of those factors (Zhang et al., 2019). After that, we used the ratio from the frequency table to determine the importance of each variable class. The major components and their impact on the flash flood were validated and chosen using the selection of correlation-based characteristics.
The vulnerability of different areas in the district Jhelum was classified into two sections of 30% and 70% ratios. Here, we sampled the conditioning factors required to train the data set weight with 70% of the susceptibility data. The remaining 30% of the data on susceptibility was used to draw samples of the conditioning factors used to determine the weight of evaluation. A model’s effectiveness with respect to the training subset and the test set might be affected by the ratio’s collection. In this simulation, we chose a 70/30 split. All these steps were carried out using Arc GIS 10.8 (Moazzam et al., 2020).
In our analysis, specifically, we employed AHP modeling to compare and contrast a few key flood-causing factors and get their respective Selected Factor Weight Values (SFWVs) (Waqas et al., 2021a). A survey was made in the Jhelum district to evaluate the relative implication of diverse flood factors and their position on given preferences. It is always a challenging task to determine which factor is more potential cause of flood in a certain region as resulted in Table 3. A numerical value was determined for one of these factors.
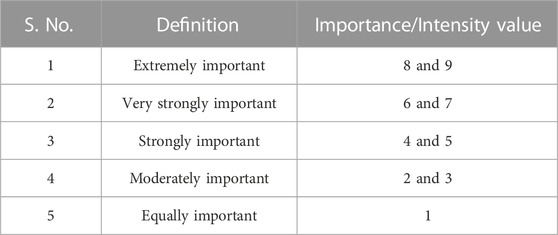
TABLE 3. Quantitative evaluation of the relative importance of several flood-triggering elements.
Keeping in view the meanings and importance values of the flood variables a pairwise contrast matrix was constructed. Values were assigned to all the variables starting from 1–9 to all the flood causing variables. The weights and values were given because of the relative significance of all the flood causing variables (Islam M. M. et al., 2022). The weights given to each possibility mirrored each other’s opposites (Table 4).
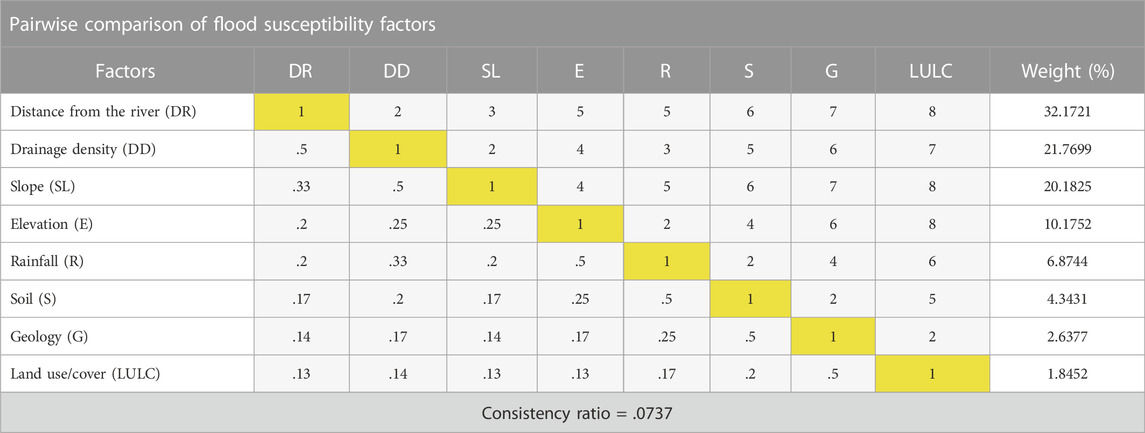
TABLE 4. The characteristics that contribute to floods and the component weights they were given in the flood susceptibility mapping (SFWVs).
The AHP method was used to get the hierarchical structure of all the components that lead to a flood, and the eigenvector of the selected weight factor was examined and adjusted by determining the CR (Mondal and Maiti, 2013; Khosravi et al., 2016; Ali et al., 2019). The accuracy and importance of the resulting rankings can be evaluated by comparing the factor weight value of various factors. As a result, the following Eq. (2) was used to get the eigenvector:
where λ stands for eigenvalue, x stands for eigenvector of n criteria, and a stands for comparison matrix of n criteria. A stable reciprocal matrix has a maximum eigenvalue (λ max) = total number of comparisons. For this reason, calculating the ratio of consistency is crucial. When the CR hits 0.1, the judgment collection is deemed inconsistent and must be repeated. Equally, if the CR number is close to 0, the judgment is totally consistent, and a value between 0 and 0.1 is frequently referred to as consistent. The following Eq. (3) can be used to calculate the consistency quotient:
In above Eq. (3) CR = consistency ratio, CI = consistency index, RI = random index. The calculation of RI was made based on. However, the following equation was used to calculate CI:
Where λmax = cumulative number, and N represents the cumulative number of sub factors. When multiple variables contribute to an event’s final outcome, like in the case of ecotourism evaluations, AHP can be used on a variety of scales (Alexakis and Sarris, 2014), for the collection of land and development of postharvest technology, for the assessment of transmission of an infectious disease. Overall methodology of used in current research is given as Figure 4.
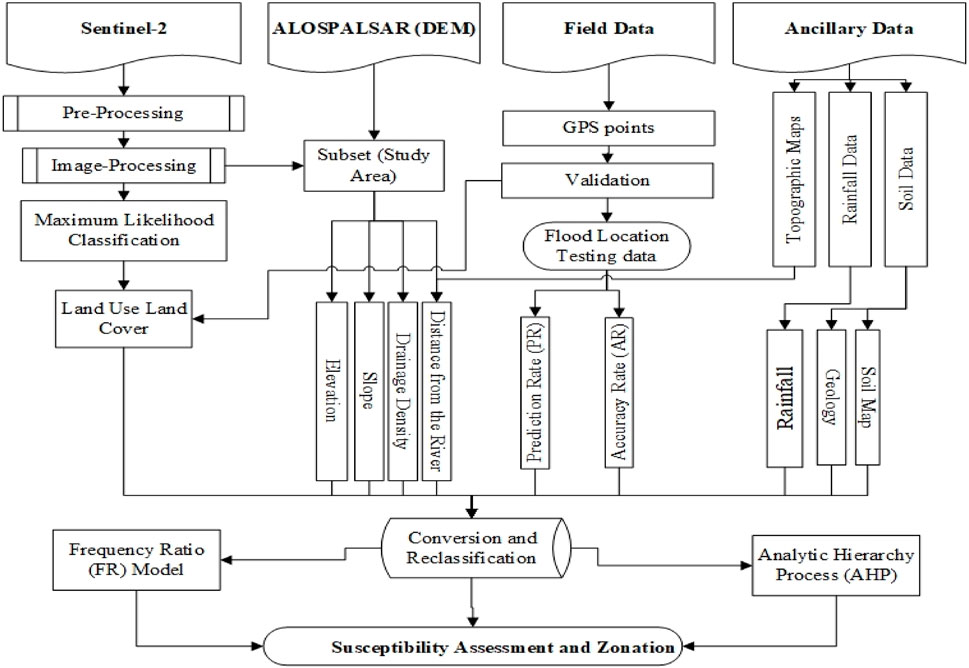
FIGURE 4. This study’s approach is depicted as a flowchart.
We used the following equation to calculate the Frequency Ratio (FR) for every class of selected factors;
Where n = cumulative number of variables chosen (n = 7), ωi = weight of variables and FR = frequency ratio of each class.
Flood susceptibility mapping is one of the approaches that help policymakers to devise a plan to decrease a risk factor. Being fed by the river Jhelum, the District of Jhelum is always prone to flooding, especially during the monsoon showers. Historically, the area has many catastrophic events. There are many independent flood-inducing conditions and have played important roles during the flood history of the region. A statistical dataset was prepared for all the eight conditioning factors as given in Figure 5. The spatial relationship of all these eight factors with flood risk is given below. Weight values were assigned to each factor. Weight value shows the relative importance based on each class and provides detail for understanding the role in the generation of the flood (Tariq et al., 2022d).
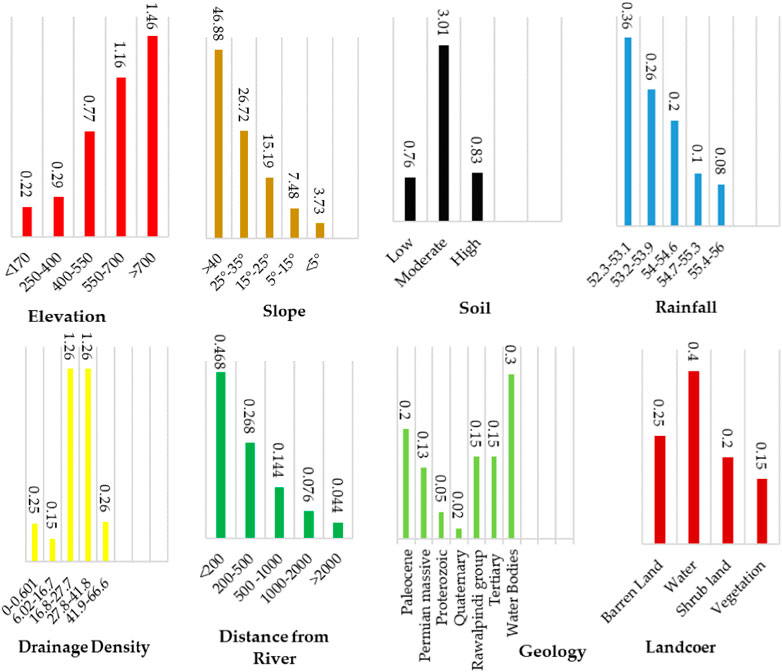
FIGURE 5. Factors that increase the likelihood of flooding, used to create a flood risk map based on class frequency ratios.
A quantitative analysis was made to establish a relationship between the historic site of flooding and the geographical and geological variables that influence the flash flood events as shown in Figure 5. According to the results, the altitude class vector was heavily skewed toward the 170–700 m elevation range. In terms of soil slope angle, the highest value was found in the 45° and higher category. A greater amount of emphasis is placed on the northwest slope. There was a much larger effect of the weights in the 400–400 m vector distance from the fault class than there was in any other group. Following an investigation into the river’s length, it was determined that the greatest load that the soil could support given its inclination was 2500 meters class. The second highest weight was taken by the rainfall layer as given in Table 4. Given these results, it was clear that the critical frequency of flash floods (Zhang et al., 2021) belonged to the rainfall class. In addition to the other factors, rainfall amounts above this threshold may potentially induce floods, depending on the duration. When comparing different land uses, vegetation and residential land uses along the river and on moderate slopes were given greater weighting factors. The geology of this area had more weight than any other factor.
The purpose of our research was to establish a connection between flood-prone areas and the causes of flooding. After taking into account all of the data, it was determined that precipitation levels are a strong predictor of both drought and flooding (Zhang et al., 2019). More precipitation than usual is represented by a higher range, whereas a lower range implies drier-than-usual conditions. Each factor’s weight in the AHP reflects its relative importance based on the others. The value of the class weight demonstrates the relative significance of the various classes for each element and offers insightful particulars that can be used to investigate the function of flood generation, as described in (Figure 5). The rainfall was considered to identify the risk of flood. Figures 3, 5 indicate that there was a deviation of rainfall ranging 18–137 mm, which gives an FR value of less than 1, indicating these areas to be more vulnerable to flood as compared to less precipitation region. Having FR values below 1 indicates a protective relationship between flood hazard and elevations between 2.5 and 5.0. Estimated FR values varied from 2.077 to 4.911 on slopes steeper than 45 degrees and 5–40 degrees, respectively, showing that this region of the research area is more prone to flooding. The corresponding slope angles ranged from 3.73 degrees to 46.88 degrees. There were more severe floods in some areas along the riverbanks than in others, and vice versa. According to the river distance analysis, a distance of 2,500 m from the river had values of FR ranging from .54 to .56, 1.21 to 1.26, and .48 to .54, indicating that places further away from the river had a lower F value and, as a result, less risk was involved.
Final susceptibility zones were constructed using the factor weight and the class values obtained from the FR and AHP studies based on the volume of the weight and using the GIS environment. Similar to what is done in, the SCWV of all selected subsets of the same variable was employed (Figure 5). In order to determine a region’s sensitivity to flooding, we added up the FR values for all of the potential causes (Siddiqui et al., 2020a; 2020b; Tariq et al., 2020; Tariq and Shu, 2020). The flood susceptibility index was calculated by the summation of all the flood-inducing factors identified. A higher flood susceptibility index shows a greater possibility of flood events. On the contrary, the lower FSI value suggests that chance of a flood event is less. To identify and recognize the flood risk zones, the FSI database was organized into 5 susceptibility areas (Mousa et al., 2020; Freeshah et al., 2021; Tariq et al., 2021f; Zainab et al., 2021). The zones were categorized into very low, low, moderate, high, and very high-risk zones, covering an area of 2,458.26, 361.87, 496.11, 239.81, and 86.25 km2, respectively (Table 5). During the visit to affected areas (Mattalia et al., 2021), some severely damaged areas were identified. The following areas were damaged mostly in the past flood history.
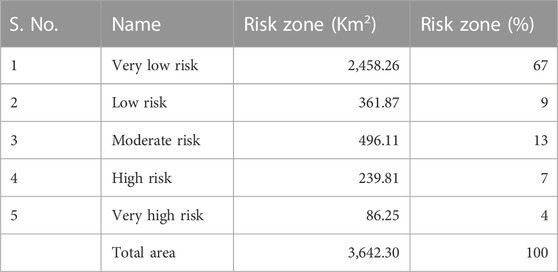
TABLE 5. Flood estimated risk zones in km2.
Assessment and confirmation of accuracy are key procedures in flood risk management and vulnerability studies (Mohammadi et al., 2021; Mumtaz et al., 2021; Rahman et al., 2021; Shah et al., 2021). In order to verify the validity of the performed analysis and model, an accuracy evaluation is conducted. Several metrics, such as area under the curve, prediction of accuracy, and success rate, can be used to assess the precision and validity of a measurement. Accuracy was evaluated in this work by measuring PA and SR at flood training and test sites using the following Eqs 7, 8.
Where ap is the number of times that an item was accurately tested for food safety, tp is the number of times that any item was tested for safety, sp is the number of times that an item was successfully trained, and tnp is the number of times that any item was trained. Prediction accuracy (PA) and success rates (SR) are two measures of how well a forecast really turns out. Using the preceding formulae, an accuracy value of 1.0 indicates that the model has been handled without bias, whereas a value of less than 0.75 is considered to be the norm. The success rate was calculated using a sample of 210 (70%) of the locations utilized in the FR simulation, while the forecast accuracy was calculated using 90 (30%) of the flood locations observed throughout the simulation (Hamza et al., 2021; Tariq et al., 2021c; 2021g; 2021b). Also, areas that are at low, medium, high, or extremely high risk of experiencing flooding in the future have been designated as such. It was calculated that the forecast's accuracy was 0.81 (or 81%) and its success rate was 0.84 (or 84%) (Table 6). It was concluded that the frequency ratio model should be employed for the flood analysis of the Jhelum district in Punjab because it has a forecast accuracy of more than 80%.
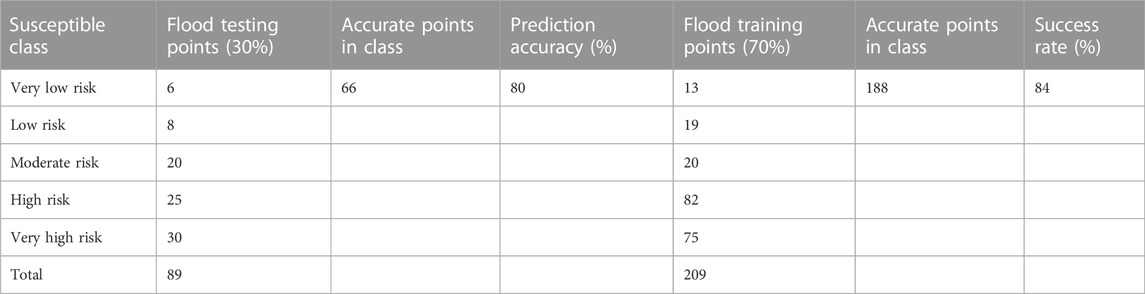
TABLE 6. Accuracy and success rate of flood prediction are estimated using a susceptibility mapping approach.
The role of susceptibility maps can't be negated in the flood management system of Jhelum District by the management departments of the government. This flood analysis was performed to establish a map of all the susceptible areas of the Jhelum District. The main goal of this research was to increase understanding of emergency management among citizens, local governments, and other government agencies. Past flood dangers and incidents that occurred regularly over a period were analyzed using a frequency ratio calculated from flood and non-flood based data. In this study, we used geographical data from a variety of sources to provide a complete picture. The study relied on a restricted version of the publically available ALOS-PALSER DEM, which had a resolution of 12.5 m. More precise flood mapping can be achieved with increased DEM resolution. According to the results, the most important elements that contributed to the occurrence of a flood were the following: distance from the river (0.245), rainfall variance (0.315), land use/cover (0.256), and soil clay content (0.521). The SFWV for slope angle was 0.1235 and the SFWV for elevation was 0.325; both of these factors contributed to the floods. Since the Jhelum area is rather flat close to the river Jhelum, the study shows that climatic (rainfall) and locally-based factors have a much more substantial effect than topographic (elevation and slope) considerations. The prediction accuracy was 81% and the success rate was 84%, as determined by validation results based on flood position data.
The original contributions presented in the study are included in the article/supplementary material, further inquiries can be directed to the corresponding authors.
MM: Conceptualization, methodology, software, formal analysis, visualization, data curation, writing—original draft, investigation, validation, writing—review and editing. LL: Methodology, software, formal analysis, visualization, data curation, writing—original draft, investigation, validation, writing—review and editing. MA: Writing—review and editing. AT: Methodology, software, formal analysis, visualization, data curation, writing— original draft, investigation, validation, writing—review and editing, supervision. SQ: Methodology, software, formal analysis, visualization, data curation, writing—original draft, investigation, validation, writing—review and editing. ME-H: Writing—review and editing. MES: Writing—review and editing. AA: Writing—review and editing. QL: Writing—review and editing. All authors have read and agreed to the published version of the manuscript.
This work is supported by the National Natural Science Foundation of China (grant nos. 42071321 and 41901292).
Special thanks to MES and Department of Biotechnology, College of Science, Taif University. The authors extend their appreciation to Taif University for funding the current work by the Taif University Researchers Supporting Project, number (TURSP-2020/139), Taif University.
The authors declare that the research was conducted in the absence of any commercial or financial relationships that could be construed as a potential conflict of interest.
All claims expressed in this article are solely those of the authors and do not necessarily represent those of their affiliated organizations, or those of the publisher, the editors and the reviewers. Any product that may be evaluated in this article, or claim that may be made by its manufacturer, is not guaranteed or endorsed by the publisher.
Abbas, I., Liu, J., Amin, M., Tariq, A., and Tunio, M. H. (2021). Strawberry fungal leaf scorch disease identification in real-time strawberry field using deep learning architectures. Plants 10, 2643. doi:10.3390/plants10122643
Abdullahi, S., and Pradhan, B. (2018). Land use change modeling and the effect of compact city paradigms: Integration of GIS-based cellular automata and weights-of-evidence techniques. Environ. Earth Sci. 77, 251–315. doi:10.1007/s12665-018-7429-z
Ahmad, A., Ahmad, S. R., Gilani, H., Tariq, A., Zhao, N., Aslam, R. W., et al. (2021). A synthesis of spatial forest assessment studies using remote sensing data and techniques in Pakistan. Forests 12, 1211. doi:10.3390/f12091211
Alexakis, D. D., and Sarris, A. (2014). Integrated GIS and remote sensing analysis for landfill sitting in Western Crete, Greece. Environ. Earth Sci. 72, 467–482. doi:10.1007/s12665-013-2966-y
Ali, S. A., Khatun, R., Ahmad, A., and Ahmad, S. N. (2019). Application of GIS-based analytic hierarchy process and frequency ratio model to flood vulnerable mapping and risk area estimation at Sundarban region, India. Model. Earth Syst. Environ. 5, 1083–1102. doi:10.1007/s40808-019-00593-z
Aslam, M., Ye, D., Tariq, A., Asad, M., Hanif, M., Ndzi, D., et al. (2022). Adaptive machine learning based distributed denial-of-services attacks detection and mitigation system for SDN-enabled IoT. Sensors 22, 2697. doi:10.3390/s22072697
Baloch, M. Y. J., Zhang, W., Chai, J., Li, S., Alqurashi, M., Rehman, G., et al. (2021). Shallow groundwater quality assessment and its suitability analysis for drinking and irrigation purposes. WaterSwitzerl. 13, 3361–3425. doi:10.3390/w13233361
Baqa, M. F., Chen, F., Lu, L., Qureshi, S., Tariq, A., Wang, S., et al. (2021). Monitoring and modeling the patterns and trends of urban growth using urban sprawl matrix and CA-markov model: A case study of karachi, Pakistan. Land 10, 700. doi:10.3390/land10070700
Baqa, M. F., Lu, L., Chen, F., Nawaz-ul-Huda, S., Pan, L., Tariq, A., et al. (2022). Characterizing spatiotemporal variations in the urban thermal environment related to land cover changes in karachi, Pakistan, from 2000 to 2020. Remote Sens. 14, 2164. doi:10.3390/rs14092164
Basharat, M. ul, Khan, J. A., Khalil, U., Tariq, A., Aslam, B., and Li, Q. (2022). Ensuring earthquake-proof development in a swiftly developing region through neural Network modeling of earthquakes using nonlinear spatial variables. Buildings 12, 1713. doi:10.3390/buildings12101713
Basin, I. (2021). Water availability, use and challenges in Pakistan - water sector challenges in the Indus Basin and impact of climate change. doi:10.4060/cb0718en
Bera, D., Das Chatterjee, N., Mumtaz, F., Dinda, S., Ghosh, S., Zhao, N., et al. (2022). Integrated influencing mechanism of potential drivers on seasonal variability of LST in Kolkata municipal corporation, India. Land 11, 1461. doi:10.3390/land11091461
Braimah, M. M., Abdul-rahaman, I., Sekyere, D. O., Momori, P. H., Abdul-mohammed, A., and Dordah, G. A. (2014). Assessment of waste management systems in second cycle institutions of the bolgatanga municipality , upper east , Ghana. Int. J. Pure Appl. Biosci. 2, 189–195.
Chen, Z., Liu, Z., Yin, L., and Zheng, W. (2022). Statistical analysis of regional air temperature characteristics before and after dam construction. Urban Clim. 41, 101085. doi:10.1016/j.uclim.2022.101085
Chohan, K., Ahmad, S. R., Islam, Z., and Adrees, M. (2015). Riverine flood damage assessment of cultivated lands along chenab river using GIS and remotely sensed data: A case study of district hafizabad, Punjab, Pakistan. J. Geogr. Inf. Syst. 07, 506–526. doi:10.4236/jgis.2015.75041
Costache, R., Trung Tin, T., Arabameri, A., Crăciun, A., Ajin, R. S., Costache, I., et al. (2022). Flash-flood hazard using deep learning based on H2O R package and fuzzy-multicriteria decision-making analysis. J. Hydrol. 609, 127747. doi:10.1016/j.jhydrol.2022.127747
da Silva Monteiro, L., de Oliveira-Júnior, J. F., Ghaffar, B., Tariq, A., Qin, S., Mumtaz, F., et al. (2022). Rainfall in the urban area and its impact on climatology and population growth. Atmos. (Basel). 13, 1610. doi:10.3390/atmos13101610
Dang, N. M., Babel, M. S., and Luong, H. T. (2011). Evaluation of food risk parameters in the day river flood diversion area, red river delta, vietnam. Nat. Hazards 56, 169–194. doi:10.1007/s11069-010-9558-x
Das, S. (2019). Geospatial mapping of flood susceptibility and hydro-geomorphic response to the floods in Ulhas basin, India. Remote Sens. Appl. Soc. Environ. 14, 60–74. doi:10.1016/j.rsase.2019.02.006
Eckstein, D., Hutfils, M.-L., and Winges, M. (2019). BRIEFING PAPER, GLOBAL CLIMATE RISK INDEX 2019, who suffers most from extreme weather events? Weather-related loss events in 2017 and 1998 to 2017.
Felegari, S., Sharifi, A., Moravej, K., Amin, M., Golchin, A., Muzirafuti, A., et al. (2021). Integration of sentinel 1 and sentinel 2 satellite images for crop mapping. Appl. Sci. 11, 10104. doi:10.3390/app112110104
Felegari, S., Sharifi, A., and Moravej, K. (2022). Investigation of the relationship bet een NDVI inde , soil moisture , and precipitation data using satellite images. Sustainability 12.
Freeshah, M., Zhang, X., Şentürk, E., Adil, M. A., Mousa, B. G., Tariq, A., et al. (2021). Analysis of atmospheric and ionospheric variations due to impacts of super typhoon mangkhut (1822) in the northwest pacific ocean. Remote Sens. 13, 661. doi:10.3390/rs13040661
Fu, C., Cheng, L., Qin, S., Tariq, A., Liu, P., Zou, K., et al. (2022). Timely plastic-mulched cropland extraction method from complex mixed surfaces in arid regions. Remote Sens. 14, 4051. doi:10.3390/rs14164051
Ghaderizadeh, S., Abbasi-Moghadam, D., Sharifi, A., Tariq, A., and Qin, S. (2022). Multiscale dual-branch residual spectral-spatial Network with attention for hyperspectral image classification. IEEE J. Sel. Top. Appl. Earth Obs. Remote Sens. 15, 5455–5467. doi:10.1109/JSTARS.2022.3188732
Ghaderizadeh, S., Abbasi-Moghadam, D., Sharifi, A., Zhao, N., and Tariq, A. (2021). Hyperspectral image classification using a hybrid 3D-2D convolutional neural networks. IEEE J. Sel. Top. Appl. Earth Obs. Remote Sens. 14, 7570–7588. doi:10.1109/JSTARS.2021.3099118
Hamza, S., Khan, I., Lu, L., Liu, H., Burke, F., Nawaz-ul-Huda, S., et al. (2021). The relationship between neighborhood characteristics and homicide in karachi, Pakistan. Sustainability 13, 5520. doi:10.3390/su13105520
Haq, S. M., Tariq, A., Li, Q., Yaqoob, U., Majeed, M., Hassan, M., et al. (2022). Influence of edaphic properties in determining forest community patterns of the zabarwan mountain range in the Kashmir Himalayas. Forests 13, 1214. doi:10.3390/f13081214
Hu, P., Sharifi, A., Tahir, M. N., Tariq, A., Zhang, L., Mumtaz, F., et al. (2021). Evaluation of vegetation indices and phenological metrics using time-series MODIS data for monitoring vegetation change in Punjab, Pakistan. Water 13, 2550. doi:10.3390/w13182550
Hussain, E., Ural, S., Malik, A., and Shan, J. (2011). Mapping Pakistan 2010 floods using remote sensing data. Am. Soc. Photogramm. Remote Sens. Annu. Conf. 2011, 215–222.
Hussain, S., Lu, L., Mubeen, M., Nasim, W., Karuppannan, S., Fahad, S., et al. (2022a). Spatiotemporal variation in land use land cover in the response to local climate change using multispectral remote sensing data. Land 11, 595. doi:10.3390/land11050595
Hussain, S., Qin, S., Nasim, W., Bukhari, M. A., Mubeen, M., Fahad, S., et al. (2022b). Monitoring the dynamic changes in vegetation cover using spatio-temporal remote sensing data from 1984 to 2020. Atmos. (Basel) 13, 1609. doi:10.3390/atmos13101609
Imran, M., Ahmad, S., Sattar, A., and Tariq, A. (2022). Mapping sequences and mineral deposits in poorly exposed lithologies of inaccessible regions in Azad Jammu and Kashmir using SVM with ASTER satellite data. Arab. J. Geosci. 15, 538. doi:10.1007/s12517-022-09806-9
Islam, F., Riaz, S., Ghaffar, B., Tariq, A., Shah, S. U., Nawaz, M., et al. (2022a). Landslide susceptibility mapping (LSM) of Swat District, Hindu Kush Himalayan region of Pakistan, using GIS-based bivariate modeling. Front. Environ. Sci. 10, 1–18. doi:10.3389/fenvs.2022.1027423
Islam, M. M., Ujiie, K., Noguchi, R., and Ahamed, T. (2022b). Flash flood-induced vulnerability and need assessment of wetlands using remote sensing, GIS, and econometric models. Remote Sens. Appl. Soc. Environ. 25, 100692. doi:10.1016/j.rsase.2021.100692
Jalayer, S., Sharifi, A., Abbasi-Moghadam, D., Tariq, A., and Qin, S. (2022). Modeling and predicting land use land cover spatiotemporal changes: A case study in chalus watershed, Iran. IEEE J. Sel. Top. Appl. Earth Obs. Remote Sens. 15, 5496–5513. doi:10.1109/JSTARS.2022.3189528
Khalid, B., Cholaw, B., Alvim, D. S., Javeed, S., Khan, J. A., Javed, M. A., et al. (2018). Riverine flood assessment in Jhang district in connection with ENSO and summer monsoon rainfall over Upper Indus Basin for 2010. Nat. Hazards 92, 971–993. doi:10.1007/s11069-018-3234-y
Khalil, U., Azam, U., Aslam, B., Ullah, I., Tariq, A., Li, Q., et al. (2022a). Developing a spatiotemporal model to forecast land surface temperature: A way forward for better town planning. Sustainability 14, 11873. doi:10.3390/su141911873
Khalil, U., Imtiaz, I., Aslam, B., Ullah, I., Tariq, A., and Qin, S. (2022b). Comparative analysis of machine learning and multi-criteria decision making techniques for landslide susceptibility mapping of Muzaffarabad district. Front. Environ. Sci. 10, 1–19. doi:10.3389/fenvs.2022.1028373
Khan, A. M., Li, Q., Saqib, Z., Khan, N., Habib, T., Khalid, N., et al. (2022). MaxEnt modelling and impact of climate change on habitat suitability variations of economically important chilgoza pine (pinus gerardiana wall.) in south asia. Forests 13, 715. doi:10.3390/f13050715
Khan, B., Iqbal, M. J., and Yosufzai, M. A. K. (2011). Flood risk assessment of river Indus of Pakistan. Arab. J. Geosci. 4, 115–122. doi:10.1007/s12517-009-0110-9
Kheradmand, S., Seidou, O., Konte, D., and Barmou Batoure, M. B. (2018). Evaluation of adaptation options to flood risk in a probabilistic framework. J. Hydrol. Reg. Stud. 19, 1–16. doi:10.1016/j.ejrh.2018.07.001
Khosravi, K., Nohani, E., Maroufinia, E., and Pourghasemi, H. R. (2016). A GIS-based flood susceptibility assessment and its mapping in Iran: A comparison between frequency ratio and weights-of-evidence bivariate statistical models with multi-criteria decision-making technique. Nat. Hazards 83, 947–987. doi:10.1007/s11069-016-2357-2
Kundzewicz, Z., Su, B., Wang, Y., Xia, J., Huang, J., and Jiang, T. (2019). Flood risk and its reduction in China. Adv. Water Resour. 130, 37–45. doi:10.1016/J.ADVWATRES.2019.05.020
Mahmood, S., Khan, A. ul H., and Mayo, S. M. (2016). Exploring underlying causes and assessing damages of 2010 flash flood in the upper zone of Panjkora River. Nat. Hazards 83, 1213–1227. doi:10.1007/s11069-016-2386-x
Majeed, M., Bhatti, K. H., Pieroni, A., Sõukand, R., Bussmann, R. W., Khan, A. M., et al. (2021a). Gathered wild food plants among diverse religious groups in Jhelum District, Punjab, Pakistan. Foods 10, 594–628. doi:10.3390/foods10030594
Majeed, M., Lu, L., Haq, S. M., Waheed, M., Sahito, H. A., Fatima, S., et al. (2022a). Spatiotemporal distribution patterns of climbers along an abiotic gradient in Jhelum district, Punjab, Pakistan. Forests 13, 1244. doi:10.3390/f13081244
Majeed, M., Mahmood, A., Habib, T., Mushahid, M., Ali, H., Khan, N., et al. (2022b). Vegetation analysis and environmental indicators of an arid tropical forest ecosystem of Pakistan. Ecol. Indic. 142, 109291. doi:10.1016/j.ecolind.2022.109291
Majeed, M., Tariq, A., Anwar, M. M., Khan, A. M., Arshad, F., Mumtaz, F., et al. (2021b). Monitoring of land use–land cover change and potential causal factors of climate change in Jhelum district, Punjab, Pakistan, through GIS and multi-temporal satellite data. Land 10, 1026. doi:10.3390/land10101026
Majeed, M., Tariq, A., Haq, S. M., Waheed, M., Anwar, M. M., Li, Q., et al. (2022c). A detailed ecological exploration of the distribution patterns of wild poaceae from the Jhelum district (Punjab), Pakistan. Sustainability 14, 3786. doi:10.3390/su14073786
Martinis, S., Twele, A., and Voigt, S. (2009). Towards operational near real-time flood detection using a split-based automatic thresholding procedure on high resolution TerraSAR-X data. Nat. Hazards Earth Syst. Sci. 9, 303–314. doi:10.5194/nhess-9-303-2009
Mattalia, G., Sõukand, R., Corvo, P., and Pieroni, A. (2021). We became rich and we lost everything”: Ethnobotany of remote mountain villages of abruzzo and molise, Central Italy. Hum. Ecol. 49, 217–224. doi:10.1007/s10745-020-00209-6
Moazzam, M. F. U., Lee, B. G., Rahman, A. U., Farid, N., and Rahman, G. (2020). Spatio-statistical analysis of flood susceptibility assessment using bivariate model in the floodplain of river swat, district charsadda, Pakistan. J. Geosci. Environ. Prot. 08, 159–175. doi:10.4236/gep.2020.85010
Moazzam, M. F. U., Rahman, G., Munawar, S., Tariq, A., Safdar, Q., and Lee, B. (2022). Trends of rainfall variability and drought monitoring using standardized precipitation index in a scarcely gauged basin of northern Pakistan. Water 14, 1132. doi:10.3390/w14071132
Moazzam, M. F. U., Vansarochana, A., and Rahman, A. U. (2018). Analysis of flood susceptibility and zonation for risk management using frequency ratio model in District Charsadda, Pakistan. Int. J. Environ. Geoinformatics 5, 140–153. doi:10.30897/ijegeo.407260
Mohammadi, M., Sharifi, A., Hosseingholizadeh, M., and Tariq, A. (2021). Detection of oil pollution using sar and optical remote sensing imagery: A case study of the Persian gulf. J. Indian Soc. Remote Sens. 6, 2377–2385. doi:10.1007/s12524-021-01399-2
Mondal, S., and Maiti, R. (2013). Integrating the Analytical Hierarchy Process (AHP) and the frequency ratio (FR) model in landslide susceptibility mapping of Shiv-khola watershed, Darjeeling Himalaya. Int. J. Disaster Risk Sci. 4, 200–212. doi:10.1007/s13753-013-0021-y
Mousa, B. G., Shu, H., Freeshah, M., and Tariq, A. (2020). A novel scheme for merging active and passive satellite soil moisture retrievals based on maximizing the signal to noise ratio. Remote Sens. 12, 3804–3823. doi:10.3390/rs12223804
Mumtaz, F., Arshad, A., Mirchi, A., Tariq, A., Dilawar, A., Hussain, S., et al. (2021). Impacts of reduced deposition of atmospheric nitrogen on coastal marine eco-system during substantial shift in human activities in the twenty-first century. Geomatics, Nat. Hazards Risk 12, 2023–2047. doi:10.1080/19475705.2021.1949396
Nashwan, M. S., Shahid, S., and Wang, X. (2019). Assessment of satellite-based precipitation measurement products over the hot desert climate of Egypt. Remote Sens. 11, 555. doi:10.3390/rs11050555
Nyaupane, G. P., and Chhetri, N. (2009). Vulnerability to climate change of nature-based tourism in the Nepalese Himalayas. Tour. Geogr. 11, 95–119. doi:10.1080/14616680802643359
Pal, S., and Ziaul, S. (2017). Detection of land use and land cover change and land surface temperature in English Bazar urban centre. Egypt. J. Remote Sens. Sp. Sci. 20, 125–145. doi:10.1016/j.ejrs.2016.11.003
Polychronaki, A., Gitas, I. Z., Veraverbeke, S., and Debien, A. (2013). Evaluation of ALOS PALSAR imagery for burned area mapping in Greece using object-based classification. Remote Sens. 5, 5680–5701. doi:10.3390/rs5115680
Prasad, P., Joseph, V., Chandra, P., and Kotha, M. (2022). Ecological Informatics Evaluation and comparison of the Earth observing sensors in land cover/land use studies using machine learning algorithms. Ecol. Inf. 68, 101522. doi:10.1016/j.ecoinf.2021.101522
Rahman, M., Ningsheng, C., Mahmud, G. I., Islam, M. M., Pourghasemi, H. R., Ahmad, H., et al. (2021). Flooding and its relationship with land cover change, population growth, and road density. Geosci. Front. 12, 101224. doi:10.1016/j.gsf.2021.101224
Relief, D. (2013). Executive Summary Hazard mitigation is defined as any action taken to reduce or eliminate the long term risk to human life and property.
Sadiq Fareed, M. M., Raza, A., Zhao, N., Tariq, A., Younas, F., Ahmed, G., et al. (2022). Predicting divorce prospect using ensemble learning: Support vector machine, linear model, and neural Network. Comput. Intell. Neurosci. 2022, 1–15. doi:10.1155/2022/3687598
Sajjad, A., Lu, J. Z., Chen, X. L., Chisenga, C., and Mahmood, S. (2019). The riverine flood catastrophe in August 2010 in south Punjab, Pakistan: Potential causes, extent and damage assessment. Appl. Ecol. Environ. Res. 17, 14121–14142. doi:10.15666/aeer/1706_1412114142
Shah, S. H. I. A., Jianguo, Y., Jahangir, Z., Tariq, A., and Aslam, B. (2022). Integrated geophysical technique for groundwater salinity delineation, an approach to agriculture sustainability for Nankana Sahib Area, Pakistan. Geomatics, Nat. Hazards Risk 13, 1043–1064. doi:10.1080/19475705.2022.2063077
Shah, S. H. I. A., Yan, J., Ullah, I., Aslam, B., Tariq, A., Zhang, L., et al. (2021). Classification of aquifer vulnerability by using the DRASTIC index and geo-electrical techniques. Water 13, 2144. doi:10.3390/w13162144
Sharifi, A., Felegari, S., and Tariq, A. (2022a). Mangrove forests mapping using Sentinel-1 and Sentinel-2 satellite images. Arab. J. Geosci. 15, 1593. doi:10.1007/s12517-022-10867-z
Sharifi, A., Felegari, S., Tariq, A., and Siddiqui, S. (2021). Forest cover change detection across recent three decades in Persian oak forests using convolutional neural Network. Clim. Impacts Sustain. Nat. Resour. Manag., 57–73. doi:10.1002/9781119793403.ch4
Sharifi, A., Mahdipour, H., Moradi, E., and Tariq, A. (2022b). Agricultural field extraction with deep learning algorithm and satellite imagery. J. Indian Soc. Remote Sens. 50, 417–423. doi:10.1007/s12524-021-01475-7
Siddayao, G. P., Valdez, S. E., and Fernandez, P. L. (2014). Analytic hierarchy process (AHP) in spatial modeling for floodplain risk assessment. Int. J. Mach. Learn. Comput. 4, 450–457. doi:10.7763/ijmlc.2014.v4.453
Siddiqui, M. J., Haider, S., Gabriel, H. F., and Shahzad, A. (2018). Rainfall–runoff, flood inundation and sensitivity analysis of the 2014 Pakistan flood in the Jhelum and Chenab river basin. Hydrol. Sci. J. 63, 1976–1997. doi:10.1080/02626667.2018.1546049
Siddiqui, S., Ali Safi, M. W., Rehman, N. U., and Tariq, A. (2020a). Impact of climate change on land use/land cover of chakwal district. Int. J. Econ. Environ. Geol. 11, 65–68. doi:10.46660/ijeeg.vol11.iss2.2020.449
Siddiqui, S., Safi, M. W. A., Tariq, A., Rehman, N. U., and Haider, S. W. (2020b). GIS based universal soil erosion estimation in district chakwal Punjab, Pakistan. Int. J. Econ. Environ. Geol. 11, 30–36. doi:10.46660/ijeeg.Vol11.Iss2.2020.443
Singh, B., Venkatramanan, V., and Deshmukh, B. (2022). Monitoring of land use land cover dynamics and prediction of urban growth using Land Change Modeler in Delhi and its environs, India. Environ. Sci. Pollut. Res. 29, 71534–71554. doi:10.1007/s11356-022-20900-z
Strahler, A. N. (1952). Dynamic basis of geomorphology. Bull. Geol. Am. 63, 923–939. doi:10.1130/0016-7606(1952)63[923:dbog]2.0.co;2
Tariq, A., Mumtaz, F., Majeed, M., and Zeng, X. (2023). Spatio-temporal assessment of land use land cover based on trajectories and cellular automata Markov modelling and its impact on land surface temperature of Lahore district Pakistan. Environ. Monit. Assess. 195, 114. doi:10.1007/s10661-022-10738-w
Tariq, A., and Mumtaz, F. (2022). Modeling spatio-temporal assessment of land use land cover of Lahore and its impact on land surface temperature using multi-spectral remote sensing data. Environ. Sci. Pollut. Res. doi:10.1007/s11356-022-23928-3
Tariq, A., Mumtaz, F., Zeng, X., Baloch, M. Y. J., and Moazzam, M. F. U. (2022a). Spatio-temporal variation of seasonal heat islands mapping of Pakistan during 2000–2019, using day-time and night-time land surface temperatures MODIS and meteorological stations data. Remote Sens. Appl. Soc. Environ. 27, 100779. doi:10.1016/j.rsase.2022.100779
Tariq, A., Riaz, I., Ahmad, Z., Yang, B., Amin, M., Kausar, R., et al. (2020). Land surface temperature relation with normalized satellite indices for the estimation of spatio-temporal trends in temperature among various land use land cover classes of an arid Potohar region using Landsat data. Environ. Earth Sci. 79, 40. doi:10.1007/s12665-019-8766-2
Tariq, A., and Shu, H. (2020). CA-Markov chain analysis of seasonal land surface temperature and land use landcover change using optical multi-temporal satellite data of Faisalabad, Pakistan. Remote Sens. 12, 3402–3423. doi:10.3390/rs12203402
Tariq, A., Shu, H., Gagnon, A. S., Li, Q., Mumtaz, F., Hysa, A., et al. (2021a). Assessing burned areas in wildfires and prescribed fires with spectral indices and SAR images in the margalla hills of Pakistan. Forests 12, 1371. doi:10.3390/f12101371
Tariq, A., Shu, H., Kuriqi, A., Siddiqui, S., Gagnon, A. S., Lu, L., et al. (2021b). Characterization of the 2014 Indus river flood using hydraulic simulations and satellite images. Remote Sens. 13, 2053. doi:10.3390/rs13112053
Tariq, A., Shu, H., Li, Q., Altan, O., Khan, M. R., Baqa, M. F., et al. (2021c). Quantitative analysis of forest fires in southeastern Australia using SAR data. Remote Sens. 13, 2386. doi:10.3390/rs13122386
Tariq, A., Shu, H., Siddiqui, S., Imran, M., and Farhan, M. (2021d). Monitoring land use and land cover changes using geospatial techniques, a case study of Fateh Jang, Attock, Pakistan. Geogr. Environ. Sustain. 14, 41–52. doi:10.24057/2071-9388-2020-117
Tariq, A., Shu, H., Siddiqui, S., Imran, M., and Farhan, M. (2021e). Monitoring land use and land cover changes using geospatial techniques, A case study of fateh jang, attock, Pakistan. Geogr. Environ. Sustain. 14, 41–52. doi:10.24057/2071-9388-2020-117
Tariq, A., Shu, H., Siddiqui, S., Mousa, B. G., Munir, I., Nasri, A., et al. (2021f). Forest fire monitoring using spatial-statistical and Geo-spatial analysis of factors determining forest fire in Margalla Hills, Islamabad, Pakistan. Geomatics, Nat. Hazards Risk 12, 1212–1233. doi:10.1080/19475705.2021.1920477
Tariq, A., Shu, H., Siddiqui, S., Munir, I., Sharifi, A., Li, Q., et al. (2021g). Spatio-temporal analysis of forest fire events in the Margalla Hills, Islamabad, Pakistan using socio-economic and environmental variable data with machine learning methods. J. For. Res. 13, 183–194. doi:10.1007/s11676-021-01354-4
Tariq, A., Siddiqui, S., Sharifi, A., and Shah, S. H. I. A. (2022b). Impact of spatio-temporal land surface temperature on cropping pattern and land use and land cover changes using satellite imagery, Hafizabad District, Punjab, Province of Pakistan. Arab. J. Geosci. 15, 1045. doi:10.1007/s12517-022-10238-8
Tariq, A., Yan, J., Gagnon, A. S., Riaz Khan, M., and Mumtaz, F. (2022c). Mapping of cropland, cropping patterns and crop types by combining optical remote sensing images with decision tree classifier and random forest. Geo-spatial Inf. Sci. 00, 1–19. doi:10.1080/10095020.2022.2100287
Tariq, A., Yan, J., Ghaffar, B., Qin, S., Mousa, B. G., Sharifi, A., et al. (2022d). Flash flood susceptibility assessment and zonation by integrating analytic hierarchy process and frequency ratio model with diverse spatial data. Water 14, 3069. doi:10.3390/w14193069
Tariq, A., Yan, J., and Mumtaz, F. (2022e). Land change modeler and CA-Markov chain analysis for land use land cover change using satellite data of Peshawar, Pakistan. Phys. Chem. Earth, Parts A/B/C 128, 103286. doi:10.1016/j.pce.2022.103286
Ullah, I., Aslam, B., Shah, S. H. I. A., Tariq, A., Qin, S., Majeed, M., et al. (2022). An integrated approach of machine learning, remote sensing, and GIS data for the landslide susceptibility mapping. Land 11, 1265. doi:10.3390/land11081265
Wahla, S. S., Kazmi, J. H., Sharifi, A., Shirazi, S. A., Tariq, A., and Joyell Smith, H. (2022). Assessing spatio-temporal mapping and monitoring of climatic variability using SPEI and RF machine learning models. Geocarto Int. 0, 1–20. doi:10.1080/10106049.2022.2093411
Waqas, H., Lu, L., Tariq, A., Li, Q., Baqa, M. F., Xing, J., et al. (2021a). Flash flood susceptibility assessment and zonation using an integrating analytic hierarchy process and frequency ratio model for the chitral district, khyber pakhtunkhwa WaterSwitzerl., 13. pakistan. doi:10.3390/w13121650
Waqas, H., Lu, L., Tariq, A., Li, Q., Baqa, M. F., Xing, J., et al. (2021b). Flash flood susceptibility assessment and zonation using an integrating analytic hierarchy process and frequency ratio model for the chitral district, khyber pakhtunkhwa, Pakistan. Water 13, 1650. doi:10.3390/w13121650
Yerramilli, S. (2012). A hybrid approach of integrating HEC-RAS and GIS towards the identification and assessment of flood risk vulnerability in the city of jackson, MS. Am. J. Geogr. Inf. Syst. 1, 7–16. doi:10.5923/j.ajgis.20120101.02
Zainab, N., Tariq, A., and Siddiqui, S. (2021). Development of web-based GIS alert system for informing environmental risk of dengue infections in major cities of Pakistan. Geos. Indones. 6, 77. doi:10.19184/geosi.v6i1.20792
Zamani, A., Sharifi, A., Felegari, S., Tariq, A., and Zhao, N. (2022). Agro climatic zoning of saffron culture in miyaneh city by using WLC method and remote sensing data. Agric 12, 118–215. doi:10.3390/agriculture12010118
Zhang, K., Wang, S., Bao, H., and Zhao, X. (2019). Characteristics and influencing factors of rainfall-induced landslide and debris flow hazards in Shaanxi Province, China. Nat. Hazards Earth Syst. Sci. 19, 93–105. doi:10.5194/nhess-19-93-2019
Keywords: remote sensing, GIS, AHP, FR, sentinel-2, DEM, flash flood, susceptibility
Citation: Majeed M, Lu L, Anwar MM, Tariq A, Qin S, El-Hefnawy ME, El-Sharnouby M, Li Q and Alasmari A (2023) Prediction of flash flood susceptibility using integrating analytic hierarchy process (AHP) and frequency ratio (FR) algorithms. Front. Environ. Sci. 10:1037547. doi: 10.3389/fenvs.2022.1037547
Received: 06 September 2022; Accepted: 13 December 2022;
Published: 05 January 2023.
Edited by:
Sajjad Ahmad, University of Nevada, Las Vegas, United StatesReviewed by:
Siniša Obnjak, Military Geographical Institute, SerbiaCopyright © 2023 Majeed, Lu, Anwar, Tariq, Qin, El-Hefnawy, El-Sharnouby, Li and Alasmari. This is an open-access article distributed under the terms of the Creative Commons Attribution License (CC BY). The use, distribution or reproduction in other forums is permitted, provided the original author(s) and the copyright owner(s) are credited and that the original publication in this journal is cited, in accordance with accepted academic practice. No use, distribution or reproduction is permitted which does not comply with these terms.
*Correspondence: Aqil Tariq, YXQyMTM5QG1zc3RhdGUuZWR1, YXFpbHRhcmlxQHdodS5lZHUuY24=; Shujing Qin, c2h1amluZ3FpbkB3aHUuZWR1LmNu
†These authors share first authorship
Disclaimer: All claims expressed in this article are solely those of the authors and do not necessarily represent those of their affiliated organizations, or those of the publisher, the editors and the reviewers. Any product that may be evaluated in this article or claim that may be made by its manufacturer is not guaranteed or endorsed by the publisher.
Research integrity at Frontiers
Learn more about the work of our research integrity team to safeguard the quality of each article we publish.