 Zhuya Shen
94% of researchers rate our articles as excellent or good
Learn more about the work of our research integrity team to safeguard the quality of each article we publish.
Find out more
BRIEF RESEARCH REPORT article
Front. Environ. Sci. , 01 December 2022
Sec. Environmental Economics and Management
Volume 10 - 2022 | https://doi.org/10.3389/fenvs.2022.1037363
This article is part of the Research Topic Green Energy Technologies for Environmental Sustainability: Drivers, Challenges, and Future Aspects View all 27 articles
The COVID-19 has changed people’s lifestyle from many aspects such as the way people commute and their attention to health and fitness, and environmental problems. This report is to understand how residents in Shanghai commute with difficulties and the environmental sustainability challenges and health issues in the post-pandemic rehabilitation background. Taking educational institution in Shanghai as example, this study applied big data techniques with kernel density, Ripley’s K(d) function and 2SFCA analysis to identify the spatial characteristics and accessibility of different institution types under different travel modes such as walking. The results show that the distribution is extremely uneven in Shanghai, area with extreme concentration is observed. In case of educational workplace, although the proportion of street-town with moderate or higher accessibility reached 74.34%, such proportion is only 41.01% for walking mode. Current planning has skewed commuting around educational sites towards more carbon-intensive travel patterns and not conducive for keeping fit and health. Besides, households located in the districts of Chongming, Qingpu and Jinshan commute much longer than those in other regions. Long commute time and less exercise may lead to the wider spread of disease and it’s harmful to residents’ health and sustainable living. In summary, the findings of this paper regarding commuting to educational sites provide a clearer understanding of the health and sustainability challenges for policymakers.
When the urbanization rate in China reached 51.27% in 2011 and, for the first time, the number of urban populations exceeded that of rural population for the first time, China has officially become an urban society. While the large population can provide an abundant source of labour for the cities, it can also bring specific challenges to public facilities, services, infrastructure, and other social resources. In addition, traffic congestion and air pollution have become serious issues. When urban residents spend much time on their way to and from work, i.e., the “commuting time” is overly long, negatively affecting sustainable economic and social development activities. According to the Family Dynamics Social Tracking survey conducted by the Chinese Academy of Social Sciences, the average commuting time of urban residents was 33 min in 2011, 35 min in 2013, and 38 min in 2017, respectively (Song et al., 2017). The increasing commuting time among urban residents broadly indicates that the separation of work and residence has become increasingly severe (Nijman & Wei, 2020). With the massive expansion of the city scale and the evolution of residential suburbanization, the permanent population continues to expand to the city’s outer areas. As a result, there is a significant difference in the spatial expansion of residence and employment. At the same time, the commuting time of residents is prolonged due to the increasing distance between the workplace and residence (Huang et al., 2018). This phenomenon occurs in cities of different types and sizes throughout China.
China’s megacities currently have two major issues for commuting: high carbon emissions and unhealthy. In 2020, the average carbon emission of one-way commuting transportation for 10,000 people in major cities in China was 5.7 tons/day, which translates into 0.29 tons of carbon emission per person and annual (round-trip) commuting transportation based on 250 working days per year. Environmental scholars such as DeWeese (2022) pointed that short commutes and green travel help reduce carbon emissions, especially during the pandemic. The COVID-19 pandemic that began in early 2020 has dramatically changed how people worldwide work and live, including in China (Pan et al., 2020). As the “post-pandemic period” has entered, rehabilitation is gradually being realized across the country. However, implementing effective planning to achieve healthy and low-carbon transportation is still a challenge for policymakers (Cheshmehzangi, 2021). In particular, for different occupational groups, their commuting modes are different. Ta et al. (2017) divides the Chinese commuting modes into “reverse commuting from the city centre to the suburbs”, “lateral commuting between suburban new towns”, and “long-distance commuting from the suburbs to the city centre”. These patterns need to be more specifically identified when it comes to common commuting sites, such as factories, educational sites and business buildings. Therefore, this paper chooses a kind of educational workplaces to study. The reason to choose education workplaces as the research object is that the current educational site planning is influenced by local education policies and has formed special commuting patterns. In all megacities of China, most educational institutions need to be distributed to serve nearby families. In case of Shanghai, the government divided residential areas into different parts and stipulate that different educational institutions will be responsible for the education of students in these residential areas. It is worth noting that in China, children often go to school not only by themselves, but also accompanied by their parents or elders, normally via transportation modes of walking, bus or car (Gao et al., 2017; Ma et al., 2019). Therefore, commuting behaviour in this paper refers to the behaviour of students and accompanied family members from their homes to educational institutions and back. Because the majority of students in educational workplaces are young people, they are also more vulnerable to the impact of the epidemic, which makes commuting in this place more of a concern. But there is still rare discussion about the sustainability and health challenges of commuting in such workplaces. Therefore, in case of a kind of educational workplace, this paper aims to explore the issues in the current urban planning and propose corresponding planning suggestions to build a healthier and low-carbon commute. The aim of this research is to show current policymakers how variations on the sustainability and health issues facing commuting in different workplaces can be understood at the planning level, and to provide an exploratory case.
To implement this exploratory study, we select the research methods of applying multi-source data. With the development of big data technology, point of interest (POI) data, vehicle GPS data, public transportation IC card data, mobile phone signalling data, and other data have good space-time continuity and are widely available in different cities, providing new possibilities for the realization of commuting monitoring (Jiao et al., 2015). Liu et al. (2020) identified commuting trips and analysed their spatial characteristics based on TAXI GPS trajectories data. Kuang et al. (2015) used public transport swipe card data combined with bus GPS data to analyse the job-housing relationship and commuting trips in Beijing and evaluate the spatial difference of job-housing separation. However, using GPS data to carry out commuting research can only obtain the commuting characteristics of part of the travel modes. There are systematic deviations in the analysis of the commuting characteristics of the whole city. Therefore, it is necessary to use the advantages of different spatial data. In order to select the specific data for analysis, we first determined the study area of this paper as Shanghai, a city with a large number of commuting populations and a representative city of China’s commuting problem. The urban space of Shanghai is located in China between 120°52 ‘and 122°12′ east longitude and 30°40′ and 31°53′ north latitude. In Shanghai, commuting has always been a huge problem plaguing the operation of the city. Based on 1% population sampling data, Zhao and Cao (2020) found that the separation of employment and residence across districts and counties was apparent in Shanghai. The commuting flow of the employed people in the city is mainly from the suburbs to the central city and from the outer suburbs to the inner suburbs, and the average commuting time is 42 min. Shanghai’s commuting phenomenon is also replicated in China’s megacities such as Beijing, Shenzhen, and Tianjin (Xu et al., 2019). Therefore, some scholars suggest that the study of Shanghai can provide a reference for other megacities in China (Zhuo et al., 2016). However, it must be noted here that the conclusions may not apply to other country contexts, considering transportation infrastructure, population density, etc. (Giménez-Nadal et al., 2020). In the research on Shanghai, scholars such as Gan et al. (2020) extracted mobile phone data from multi-day activity chains and used it to identify people facing high risk of infection during commuting. At the same time, they found that the way people commute has started to change during the pandemic. Li et al. (2021) obtained the road traffic speed data of Shanghai for 3 months through Baidu Maps. It is found that these changes in commuting modes are affected by migrant populations under the epidemic, and different regions are affected to different degrees. With similar datasets, Xiao et al. (2022) also pointed out that the different influences of pandemic on the use of public transportation. However, to understand these differences, Qiu et al. (2022) and Huang et al. (2022) proposed the help of POI data. Huang et al. (2022) pointed out that the distribution of CO2 emissions was closely related to POI and land use data, and evaluated the situation of Shanghai based on the two types of data. It is verified that more details can be observed based on POI. Qiu et al. (2022) further clarified the importance of POI data in understanding travel between different places. Qiu et al. (2022) found that because of the unreasonable spatial distribution of green sport space (GSS) enjoyed by residents in Shanghai, people in some areas need to spend more commuting time to obtain corresponding services. This reveals the practical value of using POI data to understand commuting problems. Qiu et al. (2022) believed that POI data have advantages in understanding urban travel due to its openness, timeliness and diversity of data processing. Therefore, the specific research question of this paper is how to understand the sustainability and health issues in Shanghai educational workplaces with the help of advanced POI data. This paper takes Shanghai as the research area, uses a kind of educational workplace as the case, and obtains POI data of 8,373 workplaces through Python. Using the kernel density and Ripley’s K(d) function, the spatial distribution pattern of education institutions was analysed. This paper identifies the spatial clustering characteristics of different category institutions and analyses the commute accessibility under different travel modes based on the Two-step floating catchment area method (2SFCA). In this way, the transportation carbon-density and health risks can be understood by evaluating the spatial characteristics and commuting accessibility.
To summarize, for the government, how to solve the problem of high carbon emissions and COVID-19 risks in daily commuting has become important topics (Gao et al., 2018). As can be seen from the previous discussion, the current trend of relevant research is to use multi-source data, especially localized open-source databases, to obtain timely data. Although there are many studies using these local data, and they focus on things like industrial development, and enterprise accessibility, few of them have been used to understand traffic problems and to promote public health in the context of COVID-19. Therefore, this paper taking educational workplace as an example, conducts a study on commuting in Shanghai and lays a foundation for related research. In this way, we can pay attention to the high carbon and unhealthy issues of Shanghai’s traffic commuting, which will complement the problem of lack of attention and timeliness in past studies.
This study chooses the POI data of language education institutions as the study cases. China’s education level cannot be directly divided according to the international standard ISCED, which has been explained in previous studies (Gruijters et al., 2019). Considering the complexity of education in China, this paper classifies English teaching places after considering the place number and the cognitive stage of human beings from early childhood. The first stage is Enlightenment Education, mainly because most of the learning in this period was enlightenment learning, and the leading group who were educated were children. The second stage is Campus Compulsory Education, which is for teenagers. It is because English education in China is Compulsory in elementary, junior, and senior high schools. The third stage is for the adult, mainly college students and various social groups, who learn English mainly for study abroad and employment. Through such classification, the purpose of learning, the age, and the characteristics of the learning place can be clearly divided. The Enlightenment Education (POI Quantity: 3,496): Kindergarten, Children’s English Training Institutions. Campus Compulsory Education (POI Quantity: 2,513): Elementary, Middle, and High school. University and Continuing Education (POI Quantity: 2,364): Universities, English institutions for BEC/IELTS/TOEFL, and Adult English Education institutions. The spatial distribution characteristics of three types of 8,373 related educational institutions were studied. Kernel density Analysis was used to visualize the global distribution, Ripley’s K(d) function was used to conduct Multi-Distance Spatial Cluster Analysis, and location entropy was used to analyse the current accessibility.
Kernel Density Estimation (KDE) is a spatial Density analysis method based on the clustering algorithm of data Density function (Chen, 2015). It can intuitively and accurately reflect the relative concentration degree of the measured values of elements in the continuous region. Its formula is as follows:
Among which,
This paper uses Ripley’s K(d) function to analyse the spatial agglomeration of education institutions at different spatial scales in Shanghai. In general, K(d) function is transformed to maintain variance stability and
Where,
The Two-step floating catchment area method (2SFCA) is widely used in spatial accessibility analysis of public service facilities. It explores the area by moving twice and then analyses the service’s supply capacity and actual demand. Its advantage lies in taking into account the supply capacity of the supply point and the demand value of the demand point and introducing the distance or time threshold, fully considering the supply and demand, time cost, and other information (Xu et al., 2015; Higgs et al., 2017). Besides, the 2SFCA increases the influence of the distance attenuation factor to calculate spatial reachability more accurately (Mazumdar et al., 2014; Ma et al., 2019). To this end, this paper adopts time cost to set the threshold, and the specific steps are as follows:
According to the obtained geospatial coordinate data of institutions in Shanghai, the results of statistical visualization show that institutions within the outer ring high-speed area are more densely distributed, while those outside the outer ring high-speed area are more dispersed. From a regional perspective, the absolute number of institutions in the Pudong New Area of Shanghai is the largest, 1,659, accounting for 19.81% of the total institutions, while the absolute number of institutions in Jinshan District is the most minor, 167, accounting for 1.99% of the total. Based on each district’s geographical area and location factors, it can be found that institutions in Shanghai present an unbalanced spatial distribution feature of “close inside and thin outside.” Hongkou district, Yangpu District, Xuhui District, the eastern part of Changning District, and the western part of Pudong New District are the core areas of Shanghai’s spatial pattern of institutions.
The spatial agglomeration characteristics of institutions were determined using the kernel density analysis method. The results show that institutions in Shanghai show a multi-centre spatial agglomeration structure along the Huangpu River. In other words, a large-scale high-concentration core and several secondary concentration cores are grouped in each district (Figure 1). The results show that institutions in Shanghai tend to be located in the urban and district centres where economic activities are more developed. The reason for this is to make full use of the geographical advantages of these regions, which have a strong flow of people.
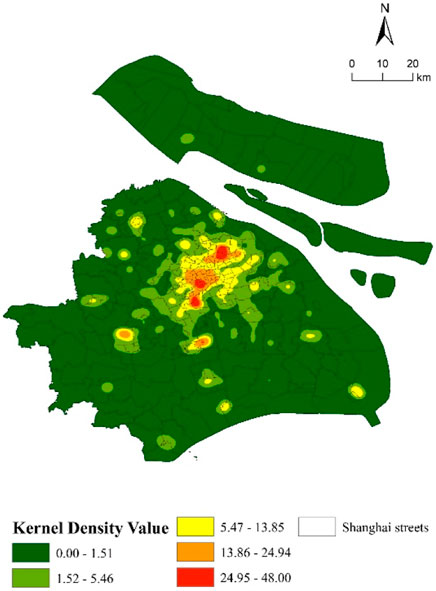
FIGURE 1. General map of kernel density.
There are 8,373 institutions in the main urban area of Shanghai, including 3,496 institutions for early childhood enlightenment, 2,513 institutions for compulsory education, and 2,364 institutions for higher language training, accounting for 41.75%, 30.01% and 28.24% of the total, respectively. It can be seen that in the number of institutions in Shanghai, the proportion of preschool enlightenment is the highest. Compulsory education and University and Continuing institutions accounted for 58.25%. From the proportion, it can be seen that preventing and controlling the pandemic in Shanghai is challenging. Specifically, the dominant population in the educational workplaces tends to be more vulnerable to COVID due to being younger. At the same time, they are students need people to accompany during commute, especially in the context of the epidemic. Commuting around such workplaces tends to have nearly double the carbon emissions due to shuttles of their family members (e.g., parents), making this become the most carbon-intensive commuting form. Based on this understanding, in the following research, we will focus on the differences between the three groups and pay attention to their health and sustainability aspects. By looking at the agglomerations of workplaces, we can identify those areas with the most commuting, and these areas tend to have higher health risks. By comparison we can know the difference in risk between the different categories. By calculating the accessibility around places, we can know the accessibility level of children and accompanying family members under different transportation modes during commuting, and know whether the current transportation planning is conducive to residents choosing more low-carbon and low-risk travel modes such as walking.
The agglomeration distribution of various institutions in Shanghai presents different patterns of polycentric agglomeration distribution (Figure 2). The kernel density of each type of institution shows that: Early childhood enlightenment institutions in Shanghai present a wide range of “core cluster” distribution characteristics. Clusters gather at the core urban area, forming a large-scale cluster area. Compulsory institutions show the distribution characteristics of “multi-core and decentralized agglomeration,” and there is no apparent density core in the urban areas outside the outer ring expressway of Shanghai. The spatial distribution structure of single polarization is prominent. There are three evident density cores of universities and continuing education institutions on the west bank of the Huangpu River, and their performance is relatively balanced. The structure is between enlightenment institutions and compulsory institutions. The results show that compared with the overall distribution of the city, the more basic and generalized social education needs are, the more balanced and connected the polycentric layout is. The more comprehensive and particularized the social education needs are, the more characteristic of a single center and island. According to this feature, the government can prioritize prevention inspection through spatial distribution.
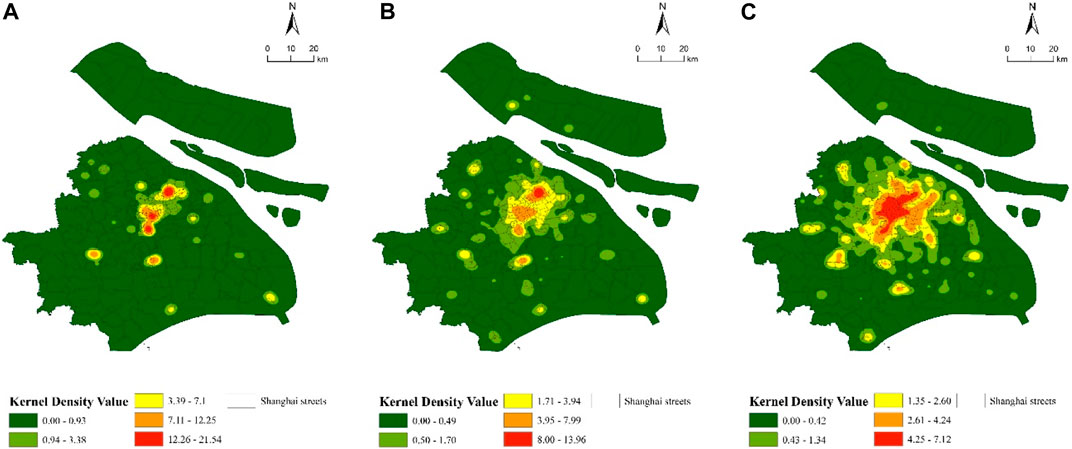
FIGURE 2. Kernel density of institutions in Shanghai. (A) University and Continuing Education, (B) Campus Compulsory Education, (C) Enlightenment Education.
Based on Ripley’s K function, this paper analyses the spatial agglomeration characteristics of various institutions at different distance scales and further explores the location characteristics of various institutions. The results show that different types of institutions have different spatial scale agglomeration characteristics, and the scale range of location choice is also different. As shown in Figure 3, within the observation scale of 6 km, the observed value curve of the L(r) function is always above the expected value curve. Within this range, the actual observed value is above the upper limit of the Monte Cato simulation. The results show that all kinds of institutions have significant spatial agglomeration characteristics. From the overall trend of L(R) function curve, with the increase of distance, all kinds of institutions show the trend characteristic of “fast strengthening at a short distance, slow weakening at a long distance.” However, the distance corresponding to its peak value indicates that the distance threshold of location selection of institutions is different. Among them, the peak distance of institutions of university and continuing education is 4000m, indicating that such institutions have the characteristics of large-scale agglomeration and an extensive range of location selection. The peak distance between enlightenment and compulsory education institutions is close to 3,500m, indicating that these two institutions have a smaller scale of agglomeration and a smaller range of location selection.
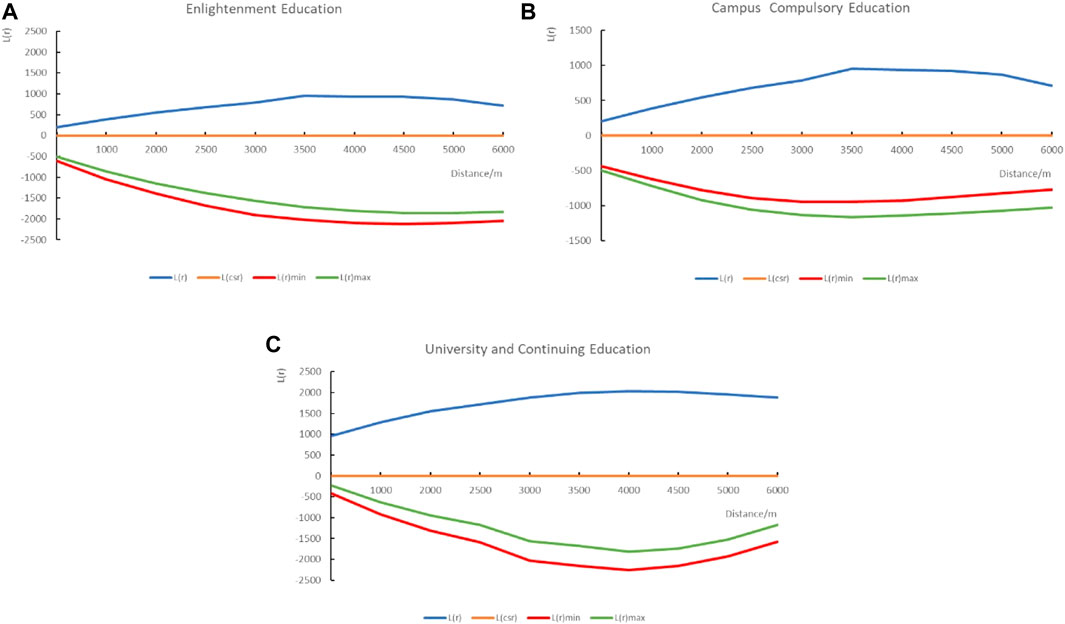
FIGURE 3. Results of Ripley’s L(r) function. (A) Enlightenment Education, (B) Campus Compulsory Education, (C) University and Continuing Education.
In the analysis, we consider the Shanghai traffic network data set. These include bus lines and stops, urban roads, and walking routes. These data came from Baidu Maps, which is open access. The ArcGIS platform was used for digitizing and manually setting the 300 m straight line distance as the service radius of the bus station and defined 30 km/h as the bus’s average speed. According to Open Street Map data of different road grades and urban road grade standards, the vehicle speed was determined as 60 km/h on the express road, 40 km/h on the main road, 30 km/h on the secondary road, and 20 km/h on the branch road. Then, the OD time cost matrix of different urban roads is simulated in ArcGIS, and the spatial accessibility coefficients of institutions under different traffic modes are calculated.
By applying 2SFCA, the institutions in Shanghai in 2020 and the latest resident population of Shanghai Street/Towns in 2021 were analysed. Under the three travel modes, the spatial accessibility of institutions in Shanghai is graded (Figure 4). In the case of Car travel, the proportion of street-town with moderate or higher accessibility reached 74.34%, which was higher than 59.42% of bus travel and 41.01% of walking. This suggests that current transportation planning is more convenient for cars and buses that still dominant by fossil fuel consumption and does not encourage low-carbon and less risky travel modes such as walking. The reason for this pattern can be found by observing Figure 4. According to Figure 4, the accessibility of Car transportation mode develops along the Huangpu River in an axial direction of “northeast to the southwest” and forms a “dual-core” pattern. With Changzheng Town of Putuo District and Fangsong Street of Songjiang District as the core, it develops into two cluster areas with high-value accessibility. There are 68 streets/towns with moderate or higher accessibility, mainly distributed in Baoshan, Hongkou, Jiading, and Pudong districts. Thirty-three low-accessibility streets are concentrated in the outer suburbs of Chongming, Qingpu, and Jinshan Districts. The main reason is that the area of streets and towns is relatively large, the density of the road network is relatively low, and the distribution of institutions is insufficient. Therefore, this means that people are less likely to choose more sustainable and healthy modes of travel and have to adopt more energy intensive modes of travel due to the unequal and unreasonable distribution of educational institutions. But even so, it is difficult to achieve adequate accessibility in some areas, which also reflects the lack of educational institutions.
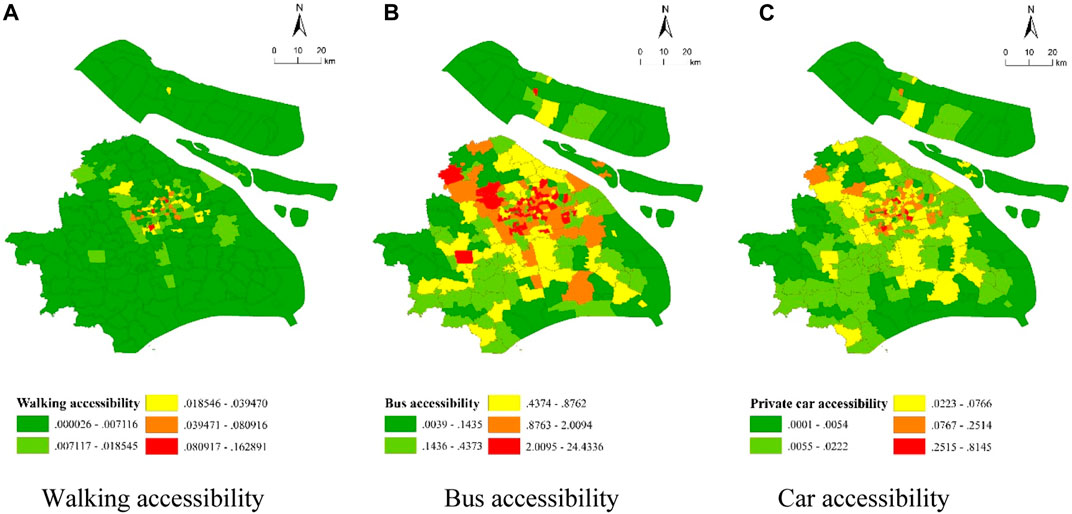
FIGURE 4. Spatial accessibility classification diagram of institutions. (A) Walking accessibility (B) Bus accessibility (C) Car accessibility.
According to the Family Dynamics Social Tracking survey conducted by the Chinese Academy of Social Sciences, from 2011 to 2017, the average commuting time in Shanghai remained above 49 min. Our results on commuting accessibility indicate that education institutions are currently widely distributed and that most areas can provide efficient travel and access. However, the current planning does not take enough into account the environmental protection and health issues of travel. The transport mode with the highest accessibility is still car (74.34%), while walking has the lowest accessibility (only 41.01%). This means that the vast majority of residents are constrained by the disproportionate distribution of educational sites and have to choose more carbon-intensive commuting options. The sustainability issue of such commutes becomes even more salient when parents are considered for accompanied commuting. Besides, for the districts of Chongming, Qingpu, and Jinshan in the outer suburbs, commutes here are longer and farther than those in other areas. These three areas perform poorly on the accessibility index, which means the residents produce higher transportation emissions and face higher health risks. This also indicates insufficient transportation facilities and education resources in these three areas. Although the simulation mechanism in this paper is simple, we believe that it is sufficient to reflect the fundamental law and provide a working direction for healthier and low-carbon commuter control. In view of the results drawn in this paper, we propose the following suggestions for commuting to educational places, both for students and employees: 1) In the short term, the government should set up lines for living in the outer suburbs of Chongming, Qingpu, and Jinshan to provide collective transportation. Shanghai Jiao Tong University, for example, is currently piloting an online booking innovative transportation method to provide students and teachers living in Minhang and other places with the most efficient way to help them commute during the pandemic. However, similar practices are still lacking, and given the government’s focus on pandemic prevention in urban areas, the commuting situation of people in rural areas needs to be given equal attention. 2) In the long run, the government needs to adjust the number and distribution of different educational places and consider fewer cost-benefits problems. In particular, the number of educational institutions in the suburbs needs to increase. It can be seen from the results of this paper that commuting to educational places is also closely related to educational equity. 3) The government should set public ownership-related policies, such as giving the accessibility of poor areas certain subsidies through public ownership to strengthen the construction and improve pandemic control.
Due to the limited existing models in analysing POI data and the limited data accessibility in other countries, only a brief exploration was conducted in the present study. The used model used was simple, and no comparison was made before and after the pandemic. In future studies, variables and actual conditions will be considered, and the impact of the pandemic will be explored more deeply as suggested by Mastoi et al. (2022), Rana (2021) and Waheed (2021). The main purpose of this report is to draw the attention of scholars to the application of timely data for commuting planning in cities, especially mega-cities. At the same time, sustainability and health issues should be considered in future commuting planning.
The original contributions presented in the study are included in the article/supplementary material, further inquiries can be directed to the corresponding author.
ZS contributed to the study conception and design, material preparation, data collection, and the manuscript was written by ZS.
The author declares that the research was conducted in the absence of any commercial or financial relationships that could be construed as a potential conflict of interest.
All claims expressed in this article are solely those of the authors and do not necessarily represent those of their affiliated organizations, or those of the publisher, the editors and the reviewers. Any product that may be evaluated in this article, or claim that may be made by its manufacturer, is not guaranteed or endorsed by the publisher.
Chen, S. (2015). Optimal bandwidth selection for kernel density functionals estimation. J. Probab. Statistics 2015, 1–21. doi:10.1155/2015/242683
Cheshmehzangi, A. (2021). Low carbon transition at the township level: Feasibility study of environmental pollutants and sustainable energy planning. Int. J. Sustain. Energy 40 (7), 670–696. doi:10.1080/14786451.2020.1860042
DeWeese, J., Ravensbergen, L., and El-Geneidy, A. (2022). Travel behaviour and greenhouse gas emissions during the COVID-19 pandemic: A case study in a University setting. Transp. Res. Interdiscip. Perspect. 13, 100531. doi:10.1016/j.trip.2021.100531
Gan, T., Li, W., He, L., and Li, J. (2020). Intracity pandemic risk evaluation using mobile phone data: The case of Shanghai during COVID-19. ISPRS Int. J. Geoinf. 9 (12), 715. doi:10.3390/ijgi9120715
Gao, X., Zhao, S., and Yibo, S. IEEE, 469–472. doi:10.1109/ICVRIS.2018.001212018, August, An analysis of the current status and countermeasures of bike-sharing in the background of Internet, Proceedings of the 2018 International Conference on Virtual Reality and Intelligent Systems (ICVRIS)
Gao, Y., Chen, X., Li, T., and Chen, F. (2017). Differences in pupils’ school commute characteristics and mode choice based on the household registration system in China. Case Stud. Transp. policy 5 (4), 656–661. doi:10.1016/j.cstp.2017.07.008
Giménez-Nadal, J. I., Molina, J. A., and Velilla, J. (2022). Trends in commuting time of European workers: A cross-country analysis. Transp. Policy 116, 327–342. doi:10.1016/j.tranpol.2021.12.016
Gruijters, R. J., Chan, T. W., and Ermisch, J. (2019). Trends in educational mobility: How does China compare to Europe and the United States? Chin. J. Sociol. 5 (2), 214–240. doi:10.1177/2057150x19835145
Higgs, G., Zahnow, R., Corcoran, J., Langford, M., and Fry, R. (2017). Modelling spatial access to general practitioner surgeries: Does public transport availability matter? J. Transp. Health 6, 143–154. doi:10.1016/j.jth.2017.05.361
Huang, C., Zhuang, Q., Meng, X., Zhu, P., Han, J., and Huang, L. (2022). A fine spatial resolution modeling of urban carbon emissions: A case study of Shanghai, China. Sci. Rep. 12 (1), 9255–9313. doi:10.1038/s41598-022-13487-5
Huang, J., Levinson, D., Wang, J., Zhou, J., and Wang, Z. J. (2018). Tracking job and housing dynamics with smartcard data. Proc. Natl. Acad. Sci. U. S. A. 115 (50), 12710–12715. doi:10.1073/pnas.1815928115
Jiao, P., Sun, T., Guo, J., and Li, Y. (2015). Joint residence-workplace location choice model based on household decision behavior. Discrete Dyn. Nat. Soc. 2015, 1–8. doi:10.1155/2015/908387
Kuang, W., An, S., and Jiang, H. (2015). Detecting traffic anomalies in urban areas using taxi GPS data. Math. problems Eng. 2015, 1–13. doi:10.1155/2015/809582
Li, Y., Geertman, S., Hooimeijer, P., Lin, Y., and Yang, H. (2021). Do migrants and locals differ in commuting behavior? A case study of xiamen, China. Transp. policy 108, 1–10. doi:10.1016/j.tranpol.2021.04.020
Liu, X., Sun, L., Sun, Q., and Gao, G. (2020). Spatial variation of taxi demand using GPS trajectories and POI data. J. Adv. Transp. 2020, 1–20. doi:10.1155/2020/7621576
Ma, X., Ren, F., Du, Q., Liu, P., Li, L., Xi, Y., et al. (2019). Incorporating multiple travel modes into a floating catchment area framework to analyse patterns of accessibility to hierarchical healthcare facilities. J. Transp. Health 15, 100675. doi:10.1016/j.jth.2019.100675
Mastoi, M. S., Munir, H. M., Zhuang, S., Hassan, M., Usman, M., Alahmadi, A., et al. (2022). A critical analysis of the impact of pandemic on China’s electricity usage patterns and the global development of renewable energy. Int. J. Environ. Res. Public Health 19 (8), 4608. doi:10.3390/ijerph19084608
Mazumdar, S., Feng, X., Konings, P., McRae, I., and Girosi, F. (2014). A brief report on primary care service area catchment geographies in New South Wales Australia. Int. J. Health Geogr. 13 (1), 38–8. doi:10.1186/1476-072x-13-38
Nijman, J., and Wei, Y. D. (2020). Urban inequalities in the 21st century economy. Appl. Geogr. 117, 102188. doi:10.1016/j.apgeog.2020.102188
Pan, S. L., Cui, M., and Qian, J. (2020). Information resource orchestration during the COVID-19 pandemic: A study of community lockdowns in China. Int. J. Inf. Manag. 54, 102143. doi:10.1016/j.ijinfomgt.2020.102143
Rana, M. S., Alam, M. M., Ikram, A., Salman, M., Mere, M. O., Usman, M., et al. (2021). Emergence of measles during the COVID-19 pandemic threatens Pakistan’s children and the wider region. Nat. Med. 27 (7), 1127–1128. doi:10.1038/s41591-021-01430-6
Song, Y., Shao, G., Song, X., Liu, Y., Pan, L., and Ye, H. (2017). The relationships between urban form and urban commuting: An empirical study in China. Sustainability 9 (7), 1150. doi:10.3390/su9071150
Ta, N., Chai, Y., Zhang, Y., and Sun, D. (2017). Understanding job-housing relationship and commuting pattern in Chinese cities: Past, present and future. Transp. Res. Part D Transp. Environ. 52, 562–573. doi:10.1016/j.trd.2016.11.011
Waheed, J., Jun, W., Yousaf, Z., Radulescu, M., and Hussain, H. (2021)., 9. MDPI, 837. doi:10.3390/healthcare9070837Towards employee creativity in the healthcare sector: Investigating the role of polychronicity, job engagement, and functional flexibility, Healthcare, No. 7
Xiao, G., Xiao, Y., Ni, A., Zhang, C., and Zong, F. (2022). Exploring influence mechanism of bikesharing on the use of public transportation—A case of Shanghai. Transp. Lett., 1–9. doi:10.1080/19427867.2022.2093287
Xu, J., Liu, S., Guo, W., Zhang, Z., Wei, J., and Feng, T. (2015). Glacial area changes in the ili river catchment (northeastern tian Shan) in xinjiang, China, from the 1960s to 2009. Adv. Meteorology 2015, 1–12. doi:10.1155/2015/847257
Xu, J., Zhang, M., Zhang, X., Wang, D., and Zhang, Y. (2019). How does city-cluster high-speed rail facilitate regional integration? Evidence from the shanghai-nanjing corridor. Cities 85, 83–97. doi:10.1016/j.cities.2018.12.003
Zhao, P., and Cao, Y. (2020). Commuting inequity and its determinants in Shanghai: New findings from big-data analytics. Transp. policy 92, 20–37. doi:10.1016/j.tranpol.2020.03.006
Keywords: rehabilitation, health and fitness, commute, low-carbon, education, accessibility, 2SFCA, Shanghai
Citation: Shen Z (2022) Workplace commute in Shanghai under post-pandemic rehabilitation: Health and fitness problems in planning and sustainability challenges. Front. Environ. Sci. 10:1037363. doi: 10.3389/fenvs.2022.1037363
Received: 05 September 2022; Accepted: 03 November 2022;
Published: 01 December 2022.
Edited by:
Magdalena Radulescu, University of Pitesti, RomaniaReviewed by:
Alexandra Horobet, Bucharest Academy of Economic Studies, RomaniaCopyright © 2022 Shen. This is an open-access article distributed under the terms of the Creative Commons Attribution License (CC BY). The use, distribution or reproduction in other forums is permitted, provided the original author(s) and the copyright owner(s) are credited and that the original publication in this journal is cited, in accordance with accepted academic practice. No use, distribution or reproduction is permitted which does not comply with these terms.
*Correspondence: Zhuya Shen, c2hlbnpodXlhQG91dGxvb2suY29t
Disclaimer: All claims expressed in this article are solely those of the authors and do not necessarily represent those of their affiliated organizations, or those of the publisher, the editors and the reviewers. Any product that may be evaluated in this article or claim that may be made by its manufacturer is not guaranteed or endorsed by the publisher.
Research integrity at Frontiers
Learn more about the work of our research integrity team to safeguard the quality of each article we publish.