 Xiaodong Ji
 Yixuan Tang
 Wei Shao
- 1School of Management, Shanghai University of Engineering Sciences, Shanghai, China
- 2School of Architecture Science and Engineering, Yangzhou University, Yangzhou, Jiangsu, China
- 3College of Business Administration, Shanghai Business School, Shanghai, China
Financial resource allocation comprises the efficiency of credit resource allocation and the savings-investment transformation rate. Based on the two aspects, the relationships between the efficiency of financial resource allocation and green economic development are empirically tested using China’s panel data from 2000 to 2019 within the spatial Durbin model. The empirical results show that the efficiency of credit resource allocation in China is low, and the flow of credit resources causes a siphon effect. At the same time, the existing savings stock does not form a real credit resource. The empirical results of regional tests show that the allocation efficiency of credit resources in the eastern region is low, and negative externalities exist. The allocation efficiency of credit resources in the central and western regions has a driving effect on the development of the green economy in the region, but there also exist negative externalities. There are positive externalities in the conversion rate of savings and investment. The findings of this study indicate that China is still driving the development of the green economy through the expansion of the total financial scale. The economic benefits of improving the efficiency of financial resource allocation have not been proven.
1 Introduction
After the 2008s international economic crisis, the United Nations launched the Global Green New Deal and Green Economy Plan to adopt the green economy (GE) and green new deal as a response to the dual challenges of the financial crisis and climate change (UNEP, 2011). Some other developed countries, such as the United States, the United Kingdom, France, Germany, South Korea, and Brazil, have also regarded the green economy as a new engine for economic revitalization since then (Webster and Ayatakshi, 2013; Mark and Mark, 2009). Similarly, China has also carried out a series of strategic deployments and practical actions in response to GE’s development. For example, the 18th CPC National Congress has clearly raised tasks about green development and ecological civilization to promote green economic development. The 19th CPC National Congress has further stated to adopt the strictest ecological and environmental protection system and form a green development way. In the four trillion investment plan in 2008, the funds for energy conservation, greenhouse gas emission reduction, and environmental engineering projects reached 210 billion yuan, accounting for 5.25% of the total investment in the plan (Cai et al., 2011; Dulal et al., 2015). According to data from the National Bureau of Statistics, China’s total investment in environmental pollution control in 2020 has reached over one trillion yuan, accounting for 1.0% of the year’s GDP. Compared with the number in 2000, it has increased nearly ten times.
In addition, in order to promote green development, China has promulgated a series of green financial policies to guide the flow of funds from traditional industries with high material consumption and high pollution emissions to green agriculture, green manufacturing, green services, and green consumption. For example, in 2015, the Chinese government established a green financial policy system to provide policy guidance for green development. The CSRC also issued a related policy to support the development of green bonds in 2017. In 2021, the State Council of China (SCC) issued the Guidance on Accelerating the Establishment and Improvement of Green, Low-carbon, and Circular Systems for Economic Development, which stressed that the development of green finance is a necessary prerequisite for achieving green development goals. “Greening China’s Financial System Synthesis Report” points out that from 2015 to 2020, China will need to invest 17.4 trillion yuan in developing green finance, with an average annual investment of about 2.9 trillion yuan. It means that the funds needed for green finance development account for more than 14% of the national fiscal revenue. It can be seen that green finance plays an important role in improving environmental governance.
GE is a new concept of economic development based on sustainable development, dedicated to reducing ecological and environmental risks and improving the quality of economic development. In 1989, British environmental economist Pearce first proposed GE’s concept and believed that GE is based on social and ecological conditions to establish an affordable economy. Subsequently, many studies have been carried out around the definition of GE’s connotation (Lv et al., 2021; Loiseau et al., 2016; Merino-Saum et al., 2020), the evaluation and measurement of indicators (Merino-Saum et al., 2018; Wang et al., 2018; Pan et al., 2019), the antecedents of impact (Shah et al., 2016; He et al., 2019; Hafner et al., 2020; Mealy and Teytelboym, 2020), and the effect of impact (Oliveira et al., 2013; Park and Page, 2017; Lee and Lee, 2022). As an emerging industry, GE has the inherent characteristics of vulnerability and investment. Compared with the traditional industrial economic model, GE has a larger industrial system, a more complex enterprise structure, a more capital investment, and a longer production cycle, which needs much financial support and relevant supporting services to promote its reform and development. In order to promote GE’s development, the financial industry has introduced the concept of green finance as the sum of financial elements which could help the traditional industries to develop as green industries. Under the institutional arrangements, green finance guides the flow of funds from the traditional industries with high material consumption and high pollution emissions to the green industries, such as green agriculture, green manufacturing, and green services with less energy consumption and pollutants. Whether greening and upgrading the existing industrial structure or actively developing environmentally friendly green industries, any economic and social activity is inseparable from the support of the financial system. Considering this issue, Lin, 2016 believes that to achieve GE’s sustainable development, the government needs to carry out comprehensive governance by adjusting energy and industrial structures, greening production and consumption patterns, and optimizing pollution control methods. It can be inferred that GE’s development could be boosted by green finance and relevant resources and tools.
Although the research literature on GE is abundant, few studies focus on the impact of financial resources on GE. In the field of environmental finance, the existing literature is mainly limited to the construction of the green development model of the financial system itself or the discussion of the relationship between green credit and the environment (e.g.,Cui et al., 2020; Jalil and Feridun, 2011; Tamazian and Rao, 2010; Su et al., 2022). It fails to combine financial resource allocation with green economic development. The financial resource theory believes that finance is a scarce resource that allocates all resources through its allocation (Bai, 2003). Jones (2011) believes that introducing resource allocation in the study of economic growth theory is the most important progress in recent years. Due to the scarcity of resources, the efficiency of resource allocation in economic activities has become an essential factor in determining the speed of economic growth. Therefore, discussing GE’s development from the financial resource allocation efficiency perspective is of greater practical significance. In addition, the previous literature on finance and economic growth mainly used the traditional financial development theory as the framework to study the impact of currency and markets on economic growth, thus ignoring the spatial allocation of financial resources (Tang, 2014), namely, financial resources not only affect the local economy development (Greenwood et al., 2013), also affect the surrounding region’s economy (Ye et al., 2018), that is, the spillover effect. To fill the research gaps, we firstly discuss the impact of financial resource allocation efficiency on the development of the green economy from the perspective of financial resource allocation theory and proposes the analysis framework. Second, we use the spatial econometric model to study the impact mechanism of financial resource allocation efficiency on green economic development.
This paper provides some contributions to the related literature on financial resources and the green economy. At first, we discuss the mechanism of green economic growth from the perspective of financial resources. In the traditional financial development theory, money and market are usually used to construct the theoretical analysis framework to analyze the impact of finance on economic growth without considering the resource attribute of finance. The paper, relying on the theory of financial resources, focuses on the impact of the allocation efficiency of financial resources on the green economy, which is conducive to enriching the related theoretical research of financial resources. Secondly, we focus on the externality of financial resource allocation efficiency. Different from the existing literature on the relationship between finance and economic growth, we fully consider the effect of spatial factors on the allocation efficiency of financial resources. Therefore, the research conclusion is more in line with reality and improves the application value of the research conclusion.
The rest of the paper is organized as follows. In Section 2, we represent the literature review and thus provide the analysis framework of mechanisms between green finance and the green economy. In Section 3, the econometric model is set, and the selection of related variables and data sources are introduced. The analysis process and the results are presented in Section 4. Moreover, in Section 5, the heterogeneity tests are further provided. The implications of the findings are included in Section 6.
2 Literature review and mechanisms analysis
2.1 Financial resource allocation efficiency and economic growth
Although there is little literature on the relationship between the efficiency of financial resource allocation and GE, there is a consensus that financial development could promote economic growth (Hassan et al., 2011; Valickova et al., 2015; Aziz et al., 2022). The financial resource allocation efficiency is reflected in whether financial resources can be put into sectors that can significantly drive the growth of the real economy through financial intermediaries and financial markets (Ahmed, 2013). Since the scale of finance cannot expand indefinitely, the best way to ultimately drive economic growth is to improve the efficiency of financial resource allocation, which also means that the efficiency of financial resource allocation determines the quality of economic growth. Since the open-up and reform policy had been adopted, China’s economy has experienced rapid growth, but there are relatively severe financial resource allocation imbalances and low efficiency of resource allocation, making the role of financial development in driving economic growth questioned in China. Existing research believes that the differences in the initial conditions of financial development and financial policies in various regions have led to differences in financial efficiency, resulting in unbalanced economic development (Zhang et al., 2012). The allocation and flow of financial capital between regions will also affect regional economic growth. In areas with low levels of financial development, the capital support for environmental protection investment is also limited, thereby inhibiting GE’s development. Financial agglomeration can optimize the allocation of regional resources, improve the technical level, and promote the upgrading of the industrial structure, thereby promoting the development of the green economy. Therefore, there is a natural connection between the allocation of financial resources and the green economy.
2.2 Effects of finance on green economy
Green economic development is a branch of sustainable economic development centered on the coordinated development of ecology and economy. It stresses the importance of resource bear capacity and environmental capacity of economic growth and helps resource conservation and environmental friendliness. Therefore, green economic development requires various ways and methods to achieve higher economic output with less resource input while reducing the environmental pollution. Since the efficiency of financial resource allocation is the result of financial development, when discussing the mechanism by which the efficiency of financial resource allocation affects GE’s development, it can be analyzed under the framework of financial development and GE’s development. As the core of the modern economy, finance can influence GE’s development through scale, allocation, innovation, and supervision effects. Therefore, we will discuss how finance affects GE’s development from the following four aspects.
2.2.1 Scale effect
The scale effect of capital can stimulate economic growth and reduce environmental pollution by affecting enterprises’ capital accumulation and improving resource utilization efficiency. This is because an efficient financial system can help reduce enterprises’ external financing, information, and transaction costs, thereby boosting firms’ growth. On the other hand, the developed financial market can provide sufficient external capital for firms and ensure that investors can obtain information about enterprises’ investment and financing decisions (Claessens and Laeven, 2003). The environmental performance of listed companies will increase the market price of their stocks (Castro et al., 2021). This is because the environmental performance of listed companies can signal transparency in corporate operations and play a positive role in investor responses (Zhang et al., 2022). The institutional theory also believes that companies will improve the quality of external environmental information to gain legitimacy (Ren et al., 2020). Therefore, a perfect stock market will prompt companies to increase their environmental protection investment, thereby helping reduce corporate pollution emissions. In addition, the scale effect of financial development can also improve the efficiency of energy use and resource allocation, thereby reducing energy consumption and pollution emissions. The financial liberalization and opening can attract high-quality foreign investment and high-quality R&D investment to promote technological progress, which affects the dynamic performance of the environment. On the other hand, financial intermediaries can also facilitate the flow of corporate resources towards environmentally friendly projects and identify the best technology for product production (Tamazian and Rao, 2010).
2.2.2 Allocation effect
The effect of resource allocation refers to the improved resource allocation in investment through the financial system (Graff and Karmann (2006)). Graff and Karmann (2006) believe that the allocation effect mainly causes the promotion of financial activities to economic growth. In other words, financial activities drive economic growth by increasing the efficiency of capital accumulation and allocation. In market economic behavior, the financial sector usually acts as an intermediary between the owners and users of funds. Financial development can improve the efficiency of resource allocation by reducing the information acquisition cost. With the improvement of financial development, financial intermediary plays an increasingly prominent role in reducing information asymmetry. Under the influence of market competitiveness, the capital can flow from low-efficiency enterprises and departments to high-efficiency enterprises and departments to realize the rational allocation of capital (Wurgler, 2000). Reallocating the capital via financial intermediaries and financial markets and inputting more limited resources into regions or actors with higher productivity and output growth rates can improve the resource utilization efficiency of the entire society in regions. The cross-regional allocation of financial resources leads to industrial economy clustering at the spatial level.
2.2.3 Innovation effect
The financial innovation effect means that the financial system can realize long-term development by innovating financial models, tools, ideas, and other means. As a bridge between the financial industry and the environmental industry, green finance seeks financial innovation to seek the path of environmental protection. Its primary purpose is to solve the problems of global environmental pollution and climate change through the optimal combination of financial instruments and financial products and achieve economic, social, and environmental sustainability development (Ding et al., 2020; Ibrahim and Vo, 2021). Moreover, green finance can pool funds and guide the flow of funds to promote industrial restructuring. Driven by green finance, various resources flow to green industries, realizing the economies of scale of green industries and enhancing their long-term competitiveness. In addition, the innovation of financial models and tools is conducive to the flow and reorganization of commodities, labor, and technology in different regions, which is of great significance for improving the efficiency of financial resource allocation. As a result, green finance could promote industrial integration, effectively break the restrictions of industries and regions, and improve the market transaction system.
2.2.4 Supervision effect
The supervision effect refers to the supervision, management, and control of the financial system of the enterprises through the related supervision platforms. On the one hand, through standardized and mandatory environmental information disclosure, the stock market encourages more external investors to supervise the listed companies, thus reducing the energy consumption of enterprises. On the other hand, the stock market can also reduce enterprises’ agency and governance costs through contract incentives to improve companies’ capital utilization efficiency and business performance. Banks are the main channel of enterprises’ debt financing, and it has absolute advantages in obtaining information about enterprises’ operation, management, and financial status. Therefore, financial intermediaries can better play their supervisory role as “large creditors” to minimize regulatory costs and mitigate the hitchhiking effect.
3 Methods and data
3.1 Model settings
In the spatial econometric models, the spatial economic units do not exist in isolation but interact with the neighboring economic units in space through various connections, showing spatial dependence and spillover characteristics in geography. For example, improving the allocation efficiency of financial resources (FRAE) in one region will attract financial resources from other regions, thus spatially affecting the region’s green economy. Similarly, the behavior of GE may be observed and imitated by other regions. Therefore, the spatial econometric model would be preferred to investigate regional interactions.
Currently commonly used spatial econometric models mainly include the Spatial Lag Model (SLM), the Spatial Error Model (SEM), and the Spatial Durbin Model (SDM) (Anselin, 2003). Different spatial econometric models are based on different assumptions of spatial conduction mechanisms, and their economic implications are also different. The SLM model assumes that all dependent variables will impact the economy of other regions through spatial interactions, and the impact is independent of the indirect effects of exogenous variables such as initial conditions and control variables (Liu et al., 2018). The SEM model assumes that the cause of the spatial dependence of the dependent variable is the result of the random error shock between regions, and its spatial effect is mainly conducted through the error term (Anselin et al., 2008). The SDM model considers the above two types of spatial conduction mechanisms simultaneously and considers the spatial interaction; that is, the development of a regional green economy is not only affected by the local region (Elhorst, 2003; LeSage and Pace, 2009). The influence of independent variables will also be affected by GE’s development in other regions and independent variables.
Given that different spatial econometric models could indicate different economic meanings, this paper adopts the following strategies to obtain a suitable spatial econometric model. First, the selection fixed effect is determined by Hausman’s test. Then, the LM and Robust LM tests are performed to investigate whether the model has a spatial error and spatial lag characteristics. The test results show that LM-lag, Robust-LM-lag, LM-error, and Robust-LM-error are 355.253, 47.431, 343.05, and 449.367, respectively, all of which passed the 1% significance level test, indicating that the model has the characteristics of both spatial error and spatial lag. Finally, the LR and Wald tests judge whether the SDM model is optimal. The test results find that the Wald-Spatial-lag, LR-spatial-lag, Wald-spatial-error, and LR-spatial-error are 97.378, 41.746, 54.494, and 61.902, respectively, and all passed the 1% significance level, indicating that SDM does not degenerate into SLM or SEM, and it is the optimal model. To summarize, we choose the two-way fixed-effect SDM for the empirical testing. Referring to the model setting in Elhorst (2014a), the general form of SDM is:
Where yit is the explained variable; Xit is the explanatory variable matrix; ω is the spatial weight matrix; ρ is the spatial lag term coefficient of the explained variable; β is the regression coefficient of all explanatory variables; ωijXit represents the spatial lag of all explanatory variables, which the parameter is δ, which represents the explained variable constructed with the point mean of adjacent spatial observation units; μi is the individual effect of region i; γt is the time effect; εit is the spatial error term that obeys an independent distribution.
3.2 Spatial weight setting
There are three common spatial weight matrices in the existing research (Anselin, 1988): 1) The spatial 0-1 matrix (w1) sets the weights according to whether they are geographically adjacent. Geographically adjacent areas are set as 1, and 0 otherwise. 2) The spatial geographic distance matrix (w2) indicates that the inter-regional performance dependency and radiation effect are proportional to the geographical distance. Therefore, the weight is generally set according to the inverse of the geographical distance between the two regions. That is, the main diagonal elements are all 0, and the non-main diagonal elements are the reciprocal of the geographic distance between the two regions. 3) Ethe economic distance spatial weight matrix (w3) reflects that the regional economic differences will affect the spatial radiation effect between the regions, and the impacts are different. The impact of the developed regions on the backward regions is stronger than the latter’s impact on the former. Therefore, both effects of geographic and economic elements need to be considered when setting the model weights.
To sum up, based on the economic and social characteristics, this paper selects the per capita GDP of each province as the matrix element to construct the economic distance space weight matrix. The specific formula is as follows:
Here,
3.3 Decomposition of spatial spillover effects
An important contribution of the spatial econometric model is that it can measure the direct effect, indirect effect (spatial spillover effect), and the total effect caused by spatial interdependence (LeSage and Pace, 2008). The direct effect reflects the average influence of independent variable X on Y within the region. The indirect effect reflects the average influence of independent variable X on Y in other regions. The total effect reflects the average influence of independent variable X on all regions. Since the spatial econometric model includes the influence of adjacent regions, the influence of independent variables on dependent variables cannot be represented by regression coefficients. LeSage and Pace (2009) proposed a method to explain the influence of variables by using partial differential measures. Therefore, we refer to the research methods of LeSage and Pace (2009) and transform the general form of the SDM model into:
Therefore, the matrix after taking the partial derivative of explained variable Y to explained variable X is:
The matrix on the right of the equation is the partial differential matrix proposed by LeSage and Pace (2009). The elements on the diagonal reflect the average influence of the change of Xik variable in a specific spatial unit on the dependent variable within the unit, that is, the direct effect. The non-diagonal elements represent the average effect of the change of Xik variable in a particular spatial unit on the dependent variables of other spatial units, i.e., the spatial spillover effect. LeSage and Pace (2009) pointed out that it is necessary to use the estimated direct effect of the explanatory variable rather than its coefficient β to test the hypothesis of whether there is a spillover effect within a region. It is necessary to use indirect effects rather than the spatial autocorrelation coefficient ρ or the self-spatial lag term coefficient δ to test the hypothesis of the existence of spatial spillover effects.
3.4 Variable selection
3.4.1 Green economy development
Considering the impact of population factors, this paper uses the natural logarithm of green per capita GDP (LnPGgdp) to measure the green economic development of each province. The indicator is calculated as follows:
Here, the GGDP is green GDP, i is the provincial area; t is the year; j is the type of natural resource depletion or environmental degradation cost; P is the resident population of each province; C is the accumulation of natural resource depletion in each province. Referring to the research methods of other scholars (Wang et al., 2006; Huang and Xu, 2017), the depletion of natural resources only considers the loss value of water resources and fossil energy. The loss value of water resources is expressed as the product of the average price of water resources in the provincial capitals and the water consumption of each province. The loss value of fossil energy is expressed as the product of the unit international average price of coal, oil, and natural gas and the consumption of each fossil energy. E represents the cumulative cost of environmental degradation in each province. Referring to the GGDP accounting indicators in the 2004 Green National Economic Accounts Report, the cost of environmental degradation is equal to the sum emission losses of the “Three Wastes” (i.e., wastewater, waste gas, and waste solid) and environmental protection expenditures. The emission loss of the “Three Wastes” is expressed as the product of the average price per unit treatment and the amount emissions of the three kinds of wastes.
3.4.2 Financial resource allocation efficiency
Wurgler (2000) proposed that the elasticity of capital to profits could express a country’s capital allocation efficiency. The improvement of capital allocation efficiency could continue to make additional investments in industries (or projects) with higher returns and timely reduction of capital in industries (or projects) with lower returns. This paper argues that the function of the financial market is to absorb and allocate financial resources to provide capital for the development of the real economy. The effective allocation of financial resources depends on whether financial resources can be put into industries that can significantly promote the growth of the real economy through financial institutions and financial markets. Given this, we choose two dimensions, which refer to the credit resource efficiency (CRE) and savings-investment transformation rate (SIR), to measure the efficiency of financial resource allocation. CRE is obtained by referring to the measurement method of Wurgler (2000). The specific model is as follows:
Here, loani,t represents the loan balance of financial institutions at Year-end in period t in region i, and η is the sensitivity coefficient of loans to changes in GDP, which is an indicator of the efficiency of credit resource allocation. CRE is calculated by using varying coefficient models.
SIR is expressed by the total investment in fixed assets and the deposit balance of financial institutions. Its meaning is the efficiency of converting total savings into investment in fixed assets.
3.4.3 Control variables
In order to exclude the influence of other factors on the regression analysis results, we selected the following control variables:
According to Solow’s definition of the production function, capital, labor, and technological progress are the main factors determining economic growth. Therefore, we choose capital stock per capita (LnperK), the labor force (Lnlabor), and regional innovation level (LnInnvo) as control variables. Investment, consumption, and export are the troikas driving economic growth. Therefore, we choose foreign direct investment (FDI) and household consumption level (Rescon) as control variables. In addition, a reasonable industrial structure can effectively improve resource allocation and promote economic growth. Energy use can affect CO2 emissions and economic growth. Environmental regulation reflects the degree of environmental protection by local governments. Under the constraints of environmental regulation, the industrial structure will be adjusted, which will impact economic growth. The informatization level has become an important determinant of regional economic growth in the knowledge economy era. Urbanization will promote the agglomeration of production factors to cities, and the increase in the number and ranking of cities will promote economic development and structural transformation. According to institutional economics theory, the system can effectively allocate factors by stimulating endogenous factors’ development, thereby affecting economic growth. Therefore, marketization is also an important factor in determining economic development. Based on this, we take industrial structure (Indus), energy structure (Enstr), environmental regulation (ER), information level (Inforl), urbanization level (urban), and marketization level (Market) as control variables. Table 1 lists all variables in detail.
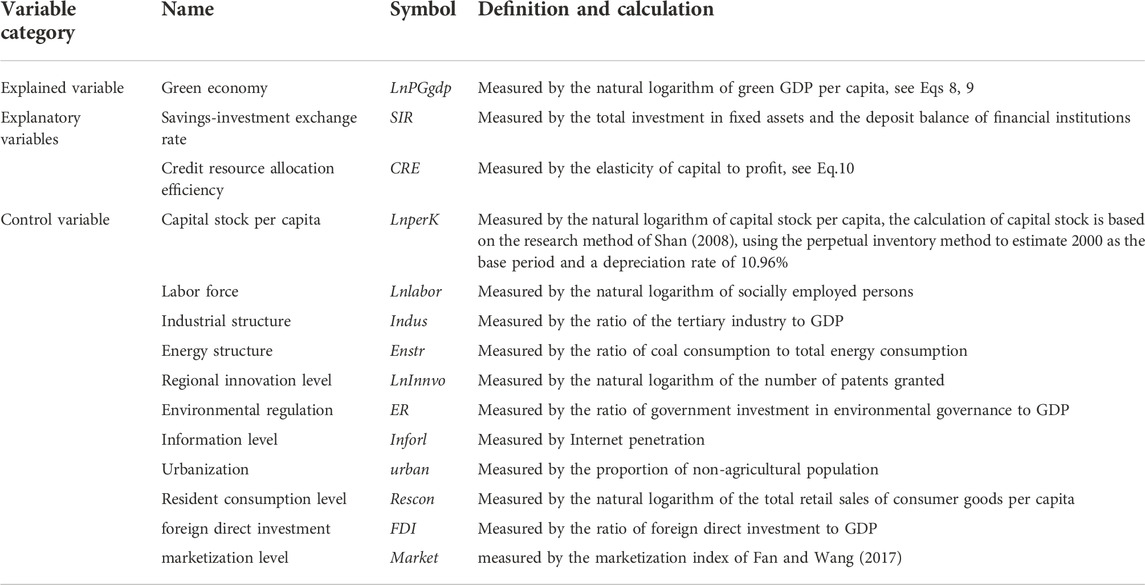
TABLE 1. Variable description.
The annual data of 30 provincial administrative units in China from 2000 to 2019 was collected as the sample data. Due to the lack of a large amount of data in Tibet, and the difficulty in obtaining data from Taiwan, Macau, and Hong Kong, the statistical caliber is different from that of the other regions. Therefore, the regions mentioned above are not included in the paper. The data come from the China Statistical Yearbook, China Environmental Statistical Yearbook, China Energy Statistical Yearbook, World Energy Statistical Yearbook, regional statistical bulletin, and the water price adjustment plan of the provincial capital city price Bureau in past years. Some missing data were supplemented by the linear weighting and interpolation methods by referring to other literature. In order to test regional heterogeneity, the study is divided into the East (Beijing, Tianjin, Hebei, Shandong, Shanghai, Jiangsu, Zhejiang, Fujian, Guangdong, Hainan, and Liaoning), the middle (Jilin, Heilongjiang, Hubei, Hunan, Jiangxi, Anhui, Shanxi, Henan, and Inner Mongolia), and the West (Shaanxi, Yunnan, Guizhou, Sichuan, Chongqing, Guangxi, Gansu, Qinghai, Ningxia, Tibet, and Xinjiang). In order to control the interference of endogenous problems in the model, all independent variables lag by one period.
4 Results and discussion
4.1 Spatial correlation test and spatial model applicability test
Before the model regression, this paper first performs the global Moran’s I test on GE to observe the overall spatial distribution of GE. Table 2 shows GE’s spatial autocorrelation test results from 2000 to 2009. The study found that during the observation period, Moran’s I of GE is significantly positive and within the interval of [0.376, 0.482], which means that China’s green economic development has a positive spatial autocorrelation. All values are statistically significant at the 1% level, indicating a strong spatial agglomeration phenomenon. Therefore, a spatial regression model is used to test the phenomenon further.
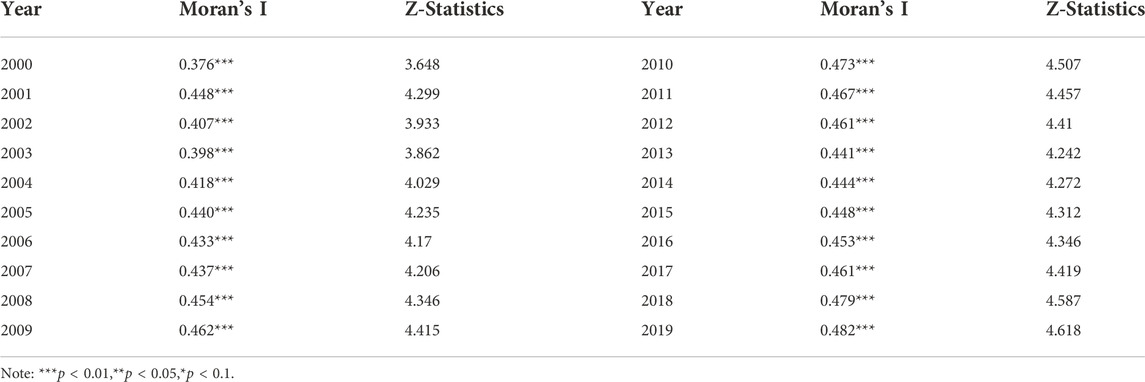
TABLE 2. GE’s spatial autocorrelation test.
Referring to Elhorst (2014b), this paper further uses the LM test, the Robust LM test, the Wald test, the LR test, the Hausman test, and the LR joint significance test to investigate the spatial econometric model and its applicability. Table 3 shows the results of the model suitability test. The results show that although the results of the LMlag test are not statistically significant, the Robust LMlag test passes the test at the 1% significance level. The LMerror test shows that the SEM is better than the SLM. In addition, the Wald and LR tests achieved 1% significance, indicating that the SDM is more suitable for the research models than the SLM and the SEM. The Hausman and LR joint significance tests indicate that a double-fixed spatial Doberman model is needed.
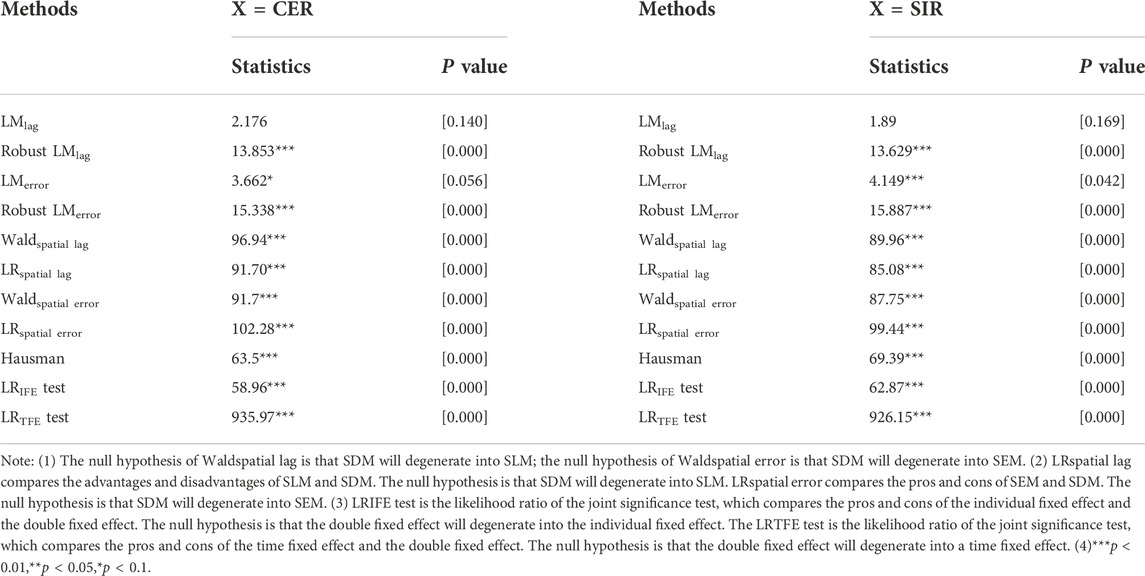
TABLE 3. Spatial model applicability test.
4.2 Regression analysis of spatial doberman model
Table 4 reports the regression results of FRAE on GE. Models (1) and (2) are CRE and SIR regression results, respectively. Model 3) includes CRE and SIR in the model, which is regarded as the robustness test results of models (1) and (2). Model (1) shows that the effect of CRE on GE is 0.005 and achieves the 5% significance level, indicating that the improvement of CRE in the region significantly promotes GE’s development. The effect value of 0.005 means that while CRE increases by 1 unit, GE increases by 0.5% under other conditions unchanged. The effect value of ω×CRE is −0.015 and passes the 1% significance level, which shows that the CRE in the surrounding areas significantly negatively impacts GE within the region. There is a negative spatial externality (spatial spillover effect). The effect value of −0.015 means that when CRE in the surrounding area increases by 1 unit, GE within the region will decrease by 1.5% under other conditions unchanged. The improvement of CRE is manifested in the flow of funds to areas with a high return on investment. When the CRE in adjacent areas is high, it will attract funds to produce a siphon effect, thereby inhibiting GE’s regional development. Model (2) shows that the impact of SIR on GE’s development is insignificant, and there is no spatial spillover effect. The reason is that China’s high savings rate has not been effectively converted into investment. In addition, both models (1) and (2) show that GE has positive externalities, which means that GE’s regional development can drive GE’s development in the surrounding areas.
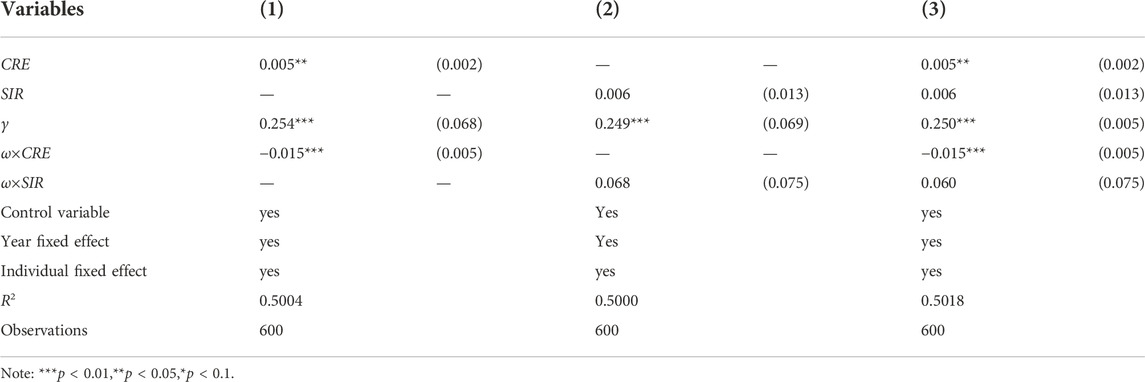
TABLE 4. The empirical results between FRAE and GE.
4.3 Decomposition of spatial spillover effects
We further decompose the spillover effects of the SDM and obtain the decomposition results of direct, indirect, and total effects (see Table 5) in this paper. Table 5 shows that in the CRE model, the coefficients of direct and indirect effects are consistent with the results in Table 4, indicating that the spatial decomposition does not affect the robustness of the results. The direct effect of CRE is smaller than the indirect effect, indicating that the direct impact of CRE on GE’s development is lower than the impact of CRE in surrounding areas on GE’s development. In other words, the impairment of GE caused by the flow of credit resources is greater than the economic benefits arising from improving the CRE within the region. In the SIR model, the coefficients of both direct and indirect effects are consistent with the results in Table 5.
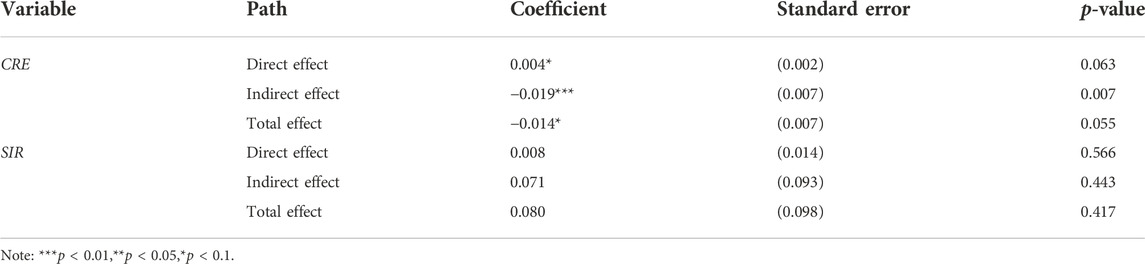
TABLE 5. Decomposition results of spillover effects of the spatial Durbin model.
4.4 Robustness
In this paper, the endogeneity-related test is the primary issue, followed by another robustness test. Since the regression results of SIR are insignificant, we only consider the robustness results of CRE. Table 6 shows the results of various types of robustness tests. Endogenous robustness tests mainly focus on the robustness of the causal relationship between independent and dependent variables. We need to address two issues to identify the causal relationship between CRE and GE. The first issue is the problem of reverse causality: the difference in green economic development between regions may be the critical factor leading to the difference in the efficiency of credit resource allocation. Second, there might be a potential omitted variable bias problem in the model, which means that some important unobservable variables affecting GE are omitted. This paper uses the instrumental variable method to eliminate the influence of the above two types of endogeneity problems.
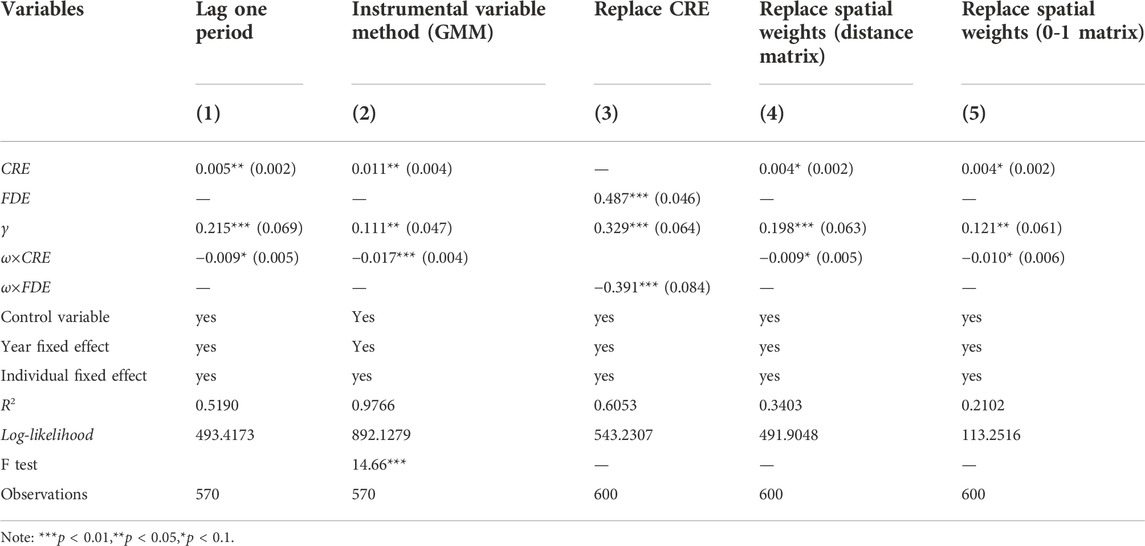
TABLE 6. Robustness test results.
Existing studies often lagged all independent variables by one period when dealing with the reverse causality problem. This is because the dependent variable in the current period does not affect the independent variable in the lagged period. Such a lagging method is also used in this paper. It can be seen from model (1) in Table 6 that after all independent variables are lagged by one period, the test results are still robust. In order to test the robustness of the empirical results more stably, we further use the GMM estimation of the spatial SDM model to re-test the empirical results. Kelejian and Prucha (1998) considered that Wn (In-δWn)−1 Xn can be an ideal instrumental variable when applying the spatial GMM method. In practice, however, the value of δ cannot be known in advance. Fisman and Svensson (2007) pointed out that the problem of synchronous endogeneity caused by the joint action of a specific factor between the explanatory variable and the explained variable can be used as an instrumental variable of the explanatory variable constructing the average value of the regional level. Therefore, we refer to Chowdhury et al. (2014) and Fisman and Svensson (2007) and use the mean value of lagged CRE in adjacent regions (IVCRE) as an instrumental variable for spatial GMM estimation. This is because the lagged terms are incurred variables and are antecedent variables. On the one hand, CRE is a dynamic cumulative process affected by the allocation efficiency of the previous period, making a correlation between the current period CRE and its lagged term, satisfying the correlation principle in selecting the instrumental variables. On the other hand, the characteristics of the mean value of its neighborhood and the lagged term could also ensure that it is not correlated with the disturbance term in the current period, which satisfies the exogeneity principle. This paper uses the F value to test the weak instrumental variable problem in instrumental variable regression. The F value is the outcome of the F test in the first-stage IVCRE and CRE regression models. It can be seen from the model (2) in Table 6 that the F value of 14.66 indicates that there is no weak instrument variable problem. Furthermore, after using IVCRE as an instrumental variable for the spatial GMM estimation, the test results are consistent compared to the previous results. Therefore, the results of this paper remain robust.
We set proxy variables and spatial weights for another robustness test. This paper uses the ratio of GDP to financial institutions’ year-end loan balances (FDE) as a proxy variable for CRE, for that FDE can indicate how many units of GDP can be returned by investing 1 in loans, with larger values indicating a higher return on loans. It can be seen from the model (3) in Table 6 that when we replace CER with FDE, the research results are consistent with the previous results. It indicates the research conclusions’ robustness. And in the robustness test of spatial weight replacement, we select the spatial adjacency matrix and the spatial distance matrix to re-measure the results to test whether the results are stable. It can be seen from models (4) and (5) in Table 6 that after replacing the spatial weights, the research results are still robust.
5 Further analysis: Heterogeneity tests
Table 7 reports the impact of FRAE in the eastern, central, and western regions on GE. In model (1), the effect of CRE in the eastern region on GE is insignificant. However, there is a significant negative spatial spillover effect (ω×CRE =-0.003, p < 0.1). This is due to the redundancy and waste of credit resources arising from the concentration of large amounts of credit resources in the eastern region, and the law of diminishing marginal utility creates diseconomies of scale in financial development and thus fails to promote GE development. The profit-seeking nature of financial resources leads to a movement of financial resources from credit-inefficient regions to credit-efficient regions, thus generating negative externalities. In model (3), CRE in the central region had a significant positive impact on GE in the region (CRE = 0.004, p < 0.01), and there was a significant negative spatial spillover effect (ω×CRE = -0.005, p < 0.05). This is because the industrial structure of the central region is relatively homogeneous, mainly dominated by primary and secondary industries, with insufficient credit resources, and the scale effect has not been achieved. Therefore, the central region is still at the stage of increasing marginal effects, which manifests itself in a more efficient allocation of credit resources, thus promoting the development of GE in the region. Capital is a profit-seeking resource, so the increase in CRE in the surrounding areas will have a negative impact on GE in the local region. In model (5), CRE in the western region has a significant positive impact on GE’s development (CRE = 0.01, p < 0.1), and there is a strong negative spatial spillover effect (ω×CRE = −0.032, p < 0.1), which shows that the western region is more sensitive to funds than other regions.
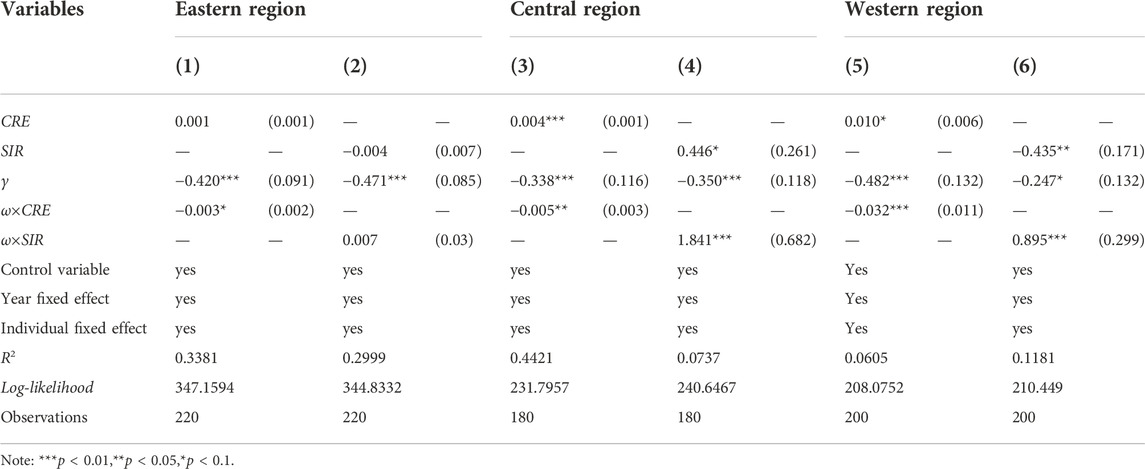
TABLE 7. Heterogeneity analysis of FRAE affecting GE.
In model (2), the SIR in the eastern region has no significant impact on GE. This is because the capital demand in the eastern region mainly comes from the flow of external financial resources rather than savings. In model (4), the SIR in the central region has a significant positive impact on GE (SIR = 0.446, p < 0.1), and there is a positive spatial spillover effect (ω×SIR = 1.841, p < 0.001). It can be seen that the credit resources in the central region come from the transformation of savings, and the savings in the central region also flow internally. In model (6), the SIR in the western region has a significant negative impact on GE (SIR = −0.435, p < 0.05), and there is a positive spatial spillover effect (ω×SIR = 0.895, p < 0.001). It indicates that the credit resources in the western region do not drive GE’s development but are transferred to other regions with high CRE.
This paper further decomposed the spillover effects of the SDM and obtained the decomposition results of direct, indirect, and total effects (see Table 8). Table 8 shows that in the eastern region, coefficients of the indirect and direct effect of CRE and SIR are consistent with Table 7. The coefficient of the spatial spillover effect of CRE is −0.003 (p < 0.05), indicating that CRE in the surrounding area increases by 1 unit, and GE within the area will decrease by 0.3% under other conditions unchanged. In the central region, CRE’s indirect and direct effect coefficients are consistent with Table 7. The direct effect of CRE is 0.005 (p < 0.01), indicating that CRE increased by 1 unit, and GE within the region will increase by 0.5% under other conditions unchanged. The coefficient of the indirect effect of CRE is −0.006 (p < 0.01), indicating that CRE in the surrounding area increased by 1 unit, and GE within the area will decrease by 0.6%. The outcome of the direct effect of SIR is inconsistent with Table 7, indicating that the direct effect of SIR on GE is no longer significant after spatial decomposition. The coefficient of the indirect effect of SIR is 1.441 (p < 0.05), indicating that SIR in the surrounding area increases by 1 unit, and GE within the area will increase by 144.1% with other conditions unchanged. The outcomes of the indirect and direct effect coefficients of CRE and SIR in the western region are consistent with Table 7. The direct effect of CRE shows that CRE increases by 1 unit and GE within the region will increase by 1.1% with other conditions unchanged. The indirect effect of CRE shows that with a 1-unit increase in CRE in the surrounding area, GE within the area will decrease by 3.1%, with other conditions unchanged. The direct effect of SIR shows that SIR increases by 1 unit, and GE in the area will decrease by 45.81% under other conditions unchanged. The indirect effect of SIR shows that SIR in the surrounding area increases by 1 unit, and GE within the area will increase by 84.9% under other conditions unchanged.
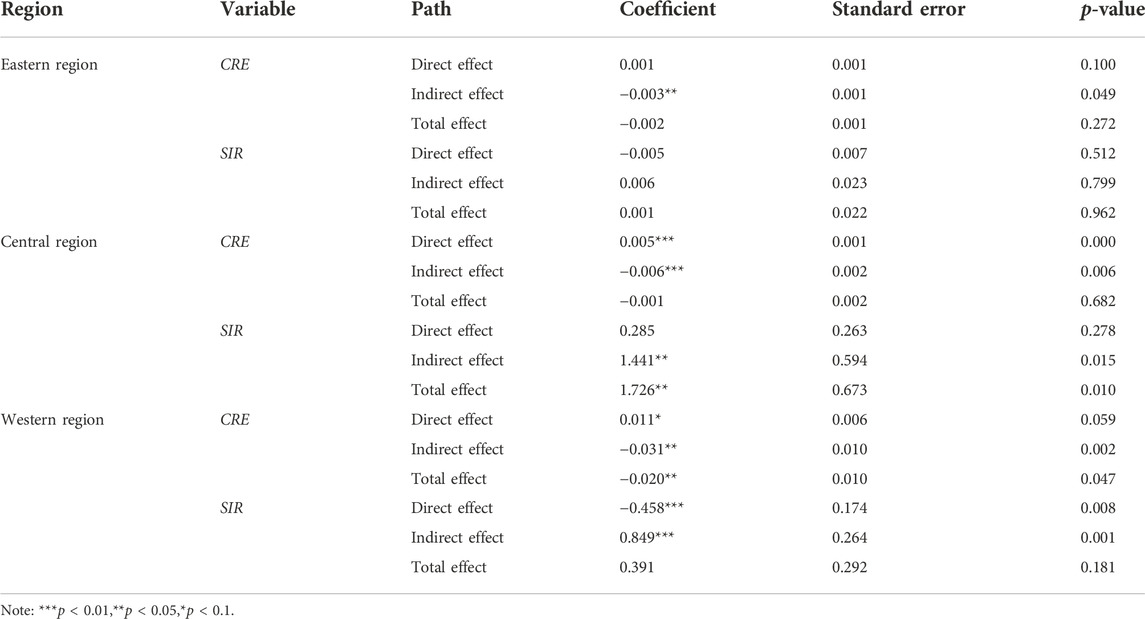
TABLE 8. Decomposition of spatial spillover effects for heterogeneity analysis.
6 Conclusion
In order to cope with the dual challenges of economic downturn and environmental pollution, the Chinese government has raised green economic development to the national strategic level. In this context, studying the relationship between the allocation efficiency of financial resources and green economic development is important for the country or the government to formulate relevant policies, but related research is rare. In this paper, we divide the efficiency of financial resource allocation into the efficiency of credit resource allocation and the savings-investment transformation rate and use the SDM to test the impact of China’s allocation efficiency of financial resources on green economic development from 2000 to 2019. The empirical results show that the efficiency of credit resource allocation has a significant positive impact on green economy development, and there is a negative spatial spillover effect. The impact of the savings-investment transformation rate on green economic development is insignificant, and there is no spatial effect. It shows that China’s allocation efficiency of financial resources is low, and there is also a siphon effect caused by the flow of credit resources, while the existing savings stock has not formed a real credit resource. The empirical results of samples from each region show a negative spatial spillover effect on the allocation efficiency of financial resources in the eastern region. The allocation efficiency of financial resources in the central and western regions has a driving effect on the green economic development within the region, and both have negative spatial spillover effects. As far as the savings-investment transformation rate is concerned, the savings-investment transformation rate in the eastern region has no significant impact on the green economy, and there is no spatial spillover efficiency. The savings-investment transformation rate in the central region has a positive spatial spillover effect. The savings-investment transformation rate in the western region significantly negatively impacts the green economy, but there is a positive spatial spillover effect.
Based on the above conclusions, we propose the following policies. In order to realize the coordinated development of financial development and a green economy in China, the first premise is to improve the rationality of the allocation of financial resources. And it is necessary to formulate different financial policies and economic measures according to the specific conditions of the eastern, central, and western regions. For example, it is well known that the eastern region has the highest degree of financial agglomeration but the most severe misallocation of financial resources. Therefore, the reform of the financial system should be strengthened in the eastern region to improve the utilization efficiency of financial resources and solve the diseconomies of scale caused by the excessive accumulation of financial resources. For the central region, it is necessary to strengthen the investment of government financial resources and flexibly use institutional policies to attract private capital to promote the optimization and upgrading of the industrial structure and provide funds and service support for undertaking green industries. For the western region, it is necessary to increase the introduction of private capital to realize the rational allocation of financial resources, promote the diversified development of industries, and promote the green development of the economy.
Secondly, the government should strengthen the reform of financial institutions and improve the efficiency of financial resource allocation. Financial supports for green economic development are related to the scale of financial support, the utilization rate of funds, and the efficiency of credit resources in regional allocation. Therefore, the authorities would better formulate reasonable macro-financial policies and improve the relevant supervision measures, strengthen the supervision of the use of funds, speed up the flow of regional financial resources and strive to improve the efficiency of credit resource allocation and capital use. At the same time, it is necessary to relax the financial access threshold, reduce the government’s intervention in financial activities and use interest rate liberalization and other tools to enable the market to allocate financial resources and improve the efficiency of deposit-investment conversion.
Thirdly, the government should also deepen the financial reform and promote the development of green finance. On the one hand, it is necessary to take full advantage of green finance supports to guide the capital flow to the emerging green industries and encourage the development of the related industries. On the other hand, it is necessary to give full play to the resource allocation function of green finance, improve the industrial structure, and promote the transformation of traditional industries.
Data availability statement
The original contributions presented in the study are included in the article/Supplementary Material, further inquiries can be directed to the corresponding author.
Author contributions
XJ: conceptualization, writing—review and editing, methodology, and manuscript revision. YT: acquisition of original data, software, formal analysis, methodology, and manuscript revision. WS: reference management, funding acquisition, and manuscript revision critically. All authors contributed to the article and approved the submitted version.
Conflict of interest
The authors declare that the research was conducted in the absence of any commercial or financial relationships that could be construed as a potential conflict of interest.
Publisher’s note
All claims expressed in this article are solely those of the authors and do not necessarily represent those of their affiliated organizations, or those of the publisher, the editors and the reviewers. Any product that may be evaluated in this article, or claim that may be made by its manufacturer, is not guaranteed or endorsed by the publisher.
References
Ahmed, A. D. (2013). Effects of financial liberalization on financial market development and economic performance of the SSA region: An empirical assessment. Econ. Model. 30, 261–273. doi:10.1016/j.econmod.2012.09.019
Anselin, L., Gallo, J. L., and Jayet, H. (2008). The econometrics of panel data: Fundamentals and recent developments in theory and practice. Berlin Heidelberg: Springer Verlag Press.
Anselin, L. (1988). Lagrange multiplier test diagnostics for spatial dependence and spatial heterogeneity. Geogr. Anal. 20 (1), 1–17. doi:10.1111/j.1538-4632.1988.tb00159.x
Anselin, L. (2003). Spatial externalities, spatial multipliers, and spatial econometrics. Int. Regional Sci. Rev. 26 (2), 153–166. doi:10.1177/016001760225097
Aziz, T., Khan, M. G. U., Islam, M. T., and Pradhan, M. A. H. (2022). An analysis on the relationship between ICT, financial development and economic growth: Evidence from Asian developing countries. J. Int. Trade Econ. Dev., 1–17. doi:10.1080/09638199.2022.2134912
Bai, Q-x. (2003). Sustainable development theory and strategy of finance based on financial resources doctrine: Also on the change from traditional financial concept to a modern one. J. Guangdong Univ. Finance Econ. (05), 5–10. (in Chinese).
Cai, W., Wang, C., Chen, J., and Wang, S. (2011). Green economy and green jobs: Myth or reality? The case of China’s power generation sector. Energy 36 (10), 5994–6003. doi:10.1016/j.energy.2011.08.016
Castro, P., Gutiérrez-López, C., Tascón, M. T., and Castaño, F. J. (2021). The impact of environmental performance on stock prices in the green and innovative context. J. Clean. Prod. 320, 128868. doi:10.1016/j.jclepro.2021.128868
Chowdhury, M. T. H., Bhattacharya, P. S., Mallick, D., and Ulubaşoğlu, M. A. (2014). An empirical inquiry into the role of sectoral diversification in exchange rate regime choice. Eur. Econ. Rev. 67, 210–227. doi:10.1016/j.euroecorev.2014.02.001
Claessens, S., and Laeven, L. (2003). Financial development, property rights, and growth. J. Finance 58 (6), 2401–2436. doi:10.1046/j.1540-6261.2003.00610.x
Cui, H., Wang, R., and Wang, H. (2020). An evolutionary analysis of green finance sustainability based on multi-agent game. J. Clean. Prod. 269, 121799. doi:10.1016/j.jclepro.2020.121799
Ding, A., Daugaard, D., and Linnenluecke, M. K. (2020). The future trajectory for environmental finance: Planetary boundaries and environmental, social and governance analysis. Acc. Finance 60 (1), 3–14. doi:10.1111/acfi.12599
Dulal, H. B., Dulal, R., and Yadav, P. K. (2015). Delivering green economy in Asia: The role of fiscal instruments. Futures 73, 61–77. doi:10.1016/j.futures.2015.08.002
Elhorst, J. P. (2014a). Matlab software for spatial panels. Int. Regional Sci. Rev. 37 (3), 389–405. doi:10.1177/0160017612452429
Elhorst, J. P. (2014b). Spatial econometrics from cross-sectional data to spatial panels. Heidelberg, NY, Dordrecht, London: SpringerBriefs in Regional Science.
Elhorst, J. P. (2003). Specification and estimation of spatial panel data models. Int. Regional Sci. Rev. 26 (3), 244–268. doi:10.1177/0160017603253791
Fisman, R., and Svensson, J. (2007). Are corruption and taxation really harmful to growth? Firm level evidence. J. Dev. Econ. 83 (1), 63–75. doi:10.1016/j.jdeveco.2005.09.009
Graff, M., and Karmann, A. (2006). What determines the finance-growth nexus? Empirical evidence for threshold models. J. Econ. 87 (2), 127–157. doi:10.1007/s00712-005-0161-7
Greenwood, J., Sanchez, J. M., and Wang, C. (2013). Quantifying the impact of financial development on economic development. Rev. Econ. Dyn. 16 (1), 194–215. doi:10.1016/j.red.2012.07.003
Hafner, S., Jones, A., Anger-Kraavi, A., and Pohl, J. (2020). Closing the green finance gap–A systems perspective. Environ. Innovation Soc. Transitions 34, 26–60. doi:10.1016/j.eist.2019.11.007
Hassan, M. K., Sanchez, B., and Yu, J. S. (2011). Financial development and economic growth: New evidence from panel data. Q. Rev. Econ. finance 51 (1), 88–104. doi:10.1016/j.qref.2010.09.001
He, L., Zhang, L., Zhong, Z., Wang, D., and Wang, F. (2019). Green credit, renewable energy investment and green economy development: Empirical analysis based on 150 listed companies of China. J. Clean. Prod. 208, 363–372. doi:10.1016/j.jclepro.2018.10.119
Huang, H., and Xu, Q. (2017). Study on the influence of population mobility and industrial structure transformation upon green GDP of Shanghai. China Soft Sci. (04), 94–108. (in Chinese).
Ibrahim, M., and Vo, X. V. (2021). Exploring the relationships among innovation, financial sector development and environmental pollution in selected industrialized countries. J. Environ. Manag. 284, 112057. doi:10.1016/j.jenvman.2021.112057
Jalil, A., and Feridun, M. (2011). The impact of growth, energy and financial development on the environment in China: A cointegration analysis. Energy Econ. 33 (2), 284–291. doi:10.1016/j.eneco.2010.10.003
Jones, C. I. (2011). Intermediate goods and weak links in the theory of economic development. Am. Econ. J. Macroecon. 3 (2), 1–28. doi:10.1257/mac.3.2.1
Kelejian, H. H., and Prucha, I. R. (1998). A generalized spatial two-stage least squares procedure for estimating a spatial autoregressive model with autoregressive disturbances. J. Real Estate Finance Econ. 17 (1), 99–121. doi:10.1023/a:1007707430416
Lee, C. C., and Lee, C. C. (2022). How does green finance affect green total factor productivity? Evidence from China. Energy Econ. 107, 105863. doi:10.1016/j.eneco.2022.105863
LeSage, J. P., and Pace, R. K. (2008). Spatial econometric modeling of origin-destination flows. J. Regional Sci. 48 (5), 941–967. doi:10.1111/j.1467-9787.2008.00573.x
LeSage, P., and Pace, R. (2009). Introduction to spatial econometrics. Florida: CRC Press,Taylor and Francis Group, 20–44.
Lin, Y-sh. (2016). Economic explanation and comprehensive measure for China environmental pollution[M]. Beijing: Normal University Press.
Liu, Q., Wang, S., Zhang, W., Zhan, D., and Li, J. (2018). Does foreign direct investment affect environmental pollution in China's cities? A spatial econometric perspective. Sci. total Environ. 613, 521–529. doi:10.1016/j.scitotenv.2017.09.110
Loiseau, E., Saikku, L., Antikainen, R., Droste, N., Hansjürgens, B., Pitkänen, K., et al. (2016). Green economy and related concepts: An overview. J. Clean. Prod. 139, 361–371. doi:10.1016/j.jclepro.2016.08.024
Lv, C., Bian, B., Lee, C. C., and He, Z. (2021). Regional gap and the trend of green finance development in China. Energy Econ. 102, 105476. doi:10.1016/j.eneco.2021.105476
Mark, F., and Mark, D. (2009). Creating jobs and growth: The German green experience. Germany: Deutsche Bank, 1–7.
Mealy, P., and Teytelboym, A. (2020). Economic complexity and the green economy. Res. Policy 51 (8), 103948. doi:10.1016/j.respol.2020.103948
Merino-Saum, A., Baldi, M. G., Gunderson, I., and Oberle, B. (2018). Articulating natural resources and sustainable development goals through green economy indicators: A systematic analysis. Resour. Conservation Recycl. 139, 90–103. doi:10.1016/j.resconrec.2018.07.007
Merino-Saum, A., Clement, J., Wyss, R., and Baldi, M. G. (2020). Unpacking the green economy concept: A quantitative analysis of 140 definitions. J. Clean. Prod. 242, 118339. doi:10.1016/j.jclepro.2019.118339
Oliveira, J. A. P. D., Doll, C. N. H., Balaban, O., Jiang, P., Dreyfus, M., Suwa, A., et al. (2013). Green economy and governance in cities: Assessing good governance in key urban economic processes. J. Clean. Prod. 58, 138–152. doi:10.1016/j.jclepro.2013.07.043
Pan, W., Pan, W., Hu, C., Tu, H., Zhao, C., Yu, D., et al. (2019). Assessing the green economy in China: An improved framework. J. Clean. Prod. 209, 680–691. doi:10.1016/j.jclepro.2018.10.267
Park, J., and Page, G. W. (2017). Innovative green economy, urban economic performance and urban environments: An empirical analysis of US cities. Eur. Plan. Stud. 25 (5), 772–789. doi:10.1080/09654313.2017.1282078
Ren, S., Wei, W., Sun, H., Xu, Q., Hu, Y., and Chen, X. (2020). Can mandatory environmental information disclosure achieve a win-win for a firm’s environmental and economic performance? J. Clean. Prod. 250, 119530. doi:10.1016/j.jclepro.2019.119530
Shah, K. U., Arjoon, S., and Rambocas, M. (2016). Aligning corporate social responsibility with green economy development pathways in developing countries. Sust. Dev. 24 (4), 237–253.
Shan, H-J. (2008). Reestimating the Capital Stock of China: 1952-2006. The journal of quantitative and technical economics 2008 (10), 17–31. doi:10.13653/j.cnki.jqte.2008.10.003
Su, C. W., Umar, M., and Gao, R. (2022). Save the environment, get financing! How China is protecting the environment with green credit policies? J. Environ. Manag. 323, 116178. doi:10.1016/j.jenvman.2022.116178
Tamazian, A., and Rao, B. B. (2010). Do economic, financial and institutional developments matter for environmental degradation? Evidence from transitional economies. Energy Econ. 32 (1), 137–145. doi:10.1016/j.eneco.2009.04.004
Tang, S. (2014). Financial resources allocation and disparity in regional economic growth: An empirical analysis of spatial spillover effect in East, middle, and west China. China Soft Sci. (08), 100–110.
UNEP (2011). Towards a green economy: Pathways to sustainable development and poverty reduction. Available at: http://www.Unep.org/greeneconomy/Home/test/tabid/29808/Default.aspx.
Valickova, P., Havranek, T., and Horvath, R. (2015). Financial development and economic growth: A meta-analysis. J. Econ. Surv. 29 (3), 506–526. doi:10.1111/joes.12068
Wang, J. N., Yu, F., and Cao, D. (2006). Study report 2004 for green national economic accounting. China Popul. Resour. Environ. 16 (6), 11–17. (in Chinese).
Wang, X-l., Fan, G., and Yu, J-w. (2017). Marketization Index of China's Provinces:NERI Report 2016. Beijing: Sciences Academic Press (China).
Wang, M.-X., Zhao, H.-H., Cui, J.-X., Fan, D., Lv, B., Wang, G., et al. (2018). Evaluating green development level of nine cities within the Pearl River Delta, China. J. Clean. Prod. 174, 315–323. doi:10.1016/j.jclepro.2017.10.328
Webster, A., and Ayatakshi, S. (2013). The effect of fossil energy and other environmental taxes on profit incentives for change in an open economy: Evidence from the UK. Energy Policy 61 (7), 1422–1431. doi:10.1016/j.enpol.2013.05.016
Wurgler, J. (2000). Financial markets and the allocation of capital. J. Financial Econ. 58 (1), 187–214. doi:10.1016/s0304-405x(00)00070-2
Ye, C., Sun, C., and Chen, L. (2018). New evidence for the impact of financial agglomeration on urbanization from a spatial econometrics analysis. J. Clean. Prod. 200, 65–73. doi:10.1016/j.jclepro.2018.07.253
Zhang, J., Wang, L., and Wang, S. (2012). Financial development and economic growth: Recent evidence from China. J. Comp. Econ. 40 (3), 393–412. doi:10.1016/j.jce.2012.01.001
Keywords: credit resource allocation efficiency, savings-investment transformation rate, green economy development, spatial durbin model, spillover effects
Citation: Ji X, Tang Y and Shao W (2022) Spatial spillover effects of financial resource allocation efficiency on green economy: Evidence from China. Front. Environ. Sci. 10:1037162. doi: 10.3389/fenvs.2022.1037162
Received: 05 September 2022; Accepted: 10 November 2022;
Published: 28 November 2022.
Edited by:
Magdalena Radulescu, University of Pitesti, RomaniaReviewed by:
Xiaodong Yang, Xinjiang University, ChinaChunhai Tao, Jiangxi University of Finance and Economics, China
Copyright © 2022 Ji, Tang and Shao. This is an open-access article distributed under the terms of the Creative Commons Attribution License (CC BY). The use, distribution or reproduction in other forums is permitted, provided the original author(s) and the copyright owner(s) are credited and that the original publication in this journal is cited, in accordance with accepted academic practice. No use, distribution or reproduction is permitted which does not comply with these terms.
*Correspondence: Yixuan Tang, dGFuZ3lpeHVhbkB5enUuZWR1LmNu