 Chuan Zhang
 Cai Feng Zou
 Wenbo Luo
94% of researchers rate our articles as excellent or good
Learn more about the work of our research integrity team to safeguard the quality of each article we publish.
Find out more
ORIGINAL RESEARCH article
Front. Environ. Sci., 25 October 2022
Sec. Environmental Economics and Management
Volume 10 - 2022 | https://doi.org/10.3389/fenvs.2022.1036810
This article is part of the Research TopicResources and Environmental Management for Green DevelopmentView all 26 articles
China has recently taken several measures to counter the environmental pollution caused by the crude model of past economic development. Among them, taxation has proved especially efficient. We take the Environmental Protection Tax Law, implemented on 1 January 2018, as a quasi-natural experiment to study the effect of environmental protection tax reform on corporate green technology innovation. We analyze data on Shanghai and Shenzhen A-share listed companies for 2013–2020. We find that raising the tax levy significantly promotes green innovation among enterprises. The promotion effect is more significant in state-owned enterprises, heavily polluting enterprises, and the eastern region. The findings of the full sample and subsample still hold after replacing the explanatory variables for stability testing. The effects vary significantly based on property rights, geography, and level of industry pollution. Nevertheless, environmental tax reform is an effective initiative toward environmental protection, even if the complexity of China’s economic environment reveals some variation in the effects of this policy reform. We make suggestions to address these differences for future studies.
China still faces grave environmental concerns resulting from rapid industrialization, urbanization and development, particularly the pollution of its air, water, and soils (Sun et al., 2018). The maturation of industrialization and the information society brought China’s attention to “green production” and “green innovation,” already popular trends in Western markets and economies. The report of the 19th National Congress also envisions a new era of “socialism with Chinese characteristics.” It recognizes a change in the contradictions of society and how unbalanced, insufficient development is throttling balanced growth.
The Chinese economy entered a new normal to achieve high-quality development. The evolution means increasing and stricter environmental protection requirements, ushering the need for corporate technological innovation spanning production to operation. Enterprises must eliminate backward production capacity, promote transformation and upgrades, and reduce at source the generation and emission of pollutants. This new era also requires the government to raise its emission standards for enterprise-generated pollutants, and accordingly, implement a stricter regulatory system.
The pollution caused by enterprises’ production and operation has negative externalities. To reign in these externalities, the government must enforce macro control and solve market failure through taxation, a most direct and efficient solution. This measure may inspire independent R&D and green innovation among enterprises seeking to “green” their production and operations, reduce environmental pollution at source, and contribute to environmental protection.
The first of its kind in the country, the Environmental Protection Tax Law of the People’s Republic of China (hereafter, “the Law”) came into effect on 1 January 2018. Its fundamental purpose is to protect the environment, reduce pollutants, and actively promote an ecological civilization. More specifically, it shifted emission regulations from under administrative fee management to the Law, marking a paradigmatic shift in how the government approaches environmental protection. The Law embodies the legal and economic instruments of environmental protection and aims to push enterprises toward green technology innovation. In this context, we examine the effect of the Environmental Protection Tax Law reform (hereafter, “tax reform”) on green technology innovation in enterprises.
We consider this Law a quasi-natural experiment to transition from emission charges to environmental protection tax. Based on emission charges, the new tax impacts the tax burden in two ways: the levy standard remains the same after the reform in some provinces, while it increases after the reform in other provinces. In this study, we take enterprises that fall under tax burden leveling as the control group and those under the tax burden increase as the experimental group. We aim to determine whether the effect of tax leveling and tax increases facilitate or inhibit green technology innovation in enterprises. To that end, we investigate the heterogenous effects of tax reform on green technology innovation (hereafter, green innovation) in terms of property rights, the region where the enterprise is located, and the degree of pollution in the industry.
We believe that our study has important marginal contributions. First, despite the recency of the Law’s implementation (year 2018), scholars seldom examined the reform with rigor, especially its effect on enterprises’ green innovation. Our should be a useful reference for further development of subsequent environmental protection taxes. Second, we select intuitive indicators of green innovation output. Specifically, two indicators prove helpful in our empirical analysis: the number of green patent applications and the number of more innovative green invention patent applications. Third, our choice of a quasi-natural experiment with the tax reform and the difference-in-differences (DID) method, excluding other interfering factors, successfully tests the net effect of the tax reform on green innovation. The findings provide support for the effect of the tax reform on green innovation.
In order to achieve the UN SDGs by 2030, sustainable development and ecological civilisation are essential. The integration of science and policy is of vital importance (Bryan et al., 2018). China’s 2018 tax reform is a special kind of environmental regulation that warrants rigorous study of its effect on green innovation. The Porter hypothesis—that environmental regulation stimulates corporate green innovation—is a popular subject of investigation. Most studies conform to three dominant views. First, environmental regulation has an innovation compensation effect. A well-designed environmental regulation policy will promote green innovation among enterprises. Macro- and micro-level studies on the Porter hypothesis support the “innovation compensation” effect. For example, Wang and Zhang (2020), Yuan and Che (2019), and Wang and Chen (2018) confirm the Porter hypothesis using empirical data for different dimensions (e.g., company size, environmental regulations, board governance) and industries. Xiong et al. (2020) and Wang et al. (2021a) use the comprehensive environmental regulation policy of a low-carbon city pilot implemented by the Chinese central government in 2010 as a quasi-natural experiment to examine its effects on firms’ green innovation and green total factor productivity by applying the double- and triple-difference methods, respectively. Xiong et al. (2020) find that the pilot policy significantly improved green innovation to a certain extent, Wang et al. (2021a) conclude that the policy could directly promote green total factor productivity at the city level. Yi et al. (2021) used a multi-period DID model to conduct a quasi-natural experiment on the environmental governance mechanism of the first round of the Central Environmental Protection Inspectorate. They show that the innovation compensation effect was greater than the cost-following effect, which improved green innovation.
Second, environmental regulation has a “cost-following” effect: environmental regulation inhibits green innovation. In their study of China’s SO2 emissions trading scheme pilots, Tu and Chen (2015) argue that the Porter effect did not appear significantly at this stage. They attributed this result to the overall weak environmental regulation and market inefficiency. Jia and Cui (2020) found that market-based and voluntary environmental policy instruments have not played an effective role in green innovation. Zhong and Shang (2022) analyze the mechanism and effect of environmental regulation on the efficiency of urban industry. Guan et al. (2022) conduct an empirical test based on common Frontier robust productivity to examine the impact of environmental regulations on urban green productivity from a spatial spillover perspective.
Third, environmental regulation has an uncertain effect on green innovation; that is, the relationship is non-linear. Zhang et al. (2019) and Du et al. (2019) find that the effect of environmental regulation on the output of green innovation and industrial green competitiveness in micro-analysis had a U-shaped relationship, further verifying the validity of Porter’s hypothesis. Dong and Wang (2021) discover that city-level environmental regulation had obvious threshold characteristics, in which the regulation first depressed progress before improving it. Tao et al. (2021)measure green technology innovation at the quantitative and qualitative levels of green patents. They also measure the quantity and quality of innovation by the higher number of green patent applications and constructing a patent knowledge breadth indicator, respectively. Wang et al. (2021b) used green patent data of Chinese A-share listed companies from 2004 to 2015 to show that, at the early stages under weak environmental regulation, increasing its intensity prompted enterprises to increase pollution control investment. This reduced R&D and innovation investment, leading to lower green innovation capacity. At a certain level of regulation, however, enterprises increased green innovation inputs to improve the input–output efficiency, indicating a U-shaped. This non-linear relationship between regulation and innovation was further studied. The authors apply a double-difference method to examine the effect of the environmental target responsibility system on the quantity and quality of green innovation and find an increase in innovation quantity, but a decline in its quality.
In summary, the literature finds a promotion, an inhibition, and an non-linear effect of regulation on green innovation, possibly because the policies under examination have more indirect effects on firms. However, China is a government-oriented emerging market, and its firms may take taxes, as a special type of environmental regulation that directly affects their tax revenues, more seriously.
Two main changes characterize the collection and management of environmental protection tax. First, the tax and environmental protection departments coordinate to collect and manage taxes, where the former discharges these duties in accordance with the taxation law and the latter monitors and manages the emission of pollutants. The two departments coordinate through an information-sharing platform to regularly deliver relevant data. Second, taxpayers are divided into key and non-key monitored taxpayers for classification and management (Wen, 2015). These changes elevate taxation from the administrative fee level to the legal level, imbuing the Law with tax rigidity and legal authority. The tax levied is earmarked for specific use, which systematically reduces the possibility of enterprises evading environmental governance through rent-seeking (Jin et al., 2020).
The fundamental purpose of continuously increasing the standard of environmental taxes and fees, implementing a stricter collection and management system, and earmarking management for pollution prevention and treatment is to force enterprises to undergo “green upgrading.” This would reduce pollutants at their source to address the symptoms and root causes of environmental pollution. In the long run, these penalties pressure enterprises to actively save energy, reduce emissions, optimize their economic structure, and make green products to obtain sustainable profit points (Albrizio et al., 2017). The Porter hypothesis is thus expected to achieve industry-wide and systemic economic development. This process of transformation has long been a subject of intense scientific scrutiny. Li and Xiao (2020), for example, find that the push-back effect of emission charges on green innovation were reflected in both external pressure and internal incentives. Similarly, Wen and Zhong (2020) consider the increase in environmental tax levy in 2007 as an exogenous event. Their quasi-natural experiment reveals that the adjustment of the emission charge levy significantly benefited the extensive and intensive margins of green innovation, supporting the Porter hypothesis. In contrast, Wen and Zhou (2019) argue that the differential emission fee levy standards were more conducive to the development of a green economy. Zhao et al. (2016) reveal that under the combined effect of market, product, and environmental taxes, a higher environmental tax promoted environmental technology innovation, while a lower overall tax was not conducive to technology innovation. We thus propose the first hypothesis.
H1. The shift from sewage charges to environmental taxes has a promotion effect on the level of green innovation among enterprises.
The effect of the tax reform on green innovation may vary according to the enterprises’ property rights. First, China’s special market economy system is characterized by fundamental differences between state-owned enterprises (SOEs) and non-SOEs in terms of property rights. Hence, each type of enterprise also differs in investment, management, and productivity. Tong et al. (2014) best define these idiosyncrasies in their study, showing that while the Chinese government encouraged SOEs to apply for patents after the second revision of the patent law, invention patents did not increase significantly, even as the total number of patents did. These results effectively imply that the SOEs’ innovation strategies are more likely to be weighted to meet the requirements of national policies than to reflect quality.
Second, SOEs, being national property in nature, usually have stronger bargaining power in negotiations with local governments; they are more likely to receive implicit preferences in the implementation of environmental policies (Jin et al., 2020). SOEs’ policy preferences are often protected by strong administrative barriers, and a substitution effect that weakens their incentive to innovate compared with non-SOEs (Kou and Liu, 2020). In contrast, the market-oriented private enterprises have a stronger incentive to innovate than SOEs (Kou and Liu, 2020). Market-oriented private enterprises must stimulate internal green innovation to achieve sustainable development in the face of environmental regulations, while also reducing their operating costs. However, as SOEs benefit from “state backing,” they also benefit in resource allocation, especially financial support (Zeng, 2021). Thus, we propose the second hypothesis.
H2. The policy shift from emission to environmental protection tax has a more significant effect on promoting green innovation in non-SOEs than in SOEs.
We expect regional heterogeneity in the effect of the tax reform on green innovation. China is spread over a vast geographic area, leading to diverse regional economic characteristics and stark variations in industrial development. For example, because of the relatively slow growth in Western China, some policies encourage an influx of capital and technology to support development in the region (Wu and Li, 2009). In contrast, East China is abundant in capital and technology resources, and can respond to the tax reform by carrying out green innovation.
Yet, when the Law was implemented in 2018, most of the central and western provinces did not actually raise the environment tax rate, despite a unified implementation of the Law. This was primarily because each province sets its own environment tax rate, and the provinces that implemented the Law were mainly the central and western provinces. We thus propose our third hypothesis.
H3. The policy reform of changing emission fees to environmental protection tax has a more significant role in promoting green innovation for enterprises in the eastern region than in the central and western regions of China.
Pollution levels in different industries also determine the effect of the tax reform on green innovation. Each industry has its own process and product characteristics, which leads to varying degrees of polluting emissions. Without green innovation and upgrade of processes/products, the environmental tax burden will be much higher on heavily polluting enterprises than on less- and non-polluting enterprises.
However, China’s vision of an ecological civilization requires that heavy polluters invest in green innovation, or otherwise face burdensome environmental protection costs or decreased development prospects due to their long-term, pollution-heavy, unsustainable development models. On this point, Tang et al. (2013) argue that heavily polluting industries have greater environmental investments than industries that pollute less. Similarly, Jia and Cui (2020) argue that low-carbon city pilot policies promote more significant green innovation in high-carbon industries than in low-carbon industries. They further suggest that this industry heterogeneity is primarily why the effect of policy on green innovation is limited overall. We thus propose our final hypothesis.
H4. The policy reform of changing emission fees to environmental protection taxes has a more significant effect on promoting green innovation among heavy polluters than among non-heavy polluters.
We analyzed annual data on A-share listed companies in China from 2013 to 2020. Corporate green patent data were obtained from the Chinese Research Data Services Platform, while company and regional economic data were drawn from the China Stock Market & Accounting Research Database and the China City Statistical Yearbook. We excluded (1) enterprises with abnormal trading status (ST, *ST, and PT) during the sample period; (2) financial or insurance enterprises, considering their different operations, financing, and so on; (3) enterprises with significant missing data, while missing values were interpolated in some cases; and (4) abnormal values and trimming some continuous variables by 1%. The final sample included 1,862 listed companies and 14,896 observations.
Following Wang and Qi (2016) and Jia and Cui (2020), we used the number of independent green patents by enterprises and the number of independent green invention patents applications in the current year to create the indexes of enterprises’ green technology innovation level. As the number of green patents may be zero, and given the bias positivity of the patent data, we add 1 to all green patent data, and then take the logarithm.
The explanatory variables relate to the environmental protection tax policy implemented from 1 January 2018. This includes the time dummy variable time, policy dummy variable tax, and interaction term
Table 1 presents the levy standards for air pollution and water pollution before and after the tax reform by province. Evidently, for both types of pollution, the tax levy standards increased with sewage charges in some provinces and were unchanged for some others.
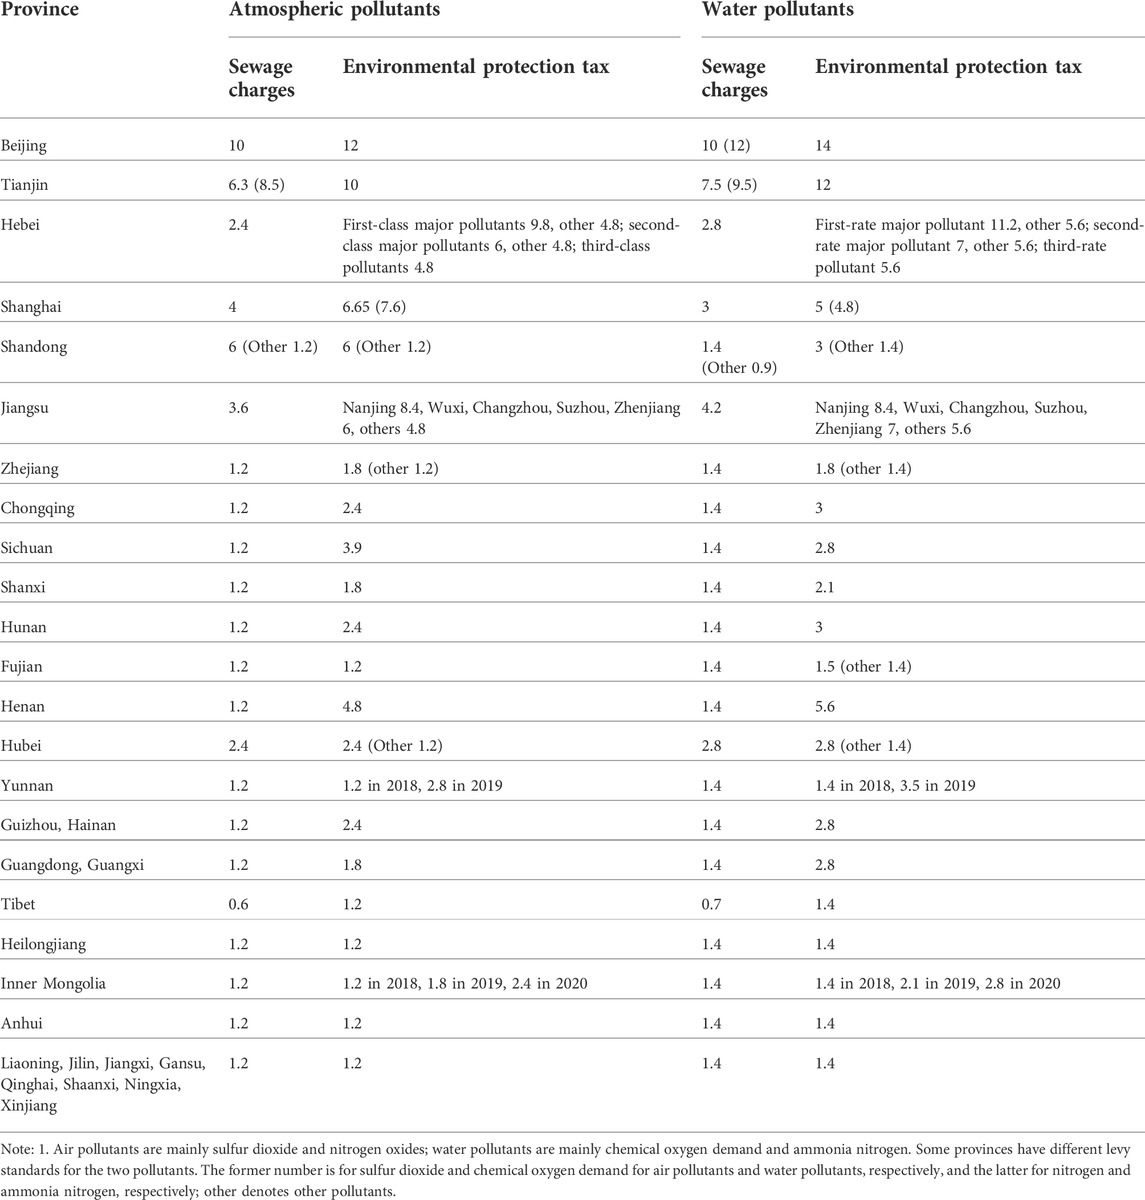
TABLE 1. Comparison of emission fees and 2018 environmental protection tax levy standards by province.
Among the 17 provinces and cities, some such as Beijing, Tianjin and Hebei increased the levy standard for two types of pollutants. We used the companies with registered addresses in these locations as the experimental group, where the value of tax equals 1. We use others such as Anhui, Liaoning, and Jilin, which did not change their levy standards before and after policy implementation, as the control group. The value of tax in this case is 0. Thus, we have 12 provinces and cities for our analysis. Yunnan and Inner Mongolia show dynamic adjustment in the reform of the levy standard; they did not change the levy standard in 2018 but raised it after. Because we use the DID method, and the time dummy variable takes the value of 1, including for 2018 to 2020, we excluded data from these two provinces.
Owing to the complexity of the business process, the level of enterprise green innovation is also influenced by various factors. Following Yu and Lianchao (2019) and Fei and Zhang (2020), we select the control variables based on the basic situation and governance structure of the enterprise, the financial status of the enterprise, and the economic development status at the provincial level. Table 2 provides the definitions of the variables.
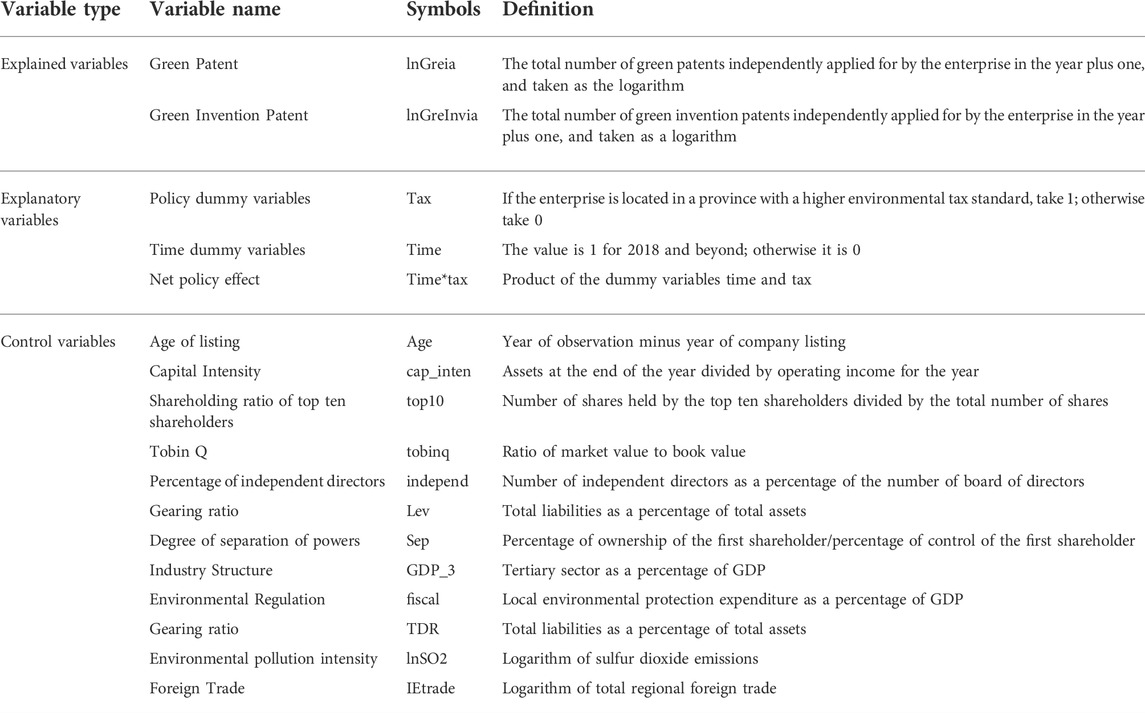
TABLE 2. Definition of main variables.
The double-difference score can empirically assess policy effects, making it a popular instrument of measurement in policy studies. In our study, the dummy variable tax is a policy variable. We divide the sample into enterprises with a higher tax burden (treatment group) and those with no changes in the tax burden (control group. The dummy variable time is a non-policy time variable based on the formal implementation date of 1 January 2018.
Model 1 is the basic double-difference model. Table 3 summarizes the meaning of each parameter in this model. The basic principle is that in the control group, the impact coefficient on green innovation before the tax reform (i.e., the stage of levying emission charges) is
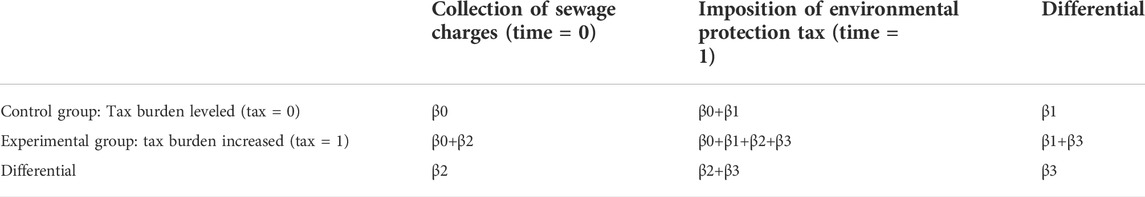
TABLE 3. Double-difference model and parameter definitions.
To examine the effect on green innovation from the emission fee to tax change, we consider the formal implementation of the policy as an exogenous shock. Based on this quasi-natural experiment, we use the double-difference method to analyze the experimental and control samples. We construct the following model by adding the control variables based on Model 1.
where
In this section, we present the descriptive statistics, correlation analysis, parallel trend test, regression analysis of our hypotheses, and subsample analysis.
Table 4 presents the results of the descriptive statistics of the main variables. The log lnGreia of green patents and the log lnGreInvia of green invention patents are the explanatory variables. The mean and median of lnGreia are 1.063 and 0.693, respectively, with a standard deviation of 1.272; with values ranging from 0 to 7.319. The values of lnGreInvia range from 0 to 6.829, with a standard deviation of 1.072, mean of 0.735, and median of 0. These statistics indicate differences between firms in the outcomes of green patents versus invention patents.
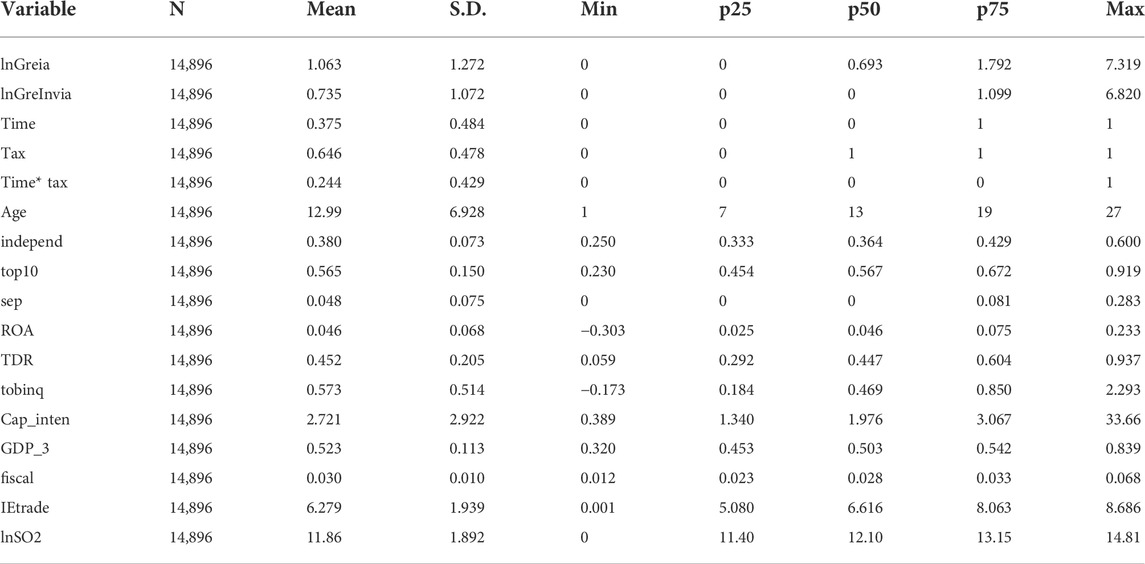
TABLE 4. Descriptive statistics of the main variables.
The mean and median of the dummy variable time are 0.375 and 0, respectively; the mean and median of the dummy variable tax are 0.646 and 1, respectively. These results indicate that the experimental group’s sample size is marginally bigger than that of the control group. The mean and median of the interaction term
Among the other control variables, the standard deviation of enterprises’ listing age is 6.928, with larger data, as some enterprises were listed earlier. China’s rapid development means the constant listing of new enterprises, making the average listing age shorter, which yields a larger standard deviation. Thus, the standard deviation of asset intensity cap_inten reaches 2.721, with larger data, perhaps because of the large differences between industries and the resulting corresponding differences in investment and financing. This leads to similarly larger differences in capital intensity. The mean and median of age (from listing to the present) at IPOage and asset intensity cap_inten, do not differ much, indicating that they follow a positive distribution. The standard deviations of the remaining control variables are relatively small, and the difference between the mean and median is not large and follows a positive-terrestrial distribution. Further, the distribution of the variables is within the normal range and there are no outliers. Hence, we may continue using the sample data for further analysis.
We follow Bertrand et al. (2004) to ensure that the data composition of the experimental and control groups satisfy the common trend assumption as an important prerequisite for ensuring the validity of the double-difference estimation. We thus conduct a common trend test of the sample data before the double-difference estimation. Based on the parallel trend hypothesis, the logarithms of green patent applications of enterprises with higher or flat environmental tax burdens are consistent in the time trend before the tax reform policy. In contrast, a significant change in the parallel trends between the experimental and control groups after the tax reform policy indicates that the level of green innovation in the enterprises with higher environmental taxation changed in trend relative to the enterprises with flat taxation.
Figure 1 shows the results of the parallel trend test with the parallel trend plots of log green patents lnGreia and log green invention patents lnGreInvia. The horizontal axis is the year and the vertical axis is the mean value of the log of green patent applications. Before 2018, the gap between the experimental and control groups for green patents was small, maintaining a relatively parallel growth trend, but increased significantly after 2018. Although the data for both groups show a significant decreasing trend in 2020, the number of green patents in the experimental group continued to increase relative to the control group. Thus, the premise of the parallel trend test hypothesis was met.
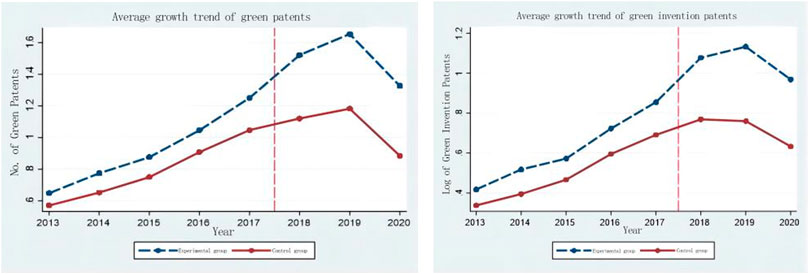
FIGURE 1. Parallel trend test.
The significant decline in green patents in both the experimental and control groups in 2020 may be attributed to the effects of the COVID-19 pandemic, which prompted a global economic slowdown. As the virus was first detected in China, its economy was the first to be affected, resulting in a decline in corporate green innovation output. We remove the effect of the epidemic shock on our results to some extent by using the DID method to estimate the effect of the 2018 tax reform on green innovation.
Table 5 shows the results of the double-difference test on Model 2 using the full sample data. Here, (1) and (3) indicate the tests conducted on corporate green patent lnGreia and green invention patent lnGreInvia without the time, industry, and geographical fixed effects. Models (2) and (4) are the results of the tests with these fixed effects. The regression coefficients of the interaction term
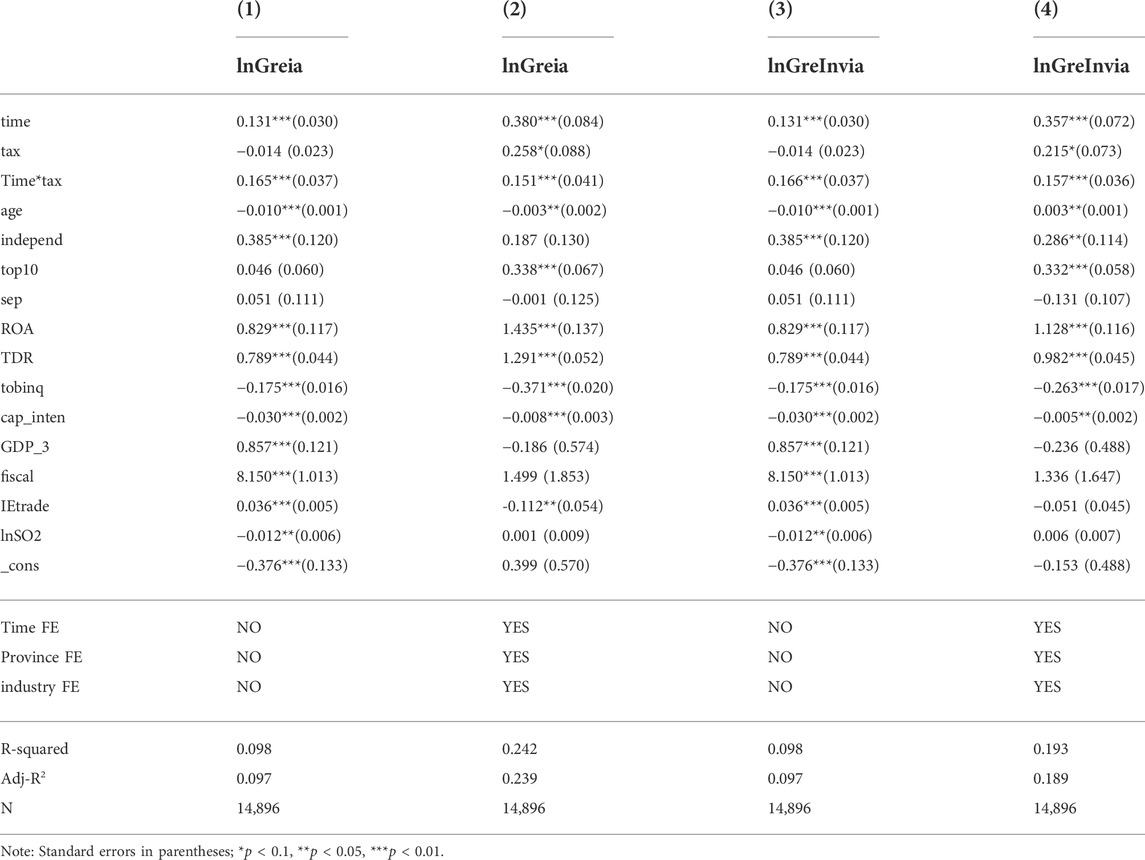
TABLE 5. Double-difference full sample regression results.
The level of green innovation only slightly decreased after controlling for time, industry, and geographical changes, but the coefficient of the interaction term
The results suggest that although only some regions increased the tax burden based on the original emission charges and others adopted the tax burden-shifting scheme, the 2018 tax reform still sent a strong signal to the market that the state is shifting its focus through greater and increasing stringency in its environmental protection requirement. Therefore, enterprises must carry out green innovation to meet these new requirements and accelerate their transformation and upgrading.
Comparing the coefficients of the interaction terms of green patents lnGreia and green invention patents lnGreInvia (are 0.165 and 0.151, respectively) reveals that the coefficients of green patent cross each other downward before and after including fixed effects. These values are lower than the coefficients at which green invention patents cross downward; that is, 0.166 and 0.157. The results indicate that the promotion effect of the tax reform is slightly stronger for green invention patents than on the total number of green patents. This may be because green patents include green invention patents and green utility model patents, where the innovation in the former patents is stronger than the latter (Feng et al., 2021). Thus, we conclude that the innovation in the case of green invention patents is stronger than that of overall green patents.
Extending our regression results, we now investigate the heterogenous effects of the tax reform on green innovation based on property rights, geography, and industry pollution. Following the above findings, we conduct all further tests by controlling for time, industry, and province fixed effects.
In China, firms are classified as either SOEs or non-SOEs. We therefore find large disparities in operations and management between these types of enterprises. We divide the sample into SOEs and non-SOEs to further test the effect of the tax reform on green innovation according to ownership type.
Table 6 presents the results. The coefficients of the interaction term
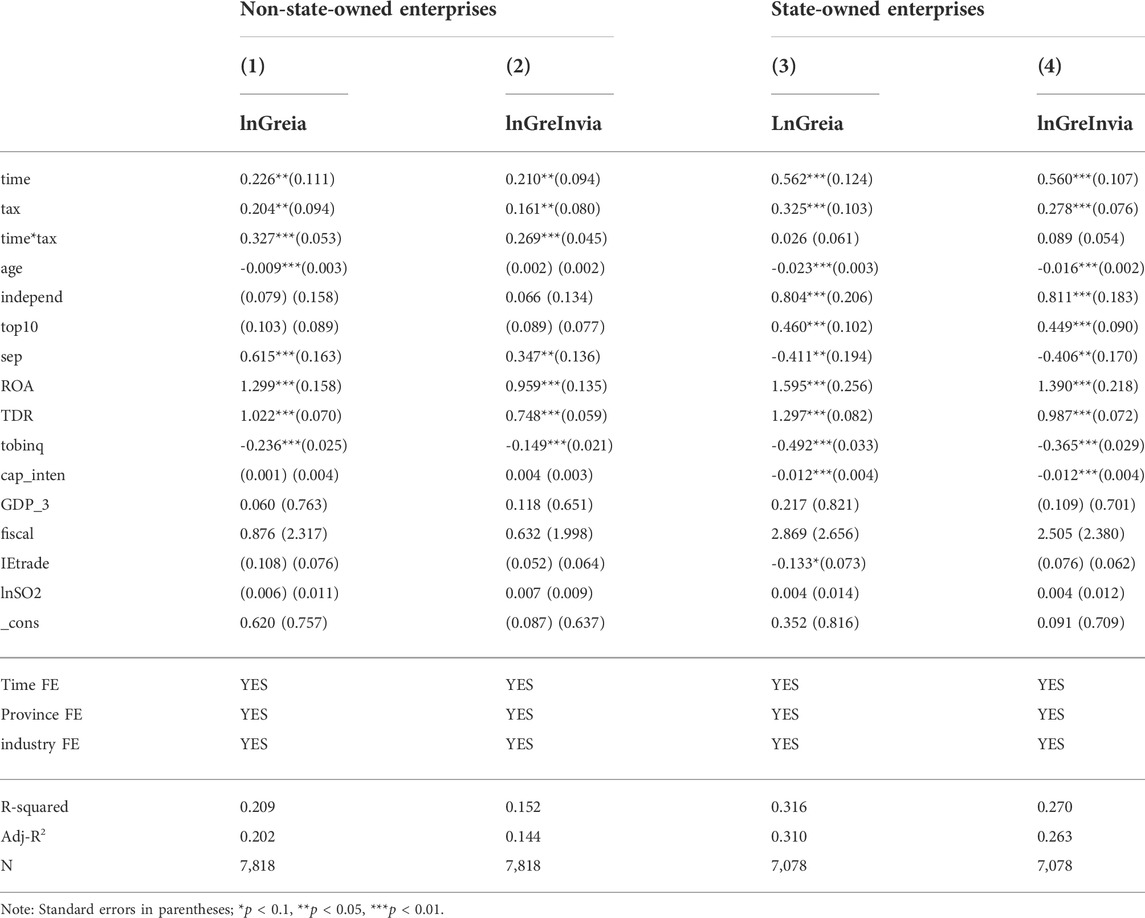
TABLE 6. Regression results for the sample by nature of ownership.
The economic conditions and development levels across provinces in China vary greatly. Hence, each province sets its own environmental tax levies that reflect its specific conditions, but within the scope of the Law. Logically then, the effects on green innovation also vary by geography.
We divide the sample into two subsamples: the eastern and central-western regions of China. Table 7 presents the results of the regression tests. For the eastern region, the coefficients of the interaction term
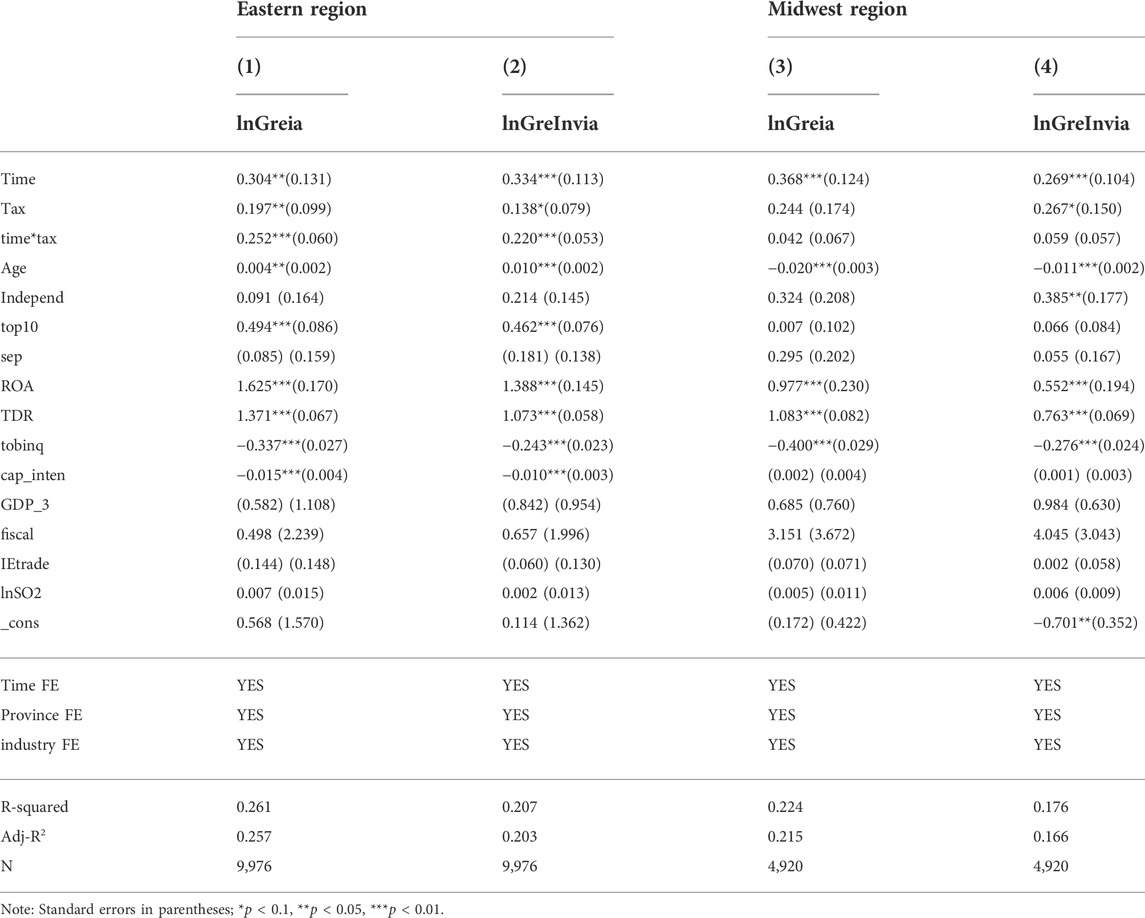
TABLE 7. Regression results by geographical subsample.
This disparity is easy to explain—China’s eastern region is far more developed, with an overall higher standard of environmental tax levy. This condition promotes a stronger willingness among enterprises to conduct green innovation, which reduces pollution emissions and thus environmental taxes. Such enterprises can then move on to the next stage of transforming and upgrading themselves structures on the path to long-term development.
Post tax-reform, polluting enterprises face the burden of the new tax levies. Heavy polluters whose emissions are high throughout the production and operation processes are especially hit hard. Their need for green upgrades to keep pace with national development is thus more urgent, and their willingness to conduct green innovation relatively strong.
According to the degree of pollution of the industry, we divide our enterprise sample into heavily polluting and non-heavily polluting industries for the DID estimation. Our categorization is based on the management list of the environmental verification industry classification for listed companies and the guidelines of environmental information disclosure for listed companies.
Table 8 presents the regression results. The coefficients of the interaction term
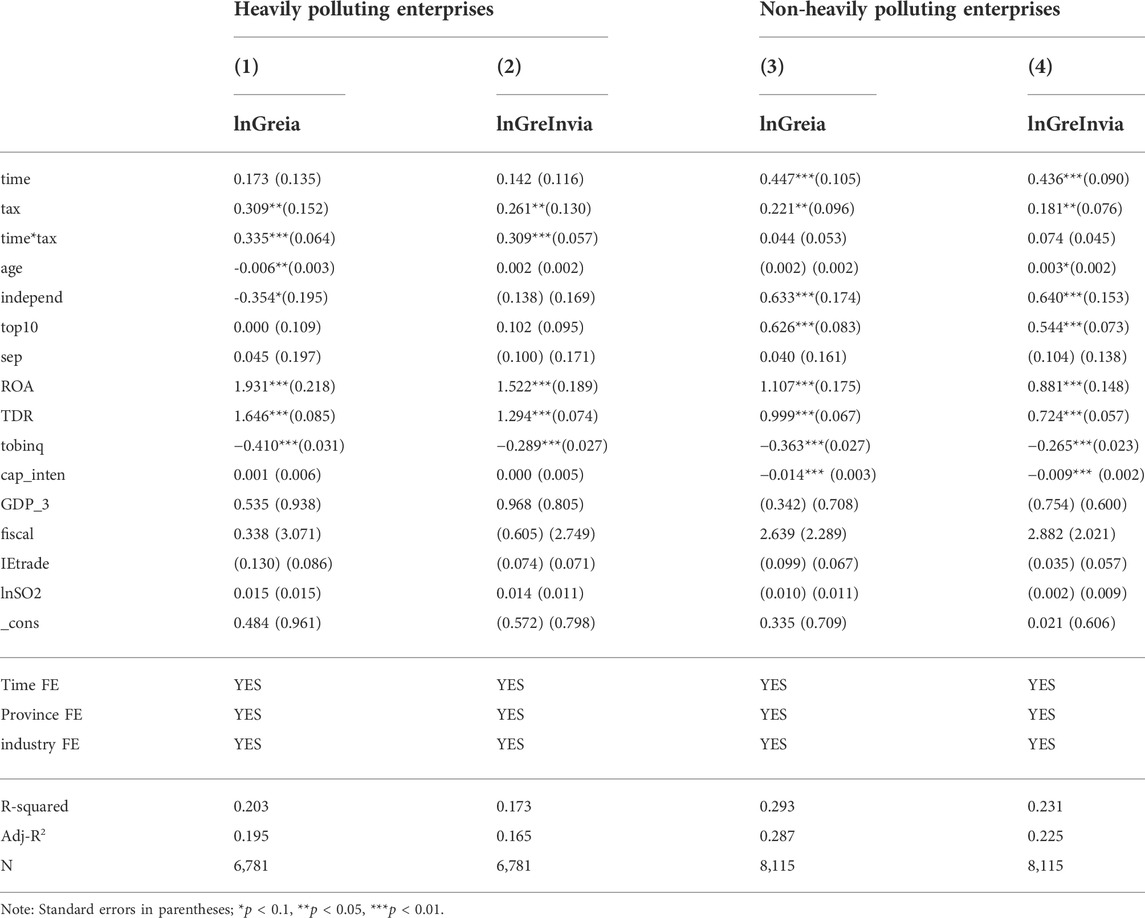
TABLE 8. Regression results by degree of industry pollution.
To ensure the accuracy and reliability of our results, we conduct a robustness test using an alternative measure for the explanatory variables. Following Popp (Fei and Zhang, 2020) and Xu and Cui (Tao et al., 2021), we adopt the ratio of green patents independently filed by enterprises in the current year to the total independently filed patents in the current year (Greia_r) as an alternative measure, and then perform the DID estimation in Model 2.
Table 9 presents the regression results. Columns (1) and (2) present the results for Model 2 without and with the time, industry, and province fixed effects. The regression coefficients of the interaction term
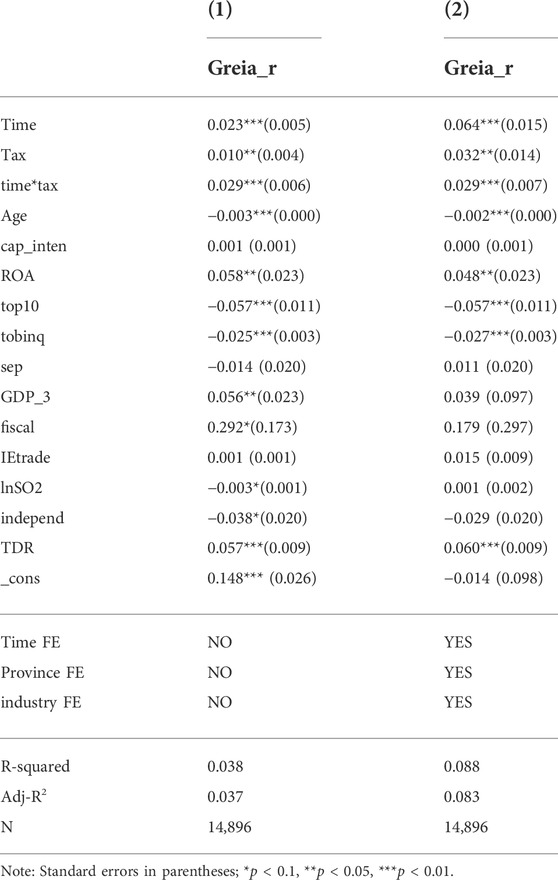
TABLE 9. Robustness test regression results: Alternative explanatory variable.
Based on the robustness check of the main regression, we conduct a second test for the subsample divided by property rights. Table 10 presents the regression results. The coefficients of the interaction term
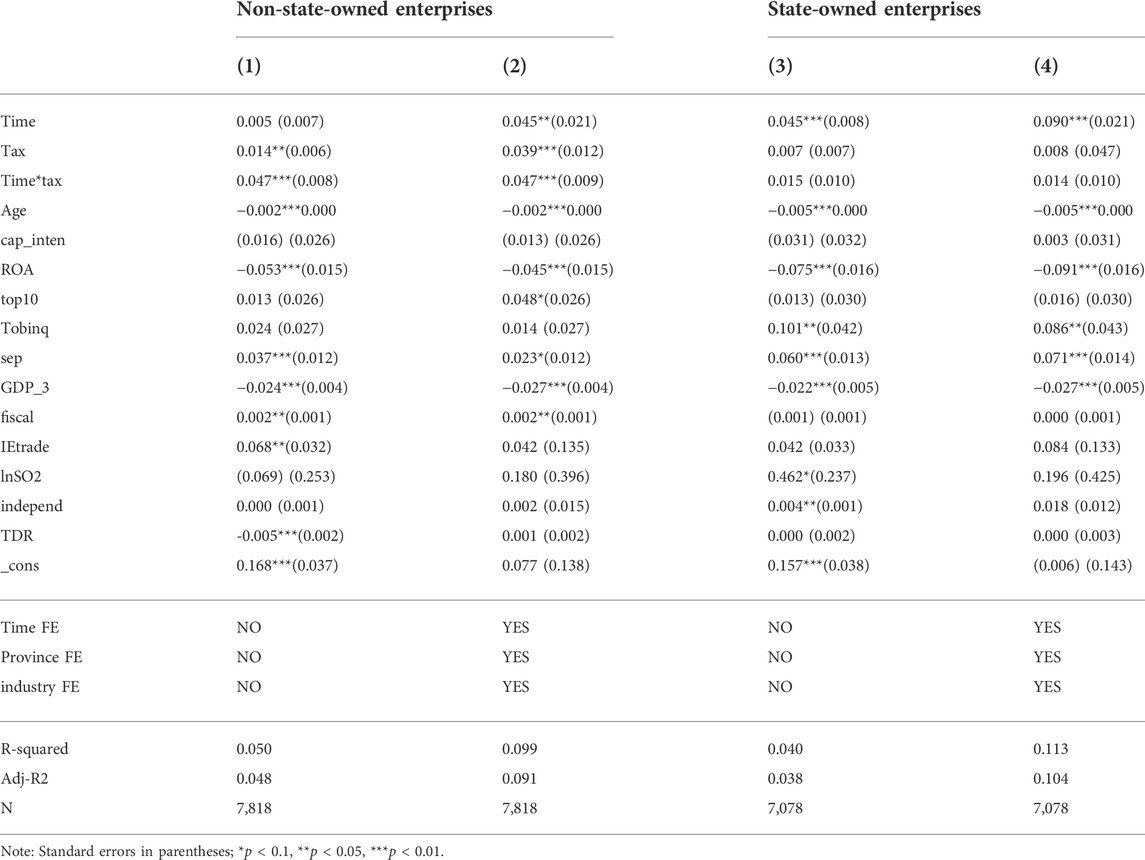
TABLE 10. Robustness test regression results: Property rights subsample.
Table 11 presents the regression results of the robustness test for the geographical subsample. Here, (1) and (3) are the regression results without the time, industry, and province fixed effects, and (2) and (4) are the results with these fixed effects. The coefficients of the interaction term
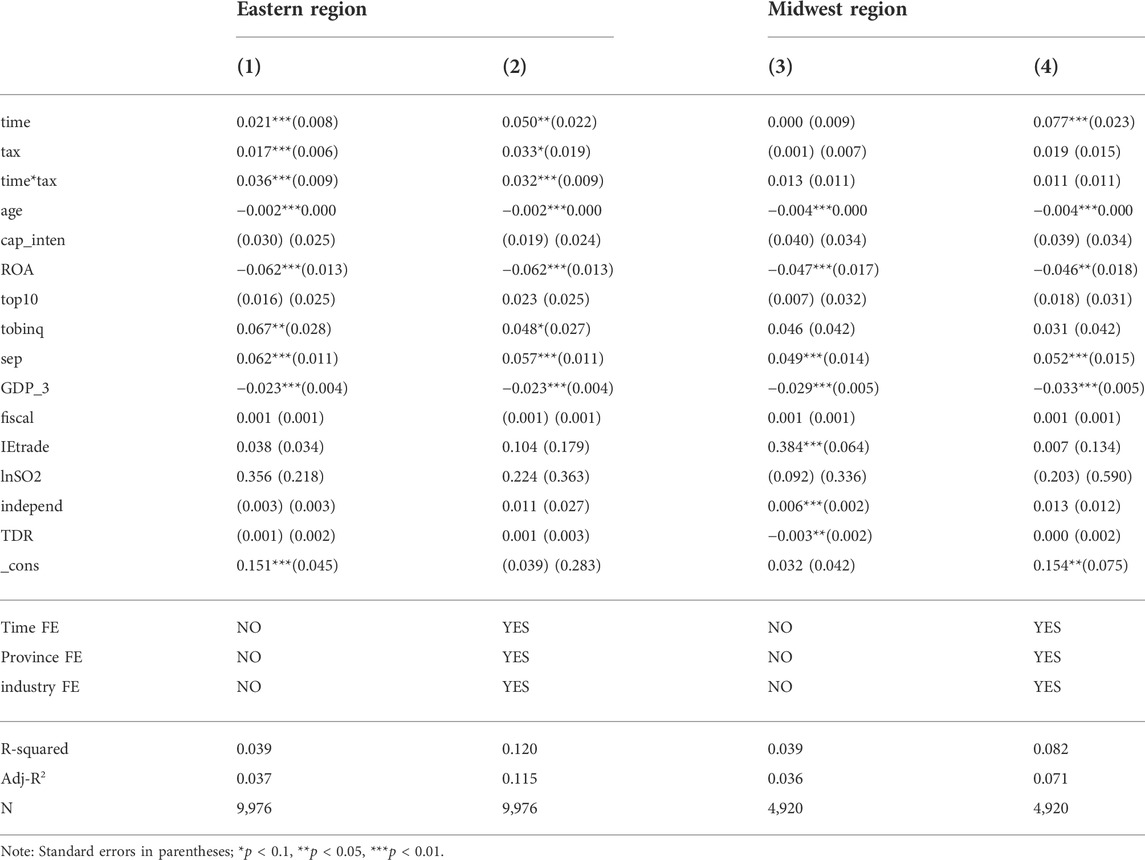
TABLE 11. Robustness test regression results: Regional subsamples.
Table 12 presents the robustness test results for the subsamples based on degree of industry pollution. As with the previous subsample tests, (1) and (3) present the results without the time, industry, and province fixed effects, and (2) and (4) present the results with these fixed effects. The coefficients of the interaction term
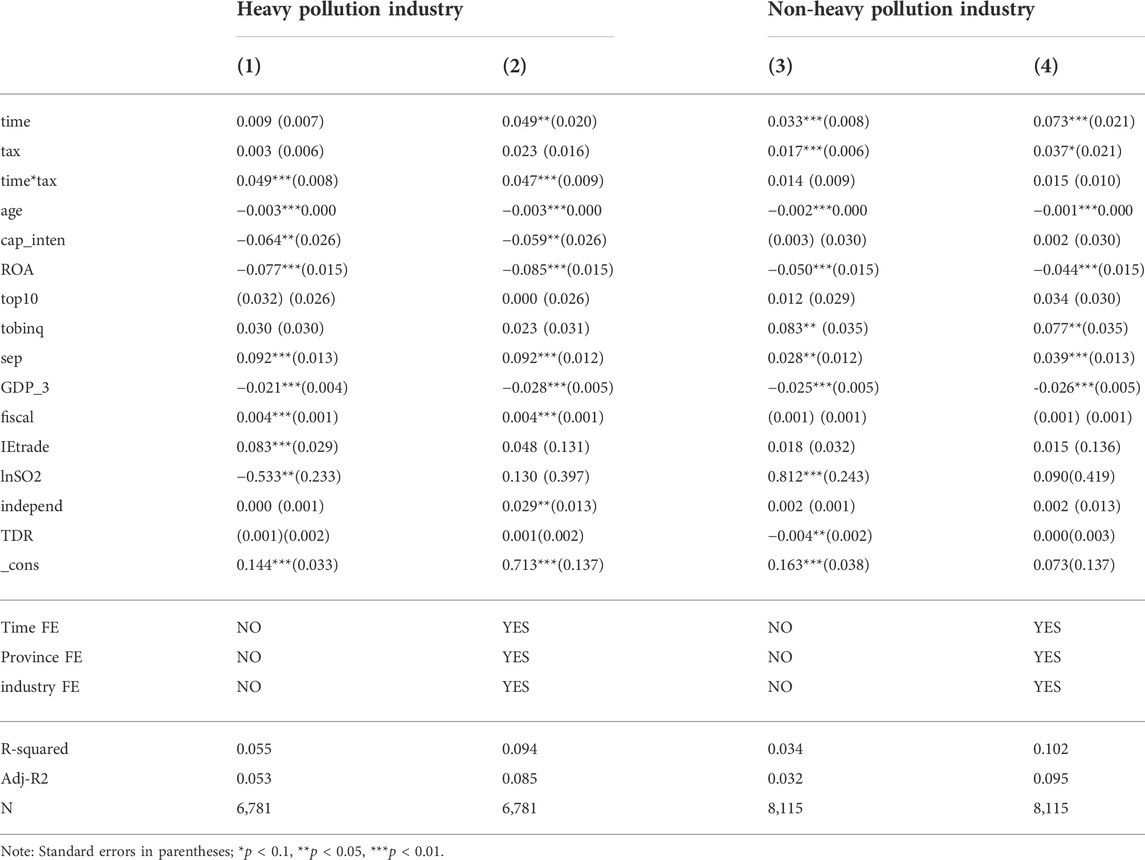
TABLE 12. Robustness test regression results: Degree of industry pollution.
The 2018 environmental tax reform in China marked a paradigm shift away from emissions fees toward taxation to foster an “ecological civilization” in an era of rapid climate change and increasing pollution. This new regulatory regime ends 4 decades of the emissions fee system and further modernizes China’s environmental protection framework. We used this tax reform as a quasi-natural experiment to study its effect on enterprises’ green technological innovation under different conditions that reflect the regional heterogeneity of the country. Our results are summarized below.
Overall, the tax reform has a significant promotion effect on green innovation that is stronger for green invention patents, reflects how this category is generally more innovative than green utility model patents. The subsample regression on enterprises property rights shows that the promotion effect is stronger for non-SOEs than for SOEs, and this finding holds for all green patent data and green invention patents. Thus, non-SOEs responded to the tax reform with greater urgency and jumpstarted green innovation to benefit from the new tax regime. The regional analysis shows that the promotion effect is stronger in the eastern region than in the central and western regions, which reflects the former’s relatively advanced economies and industries. Enterprises in these regions have the resources to innovate and greater motivation to engage in green motivation as the tax levied on them is greater and environmental control is stricter. Finally, we examine the degree of industry pollution and find that the tax reform had a greater effect on heavy polluters, thereby increasing the promotion effect of green innovation. These industries face greater environmental tax costs, higher penalties, and stronger demand for green innovation. Similarly, the promotion effect on the more innovative green invention patents is more significant relative to the total green patent data.
Although we expand the literature on environmental tax reform, our study has some limitations. First, green innovation is a complex, wide-ranging, and comprehensive indicator. Owing to the availability and operability of empirical data, we used enterprises’ annual green patent applications to measure their green innovation, but such data have limitations. Future research can expand on the measurement of green innovation capability and use more comprehensive and representative data.
Second, in terms of quantifying this indicator of environmental tax reform, we considered only whether the new environmental tax burden standard increased or shifted based on the original emissions fee system. We did not analyze the effect of the degree of increase in the tax burden on green innovation specifically. The threshold of the increase in the tax burden requires further study. For example, future research can examine the degree of the environmental tax levy increase and its effect on green innovation by increasing the same or similar standards under different emission fee levy standards.
Third, we studied only the effect of changes in environmental tax burden standards on green innovation, but ignored intrinsic relationships such as its impact path and mechanism of action. Exploring these aspects should further enrich the study and increase its theoretical depth.
The original contributions presented in the study are included in the article/Supplementary Material, further inquiries can be directed to the corresponding author.
Conceptualization, CZ and CFZ; methodology, CFZ; software, WL; validation, CFZ, WL, and LL; formal analysis, CZ; investigation, CFZ and LL; resources, CZ; data curation, CFZ; writing—original draft preparation, CFZ and LL; writing—review and editing, CFZ and WL; visualization, CZ; supervision, CZ; project administration, CZ; funding acquisition, CZ. All authors have read and agreed to the published version of the manuscript.
The authors declare that the research was conducted in the absence of any commercial or financial relationships that could be construed as a potential conflict of interest.
All claims expressed in this article are solely those of the authors and do not necessarily represent those of their affiliated organizations, or those of the publisher, the editors and the reviewers. Any product that may be evaluated in this article, or claim that may be made by its manufacturer, is not guaranteed or endorsed by the publisher.
The Supplementary Material for this article can be found online at: https://www.frontiersin.org/articles/10.3389/fenvs.2022.1036810/full#supplementary-material
Albrizio, S., Kozluk, T., and Zipperer, V. (2017). Environmental policies and productivity growth: Evidence across industries and firms. J. Environ. Econ. Manag. 81 (81), 209–226. doi:10.1016/j.jeem.2016.06.002
Bertrand, M., Duflo, E., and Mullainathan, S. (2004). How much should we trust differences-in-differences estimates. Q. J. Econ. 119 (1), 249–275. doi:10.1162/003355304772839588
Bryan, B. A., Gao, L., Ye, Y., Sun, X., Connor, J. D., Crossman, N. D., et al. (2018). China's response to a national land-system sustainability emergency. Nature 559 (7713), 193–204. doi:10.1038/s41586-018-0280-2
Dong, Z., and Wang, H. (2021). An examination of the effectiveness of market-based environmental regulation policies: Empirical evidence from the perspective of carbon emissions trading policies. Stat. Res. 38 (10), 48–61. doi:10.19343/j.cnki.11-1302/c.2021.10.005
Du, L., Zhao, Y., Tao, K., and Lin, W. (2019). The compound effect of environmental regulation, governance transition on green competitiveness enhancement-Empirical evidence based on Chinese industry. Econ. Res. 54 (10), 106–120.
Fei, M., and Zhang, Z. (2020). Do environmental taxes promote corporate innovation outcomes? --An empirical study from Chinese corporate patent data. J. Harbin Univ. Commer. Soc. Sci. Ed. (06), 80–90. doi:10.3969/j.issn.1671-7112.2020.06.007
Feng, L., Ge, C., Lin, F., Lian, C., Fan, B., and Kuang, H. T. (2021). Study on the impact of environmental protection tax on corporate performance: Based on the increase of tax rate. China Environ. Manag. 13 (05), 127–134. doi:10.16868/j.cnki.1674-6252.2021.05.127
Guan, Y., Xu, J., and Yang, F. (2022). The impact of environmental regulations on urban green productivity from a spatial spillover perspective - an empirical test based on the robust productivity of the common frontier [J/OL]. Stat. Res., 1–18. [2022-09-20]. doi:10.19343/j.cnki.11-1302/c.2022.09.003
Jia, X., and Cui, J. (2020). Low carbon cities and corporate green technology innovation. China Ind. Econ. 12, 178–196. doi:10.19581/j.cnki.ciejournal.2020.12.008
Jin, Y., Gu, J., and Zeng, H. (2020). Will the change of environmental fees to taxes affect corporate performance? Account. Res. 2020 (05), 117–133. doi:10.3969/j.issn.1003-2886.2020.05.009
Kou, Z., and Liu, X. (2020). on patenting behavior of chinese firms:stylized facts and effects of innovation policy. Econ. Res. 55 (03), 83–99.
Li, Q. Y., and Xiao, Z. H. (2020). Heterogeneous environmental regulation tools and green innovation incentives:evidence from green patents of listed companies. Econ. Res. 55 (9), 192–208.
Qian, B., and Lianchao, Y. (2019). Environmental tax and enterprise technological innovation promotion or suppression? Sci. Res. Manag. 40 (12), 116–125. doi:10.19571/j.cnki.1000-2995.2019.12.012
Sun, X., Gao, L., Ren, H., Ye, Y., Li, A., Stafford-Smith, M., et al. (2018). China’s response to a national land-system sustainability emergency. Nature 559 (7713), 193–204. doi:10.1038/s41586-018-0280-2
Tang, G. P., Li, L. H., and Wu, D. J. (2013). Environmental regulation, industry attributes and corporate environmental investment. Account. Res. (06), 83–89+96. doi:10.3969/j.issn.1003-2886.2013.06.012
Tao, F., Jin, Z., and Zhou, H. (2021). Has environmental regulation achieved "incremental improvement" in green technology innovation--evidence from the environmental protection target responsibility system. China Ind. Econ. 02, 136–154. doi:10.19581/j.cnki.ciejournal.2021.02.016
Tong, T. W., He, W., He, Z-L., and Lu, J. (2014). Patent regime shift and firm innovation: Evidence from the second amendment to China's patent law [C]. NY 10510; City: Academy of Management Briarcliff Manor, 14174. doi:10.5465/ambpp.2014.14174abstract
Tu, Z., and Chen, R. (2015). Can emissions trading scheme achievee the porter effect in China Econ. Res. 50 (07), 160–173.
Wang, B., and Qi, S. (2016). Technological innovation effects of market-based and command-based policy instruments for energy conservation and emission reduction-empirical evidence based on patent data from Chinese industrial sectors. China Ind. Econ. (06), 91–108. doi:10.19581/j.cnki.ciejournal.2016.06.008
Wang, F., and Chen, F. (2018). Board governance, environmental regulation and green technology innovation--an empirical test based on listed companies in China's heavy pollution industry. Scientol. Res. 36 (02), 361–369. doi:10.16192/j.cnki.1003-2053.2018.02.019
Wang, H., and Zhang, Y. (2020). Trade structure upgrading, environmental regulation and green technology innovation in different regions of China China Soft Sci. (02), 174–181. doi:10.3969/j.issn.1002-9753.2020.02.016
Wang, J-C., Jin, Z-D., Yang, M., and Naqvi, S. (2021). Does strict environmental regulation enhance the global value chains position of China's industrial sector? Petroleum Sci. 18 (06), 1899–1909. doi:10.1016/j.petsci.2021.09.023
Wang, Z., Cao, Y., and Lin, S. (2021). Characteristics and heterogeneity of environmental regulations on firms' green technology innovation--based on green patent data of Chinese listed companies. Sci. Res. 39 (05), 909–919. doi:10.16192/j.cnki.1003-2053.20200916.001
Wen, H., and Zhong, Q. (2020). Whether environmental protection tax reform can leverage enterprises' green technological innovation: Insights from the changes of China's emission fee collection standards. J. Guizhou Univ. Finance Econ. (03), 91–100. doi:10.3969/j.issn.1003-6636.2020.03.010
Wen, H., and Zhou, F. (2019). Environmental regulation and green total factor productivity in China's provinces-and implications for the implementation of the Environmental Protection Tax Law. Arid Zone Resour. Environ. 33 (02), 9–15. doi:10.13448/j.cnki.jalre.2019.035
Wen, X. (2015). A comparative study of environmental protection tax and emission fee system. Int. Tax. 11, 49–54. doi:10.19376/j.cnki.cn10-1142/f.2015.11.012
Wu, Y. M., and Li, J. X. (2009). Local spatial econometric analysis of provincial economic growth and electricity consumption. Geoscience 29 (01), 30–35. doi:10.3969/j.issn.1000-0690
Xiong, G., Shi, D., and Li, M. (2020). The impact of low-carbon city pilot on enterprises' green technology innovation. Sci. Res. Manag. 41 (12), 93–102. doi:10.19571/j.cnki.1000-2995.2020.12.008
Yi, L., Da, G., and Ping, W. (2021). Does the central environmental inspection induce green innovation in firms? Scientol. Res. 39 (08), 1504–1516. doi:10.16192/j.cnki.1003-2053.20210202.004
Yuan, Y., and Che, C. (2019). Environmental regulation, green technology innovation and the transformation and upgrading of China's manufacturing industry. Scientol. Res. 37 (10), 1902–1911. doi:10.16192/j.cnki.1003-2053.2019.10.020
Zeng, M. (2021). The impact of carbon emissions trading on green technology innovation in manufacturing. Sichuan: Sichuan University. doi:10.27342/d.cnki.gscdu.2021.000226
Zhang, J., Geng, H., Xu, G., and Chen, J. (2019). Research on the impact of environmental regulation on green technology innovation. China Population-Resources Environ. 29 (01), 168–176. doi:10.12062/cpre.20180917
Zhao, A-W., Du, J-G., and Guan, H-J. (2016). Simulation of corporate environmental technology innovation under environmental tax scenarios. Manag. Sci. 29 (1), 40–52. doi:10.3969/j.issn.1672-0334.2016
Keywords: environmental tax, environmental tax reform, environmental pollution, green technology innovation, double difference
Citation: Zhang C, Zou CF, Luo W and Liao L (2022) Effect of environmental tax reform on corporate green technology innovation. Front. Environ. Sci. 10:1036810. doi: 10.3389/fenvs.2022.1036810
Received: 05 September 2022; Accepted: 11 October 2022;
Published: 25 October 2022.
Edited by:
Lei Gao, Commonwealth Scientific and Industrial Research Organisation (CSIRO), AustraliaReviewed by:
Iwona Bąk, West Pomeranian University of Technology, PolandCopyright © 2022 Zhang, Zou, Luo and Liao. This is an open-access article distributed under the terms of the Creative Commons Attribution License (CC BY). The use, distribution or reproduction in other forums is permitted, provided the original author(s) and the copyright owner(s) are credited and that the original publication in this journal is cited, in accordance with accepted academic practice. No use, distribution or reproduction is permitted which does not comply with these terms.
*Correspondence: Cai Feng Zou, emhhbmd5aW5nQHVjd2F2ZS5jb20uY24=
Disclaimer: All claims expressed in this article are solely those of the authors and do not necessarily represent those of their affiliated organizations, or those of the publisher, the editors and the reviewers. Any product that may be evaluated in this article or claim that may be made by its manufacturer is not guaranteed or endorsed by the publisher.
Research integrity at Frontiers
Learn more about the work of our research integrity team to safeguard the quality of each article we publish.