 Yirui Deng1*
 Guiling Cao
 Zhifei Wei
 Xiaofeng Xu
- 1School of Economics and Management, China University of Petroleum, Qingdao, China
- 2State Grid Energy Research Institute Co., Ltd, Beijing, China
Evaluating the efficiency of energy enterprises’ investment merger in the energy Internet sector can be a visual measure of the effectiveness of their investment merger in this sector. It is crucial for energy enterprises to achieve strategic transformation and expand their market share. To this end, this study aims to investigate the efficiency of energy enterprises’ investment merger in the energy Internet sector by constructing an efficiency evaluation index system and evaluation model with the characteristics of the sector. Based on which the TOPSIS model is used to distinguish the differences in the efficiency of the same enterprises’ investment merger in different years. The results of the validation on international power enterprises show that the size of the enterprise has an important influence on its investment merger efficiency in this field. In addition, the evaluation index system and method constructed prove to be effective in evaluating and differentiating the annual investment merger efficiency of energy enterprises in the energy Internet field.
1 Introduction
In recent years, energy scarcity, environmental pollution, and climate change have become increasingly serious. Among them, there is a strong link between CO2 emissions and the economic growth of companies and even entire countries, and a two-way causal relationship between energy use and CO2 emissions (Sun et al., 2020; Ren et al., 2022a). Green, ecological, and sustainable have become one of the key principles in the development of the energy sector (Wang et al., 2022). Under the background of globalization, the energy efficiency of a country is closely linked to its neighbors, and the form of development of energy companies is closely linked to global energy policies (Ren et al., 2023; Ren et al., 2022b; Ren et al., 2022c; Sun et al., 2022). The energy Internet, as a new mode of energy industry development with the deep integration of the Internet and energy production, transmission, storage, consumption, and energy market (Moness and Moustafa, 2016), is not only an important way to solve the problem of energy supply security and achieve green energy development, but also an important opportunity to help energy companies achieve strategic transformation and expand their market share. As an important part of energy enterprises, evaluating the efficiency of electricity companies’ investment merger in the energy internet sector has become an important research content. By grasping the effectiveness of enterprises’ investment merger in this field, it can better help them cope with the opportunities and challenges brought by the development of the energy Internet. It is of great significance for electricity enterprises to enhance their strength and realize industrial upgrading. From the perspective of the importance of the energy Internet for electricity enterprises, a scientific index framework is needed to promote the evaluation of the efficiency of electricity enterprises’ investment merger in the energy Internet field. At the same time, a scientific evaluation model is also needed to ensure the objectivity and accuracy of the evaluation results.
As an important business activity of electricity enterprises, it has been a popular topic to study the efficiency evaluation of investment merger. Many scholars have established different evaluation index systems for the evaluation of the efficiency of investment merger of electricity enterprises. Table 1 summarizes the relevant studies focusing on the evaluation indexes of investment merger efficiency of electricity enterprises. Different scholars construct the evaluation index system of investment merger efficiency of electricity enterprises from both input and output perspectives. The number of employees and capital investment are the evaluation indexes proposed by most scholars from the input perspective; carbon dioxide emission and earnings per share are the evaluation indexes adopted by most scholars from the output perspective. These evaluation index systems are constructed based on the overall perspective of investment merger, and do not divide into specific evaluation areas. Therefore, there is currently no unified evaluation index system for evaluating the efficiency of investment merger in the segmented energy Internet field.
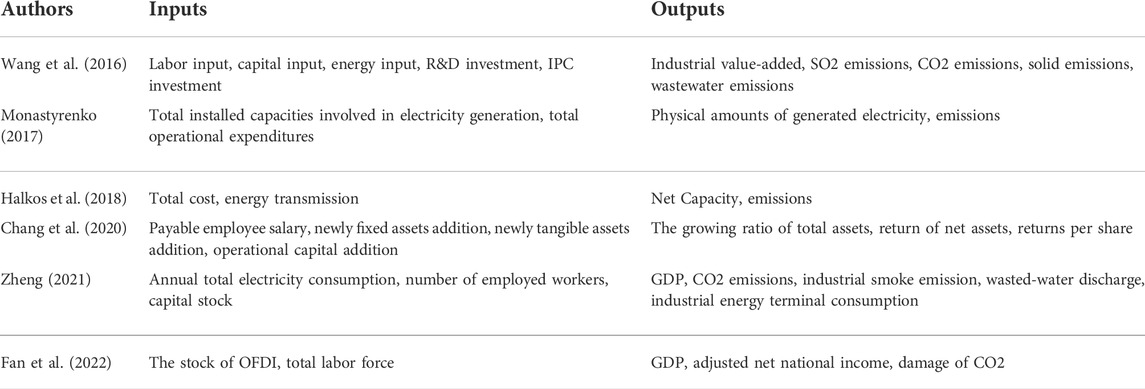
TABLE 1. A summary of evaluation indexes of investment merger efficiency of electricity companies.
A wide variety of models have been used to evaluate efficiency, including investment-cash flow sensitive (FHP) models (Francis et al., 2013), Vogt models (Aggarwal and Goodell, 2014), Richardson in-vestment expenditure models (Khanghah et al., 2015; Ben et al., 2017; Liu et al., 2022), stochastic frontier analysis (SFA) models (Sun et al., 2019; Zhang et al., 2022), and DEA models (Giacalone et al., 2020; Tavassoli et al., 2022; Wu and Lin, 2022). Studies have shown that in the energy industry, the BCC model, which is one of the models underlying the DEA model, is one of the most commonly used efficiency evaluation models. Wang et al. (2021) used Super Efficiency Data Envelopment Analysis (DEA) to evaluate regional energy efficiency in China and found that overall energy efficiency in China is low and varies widely by region, with energy efficiency generally higher in the eastern region than in the western region. Using a DEA model, Mohsin et al. (2021) studied the impact of energy reforms on energy efficiency in 48 countries in five different regions and found that energy reforms contributed to the goal of high energy efficiency and lower unit energy costs. Ouyang and Yang (2020) used the multiplicative network DEA model to analyze regional energy and environmental efficiency in 27 OECD countries. Although the BCC model is widely used in the evaluation of the efficiency of the energy industry, most of the current studies focus on evaluating its environmental efficiency and technical efficiency, and relatively few studies evaluate its investment merger efficiency, especially studies based on the perspective of the energy Internet to evaluate its investment merger efficiency are currently in a blank state.
At present, no complete investment merger efficiency evaluation index system has been formed for the energy Internet field, and there is no specific method to evaluate the efficiency of energy companies’ investment merger in this field. To fill this gap, this paper takes the investment merger efficiency of energy enterprises in the energy Internet field as the research object and constructs a corresponding investment merger efficiency evaluation index system and an integrated investment merger efficiency evaluation model. Then the index system and evaluation model are used to evaluate and analyze three international power enterprises’ investment merger efficiency in the energy Internet sector. Three enterprises are Electricity De France, National Grid, and E. ON of Germany. Finally, the effectiveness of each power company’s investment merger in the field of energy internet is summarized based on the evaluation results.
This study makes multiple contributions to the energy Internet sector’s investment merger efficiency evaluation of research. First, this paper adds indicators reflecting the characteristics of the energy Internet based on the common evaluation indexes of investment merger efficiency of power enterprises, filling the gap in the evaluation indexes of investment merger efficiency in the energy Internet sector. Second, we construct an integrated evaluation model of energy enterprises’ investment merger efficiency in the field of energy Internet, and then, we realize the differentiated ranking of enterprises’ annual investment merger efficiency in this field with the help of TOPSIS method. The combination of multiple methods can provide a new direction for further research work in this field to think about. Third, the paper analyses three international power companies’ investment merger situation from the perspective of the energy Internet, and makes a horizontal comparison of the three companies. The conclusions learned are of great significance for energy companies to expand their market share and achieve sustainable development in the context of the energy Internet.
The rest of this paper is organized as follows: in Section 2, the corresponding evaluation indexes and evaluation methods are proposed based on the research object of this paper. In Section 3, the empirical analysis is conducted for the three major international electricity enterprises. In Section 4, the empirical results are analyzed. Finally, in Section 5, the full work is summarized and future research directions are proposed.
2 Materials and methods
2.1 Construction of index system
Comprehensive domestic and foreign literature research found that no unified index system has been formed for the efficiency evaluation of electricity enterprise in-vestment merger in the context of the energy Internet. Therefore, based on the existing research, this paper constructs the corresponding investment efficiency evaluation index system by combining the characteristics of low-carbon and renewable energy-based energy Internet business, and the specific process is shown as Figure 1.
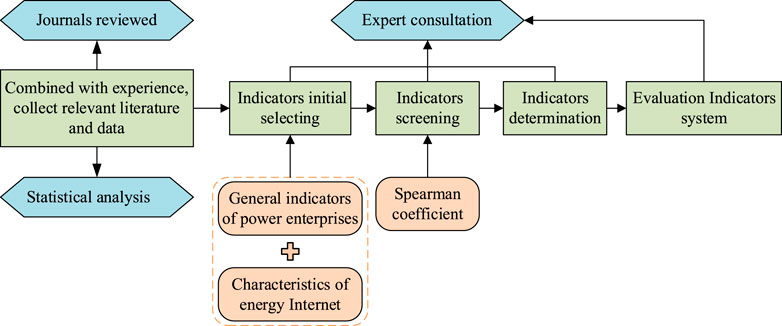
FIGURE 1. The determination process of evaluation indicators for investment and merger of energy Internet business.
Firstly, the initial selection of indicators (2.1.1) establishes the initial evaluation index system of energy Internet investment merger efficiency of electricity enterprises from both input and output perspectives. Secondly, in the part of indicators screening (2.1.2), to reduce the redundancy between indicators, using Spearman coefficient conducted index correlation analysis; finally, the final evaluation indicators system is determined according to the results of indicator screening (3.2).
2.1.1 The initial selection of indicators
The accuracy of the evaluation of enterprises’ investment efficiency in the energy Internet field mainly depends on the selected indicators of inputs and outputs. By summarizing the literature and considering the availability of data, this paper establishes the initial evaluation index system for the efficiency of electricity enterprises’ energy Internet investment merger from both input and output aspects as shown in the figure below. Since in the input-output analysis, generally the smaller the input indicator is, the larger the output indicator is, the better, so we do the reciprocal processing for the carbon emission intensity indicator. Primary evaluation index system of energy Internet investment and merger efficiency of power enterprises is shown as Table 2.
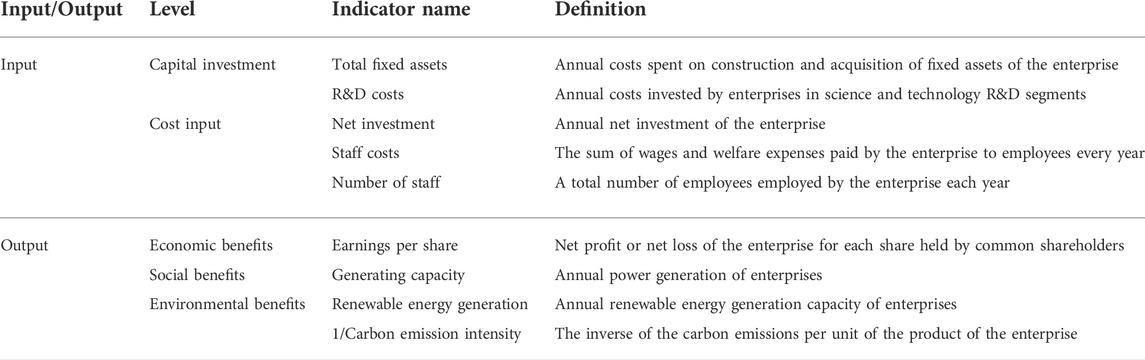
TABLE 2. Primary evaluation index system of energy Internet investment and merger efficiency of power enterprises.
2.1.2 Indicators screening
To ensure the lowest possible information redundancy among the indicators, the Spearman coefficient is chosen for correlation analysis among the indicators in this paper, and the principle is shown in Eq. 1.
2.2 Basic model introduction
Data Envelopment Analysis (DEA) is an effective mathematical method for assessing the efficiency of decision-making units (DMUs) ((Jin et al., 2022)). Suppose the number of DMUs in a system is
2.2.1 CCR model
The CCR model is based on the variable returns to scale (VRS) principle and introduces slack variables
2.2.2 BCC model
The BCC model looks at efficiency from an output perspective, i.e., comparing the achievement of output resources for the same level of inputs, and this model results in ‘pure technical efficiency’. The BCC model based on the principle of immutability of remuneration for scale is obtained by adding a constraint
The BCC model can be further subdivided into the input-oriented BCC model (Eq. 5) and output-oriented BCC model (Eq. (6)), depending on the objectives. The input-oriented BCC model studies the use of input resources by DMUs with the objective of input minimization, provided that the output is constant., at the time,
The BCC model divides the comprehensive technical efficiency (
2.3 Integration of investment merger efficiency evaluation results
Since the input-oriented BCC model and the output-oriented BCC model have different research perspectives, the corresponding obtained pure technical efficiency values are not the same generally, at this time the comprehensive technical efficiency values obtained by the CCR model are consistent, and according to
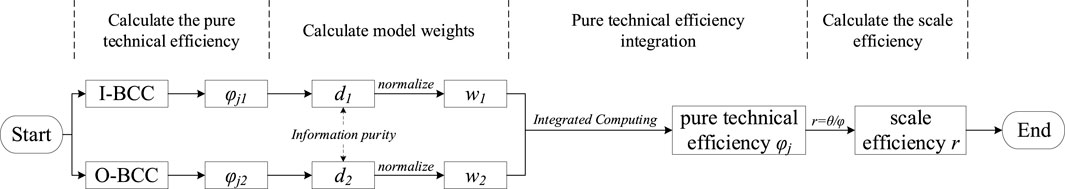
FIGURE 2. Integration of investment merger efficiency evaluation.
Step 1, Calculating the pure technical efficiency matrix. Using the input-oriented BCC model (IN-BCC) and the output-oriented BCC model (OUT-BCC), respectively
Step 2, Calculating the weights of the model
Step 3, Getting the pure technical efficiency after integration. According to the equation:
Step 4, Getting the scale efficiency. Based on the previously obtained combined technical efficiency values
2.4 Differentiated ranking of investment merger efficiency
The differential ranking of merger efficiency is done in two main steps. The first is to construct positive and negative ideal sample points. Then the TOPSIS method is used to calculate the closeness of DMUs to the positive and negative ideal sample points to complete the differential ranking. The relevant process is shown in the Figure 3.
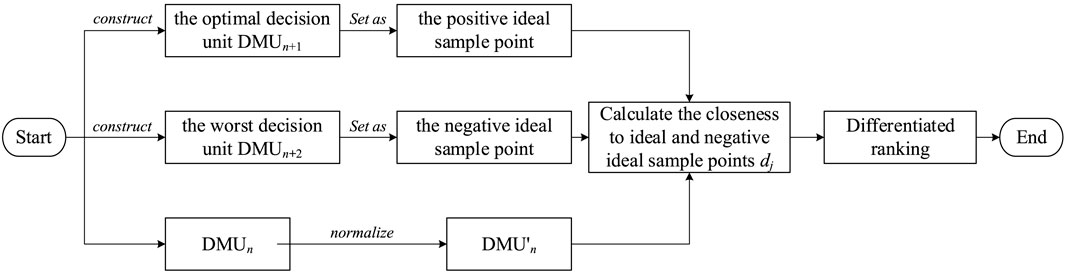
FIGURE 3. The process of differentiated ranking of investment merger efficiency.
2.4.1 Constructing positive and negative ideal sample points
Step 1, Constructing the first virtual decision unit
The input and output index values of the optimal decision unit
Step 2, Constructing the second virtual decision unit
The input and output index values of the worst decision unit
Step 3, Determine the optimal decision unit
2.4.2 Differentiated ranking of DMUs using the TOPSIS model
TOPSIS is a commonly used comprehensive evaluation method. It first determines an optimal solution and the worst solution, where the indicators of the optimal solution all reach the best value among the indicators, and the indicators of the worst solution all reach the worst value among the indicators, if the evaluation object is closest to the optimal solution and far from the worst solution, then it is optimal, otherwise it is not optimal. The steps for the differentiated ranking of DMUs by using TOPSIS method is as follows.
Step 1, Nondimensionalizing the valid decision units to be ranked. The input indicator is handled as a cost indicator, the smaller the value the better, and the dimensionless formula is shown as follows:
Step 2, Calculate the closeness of decision units to ideal sample points and negative ideal sample points, and rank the DMUs according to the calculation results. The calculation formula is shown in Eq. 15. The larger the closeness
3 Results
3.1 Data source
The study is based on annual data between 2010 and 2019 and covers three countries: France, Britain, and Germany, and three electricity companies: EDF, National Grid United Kingdom, and E.ON. In particular, data on macro indicators at the country level were obtained from the World Bank (GDP per capita of employed population, Total national reserves, Percentage of employed population, Net foreign direct investment, R&D expenditure costs, GDP), BP Statistical Review of World Energy (Generating capacity, Carbon emissions), Energy Statistics Yearbook 2020 (Percentage of renewable energy generation), and the Spearman method were used to After correlation analysis of the indicators, the corresponding micro indicators for evaluating the efficiency of electricity enterprises’ investment merger were screened according to Table 3, and the data of micro indicators at enterprise level were obtained from the annual reports of each enterprise (2010-2019).
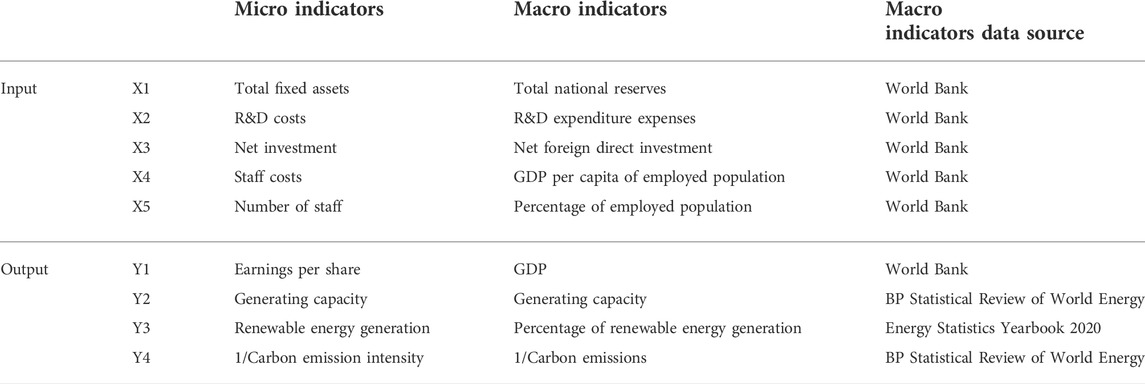
TABLE 3. Indicator mapping.
3.2 Indicator screening results
The Spearman coefficients were chosen to analyze the correlation between France, Britain, and Germany, and the results of the Spearman coefficients are shown in Table 4. In terms of the correlation between input indicators, there is a strong positive correlation between X4 and X5 in Britain and Germany (values of 1.000 and 0.927 respectively); besides, there is a strong positive correlation between X1 and X4 and between X1 and X5 in Britain (values of 0.988). In terms of the correlation between output indicators, there is a strong positive correlation between Y3 and Y4 in both Britain and Germany (values of 0.952 and 0.766, respectively).
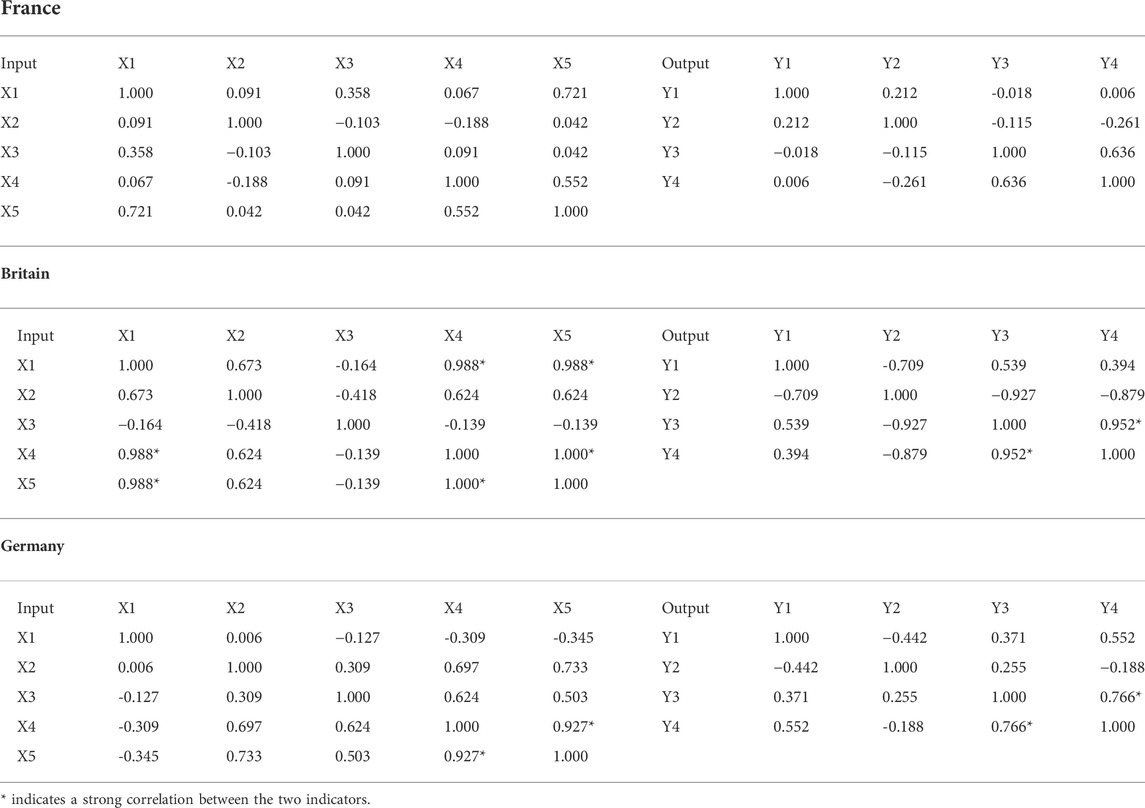
TABLE 4. Spearman correlation of macro index data.
According to the above index correlation analysis results, we choose to delete two indicators X5 and Y3, combined with the index mapping relationship set in Table 3, the finalized index system is shown in Figure 4.
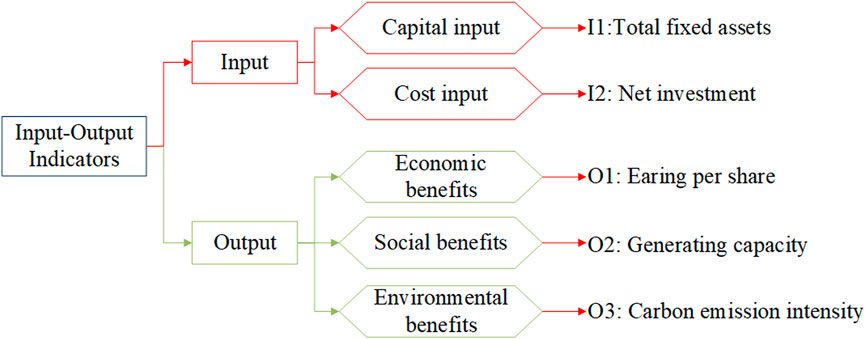
FIGURE 4. Final index system of investment and merger of energy Internet power enterprises.
3.3 Investment merger efficiency evaluation
Firstly, the input-oriented BCC and output-oriented BCC models are used to evaluate and analyze the investment merger efficiency of EDF, National Grid of United Kingdom, and E. ON in the energy Internet field respectively, and for each company, the pure technical efficiency calculated by the two models are integrated according to the pure technical efficiency evaluation results integration method proposed in 2.3 to obtain the final pure technical efficiency, and according to the scale the relationship between efficiency, pure technical efficiency, and integrated technical efficiency to obtain the scale technical efficiency of each DMU. The evaluation results of investment merger efficiency are presented in the form of images and tables. In addition, based on the integrated technical efficiency values calculated by the CCR model embedded in the BCC model, using the method introduced in 2.4, a differential ranking is performed for the decision units that cannot be distinguished by the BCC model to obtain the differential ranking of each company’s investment merger efficiency in the energy Internet sector under different years (Final sort).
3.3.1 EDF
(1) Integration of investment merger efficiency evaluation results
Table 5 shows the integration process of the results of the evaluation of the investment merger efficiency of EDF’s investments in the energy Internet sector. The CCR model embedded in the BCC model can be used to find the integrated technical efficiency (Crste) of EDF’s investment merger in the energy Internet sector for all years from 2010 to 2019, and only the integrated technical efficiency from 2014 to 2016 is below 1. The pure technical efficiency (Vrste) values obtained using the input-oriented BCC (IN-BCC) and output-oriented BCC (OUT-BCC) models respectively, are shown in the third and fourth columns of the table, and only the pure technical efficiency for 2015 and 2016 is less than 1. By using the two types of models to calculate the pure technical efficiency weights (0.5042 and 0.4958, respectively) and then integrating them to obtain the final pure technical efficiency values as shown in the fifth column of the table, the combined pure technical efficiency values are closer to the pure technical efficiency values calculated by the out-put-oriented BCC model. The combined technical efficiency is divided by the pure technical efficiency to get the scale efficiency (the last column of the table). The scale efficiency value in 2014 is 0.970, and the pure technical efficiency value of integration is 1.000 at this time, which indicates that the technology-related elements are reasonably used at this time, while the return from investment merger can be increased by expanding the scale. the scale efficiency in 2015 and 2016 is greater than one, which indicates that the scale is too large at this time, and the return from investment merger can be increased by reducing the scale.
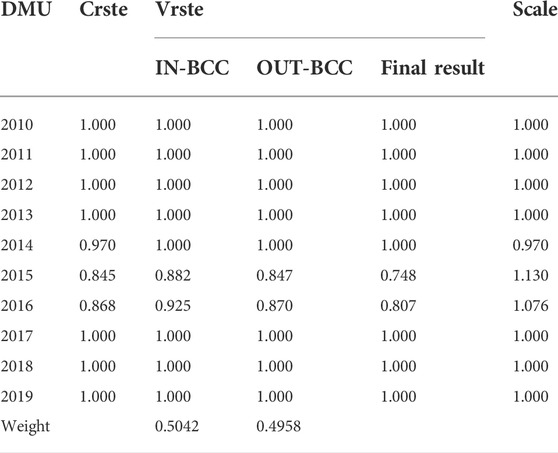
TABLE 5. Integration of investment and merger efficiency evaluation results-EDF.
(2) Differentiated Ranking
The mean value of EDF’s integrated technical efficiency from 2010 to 2019 is 0.968, the mean value of pure technical efficiency is 0.955, and the mean value of scale efficiency is 1.018, which indicates that EDF’s overall investment merger efficiency in the energy Internet field is high and is better evaluated in terms of factor use, but the overall scale is slightly large, and an appropriate reduction in the scale of investment merger can better the overall investment merger efficiency of the company in the field of energy Internet. The results of the evaluation of the efficiency of investment merger in all years are shown in Figure 5, in which both comprehensive technical efficiency and scale efficiency began to decline after 2014, comprehensive technical efficiency has been restored to be effective since 2017, and scale efficiency values appeared greater than one in 2015 and 2016, indicating that the scale of investment merger in the energy Internet field is slightly larger at this time, which in turn affects the efficiency of investment merger, while pure technical efficiency is only non-effective in 2015 and 2016 for 2 years. According to the relationship between integrated technical efficiency, pure technical efficiency, and scale efficiency: integrated technical efficiency inefficiency is mainly caused by scale efficiency inefficiency. Comparing the rankings given by BCC and BCC-TOPSIS, the method proposed in this paper can effectively distinguish DMUs that cannot be distinguished by BCC, in which the 2-year investment merger efficiency ranking with a scale efficiency value greater than one is the lowest, and the ranking in the following years is relatively high, which is inseparable from the strong investment and support of French power companies for the energy Internet in recent years.
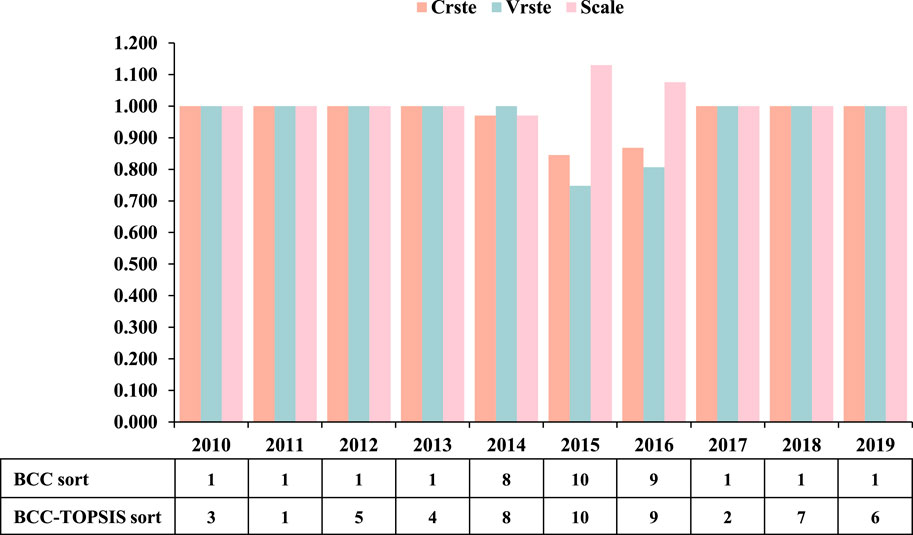
FIGURE 5. Evaluation results of the efficiency of EDF’s investment and merger in the field of energy Internet.
3.3.2 National Grid
(1) Integration of investment merger efficiency evaluation results
Table 6 shows the integration process of the results of the evaluation of the investment merger efficiency of National Grid’s investments in the energy Internet sector. The CCR model embedded in the BCC model can be used to find the integrated technical efficiency (Crste) of National Grid’s investment merger in the energy Internet sector for all years from 2010 to 2019, and only the comprehensive technical efficiency from 2014 to 2017 is 1, and the comprehensive technical efficiency in other years is less than 1. The pure technical efficiency (Vrste) values obtained using the input-oriented BCC (IN-BCC) and output-oriented BCC (OUT-BCC) models respectively, are shown in the third and fourth columns of the table, and only the pure technical efficiency for 2013 is less than 1. By using the two types of models to calculate the pure technical efficiency weights (0.5004 and 0.4996, respectively) and then integrating them to obtain the final pure technical efficiency values as shown in the fifth column of the table, the combined pure technical efficiency values are closer to the pure technical efficiency values calculated by the output-oriented BCC model. The combined technical efficiency is divided by the pure technical efficiency to get the scale efficiency (the last column of the table). Only the scale efficiency value from 2014 to 2017 was found to be 1. The scale efficiency value in 2013 was 1.015, and the pure technical efficiency value of integration at this time was 1.000, indicating that the technology-related elements were reasonably used at this time, while the scale of investment merger in the energy Internet field was too large, and the return on investment merger could be increased by reducing the scale.

TABLE 6. Integration of investment and merger efficiency evaluation results-National Grid.
(2) Differentiated Ranking
National Grid has a mean value of 0.945 for integrated technical efficiency, 0.996 for pure technical efficiency, and 0.949 for scale efficiency from 2010 to 2019, which, in general, shows that National Grid United Kingdom has high investment merger efficiency in the energy internet sector, but has large fluctuations in investment merger efficiency from year to year. The results of the evaluation of the efficiency of investment merger in all years are shown in Figure 6. Among them, the comprehensive technical efficiency and scale efficiency only had a value of one from 2014 to 2017, with fluctuations in the rest of the years, and the pure technical efficiency was only slightly less than one in 2013, while the scale efficiency was greater than one in the same year, indicating that improving the degree of factor input and the level of technology while appropriately reducing the scale of investment merger can effectively improve the company’s investment merger efficiency in the energy Internet field in that year. According to the relationship between integrated technical efficiency, pure technical efficiency, and scale efficiency: integrated technical efficiency inefficiency is mainly caused by scale efficiency inefficiency, and the efficiency of National Grid UK’s investment merger in the energy internet sector is mainly related to scale efficiency. Comparing the rankings given by BCC and BCC-TOPSIS, it can see that the method proposed in this paper can effectively distinguish DMUs that BCC cannot distinguish, among which National Grid has the best investment merger in 2016. From the data published by Fortune on the world’s top 500 companies, the company ranked 471 in 2016, improving 15 places compared to 2015 and doubling its corporate profit, which is mainly due to the divestment and sale of 51% of the company’s gas business and adjusting the business layout on this basis to achieve energy investment by investing in better technologies to save costs for customers innovatively and efficiently transformation, the effect of investment shows a good state.
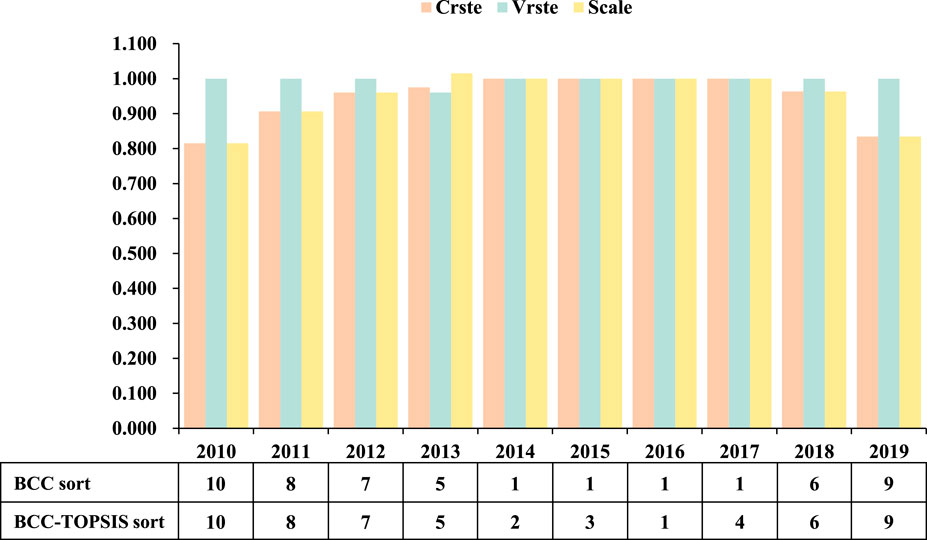
FIGURE 6. Evaluation results of the efficiency of National Grid’s investment and merger in the field of energy Internet.
3.3.3 E.ON
(1) Integration of investment merger efficiency evaluation results
Table 7 shows the integration process of the results of the evaluation of the investment merger efficiency of E. ON’s investments in the energy Internet sector. The CCR model embedded in the BCC model can be used to find the integrated technical efficiency (Crste) of E. ON’s investment merger in the energy Internet sector for all years from 2010 to 2019, and it can be seen that only the integrated technical efficiency from 2011 to 2015 is below 1. The pure technical efficiency (Vrste) values obtained using the input-oriented BCC (IN-BCC) and output-oriented BCC (OUT-BCC) models respectively, are shown in the third and fourth columns of the table. It is found that the pure technical efficiency of the results calculated by the input-oriented BCC model is less than one from 2011 to 2014, and the pure technical efficiency of the output-oriented BCC model is less than one from 2011 to 2015. By using the two types of models to calculate the pure technical efficiency weights (0.5031 and 0.4969, respectively) and then integrating them to obtain the final pure technical efficiency values as shown in the fifth column of the table, it can be seen that the combined pure technical efficiency values are closer to the pure technical efficiency values calculated by the output-oriented BCC model. The combined technical efficiency is divided by the pure technical efficiency to get the scale efficiency (the last column of the table). Only the scale efficiency values from 2014 to 2013 were found to be greater than 1. The scale of investment in M&A in the energy internet sector is too large at this time, and the return on investment merger can be increased by reducing the scale of investment merger.
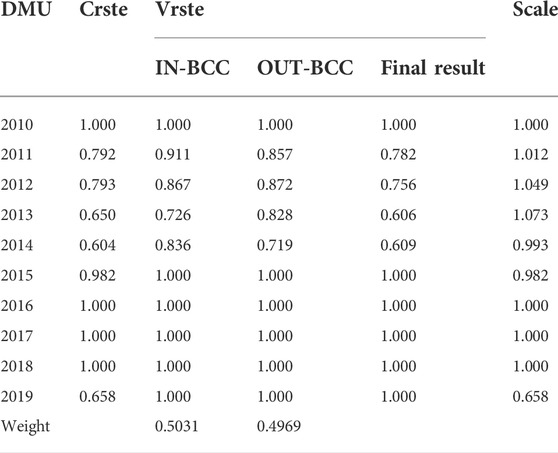
TABLE 7. Integration of investment and merger efficiency evaluation results-E.ON.
(2) Differentiated Ranking
The mean value of the integrated technical efficiency of E. ON from 2010 to 2019 is 0.848, the mean value of the pure technical efficiency is 0.875, and the mean value of the scale efficiency is 0.977, which indicates that E. ON overall investment merger in the energy Internet sector is more efficient and better evaluated in terms of resource use and resource allocation. As can be seen in Figure 7, comprehensive technical efficiency, pure technical efficiency, and scale efficiency all started to decline after 2011, and then showed fluctuating trends; comprehensive technical efficiency and scale efficiency returned to effect until 2016 but showed a decline again in 2019; while pure technical efficiency has remained effective after returning to effective in 2015, with only 4 years of non-effective. From this, it can be seen that the combined technical efficiency in-efficiency is mainly caused by scale efficiency inefficiency. Comparing the rankings given by BCC and BCC-TOPSIS, it can be seen that the method proposed in this paper can effectively distinguish the DMUs that BCC cannot distinguish, and the efficiency of E. ON’s investment merger in energy Internet in recent years in investment merger are relatively high, among which E. ON has the best investment merger effect in 2018. This is mainly due to the upgrade of the German power grid, and E. ON’s investment merger in the energy network in 2018 is significantly higher than in previous years.
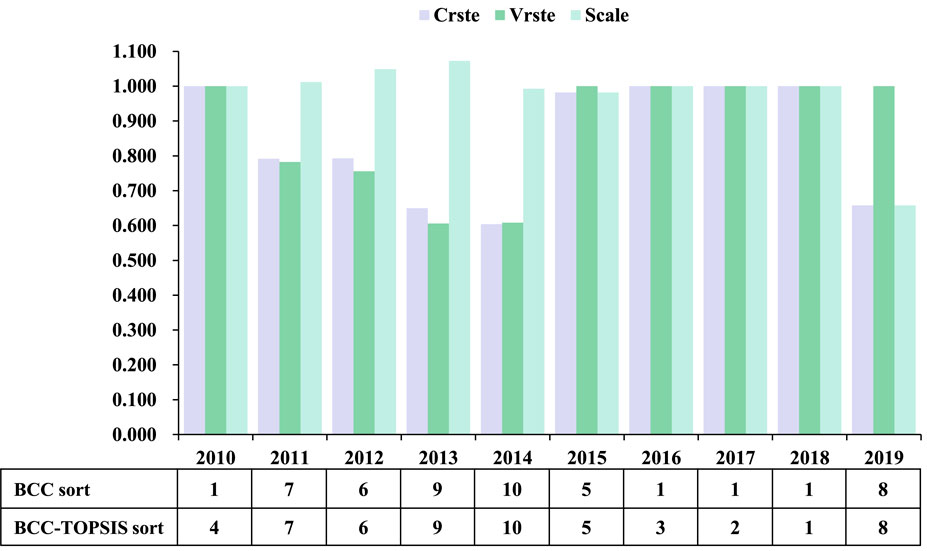
FIGURE 7. Evaluation results of the efficiency of E. ON’s investment and merger in the field of energy Internet.
4 Discussion
The paper follows the process of defining the evaluation index system, constructing the evaluation model, and conducting the case study. The role of the case study is to verify the validity and scientific nature of the evaluation indicators and the evaluation model constructed in the article.
Firstly, in the construction stage of the evaluation index system. This paper incorporates the relevant factors of the energy Internet while considering the common evaluation index system of electric power enterprises. It is more suitable for the energy Internet sector than other common evaluation index systems of electric power enterprises’ efficiency and complements the gaps in the related field. At the same time, the Spearman correlation coefficient is used to analyze the initial evaluation indexes, which effectively reduces the redundancy of information between evaluation indexes. It allows for a more reasonable and objective evaluation of electric power enterprises’ investment merger efficiency in the energy Internet sector.
Secondly, at the stage of constructing an evaluation model. Most investment merger efficiency evaluation problems can be analyzed both from the perspective of input minimization and output maximization. If only one perspective is used, the results are often not objective enough. Based on the input-oriented and output-oriented BCC model, this paper integrates the pure technical efficiency calculated by both. The perspective of input and output are both considered by integrating. In this way, the evaluation results obtained are more comprehensive and objective than those obtained by one method. At the same time, the method follows the scientific principle of scale efficiency equals comprehensive technical efficiency divided by pure technical efficiency, which ensures the correctness and scientific nature of the method. In addition, this paper uses the TOPSIS model to further improve the integrated evaluation results, effectively distinguishing between decision units with an overall technical efficiency value of 1, and more intuitively demonstrating the effect of companies’ investment merger in the energy internet sector in different years.
Finally, in the case study phase. This paper evaluates the annual efficiency of investment merger conducted by EDF, National Grid of the United Kingdom, and E. ON in the energy Internet sector using the constructed investment merger efficiency evaluation indicators system and model respectively. The investment merger efficiency of the three companies is mainly influenced by the size of the company. At the same time, the management capability of the company and the level of energy internet technology are important factors affecting the effectiveness of their merger in the energy internet sector. The size of the company and the company’s management capability have a negative impact on the efficiency of the investment merger. Conversely, the level of energy Internet technology mastered by the company has a positive impact on the efficiency of the investment merger. Therefore, the three companies should strengthen their energy Internet investment in weak links. By comparing the rankings obtained by each company using BCC and BCC_TOPSIS respectively, we can find that the differentiated ranking method proposed in this paper can effectively distinguish the annual investment merger effects where the rankings obtained by the BCC model are all one. The case study verifies the effectiveness of the index system and evaluation model constructed by this paper while evaluating the efficiency of companies’ investment merger in the energy internet sector.
5 Conclusion
With the purpose of helping energy companies grasp the effects of their investments merger in the energy Internet sector, achieve strategic transformation, and expand their market share. It also aims to address the current lack of evaluation index system and corresponding evaluation models in the field of energy Internet research regarding the efficiency of corporate investment merger. This paper takes the evaluation of the efficiency of energy companies’ investment merger in the field of energy Internet as the research object and conducts a study on the construction of the evaluation index system and evaluation models. Firstly, based on the existing research literature, this paper constructs an evaluation index system for investment merger efficiency in the energy Internet field by considering energy Internet-related elements. In addition, this paper integrates the evaluation results of two models, input-oriented BCC, and output-oriented BCC, from a comprehensive perspective, and differentiates the evaluation results of the traditional BCC model by combining the TOPSIS model. Further, we apply the indicators and model constructed in this paper to evaluating the efficiency of three international power companies’ investment merger in the energy internet sector, analyze each company’s investment merger situation and influencing factors, as well as verify the effectiveness of the proposed methodology. The way this paper constructs evaluation indicators provides a new way of constructing other research field’s evaluation indicator system. In addition, this study complements the evaluation method of investment merger efficiency of energy enterprises in the energy Internet field represented by electricity enterprises and fills in the evaluation of investment merger efficiency in this field with the missing problem of the method.
Given that the theoretical research related to the energy Internet is still in the development stage, with the enrichment of the theoretical system other factors that can characterize the energy Internet but are not incorporated in the evaluation system this paper constructed may appear. Secondly, this paper only studies the evaluation of the investment merger efficiency of energy companies in the whole energy Internet field and does not subdivide the aspects involved in the energy Internet. Finally, this paper has studied the evaluation of investment merger efficiency of energy enterprises in the field of energy Internet on behalf of electricity enterprises. How to better map the results of this paper to the whole energy enterprises and construct the evaluation model of investment merger efficiency of energy enterprises in the field of energy Internet from a more macro and universal perspective is a problem that needs further research. In future work, the limitations of the efficiency evaluation model proposed in this paper can be further improved by solving these problems.
Data availability statement
The raw data supporting the conclusion of this article will be made available by the authors, without undue reservation.
Author contributions
YD: Conceptualization, Methodology, Formal Analysis, and Writing-Review and Editing. GC: Methodology, Formal Analysis, and Writing—Original Draft. ZW: Methodology and Writing—Original Draft. XX: Conceptualization, Writing—Review and Editing, and Resources and LM: Conceptualization, Resources, and Funding Acquisition. GG: Conceptualization, Resources, and Funding Acquisition.
Funding
This research was funded by the Youth Fund of Humanities and Social Sciences, Ministry of Education (NO. 20YJC630015); Social Science Planning and Research project of Shandong Province (NO. 19CGLJ31). This research was also funded by the State Grid Corporation of China’s Technology Project (No. SGHEXT00FZJS2100016), named ‘Research on the theoretical logic, impact evaluation techniques and company response strategies for competitive neutrality.
Conflict of interest
Authors LM and GG were employed by the State Grid Energy Research Institute Co., Ltd.
The remaining authors declare that the research was conducted in the absence of any commercial or financial relationships that could be construed as a potential conflict of interest.
Publisher’s note
All claims expressed in this article are solely those of the authors and do not necessarily represent those of their affiliated organizations, or those of the publisher, the editors and the reviewers. Any product that may be evaluated in this article, or claim that may be made by its manufacturer, is not guaranteed or endorsed by the publisher.
Supplementary material
The Supplementary Material for this article can be found online at: https://www.frontiersin.org/articles/10.3389/fenvs.2022.1036772/full#supplementary-material
References
Aggarwal, R., and Goodell, J. W. (2014). Cross-national differences in access to finance: Influence of culture and institutional environments. Res. Int. Bus. Finance 31, 193–211. doi:10.1016/j.ribaf.2013.09.004
Chang, K., Wan, Q., Lou, Q., Chen, Y., and Wang, W. (2020). Green fiscal policy and firms’ investment efficiency: New insights into firm-level panel data from the renewable energy industry in China. Renew. Energy 151, 589–597. doi:10.1016/j.renene.2019.11.064
Fan, Q., Liu, J., Zhang, T., and Liu, H. (2022). An Evaluation of the Efficiency of China’s green investment in the “Belt and Road” countries. Struct. Change Econ. Dyn. 60, 495–511. doi:10.1016/j.strueco.2022.01.003
Francis, B., Hasan, I., Song, L., and Waisman, M. (2013). Corporate governance and investment-cash flow sensitivity: Evidence from emerging markets. Emerg. Mark. Rev. 15, 57–71. doi:10.1016/j.ememar.2012.08.002
Giacalone, M., Nissi, E., and Cusatelli, C. (2020). Dynamic efficiency evaluation of Italian judicial system using DEA based Malmquist productivity indexes. Socio-Economic Plan. Sci. 72, 100952. doi:10.1016/j.seps.2020.100952
Halkos, G. E., and Polemis, M. L. (2018). The impact of economic growth on environmental efficiency of the electricity sector: A hybrid window DEA methodology for the USA. J. Environ. Manag. 211, 334–346. doi:10.1016/j.jenvman.2018.01.067
Jin, F., Cai, Y., Pedrycz, W., and Liu, J. (2022). Efficiency evaluation with regret-rejoice cross-efficiency DEA models under the distributed linguistic environment. Comput. Industrial Eng. 169, 108281. doi:10.1016/j.cie.2022.108281
Khanghah, J. B., Heyrani, F., and Rafeyee, Z. (2015). The relationship between free cash flow and over investment with cash dividend. Asia. Jour. Rese. Bank. Fina. 5, 40. doi:10.5958/2249-7323.2015.00004.8
Liu, L., Zhao, Z., Zhang, M., and Zhou, D. (2022). Green investment efficiency in the Chinese energy sector: Overinvestment or underinvestment? Energy Policy 160, 112694. doi:10.1016/j.enpol.2021.112694
Mohsin, M., Hanif, I., Taghizadeh-Hesary, F., Abbas, Q., and Iqbal, W. (2021). Nexus between energy efficiency and electricity reforms: A DEA-based way forward for clean power development. Energy Policy 149, 112052. doi:10.1016/j.enpol.2020.112052
Monastyrenko, E. (2017). Eco-efficiency outcomes of mergers and acquisitions in the European electricity industry. Energy Policy, 107 258–277. doi:10.1016/j.enpol.2017.04.030
Moness, M., and Moustafa, A. M. (2016). A survey of cyber-physical advances and challenges of wind energy conversion systems: Prospects for internet of energy. IEEE Internet Things J. 3, 134–145. doi:10.1109/jiot.2015.2478381
Ouyang, W., and Yang, J. (2020). The network energy and environment efficiency analysis of 27 OECD countries: A multiplicative network DEA model. Energy 197, 117161. doi:10.1016/j.energy.2020.117161
Ren, X., Li, Y., Qi, Y., and Duan, K. (2022a). Asymmetric effects of decomposed oil-price shocks on the EU carbon market dynamics. Energy 254, 124172. doi:10.1016/j.energy.2022.124172
Ren, X., Li, Y., yan, C., Wen, F., and Lu, Z. (2022b). The interrelationship between the carbon market and the green bonds market: Evidence from wavelet quantile-on-quantile method. Technol. Forecast. Soc. Change 179, 121611. doi:10.1016/j.techfore.2022.121611
Ren, X., liu, Z., Jin, C., and Lin, R. (2023). Oil price uncertainty and enterprise total factor productivity: Evidence from China. Int. Rev. Econ. Finance 83, 201–218. doi:10.1016/j.iref.2022.08.024
Ren, X., Zhang, X., Yan, C., and Gozgor, G. (2022c). Climate policy uncertainty and firm-level total factor productivity: Evidence from China. Energy Econ. 113, 106209. doi:10.1016/j.eneco.2022.106209
Sun, H., Edziah, B. K., Sun, C., and Kporsu, A. K. (2022). Institutional quality and its spatial spillover effects on energy efficiency. Socio-Economic Plan. Sci. 83, 101023. doi:10.1016/j.seps.2021.101023
Sun, H., Samuel, C. A., Kofi Amissah, J. C., Taghizadeh-Hesary, F., and Mensah, I. A. (2020). Non-linear nexus between CO2 emissions and economic growth: A comparison of OECD and B&R countries. Energy 212, 118637. doi:10.1016/j.energy.2020.118637
Sun, J., Du, T., Sun, W., Na, H., He, J., Qiu, Z., et al. (2019). An evaluation of greenhouse gas emission efficiency in China’s industry based on SFA. Sci. Total Environ. 690, 1190–1202. doi:10.1016/j.scitotenv.2019.07.093
Tavassoli, M., Ketabi, S., and Ghandehari, M. (2022). A novel fuzzy network DEA model to evaluate efficiency of Iran’s electricity distribution network with sustainability considerations. Sustain. Energy Technol. Assessments 52, 102269. doi:10.1016/j.seta.2022.102269
Wang, J., Zhao, T., and Zhang, X. (2016). Environmental assessment and investment strategies of provincial industrial sector in China — analysis based on DEA model. Environ. Impact Assess. Rev. 60, 156–168. doi:10.1016/j.eiar.2016.05.002
Wang, R., Wang, Q., and Yao, S. (2021). Evaluation and difference analysis of regional energy efficiency in China under the carbon neutrality targets: Insights from DEA and Theil models. J. Environ. Manag. 293, 112958. doi:10.1016/j.jenvman.2021.112958
Wang, X., Li, J., and Ren, X. (2022). Asymmetric causality of economic policy uncertainty and oil volatility index on time-varying nexus of the clean energy, carbon and green bond. Int. Rev. Financial Analysis 83, 102306. doi:10.1016/j.irfa.2022.102306
Wu, Y.-C., and Lin, S.-W. (2022). Efficiency evaluation of Asia’s cultural tourism using a dynamic DEA approach. Socio-Economic Plan. Sci. 6, 101426. doi:10.1016/j.seps.2022.101426
Zhang, J., Luo, Y., and Ding, X. (2022). Can green credit policy improve the overseas investment efficiency of enterprises in China? J. Clean. Prod. 340, 130785. doi:10.1016/j.jclepro.2022.130785
Keywords: energy internet, investment merger, efficiency evaluation, energy companies, electricity companies
Citation: Deng Y, Cao G, Wei Z, Xu X, Ma L and Gao G (2022) Investment merger efficiency evaluation of energy enterprises: From a perspective of energy internet. Front. Environ. Sci. 10:1036772. doi: 10.3389/fenvs.2022.1036772
Received: 05 September 2022; Accepted: 20 September 2022;
Published: 05 October 2022.
Edited by:
Kittisak Jermsittiparsert, University of City Island, CyprusReviewed by:
Huaping Sun, Jiangsu University, ChinaSurapati Pramanik, Nandalal Ghosh B. T. College, India
Joanna Rosak-Szyrocka, Częstochowa University of Technology, Poland
Xiaohang Ren, Central South University, China
Phimsupha Kokchang, Chulalongkorn University, Thailand
Suheyla Yerel Kandemir, Bilecik Şeyh Edebali University, Turkey
Copyright © 2022 Deng, Cao, Wei, Xu, Ma and Gao. This is an open-access article distributed under the terms of the Creative Commons Attribution License (CC BY). The use, distribution or reproduction in other forums is permitted, provided the original author(s) and the copyright owner(s) are credited and that the original publication in this journal is cited, in accordance with accepted academic practice. No use, distribution or reproduction is permitted which does not comply with these terms.
*Correspondence: Yirui Deng, ZGVuZ3lpcnVpQHVwYy5lZHUuY24=; Xiaofeng Xu, eHV4aWFvZmVuZ0B1cGMuZWR1LmNu