 Qingran Guo
 Cuicui Ding2*
95% of researchers rate our articles as excellent or good
Learn more about the work of our research integrity team to safeguard the quality of each article we publish.
Find out more
ORIGINAL RESEARCH article
Front. Environ. Sci. , 20 October 2022
Sec. Environmental Economics and Management
Volume 10 - 2022 | https://doi.org/10.3389/fenvs.2022.1036740
Reducing energy intensity is an important measure to achieve the goal of “double carbon” and build a beautiful Xinjiang. Selecting the panel data of 14 regions in Xinjiang from 2010 to 2020, this paper investigates the influence of digital economy and industrial structure distortion on Xinjiang’s energy intensity by using dynamic panel data model, spatial Durbin model, intermediary effect model, and panel smooth transition model. The results show that the digital economy can reduce the energy intensity, but it has regional heterogeneity. The industrial structure distortion has significantly increased Xinjiang’s energy intensity; Digital economy effectively alleviates the industrial structure distortion, thus curbing energy intensity; The influence of digital economy on Xinjiang’s energy intensity has intermediary effect and adjustment effect, and with the improvement of industrial structure distortion, the inhibitory effect of digital economy on Xinjiang’s energy intensity tends to decline. Therefore, it is necessary to speed up the development of digital economy, reduce the industrial structure distortion, strengthen environmental regulation, promote technological innovation, rationally adjust energy prices, raise the entry threshold of FDI, expand opening to the outside world, promote the synchronous scientific development of “four modernizations”, and eliminate the root causes of industrial structure distortion, so as to reduce energy intensity.
The haze of the COVID-19 epidemic has not faded, and local military conflicts have emerged one after another in 2022. The whole world has fallen into an energy crisis, and the energy price continues to rise, and the energy crisis becomes increasingly fierce. However, the new generation of information technology, represented by big data, Internet, blockchain, cloud computing, etc., has a growing impact on human production and lifestyle, and is “subverting” the traditional production operation mode (Shi and Sun, 2022). The extensive production mode with high energy consumption and low output has been gradually abandoned, and new technologies and modes with low energy consumption and high output have gradually become the mainstream. Digital economy has a huge impact on energy consumption and energy intensity. During the 34th collective study of the Political Bureau of the CPC Central Committee, Xi Jinping stressed that “we must stand at the height of coordinating the overall strategy of the great rejuvenation of the Chinese nation and the great changes in the world unseen in a century, and coordinating the domestic and international overall situation and the development and security. It is necessary to give full play to the advantages of massive data and rich application scenarios, promote the deep integration of digital technology and the real economy, enable the transformation and upgrading of traditional industries, give birth to new industries, new formats and new models, and continuously strengthen and optimize my country’s digital economy.” The Xinjiang government attaches great importance to the development of digital economy, and has successively compiled the “14th 5-Year” Development Plan of Digital Xinjiang in Xinjiang Uygur Autonomous Region and Development Plan of Digital Economy in Xinjiang Uygur Autonomous Region during the “14th 5-Year” Plan, which have effectively promoted the development of digital economy in Xinjiang. As the most active part of economic development, it shows great development potential. According to Xinjiang Digital Economy Development Research Report (2021), from 2016 to 2021, the scale of digital economy in Xinjiang increased from 2,048.68 billion yuan to 4,255.70 billion yuan, with an average annual growth rate of 17.95%; The proportion of digital economy in GDP in Xinjiang has increased year by year, from 21.30% in 2016 to 27.36% in 2021, an increase of 6.06 percentage points (Chen, 2022). The position of digital economy in Xinjiang’s economic development is more and more stable, and its supporting role is more and more obvious. Digital economy has become a new engine of high-quality economic development in Xinjiang. On 20 November 2020, Xi Jinping clearly pointed out at the 27th APEC Economic Leaders’ Meeting that the digital economy is the future development direction of the world, and innovation is the wings of the Asia-Pacific economy. It is foreseeable that China’s digital economy will enter a period of faster and stronger development in the future. Then, will the development of digital economy affect the energy intensity, thus affecting the realization of the “double carbon” goal?. Does the digital economy act on energy intensity directly or through intermediary transmission?. These are all questions that need to be answered urgently. Therefore, it is of great theoretical significance and practical value to study the influence of digital economy and Xinjiang’s energy intensity from the perspective of theory and reality, and to give practical countermeasures and suggestions for accelerating the development of Xinjiang’s digital economy and reducing the energy intensity.
The structure of the rest of the article is arranged as follows: The second section is literature review. The third section is theoretical analysis and research hypothesis. Digital economy has both direct and indirect effects on energy intensity, and digital economy affects energy intensity by distorting industrial structure. Based on this, this paper gives four hypotheses. The fourth section is research design, introducing sample selection and data source, selection and description of variables, descriptive statistics, and benchmark regression model design; The fifth section is empirical analysis, including global regression analysis, spatial spillover effect analysis, robustness test and regional heterogeneity analysis. The empirical results show that as long as there are differences in labor productivity among industries, it will inevitably lead to distortion of industrial structure, and then affect energy intensity. However, digital economy can effectively alleviate the distortion of industrial structure and curb energy intensity. The sixth section is research on influence mechanism, which expounds intermediary effect model design and estimation result of adjustment effect and verifies that the influence of digital economy on energy intensity may be conducted through the distortion of industrial structure. The last section is the research conclusion and suggestions.
Currently, academic circles and decision-making departments are paying more and more attention to the impact of the application of digital economy on energy intensity. From the existing research, there are different views. Some studies believe that the wide application of digital economy will inevitably increase energy consumption. Heddeghem et al. (2014) point out that the energy consumption in 2012 including the global communication network, personal computer and data center accounted for as much as 4.6%, compared with only 3.9% in 2009. Wang and Zhu (2021) think that with the arrival of the “data tsunami”, the direct energy consumption generated by ICT infrastructure will continue to increase. It is estimated that the total amount of new electric energy consumption caused by China’s new digital infrastructure will reach 187 GW in 2025, and the power consumption of digital infrastructure will account for 17.8% of the national power consumption (Chen, 2020). Other studies believe that although it is obvious that ICT infrastructure has improved energy consumption, it can’t be judged that digital economy will definitely increase energy consumption in the future. Many studies have proved that ICT has great potential to improve energy efficiency, and ICT can improve energy efficiency in production and consumption economy (Romm et al., 2000; Laitner and Ehrhardt, 2008). From the statistical data, the development of digital economy does not necessarily increase energy consumption (Kashif et al., 2022). In developed economies, there is a non-linear negative correlation between mobile traffic and per capita energy consumption; Although there is a positive correlation in emerging economies, per capita energy consumption has not increased significantly due to the rapid development of digital economy; In relatively backward economies, the relationship between mobile traffic and per capita energy consumption is semi-inverted U-shaped. The statistical results of China’s monthly data also show that the increase of mobile traffic does not bring the synchronous increase of power consumption (Wang and Zhu, 2021). Therefore, the digital economy does not necessarily increase energy consumption.
At present, the developed countries have completely entered the post-industrialization stage, and the energy intensity is at a low level. The research on the influence of industrial structure on energy intensity is no longer the focus of their attention. However, for most developing countries, the energy intensity is at a high level, the industrial structure needs to be further optimized, and the dividend space of structural change is huge. The influence of industrial structure on energy intensity is still the focus of attention of developing countries now. 1) The change of industrial structure reduces the energy intensity. Lewis (1954) pointed out that too high energy intensity means that the proportion of secondary industry is too large. To effectively reduce energy intensity, it is necessary to speed up the transfer of secondary industry to tertiary industry. Denison (1967) and Maddison (1987) think that when the production factors shift from low productivity to high productivity industries, the total factor productivity will inevitably increase, which will lead to the adjustment of energy factors among industries, that is, the structural change will lead to the decrease of energy intensity, which is also called the “structural dividend hypothesis”. In order to verify this theory, some scholars have studied “structural dividend hypothesis” and reaches a unanimous conclusion that the upgrading of industrial structure, especially the structural transformation of the upgrading of the secondary industry, has led to a significant decline in energy intensity (Liu et al., 1992; Huang, 1993; Ang and Lee, 1994). Karen et al. (2004) study the changes of China’s industrial structure, and consider that the upgrading of industrial structure is the main driving force for the decline of energy intensity. Wang and Qi (2013) and Li et al. (2014) think that the change of energy intensity mainly comes from the impact of industrial structure, and the adjustment of industrial structure has played an irreplaceable positive role in reducing China’s energy intensity. Zhang and Pu (2015) think that the change of industrial structure has regional heterogeneity, and the optimization of industrial structure in the eastern region is ahead of that in the central and western regions. The optimization and upgrading of industrial structure have indeed promoted the decline of energy intensity. 2) The change of industrial structure does not reduce the energy intensity, and even increases the energy intensity. Ian Sue Wing (2008) reviews the history of American energy economy in 1980s, and finds that the continuous decline of energy intensity in the United States is firstly attributed to the optimization and adjustment of industrial structure, but the impact of industrial structure change on energy intensity is non-linear, and the effect of industrial structure on reducing energy intensity becomes less and less obvious after 1980. Jimenez and Mercado (2014) also reach the same conclusion that the effect of industrial structure adjustment on reducing energy intensity is getting weaker and weaker. Jaruwan C. et al. (2014) think that in different regions and different development stages, the effect of industrial structure adjustment on the decrease of energy intensity is non-linear and unstable, sometimes getting bigger and sometimes getting smaller, sometimes being positive and sometimes being negative. Lidia A. et al. (2015) think that the adjustment of industrial structure has no effect on reducing energy intensity, and may even have a negative impact. Shi and Zhang (2003) thinks that the positive effect of industrial structure upgrading on China’s energy intensity gradually disappears, and even worsens the energy intensity. Zhang et al. (2013) points out that, on the whole, the change of China’s industrial structure has led to the increase of energy consumption per unit GDP, the reduction of energy efficiency and the improvement of energy intensity. Lin and Chen (2019) select provincial panel data from 1998 to 2014 for research, and find that the distortion of industrial structure caused by the mismatch between industrial structure and employment structure resulted in the improvement of China’s energy intensity.
To conclude, the influence of digital economy and industrial structure distortion on China’s energy intensity has not yet reached a consensus, and the viewpoint of supporting digital economy to reduce energy intensity is in a dominant position. Empirical studies are mostly concentrated in provincial units, and the literature on the influence of a certain province’s energy intensity is extremely rare, and the literature on the influence of Xinjiang’s energy intensity is basically blank. Compared with the existing literature, the marginal contribution of this paper may be as follows: 1) Drawing lessons from the existing research results and combining with the actual situation of Xinjiang, we will build a digital economy index system, investigate the influence of digital economy and industrial structure distortion on Xinjiang’s energy intensity, and make it better serve the high-quality development of Xinjiang’s economy. 2) Using dynamic panel data model, spatial Durbin model and intermediary effect model to empirically test the influence and mechanism of digital economy on Xinjiang’s energy intensity, especially using PSTR model to examine the adjustment effect of industrial structure distortion between digital economy and energy intensity, which allows the parameters of the model to change gradually with the change of conversion variables, better depicts the cross-sectional heterogeneity of panel data, overcomes the defects of traditional threshold regression model, and makes the continuous and smooth non-linear conversion between mechanisms closer to the reality (Zhang et al., 2007) 3). Combining the industrial share of the three industries with the employment share to form a distorted industrial structure system, which is used as an intermediary and adjustment variable to investigate the inhibitory effect of digital economy on Xinjiang’s energy intensity. 4) Putting forward policy suggestions pertinently, which has certain policy value for Xinjiang to realize the digital development strategy, curb the distortion of industrial structure, reduce the energy intensity, and help the overall goal of Xinjiang’s work.
The impact of digital economy on energy consumption can be simply divided into direct energy consumption and indirect energy consumption. The direct energy consumption of digital economy includes the energy consumption of infrastructure links such as digital economy equipment, network, operation, and manufacturing; Indirect energy consumption of digital economy includes energy consumption changes caused by energy-saving effect of digital economy, and energy consumption changes caused by changes in production and consumption patterns and even changes in economic structure of digital economy.
The infrastructure of digital economy industry, such as base station, network equipment, and data center, has the most direct impact on energy consumption. In the future, the investment, production, and operation of digital economy infrastructure will continue to increase, which will inevitably lead to an increase in the level of energy consumption. Anders and Tomas (2015) simulate and predict the possible energy consumption of the digital economy sector. Under three different situations of high, medium and low, the proportion of electricity consumption in the digital economy sector will increase to 6%–21% and 8%–51% in 2020 and 2030 respectively. If the electricity part of renewable energy is excluded, the least optimistic situation is that the contribution of digital economy energy consumption to global greenhouse gas emissions will be about 23% in 2030. The calculation method of direct energy consumption of digital economy (mainly including the energy consumed in the process of equipment operation, manufacturing, and disposal) is relatively mature and simple. However, the direct energy consumption of digital economy reflects the total amount of energy consumption caused by using the digital economic equipment in production or consumption, but cannot reflect the change of energy consumption caused by the change of production mode and consumption behavior. Therefore, the direct energy consumption of digital economy is not the focus of research, and can even be ignored. Although the direct energy consumption of digital economy is intuitive, it cannot be considered that the wider the application of digital economy, the more energy consumption.
The indirect energy consumption caused by the application of digital economy is mainly through two mechanisms: technological progress and economic and social penetration. First, technological progress. The application of digital economy improves the efficiency of energy use, resulting in energy saving effect. At first, the influence mechanism between digital economy and energy consumption is studied, the influence of technological change represented by digital economy on industrial energy demand is discussed mainly. The main point of view is that energy efficiency can be improved by increasing intra-industry efficiency, thus resulting in energy-saving effect. Some think-tank institutions have also released reports expressing optimism about the energy-saving effect of the digital economy. For example, Accenture predicts that the application of digital economy will have 20% greenhouse gas emission reduction potential in 2030. The most common example in reality is that intelligent building technology adjusts the temperature according to the real-time demand of residents to reduce the energy consumption of air conditioning, thus producing energy-saving effect. May et al. (2016) propose that the application of digital economy can promote the automation of production process, thus reducing the energy consumption of enterprises and improving energy efficiency. The second is the penetration of the digital economy into the economy and society. The penetration of the digital economy into the economy and society constantly subverts the “traditional” production and lifestyle, causing the changes of human preferences and economic and social systems (Greening et al., 2000; Plepys, 2002), thus changing the structure of terminal energy consumption, resulting in the transfer effect between energy consumption departments.
The difference of energy intensity between different departments leads to the increase or decrease of energy consumption. For example, although telecommuting and video conferencing reduce the transportation energy consumption, online meal ordering, and shopping instead of home cooking and offline consumption generate transportation energy consumption. Therefore, the rise of e-commerce has a wide impact on the energy consumption of the logistics industry (Hesse, 2002). Some studies even believe that the wide application of digital economy has changed various paths of energy consumption, which may lead to a greater indirect impact of digital economy on energy. The calculation of the impact of digital economy on energy efficiency is very complicated, and there are many uncertainties, which objectively leads to the inability to accurately estimate the impact of digital economy on the net effect of energy consumption, and then causes the disagreement of the current research conclusions. For example, Takase and Murota (2004) think that the application of digital economy improves energy efficiency, which will be beneficial to saving the total energy consumption in the future. While the digital economy industry has improved energy efficiency at the micro level, it has generally increased the total power consumption. The main reasons for the disagreement can be summarized as follows: First, the complexity of the application of digital economy and the variability of its penetration lead to the researchers’ inconsistent definition of the effects caused by digital economy; Secondly, there is a lack of empirical data on how users interact with the digital economy system, so it is difficult to assess the ability of digital economy applications to improve energy efficiency in the micro-field; Thirdly, with the expansion of the application scope of digital economy, especially the change of traditional production and consumption patterns, the potential impact and uncertainty of digital economy on energy consumption have increased dramatically.
With the accelerated expansion of a new round of technological and industrial revolution represented by artificial intelligence, quantum information and machine learning, the digital economy has achieved a deeper integration with the real economy through group breakthroughs, cross-integration and other ways, and has played an increasingly prominent role in promoting industrial transformation and upgrading and supporting the construction of a new development pattern. Particularly, the digital economy takes data as the key production factor, which drives the networked sharing, intensive integration, cooperative development and efficient utilization of labor, capital, land, technology, management, and other factors, thus realizing the digital transformation of traditional industries, promoting the development of emerging industries and promoting the transformation, and upgrading of industrial structure. At present, China is still faced with outstanding problems such as unbalanced industrialization development, inadequate integration of industrialization and informatization, and relatively slow process of new industrialization. Nevertheless, as the economy enters a new stage of development, under the double pressure of anti-globalization and weak scientific and technological innovation ability, digital economy can help efficiency change, power change and quality change, and has become an important starting point for promoting industrial transformation and upgrading and promoting labor employment. The restraining effect of the development of digital economy on the industrial structure distortion has gradually been promoted to a new height. Once the industrial added value structure deviates from the employment structure, it will inevitably lead to the distortion of industrial structure (Qin et al., 2022). However, the demand for energy among the three industries is quite different, and the level of energy consumption within each industry depends on the level of energy consumption and its proportion within the industry. Obviously, the digital economy can reduce the distortion of industrial structure, and then restrain the energy intensity. Therefore, this thesis proposes the following four hypotheses:
Hypothesis 1:. Digital economy significantly reduces the energy intensity in Xinjiang.
Hypothesis 2:. The distortion of industrial structure has significantly increased the energy intensity in Xinjiang.
Hypothesis 3:. Digital economy can effectively alleviate the distortion of industrial structure, and then curb energy intensity.
Hypothesis 4:. Environmental regulation reduces the energy intensity in Xinjiang.
In this paper, the balanced panel data of 14 prefectures (cities) in Xinjiang from 2010 to 2020 are selected as samples. All the data come from Xinjiang Statistical Yearbook, Xinjiang Survey Yearbook, Xinjiang Brilliant 70 Years, China County Statistical Yearbook, China Regional Economic Statistical Yearbook and statistical bulletin of 14 prefectures (cities). If the above methods still can’t get the data, moving average method, interpolation method and trend extrapolation method are used to supplement or refer to other estimation methods for estimation. The convening of the first Central Xinjiang Work Forum in 2010 ushered in an unprecedented opportunity for the all-round development of Xinjiang, which will inevitably have a greater impact on all work in Xinjiang. Meanwhile, considering the availability of data and statistical caliber, the time windows of all variables in the econometric model are all from 2010 to 2020.
Energy intensity is an index that reflects the overall macro energy efficiency. It is generally expressed by the ratio of total regional energy consumption to actual GDP (10,000 tons of standard coal/100 million yuan). Energy intensity and energy efficiency are reciprocal. The smaller the energy intensity, the higher the energy utilization efficiency (Table 1).
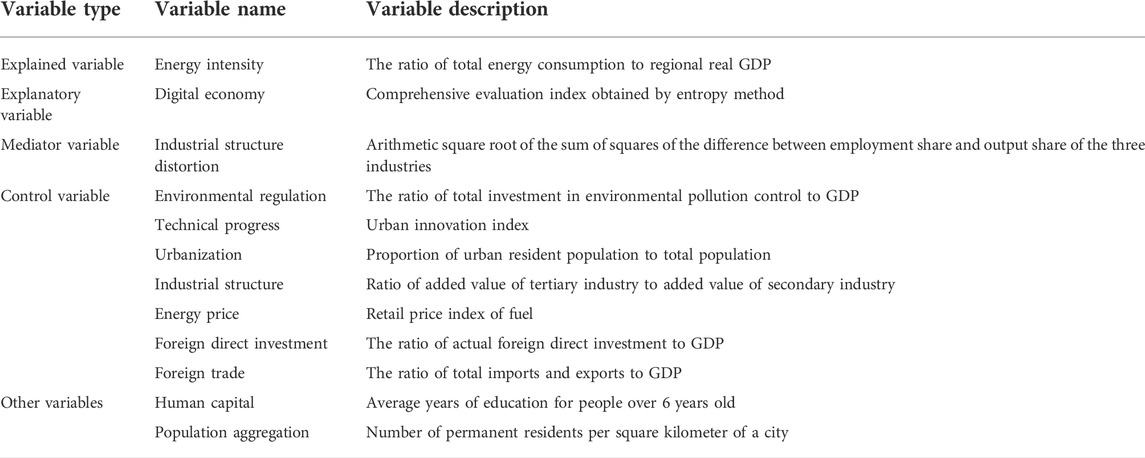
TABLE 1. Specific description of research variables.
At present, the most commonly used methods to obtain comprehensive indicators of digital economy mainly include principal component analysis, coefficient of variation, and entropy weight. However, the principal component analysis method will cause information loss and obscure explanation (Luo et al., 2022); The standardized value of coefficient of variation method is close to 0, which may lead to sudden change of coefficient of variation and low accuracy; Entropy weight method is relatively objective and has high accuracy (Li and Zhu, 2020). Therefore, using the practices of Huang et al. (2019) for reference, the number of Internet broadband users and the number of mobile phone users at the end of the year, the number of employees in information transmission, computer services, and software industries and the income of post and telecommunications services are selected to obtain the comprehensive index of digital economy by using the entropy weight method to process them. Among them, the number of Internet broadband access users and the number of mobile phone users at the end of the year reflect the level of digital infrastructure, whose weight is 0.14; The number of employees in information transmission, computer service and software industry reflects the level of digital industrialization, whose weight is 0.49; Business income of posts and telecommunications reflects the level of digitalization of the industry, whose weight is 0.37 (Tang et al., 2021). There are no units about digital economic index.
Industrial structure distortion is measured by industrial structure distortion index, which is expressed by the arithmetic square root of the sum of squares of the difference between employment share and output share of three industries. The industrial structure distortion index eliminates the dimension. Although there is no unit, it can be compared in size, that is, the larger the index, the more serious the industrial structure distortion will be.
Environmental regulation, measured by the ratio of total investment in environmental pollution control to GDP; Technological progress, measured by urban innovation index; Urbanization, Measured by the proportion of urban resident population to the total population; Industrial structure, measured by the ratio of the added value of the tertiary industry to that of the secondary industry; Energy price, measured by the retail price index of fuel commodities; Foreign direct investment, measured by the ratio of actually utilized foreign direct investment to GDP; Foreign trade, measured by the ratio of total import and export to GDP. Moreover, all the control variables have no units.
In the robustness test, human capital and population aggregation are selected as supplementary variables and replacement variables respectively. Human resources are measured by the average years of education of people over 6 years old; Population agglomeration is measured by the number of permanent residents per square kilometer of a city.
All the economic data in this paper are processed based on the year 2000, and the descriptive statistics of relevant data are shown in Table 2. In order to improve the validity of the estimation results, all the variables used in this paper are treated by natural logarithms. In addition, the multicollinearity test of explanatory variables is carried out in this paper, and the results show that the variance inflation factors are all less than 10, indicating that there is no serious collinearity of variables.
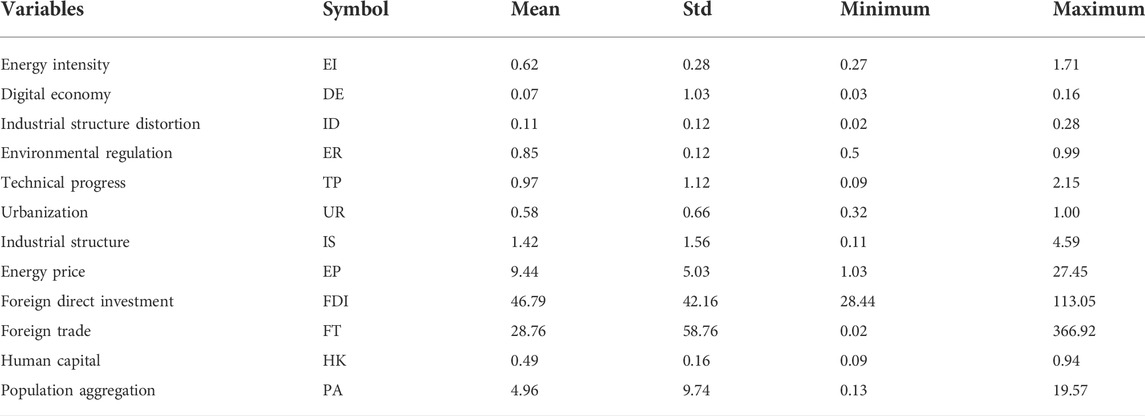
TABLE 2. Descriptive statistical results of main variables.
Based on the above theory, the benchmark regression model in the empirical part of this paper is set as follows:
Among them, i = 1……n;
The benchmark model 1) is tested by Hausman, and the test results show that the fixed-effect model should be used. In order to minimize the possible heteroscedasticity, the standard error of heteroscedasticity-sequence correlation-cross-section correlation robustness is obtained by the method proposed by Driscoll and Kraay (1998).
The regression results of linear influence of digital economy on energy intensity in Xinjiang are shown in Table 3. The estimation results show that the estimation coefficient of digital economy is significantly negative statistically, which indicates that the development of digital economy has significantly reduced the energy intensity in Xinjiang, which verifies Hypothesis 1.
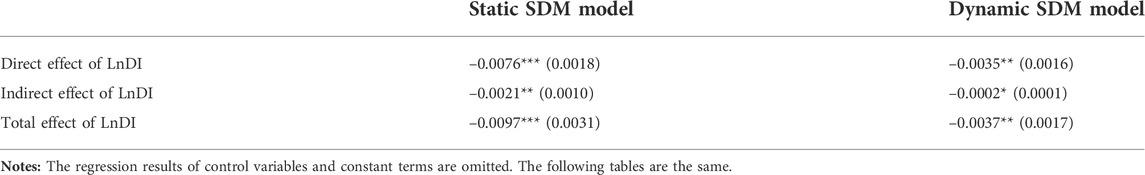
TABLE 3. Results of spatial spillover effect.
Control variables: 1) The regression coefficient of environmental regulation is significantly negative, indicating that environmental regulation has reduced the energy intensity in Xinjiang, which means that improving energy legislation, increasing law enforcement intensity, forcing enterprises to adopt advanced technology to improve production efficiency can reduce total energy consumption and energy intensity, which verifies Hypothesis 4. 2) The regression coefficient of technological progress is significantly negative, indicating that technological progress can effectively reduce Xinjiang’s energy intensity. 3) Urbanization requires a large number of resources to invest in infrastructure construction and maintenance, which will inevitably lead to an increase in the energy demand of urban population while meeting the basic living needs. Meanwhile, urbanization brings about the agglomeration of population, capital, technology and other production factors, resulting in economies of scale, improving the level of regional economic development, and promoting the improvement of production efficiency and the reduction of energy intensity. Therefore, the impact of urbanization on energy intensity is two-way. Different regions and different development stages may have different impacts on energy intensity. As far as Xinjiang is concerned, the regression coefficient of urbanization level is significantly positive, which indicates that the promotion of urbanization in Xinjiang has promoted the energy intensity in Xinjiang. 4) The regression coefficient of industrial structure is significantly negative, indicating that the upgrading of industrial structure is an important factor to reduce the energy intensity in Xinjiang. 5) The regression coefficient of energy price is significantly negative, which indicates that an appropriate increase in energy price can effectively reduce the energy intensity in Xinjiang. 6) The regression coefficient of foreign direct investment is significantly positive, which indicates that the current FDI inflow has brought about the improvement of Xinjiang’s energy intensity, which proves once again that if developing countries or regions blindly pursue economic growth and lower the entry threshold of FDI, they will inevitably become “pollution shelters” for multinational polluting enterprises. 7) The regression coefficient of import and export trade is significantly negative, which indicates that expanding opening-up can effectively reduce the energy intensity in Xinjiang.
Considering that the traditional panel data may ignore the spatial effect. First, Lagrange multiplier is used to test whether the spatial panel model or the traditional panel model is selected. The p-value of Spatial-error and Spatial-lag are both less than 0.1, which indicates the existence of spatial effect. After the spatial panel model is selected, the fixed effect and random effect are selected by Hausman test, and it is found that the fixed effect model is more appropriate. Second, Wald and LR tests are used to determine whether spatial Durbin model degenerates into spatial error model or spatial lag model. Wald and LR tests of spatial error model and spatial lag model are both significant at 1% level, which indicates that SDM model cannot degenerate into SAR model and SEM model. To sum up, SDM model is selected for model analysis. Furthermore, the explained variable lag period 1 is included in the spatial Durbin model to build a more accurate dynamic model, and spatial Durbin model and dynamic spatial Durbin model are built to enhance the accuracy of empirical results in this paper (Gao and Li, 2021). The spatial effect of digital economy on Xinjiang’s energy intensity is further decomposed into direct effect, indirect effect and total effect. The model is set as follows:
Where ρ in models Eqs 2, 3 is the spatial regression coefficient, which reflects the spatial dependence of the observed values of samples; λ is the spatial error coefficient, which reflects the regional spillover effect caused by the error term of observed energy intensity;
Table 3 shows the spatial spillover effect of digital economy on Xinjiang’s energy intensity. First, both the static spatial Durbin model and the dynamic spatial Durbin model in the direct effect have negative regression coefficients, and they all pass the 5% significance test statistically, which shows that the digital economy has a positive effect on the reduction of energy intensity in this region. Furthermore, the coefficients of both static spatial Durbin model and dynamic spatial Durbin model in the indirect effect are still negative, and the significance test at 10% shows that the digital economy has further reduced the energy intensity level of the surrounding areas through the spatial spillover effect. However, it is probably because Xinjiang has a vast territory, the distance between cities is far, and the information technology and other factors are relatively slow in regional mobility, and the spatial spillover effect is relatively weak, and the radiation effect on the surrounding areas is poor, and the inhibition effect on the energy intensity in the surrounding areas is weak.
Considering that the energy intensity will be affected by the consumption behavior of the previous period, the lag period of the explained variable is selected as the explanatory variable, and the dynamic panel data model is estimated by using the system GMM. Table 4 shows that the p-value corresponding to AR 1) is less than 0.1, and the p-value corresponding to AR 2) is greater than 0.1, which means that there is no sequence correlation in the error terms of the first-order difference. The p-value corresponding to the SAR test is 1, which means that there is no over-recognition of tool variables, all instrumental variables are valid, and the regression coefficients of digital economy are all significantly negative, which indicates that digital economy is helpful to reduce the energy intensity in Xinjiang, and the model transformation method has no obvious impact on the core conclusions. To some extent, it can be considered that the dynamic panel verifies the previous conclusions and proves the robustness of this conclusion.
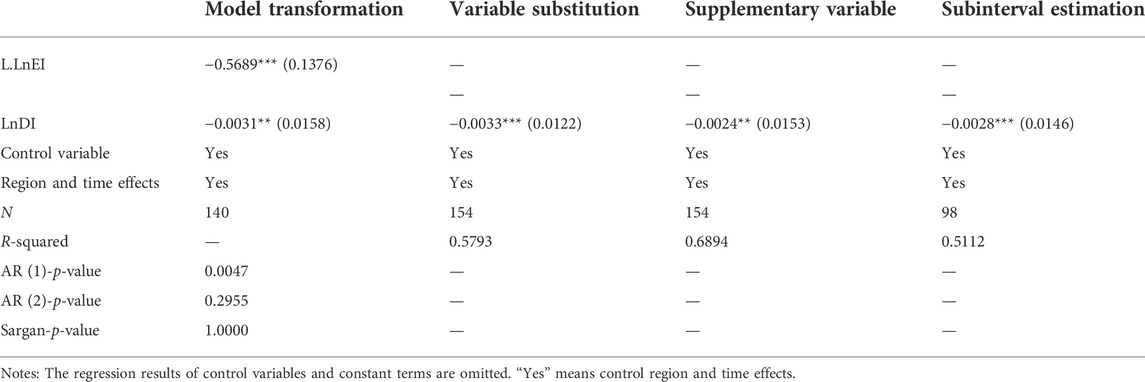
TABLE 4. Robustness test results.
Urbanization is the process of continuous agglomeration of production factors from rural to urban space. Population growth and agglomeration will also bring about an increase in energy demand. Therefore, the number of permanent residents per square kilometer, that is, population agglomeration, is used to replace urbanization, the main control variable in the benchmark regression model, to re-estimate the model (Table 4). The estimated results are basically consistent with those of the original model, which shows the stability of the original conclusion.
Human capital is the carrier of knowledge and technology, and high-end technical talents are the driving force of innovation. Human capital can reduce energy consumption by encouraging energy-saving innovation. Therefore, human capital is added to the benchmark regression model to re-estimate the model, and human capital is measured by the average years of education of people over 6 years old. The obtained results are basically consistent with the previous results, indicating that the obtained conclusions are reliable.
In 2014, the second Central Forum on Xinjiang Work was successfully held, and “social stability and long-term stability” was identified as the overall goal of Xinjiang’s work, which injected new vitality into the all-round development of Xinjiang. Therefore, the data of 2010, 2011, 2012, and 2013 are ignored, and the model estimation effect of sample interval from 2014 to 2020 is investigated. It is found that the model estimation results are consistent with the previous conclusions, which shows the robustness of the research conclusions.
Xinjiang is divided into northern and southern Xinjiang by the usual classification method in this paper. The northern Xinjiang is divided in nine parts, including Urumqi, Karamay, Changji Hui Autonomous Prefecture, Bortala Mongolian Autonomous Prefecture, Ili Kazakh Autonomous Prefecture, Altay, Tacheng, Hami, and Turpan. The southern Xinjiang is divided in five parts, including Bayinguoleng Mongolian Autonomous Prefecture, Aksu Prefecture, Kashi Prefecture, Hotan Prefecture, and Kizilsu Kirgiz Autonomous Prefecture. Limited by resource endowment, economic foundation, national characteristics and other reasons, there are not only great differences in the level of economic and social development in Xinjiang, but also imbalances and inadequacies in the development of digital economy. Southern Xinjiang generally lags behind northern Xinjiang in digital infrastructure, digital administrative services and digital life services. To study whether there is regional heterogeneity in the impact of digital economy on Xinjiang’s energy intensity, Xinjiang is divided into two sub-samples of northern and southern Xinjiang. The results are shown in Table 5. It can be found that there is regional heterogeneity in the influence of digital economy on the explained variables, which is mainly reflected in the inhibition of digital economy on energy intensity in northern Xinjiang. The reason may be that the development foundation and digital application level of this region are generally good, and its implementation effect on policy response is better than that in southern Xinjiang, so the dividends of digital economy can be released more easily.
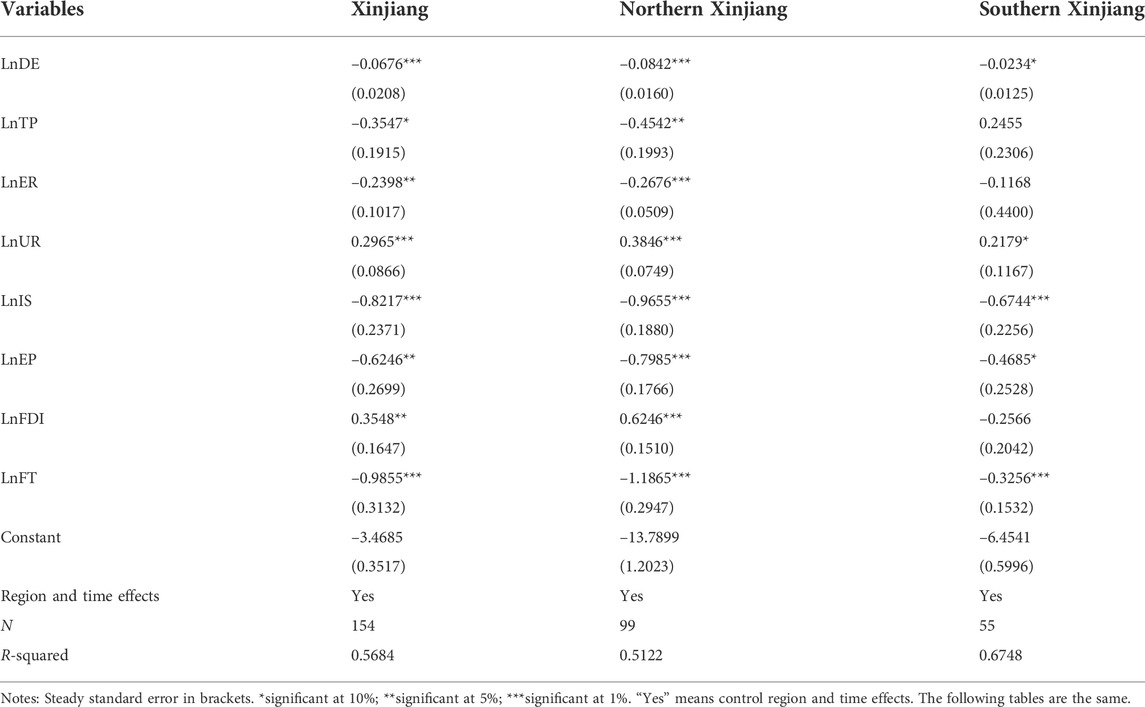
TABLE 5. Impact of digital economy on energy intensity.
According to the analysis of the influence mechanism of the previous research hypothesis, this paper thinks that the influence of digital economy on energy intensity may be conducted through the industrial structure distortion. The industrial structure distortion is inseparable from the output structure and employment structure. Their influence on energy intensity is based on the difference of energy intensity in various industries. If the proportion of industries with high energy consumption in a certain area is large, the energy intensity in that area is likely to be high; If the proportion of industries with low energy consumption in a certain area is large, the energy intensity in that area is likely to be low.
Generally speaking, the energy consumption of the primary industry is low; The secondary industry is dominated by industries with high energy consumption, so the demand for energy is naturally high; The demand for energy in the tertiary industry is generally small. In the low level of economic development, the level of production technology is backward, with the highest proportion of primary industry, higher proportion of secondary industry and lowest proportion of tertiary industry. At this stage, the total energy demand is not high, and the energy intensity is naturally low. With the continuous improvement of the economic development level, the industrial structure is gradually upgraded, and the secondary industry is developing rapidly, taking the lead in surpassing the primary industry. The total energy demand is increasing, and the energy intensity is rising accordingly. With the development of industrialization to a certain level, the industrial structure is advanced, and the tertiary industry accounts for the largest proportion. At this time, the total energy consumption decreases and the energy intensity continues to decline. Therefore, with the continuous improvement of the market mechanism, energy flows more fully across regions and industries. Adjusting the industrial structure within the industry will affect the three industrial structures, thus affecting the total energy consumption and finally the energy intensity. On the other hand, with the progress of technology and the profit-seeking nature of production factors, energy factors will be allocated more efficiently among industries. From industries with high energy consumption and low efficiency to industries with low energy consumption and high efficiency, the energy intensity of the whole economy will gradually decrease. Of course, if the high-energy industries are transferred across regions, the energy consumption structure in this region can be optimized, and the energy intensity can also be reduced, but the energy intensity in other regions may increase.
Industrial structure distortion depends not only on industrial structure, but also on employment structure. Ando and Nassar (2017) and Shen et al. (2021) have pointed out that the industrial structure distortion means that there are differences in industrial labor productivity. At this time, relative to a certain output scale, either labor input is too much or labor input is too little, which has not yet formed the equalization of departmental labor productivity. Since the late 1950s, due to the formal establishment of the planned economic system, China’s urban-rural dual system has basically taken shape, and urban and rural areas have also become closed units, and the flow of production factors has been severely restricted. In the rural agricultural sector, the serious surplus of low-cost rural labor input makes it impossible to invest in agricultural machinery and other capital. At this time, the energy intensity of the agricultural sector is relatively low. On the contrary, compared with the “expensive” labor force, it is a rational choice for the manufacturers in the urban industrial sector who pursue profit maximization to produce a certain output and choose more capital investment. At this time, the energy utilization of the industrial sector increases and the energy intensity is relatively high. Obviously, the urban-rural dual system has increased the difference in labor productivity between the traditional agricultural sector and the modern industrial sector, resulting in the agricultural labor share being higher than its output share, while the industrial labor share being lower than its output share, which eventually leads to the distortion of the industrial structure.
Based on the theoretical analysis and variable setting of intermediary effect mentioned above, according to the possible influence path of digital economy on energy intensity, in order to test whether digital economy will affect energy intensity through industrial structure distortion, this paper constructs the following intermediary effect model with reference to the step-by-step method of testing intermediary effect proposed by Baron and Kenny (1986) for testing:
Among them,
Table 6 shows the results of the intermediary effect. In model (1), the digital economy has a significant impact on energy intensity. Under the condition that other factors remain unchanged, the energy intensity decreases by 0.0676% on average for every 1% increase in the development of digital economy; In model (2), the influence of digital economy on the industrial structure distortion is significant. Under the condition that other factors remain unchanged, for every 1% increase in digital economy, the distortion of industrial structure decreases by 0.4377% on average; In model (3), the influence of industrial structure distortion on energy intensity is significant. The distortion of industrial structure significantly increases the energy intensity in Xinjiang, which verifies Hypothesis 2. The symbols of each coefficient in the model are completely consistent with the theoretical symbols expected in the model construction. According to the conclusions in the model construction, Sobel test is not required. Meanwhile, because the digital economy in model 3) has a significant impact on energy intensity, and the symbol of the product of the coefficient of DI in model 2) and the coefficient of SD in model 3) is the same as that of DI in model (3), it shows that there is some intermediary effect. Specifically, for every 1% increase in digital economy, the energy intensity will directly decrease by 0.0676%, and at the same time, resulting in the industrial structure distortion decreasing by 0.4397%, and then the energy intensity will decrease by 0.0187% (−0.4397*0.0427). Obviously, the intermediary effect will account for 27.65% of the total effect. Therefore, digital economy can effectively alleviate the industrial structure distortion, and then curb the energy intensity, which verifies Hypothesis 3.
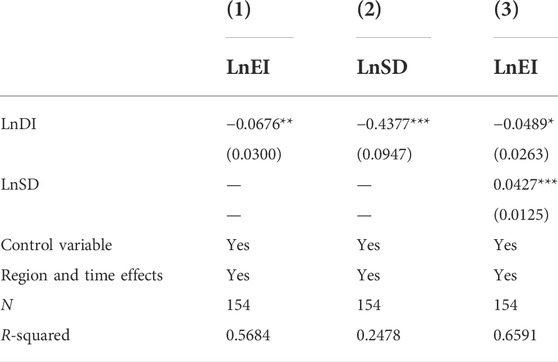
TABLE 6. Regression results of intermediary effect.
In order to further clarify whether the intermediary variable of industrial structure distortion will affect the transmission path of digital economy to Xinjiang’s energy intensity, this paper further analyzes this problem by using the Panel Smooth Transition Regression.
The Panel Smooth Transition Regression (PSTR) proposed by González et al. (2017) is a further extension of the panel threshold regression model (PTR) (Hansen, 1999), which can better describe the cross-sectional heterogeneity of panel data. By introducing a continuous transition function instead of the discrete explicit function in PTR, PSTR model allows the parameters of the model to gradually transform with the change of transformation variables, which makes the continuous and smooth non-linear transition between mechanisms closer to the reality (He et al., 2011). A simple PSTR model can be expressed as:
where i= 1,2 …, N represents the number of samples, t= 1,2 …, T represents time;
Among them, c represents the location parameter where the transition takes place; m represents the dimension of the position parameter; r is a smoothing parameter, and its value directly affects the smooth transition speed of
Before the parameter estimation of PSTR model, it is necessary to determine the number of r of the transition functions. If r = 0, which indicates that the model has no non-linear system conversion effect, so it is unnecessary to use PSTR model for estimation; If r ≥ 1, PSTR model should be adopted.
As can be seen from Table 7, under the significance level of 10%, the model with industrial structure distortion as the transition variable reject the original assumption of the linear model. The model has significant non-linear characteristics, indicating that the energy intensity has significant heterogeneity. The test results tend to choose the PSTR model with a transition function, so it is finally set as the following PSTR model:
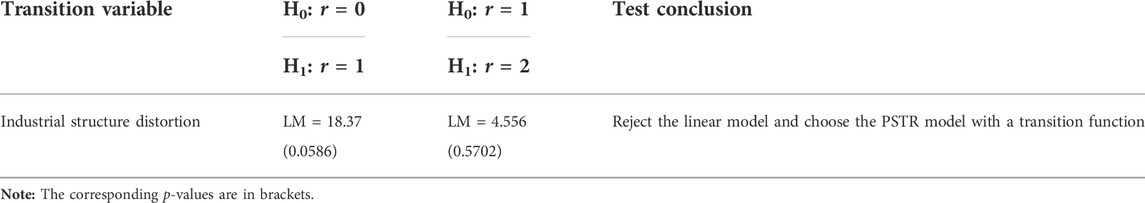
TABLE 7. Model setting test.
Next, parameter estimation is carried out. In the calculation process, the grid search algorithm is used for the optimization of non-linear least squares (NLS), and the maximum number of iterations is set 10,000. The estimated results of parameters are shown in Table 8.
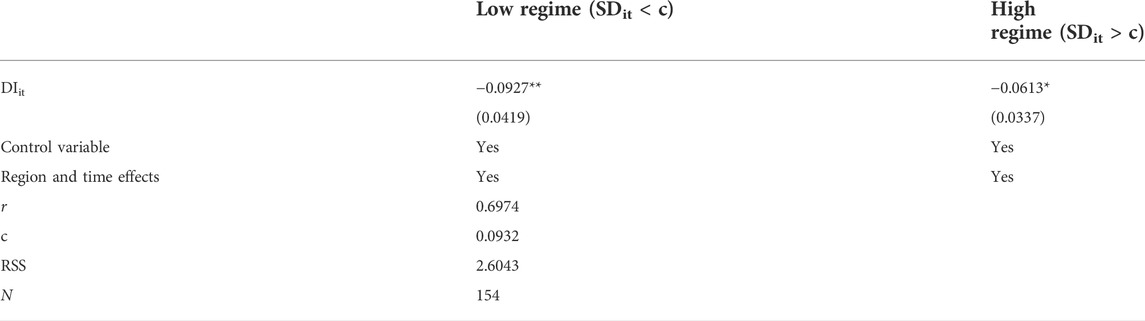
TABLE 8. Estimated results of PSTR model.
Table 8 shows that the position parameter c of non-linear transition of the model is 0.0932, namely the threshold of industrial structure distortion is 0.0932. The speed parameter r of the model for smooth transition between high and low regime is 0.6974. When the industrial structure distortion index is low, the elasticity of digital economy to Xinjiang’s energy intensity is negative and statistically significant. Specifically, when the industrial structure distortion index is less than 0.0932, for every 1% increase in the digital economy, the energy intensity will decrease by 0.0927% on average. However, with the transition of industrial structure distortion index mechanism, the inhibition intensity of digital economy on Xinjiang’s energy intensity has gradually decreased, and its significance has also declined gradually. It can be seen that the industrial structure distortion plays a significant negative role in regulating the impact of digital economy on Xinjiang’s energy intensity.
This paper selects the regional panel data of 14 prefectures and cities in Xinjiang from 2010 to 2020, and takes the industrial structure distortion as the intermediary variable and adjustment variable to empirically investigate the influence of digital economy and industrial structure distortion on Xinjiang’s energy intensity. The main findings are as follows: First, digital economy can restrain Xinjiang’s energy intensity, but there is regional heterogeneity, which has a significant inhibition effect on northern Xinjiang’s energy intensity and a relatively weak inhibition effect on southern Xinjiang’s energy intensity; Second, due to the imperfect market mechanism, there are barriers to the flow of production factors, which leads to the differentiation of labor productivity in industrial sectors, and the industrial structure distortion comes from the imbalance of labor productivity among industries. As long as the industrial structure is distorted, the inefficiency of resource allocation will inevitably exist, and Pareto optimality will not be realized. The industrial structure distortion has significantly increased the energy intensity in Xinjiang. Third, the digital economy effectively alleviates the distortion of industrial structure, thus curbing the energy intensity; Fourth, the environmental regulation has negative effect on energy intensity in Xinjiang, which suggests that improving energy legislation, increasing law enforcement intensity, forcing enterprises to adopt advanced technology to improve production efficiency can reduce energy intensity. Fifth, the influence of digital economy on Xinjiang’s energy intensity has intermediary effect and adjustment effect, and with the improvement of industrial structure distortion, the inhibitory effect of digital economy on Xinjiang’s energy intensity tends to decline.
According to the conclusions obtained in this paper, the policy implications are as follows:
First, it is necessary to speed up the construction of new infrastructure carrying digital technology, focus on the development of core basic industries such as integrated circuits, new displays, high-end software, and high-end servers, and raise the level of “new infrastructure” construction, so as to provide the foundation for digital industrialization and industrial digitalization. Second, there is a need to promote the penetration of digital economy and digital technology into traditional industries, strengthen the wide application of digital economy and digital technology in various fields such as production, life, transportation, and energy, urban governance and management, improve the level of digital industrialization, optimize industrial structure, promote the innovation and development of green technology, and provide technical support for reducing energy intensity. Third, the government should rely on digital technology to speed up the digital transformation and development of enterprises, linking all links and business processes such as production, R&D and sales of enterprises, achieving the effect of improving quality and efficiency, continuously reducing energy intensity, and helping to achieve the goal of “double carbon”.
First, it is necessary to break the huge differences between urban and rural residents in public services such as education, medical care, employment, and old-age care, break down the barriers that restrict the agricultural labor force from settling in urban employment, speed up the agricultural labor force’s continued transfer to industrial and urban departments, and promote the integrated development of urban and rural areas. Second, the government should increase investment in all kinds of education at all levels, improve the education level of the labor force, promote the inter-regional and inter-departmental mobility of the labor force, improve the efficiency of departmental allocation of labor resources, and reduce the degree of industrial structure distortion. Third, it is necessary to speed up the replacement of traditional industries by emerging industries, accelerate the elimination of backward production capacity, rationally allocate production factors, increase the proportion of high-tech industries and service industries in the national economy, foster new kinetic energy for green economic development, and effectively alleviate the inhibitory effect of industrial structure distortion on the decline of energy intensity.
First, the formulation of digital economy development policy should be appropriately tilted to southern Xinjiang, and a series of measures should be taken, such as improving the Internet application level of government services and cultivating digital economy professionals, so as to eliminate the “digital divide” between northern and southern Xinjiang, help Xinjiang with digital aid, make up shortcomings, enhance self-development ability, and give full play to the positive effect of digital economy on energy intensity. Second, Xinjiang should speed up the construction of digital platform, optimize the layout of data center construction, and realize the synergy of digital economic development in northern and southern Xinjiang. Third, there is a need to advocate and strengthen the concept of green production and green consumption, implement strict environmental regulation policies, force enterprises to improve energy efficiency, and promote the development of energy consumption in the direction of green energy conservation.
First, due to the imbalance of digital economy development, differences in technological level and industrial structure in different regions, the government should scientifically and rationally choose and formulate environmental regulation policies according to the local actual situation, and reduce energy intensity through various environmental regulation ways. Second, there is a need to speed up technological innovation and improve the utilization efficiency of existing technologies; It is necessary to improve the quality of urbanization development, and promote the synchronous scientific development of new industrialization, informatization, new urbanization and agricultural modernization in Xinjiang. Third, the government should speed up the adjustment of industrial structure, focus on the key areas and shortcomings of the tertiary industry, focus on the development of key industries, and enhance the leading and supporting role of the tertiary industry in the high-quality development of Xinjiang’s economy, and It is necessary for the government to strictly strengthen environmental regulation. Fourth, the government should formulate policies to raise the entry threshold of FDI, and strictly limit the inflow of industries with high energy consumption and high pollution into Xinjiang. Fifth, Xinjiang should continue to open wider to the outside world, optimize the structure of import and export products, strengthen regional cooperation, abandon the previous competition pattern of fighting for policies and costs, consider a win-win model of cooperation instead of competition, and realize the “positive sum game”.
The raw data supporting the conclusion of this article will be made available by the authors, without undue reservation. Further inquiries can be directed to the corresponding author.
QG: initial conceptualization, data collection and processing, methodology building, software application, writing-original draft. CD: conceptualization, discussion, supervision. ZW: methodology guidance and software application. YX: writing review, supervision, funding. DL: supervision. All authors contributed to the paper and approved the submitted version.
The research is supported by Xinjiang Social Science Project “An economic history study on the influence of industrial structure distortion on Xinjiang’s energy intensity (1949–2020)” (22BJL017) and Xinjiang University doctoral research start-up fund project “Study on the influence of industrial structure distortion on energy intensity in Xinjiang (1978–2021)” (620321035).
The authors declare that the research was conducted in the absence of any commercial or financial relationships that could be construed as a potential conflict of interest.
All claims expressed in this article are solely those of the authors and do not necessarily represent those of their affiliated organizations, or those of the publisher, the editors and the reviewers. Any product that may be evaluated in this article, or claim that may be made by its manufacturer, is not guaranteed or endorsed by the publisher.
Anders, A., and Tomas, E. (2015). On global electricity usage of communication technology: Trends to 2030. Challenges 6 (1), 117–157. doi:10.3390/challe6010117
Ando, S., and Nassar, K. B. (2017). Indexing structural distortion: Sectoral productivity, structural change and growth. Int. Mon. Fund. Work. Pap. 17, 1. doi:10.5089/9781484319277.001
Andres, L., and Padilla, E. (2015). Energy intensity in road freight transport of heavy goods vehicles in Spain. Energy Policy 85 (10), 309–321. doi:10.1016/j.enpol.2015.06.018
Ang, B. W., and Lee, S. Y. (1994). Decomposition of industrial energy consumption: Some methodological and application issues. Energy Econ. 16 (2), 83–92. doi:10.1016/0140-9883(94)90001-9
Baron, R. M., and Kenny, D. A. (1986). The moderator-mediator variable distinction in social psychological research: Conceptual, strategic, and statistical considerations. J. Pers. Soc. Psychol. 51 (6), 1173–1182. doi:10.1037/0022-3514.51.6.1173
Chen, B. (2022). Research report on the development of digital economy in Xinjiang Xinjiang digi. Econ. Res. Ins. Available at https://max.book118.com/html/2022/0902/6131055115004232.shtm.
Chen, X., Schaufelberger, M., and Fu, M. (2020). The eligible population of the PARADIGM-HF trial in a real-world outpatient clinic and its cardiovascular risk between 2005 and 2016. J. Cardiovasc. Med. 7, 6–12. doi:10.2459/JCM.0000000000000889 http://magazine.caijing.com.cn/20210419/4757833.shtml.
Chontanawat, J., Wiboonchutikula, P., and Buddhivanich, A. (2014). Decomposition analysis of the change of energy intensity of manufacturing industries in Thailand. Energy 77 (12), 171–182. doi:10.1016/j.energy.2014.05.111
Denison, E. F. (1967). Why growth rate differ: Postwar experience in nine western countries. Washington: Bookings Institution Publishing. doi:10.2307/2551816
Driscoll, J. C., and Kraay, A. C. (1998). Consistent covariance matrix estimation with spatially dependent panel data. Rev. Econ. Stat. 80 (4), 549–560. doi:10.1162/003465398557825 https://ideas.repec.org/a/tpr/restat/v80y1998i4p549-560.html.
Gao, Z. G., and Li, M. R. (2021). Heterogeneous environmental regulation, energy efficiency and high-quality economic development in Xinjiang. Soc. Sci. Xinjiang 4, 62–74. doi:10.3969/j.issn.1009-5330.2021.04.008
Gonzalez, A., Terasvirta, T., Dijk, D. V., and Yang, Y. (2017). Panel smooth transition regression models. New Econ. Pap. 11, 604. https://ideas.repec.org/p/hhs/hastef/0604.html.
Greening, L. A., Greene, D. L., and Difiglio, C. (2000). Energy efficiency and consumption: The rebound effect—A Survey. Energy Policy 28 (6-7), 389–401. doi:10.1016/S0301-4215(00)00021-5
He, S. B., Zhou, H. R., and Liu, Y. J. (2011). Study on the heterogeneity of China’s regional industrial total factor productivity growth under environmental regulation. J. South China Econ. 11, 28–41. doi:10.3969/j.issn.1000-6249.2011.11.003
Heddeghem, W., Lambert, S., Lannoo, B., Colle, D., Pickavet, M., and Demeester, P. (2014). Trends in worldwide ICT electricity consumption from 2007 to 2012. Comput. Commun. 50 (1), 64–76. doi:10.1016/j.comcom.2014.02.008
Hesse, M. (2002). Shipping news: The implications of electronic commerce for logistics and freight transport. Resour. Conserv. Recycl. 36 (3), 211–240. doi:10.1016/s0921-3449(02)00083-6
Huang, J. P. (1993). Industrial energy use and structural change: A case study of the people's republic of China. Energy Econ. 15 (2), 131–136. doi:10.1016/0140-9883(93)90032-m
Huang, Q. H., Yu, Y. Z., and Zhang, S. L. (2019). Internet development and productivity growth in manufacturing industry: Internal mechanism and China experiences. China Ind. Econ. 8, 5–23. doi:10.19581/j.cnki.ciejournal.2019.08.001
Jimenez, R., and Mercado, J. (2014). Energy intensity: A decomposition and counterfactual exercise for Latin American countries. Energy Econ. 42 (3), 161–171. doi:10.1016/j.eneco.2013.12.015
Karen, F. V., Gary, H. J., Liu, H. M., and Tao, Q. (2004). What is driving China’s decline in energy intensity? Resour. Energy Econ. 26 (1), 77–97. doi:10.1016/j.reseneeco.2003.07.002
Kashif, I., Syed, T. H., Wang, Y. C., Muhammad, H. S., Madeeha, S., and Khurshaid, K. (2022). To achieve carbon neutrality targets in Pakistan: New insights of information and communication technology and economic globalization. Front. Environ. Sci. 9, 1–10. doi:10.3389/fenvs.2021.805360
Laitner, J., and Ehrhardt, K. (2008). Information and communication technologies: The power of productivity (part I). Environ. Qual. Manage. 18 (2), 47–66. doi:10.1002/tqem.20205
Lewis, A. (1954). Economic development with unlimited supplies of labour. Manch. Sch. 22 (2), 139–191. doi:10.1111/j.1467-9957.1954.tb00021.x
Li, J. C., Yang, S., and Zhao, N. (2014). Analysis of influencing factors of China’s energy intensity—based on the quintile. J. Bus. Econ. 12, 73–80. doi:10.14134/j.cnki.cn33-1336/f.2014.12.009
Li, X. J., and Zhu, D. F. (2020). Innovation capability, fiscal and tax policies and energy intensity—an empirical test based on provincial panel data in China. Econ. Theory Busi. Manag. 2, 58–72. doi:10.3969/j.issn.1000-596X.2020.02.007
Lin, B. Q., and Chen, Y. (2019). Will economic infrastructure development affect the energy intensity of China's manufacturing industry? Energy Policy 132, 122–131. doi:10.1016/j.enpol.2019.05.028
Liu, X. Q., Ang, B. W., and Ong, H. L. (1992). The application of the divisia index to the decomposition of changes in industrial energy consumption. Energy 13 (4), 161–177. doi:10.5547/issn0195-6574-ej-vol13-no4-9
Luo, L. Z., Lin, J. H., and Tan, Y. Q. (2022). Research on the influence of digital economy on energy consumption—based on the test of intermediary effect and masking effect of regional integration. Study Pract. 6, 44–53. doi:10.19624/j.cnki.cn42-1005/c.2022.06.013
Maddison, A. (1987). Growth and slowdown in advanced capitalist economies: Techniques of quantitative assessment. J. Econ. Liter. 25 (2), 649–698. http://down.cenet.org.cn/show-1412-7396-1.html.
May, G., Stahl, B., Taisch, M., and Kiritsls, D. (2016). Energy management in manufacturing: From literature review to a conceptual framework. J. Clean. Prod. 167 (11), 1464–1489. doi:10.1016/j.jclepro.2016.10.191
Plepys, A. (2002). The grey side of ICT. Environ. Impact Assess. Rev. 22 (5), 509–523. doi:10.1016/S0195-9255(02)00025-2
Qin, J. Q., Zhao, J. J., and Wang, W. (2022). Mediating effect of digital economy on industrial structure upgrading and empirical evidence. Stat.& Deci. 11, 99–103. doi:10.13546/j.cnki.tjyjc.2022.11.020
Romm, J., Rosenfeld, A., Hermann, S., and Habicht, H. (2000). The impact of E-commerce on energy and the environment. Strategic Plan. Energy Environ. 20 (2), 35–41. doi:10.1080/10485230009509539
Shao, S., Fan, M. T., and Yang, L. L. (2022). Economic restructuring, green technical progress, and low-carbon transition development in China: An empirical investigation based on the overall technology frontier and spatial spillover effect. J. Manag. World 2, 46–69. doi:10.19744/j.cnki.11-1235/f.2022.0031
Shen, X. B., Chen, Y., and Lin, B. Q. (2021). The impacts of technological progress and industrial structure distortion on China's energy intensity. J. Econ. Res. 2, 157–173.
Shi, D., and Sun, G. L. (2022). Digital economy, financial efficiency and high-quality economic development of China. Ent. Econ. 41 (1), 5–16+2. doi:10.13529/j.cnki.enterprise.economy.2022.01.001
Shi, D., and Zhang, J. L. (2003). Impact of industrial structure change on energy consumption. Econ. Theory Bus. Manag. 8, 30–32. doi:10.3969/j.issn.1000-596X.2003.08.006
Takase, K., and Murota, Y. (2004). The impact of IT investment on energy: Japan and US comparison in 2010. Energy Policy 32 (11), 1291–1301. doi:10.1016/s0301-4215(03)00097-1
Tang, H. T., Chen, X. R., and Zhang, J. Y. (2021). Digital economy, circulation efficiency and industrial structure upgrading. J. Busi. Econ. 11, 5–20. doi:10.14134/j.cnki.cn33-1336/f.2021.11.001
Wang, L., and Zhu, T. (2021). Does the digital economy increase energy consumption? —based on the analysis of ICT application research literature. Urban Environ. Stud. 3, 93–108. https://www.doc88.com/p-91899865757045.html.
Wang, X., and Qi, Y. (2013). Analysis of the impact of economic structure change on China’s energy consumption. China Pop., Res. Environ. 23 (1), 49–54. doi:10.1016/j.egypro.2011.03.405
Wing, I. S. (2008). Explaining the declining energy intensity of the U.S. Economy. Resour. Energy Econ. 30 (1), 21–49. doi:10.1016/j.reseneeco.2007.03.001
Zhang, C. L., Li, J. F., Zhang, A. L., and Zhang, Y. X. (2013). Factor decomposition of China’s energy intensity change from 1997 to 2007. J. Tsinghua Uni. 5, 688–693. doi:10.16511/j.cnki.qhdxxb.2013.05.015
Zhang, R., Ding, R. J., and Yin, L. L. (2007). Influence of China's industrial structure change on energy intensity. Stat. Deci. 10, 73–74. doi:10.3969/j.issn.1002-6487.2007.10.026
Keywords: digital economy, industrial structure distortion, energy intensity, spatial effect, environmental regulation
Citation: Guo Q, Ding C, Wu Z, Guo B, Xue Y and Li D (2022) The impact of digital economy and industrial structure distortion on Xinjiang’s energy intensity under the goal of “double carbon”. Front. Environ. Sci. 10:1036740. doi: 10.3389/fenvs.2022.1036740
Received: 05 September 2022; Accepted: 29 September 2022;
Published: 20 October 2022.
Edited by:
Irfan Ullah, Nanjing University of Information Science and Technology, ChinaReviewed by:
Muhammad Haroon Shah, Wuxi University, ChinaCopyright © 2022 Guo, Ding, Wu, Guo, Xue and Li. This is an open-access article distributed under the terms of the Creative Commons Attribution License (CC BY). The use, distribution or reproduction in other forums is permitted, provided the original author(s) and the copyright owner(s) are credited and that the original publication in this journal is cited, in accordance with accepted academic practice. No use, distribution or reproduction is permitted which does not comply with these terms.
*Correspondence: Cuicui Ding, eGlodWF4aWFuQDEyNi5jb20=
Disclaimer: All claims expressed in this article are solely those of the authors and do not necessarily represent those of their affiliated organizations, or those of the publisher, the editors and the reviewers. Any product that may be evaluated in this article or claim that may be made by its manufacturer is not guaranteed or endorsed by the publisher.
Research integrity at Frontiers
Learn more about the work of our research integrity team to safeguard the quality of each article we publish.