 Yang Yang
 Wenbin Sun
 Meng Zou
 Shaobo Qiao
 Qingxiang Li
94% of researchers rate our articles as excellent or good
Learn more about the work of our research integrity team to safeguard the quality of each article we publish.
Find out more
ORIGINAL RESEARCH article
Front. Environ. Sci., 11 October 2022
Sec. Atmosphere and Climate
Volume 10 - 2022 | https://doi.org/10.3389/fenvs.2022.1036006
This article is part of the Research TopicImpact of Climate Change on the Human Living EnvironmentView all 24 articles
The increased climate change is having a huge impact on the world, with the climatic change sensitive and vulnerable regions at significant risk particularly. Effective understanding and integration of climate information are essential. It helps to reduce the risks associated with adverse weather conditions and to better adapt to the impacts of climate variability and change. Using the hindcast data from Japan Meteorological Agency/Meteorological Research Institute (JMA/MRI) coupled prediction system version 2 (JMA/MRI-CPS2), National Centers for Environmental Prediction (NCEP) Climate Forecast System model version 2 (CFSv2), and Canadian Centre for Climate Modeling and Analysis (CCCma) Coupled Climate Model, versions 3 (CanCM3) seasonal prediction model systems, the performance of seasonal prediction for global surface temperature in boreal summer and winter is comprehensively evaluated and compared for 1982–2011 from the perspective of deterministic and probabilistic forecast skills in this study, and a partial regression correction (PRC) method is introduced to correct seasonal predictions. The results show high prediction skills in the tropics, particularly in the equatorial Pacific, while poor skills on land. In general, JMA/MRI-CPS2 has slightly better prediction performance than CFSv2 and CanCM3 in the tropics. CFSv2 is generally superior to JMA/MRI-CPS2 and CanCM3 in the extratropical northern hemisphere and East Asia, especially for the abnormal low winter temperature prediction in East Asia. CanCM3 shows good deterministic forecast skills in extra-tropics but performs slightly worse in probabilistic forecasting. Based on the respective strengths of each seasonal prediction model, an ensemble forecast correction with observational constraint is implemented by partial regression, and the improvement of skills in ensemble predicting has been analyzed. Compared to the simple multi-model ensemble (MME), the correction improved the global-average temporal correlation coefficient and multi-year mean anomaly correlation coefficient by about 0.1 and 0.13, respectively. The validation tests indicate that the corrected ensemble forecast has higher ranked probability skill scores than that of the MME, which is improved by more than 0.06 in the tropics. Meanwhile, when the training period is sufficiently long, it may have the potential for future seasonal temperature predictions from the perspective of stable zonal partial regression coefficients.
Surface temperature is one of the most important variables of climate change, which can directly affect climate, ecosystems, food security, and human health (IPCC, 2013; Ye et al., 2013). The studies show that the strengthening of the zonal gradient of tropical sea surface temperature (SST) or temperature gradient between Eurasia and the tropical ocean has led to significant changes in the Asian monsoon system and regional precipitation in different time scales (D'Arrigo et al., 2006; Sheng et al., 2021; Yun et al., 2014). In addition, increased temperature is also the main cause of the increase of evaporation trend (Helfer et al., 2012; Mahyavanshi et al., 2021), which would affect the global hydrological cycle and energy balance through thermal forcing (Caloiero, 2017). Therefore, accurate temperature prediction can help to provide effective predictions of atmospheric circulation, runoff, evaporation and energy changes. This can also make a positive contribution to hydrological risk assessment, planning, and prevention of meteorological disasters (Mishra et al., 2019; Shukla et al., 2019; Hu et al., 2022), and provide reliable climate information for corresponding climate decision-making and services to further improve the adaptability to climate change.
With the background of global warming, the anomalous change of climate is occurring frequently and has caused great losses to the society and economy. The numerical models have gradually become an important means of weather and climate prediction (Palmer et al., 2004; Raftery et al., 2005; Kumar et al., 2012; IPCC, 2013). Seasonal prediction model systems have been developed as useful tools for short-term climate prediction research. However, the predictability of the model is still limited by such factors as the systematic error of the models, the imperfection of the physical parameterization scheme, and the uncertainty of the initial conditions (Charney et al., 1950; Lorenz, 1963, 1965; Leith, 1974; Mu et al., 2010; Kalnay, 2019). Therefore, various methods have been proposed to reduce model prediction errors or improve prediction skills. On the one side, adding assimilation data or model coupling, increasing model resolution, and advancing physical parameterization are used to improve the capability of the model prediction (Barkmeijer et al., 1999; Qiu et al., 2007; Deshpande et al., 2010; Kirtman et al., 2012; Rubin et al., 2017; Meehl et al., 2019). On the other side, the prediction accuracy can also be improved by providing multiple ensemble members with different initial perturbations or initial times (Toth and Kalnay, 1997; Fritsch et al., 2000; Gneiting and Raftery, 2005; Kalnay, 2019). Therefore, multi-model ensemble (MME) methods are widely used to reduce prediction error, and numerous studies have shown that the MME is more reliable than the individual model, and the prediction skills are significantly improved (Fritsch et al., 2000; Goerss, 2000; Peng et al., 2002; Palmer et al., 2004; Raftery et al., 2005; Wang et al., 2008; Lee et al., 2010; Kumar et al., 2012; Yang et al., 2016).
Several methods are currently available for MME. One is linear, such as the simple composite method with equal weight (SCM), linear regression, and multiple linear regression with different weights (Fraedrich and Smith, 1989; Krishnamurti et al., 1999; Fritsch et al., 2000; Yun et al., 2003; Palmer et al., 2004; Doblas-Reyes et al., 2005; Min et al., 2014). Prediction skills can also be achieved by choosing the relatively good models in MME and then performing calculations with these better models. Lee et al. (2011) proposed the concept of “climate filter”, which graded the individual model based on the reproduction of the strong association between Walker circulation and the tropical Pacific rainfall; Devineni and Sankarasubramanian (2010) classified and detected the performance of multi-model predictions based on the accuracy of the forecasted Nino3.4 index, which is a strategy for adjusting the model weight according to the predictability of important climate predictors. Moreover, the MME can be improved using dynamic statistical downscaling methods (Shukla and Lettenmaier, 2013; Kang et al., 2014; Tang et al., 2016), like the stepwise pattern projection method (Kug et al., 2008; Min et al., 2014), and the synthetic superensemble method combining multiple regression and empirical orthogonal function method (Yun et al., 2005). These methods are intended to promote the usage of models with better dynamic diagnostic performance rather than a composite of all available models. Post-processing of MME based on probability distributions to calibrate ensemble predictions is also available (Raftery et al., 2005; Tebaldi et al., 2005; Greene et al., 2006; Sloughter et al., 2007; Liu and Xie, 2014; Scheuerer, 2014; Khajehei et al., 2018; Li et al., 2021). In addition, non-linear methods have been introduced into model ensembles due to the non-linear characteristics of the climate system and physical processes. For example, Ahn and Lee (2016) applied the genetic algorithm to the multi-model ensemble method to effectively improve the forecasting skills of winter temperature and precipitation in high latitudes, and reduce errors in model members and ensemble results; and Kumar et al. (2012) used neural networks for multi-model ensemble predictions of Indian monsoon seasonal rainfall.
Generally, the prediction skills of MME are enhanced by offsetting the systematic deviation of each climate model (Yang et al., 2016), but this improvement comes at the cost of overestimating the fractional variance of the main mode (Wang et al., 2008). Some studies have pointed out that MME methods still have some shortcomings: for example, SCM is only available when all individual models are similar and reasonable (Ahn and Lee, 2016); the multiple regression method may lack robustness to obtain stable weighted estimates when the time series are short (Peng et al., 2002; Doblas-Reyes et al., 2005), and it fails to address the problem of collinearity among multiple variables. However, the partial least squares regression (PLSR) method could solve the above problems more effectively (Li, 2020; Hu et al., 2021; Qian et al., 2021). Consequently, based on a systematic assessment of seasonal temperature predictions from different model systems, this study uses the PLSR as a correction method with observational constraints to correct model hindcast results and improve seasonal predictabilities. The paper is organized as follows: Section 2 introduces model hindcast data and the reanalysis data used for verification, evaluation metrics, and the PLSR method. Section 3 describes the systematic evaluation of the 1-month lead forecast for JMA/MRI-CPS2, CFSv2, and CanCM3, and the comparison of deterministic forecast performance for the SCM (namely MME) and the ensemble corrected with the partial regression (PRC) method. In addition, the validation tests of the PRC method for the probabilistic forecast, and the predictability potential of the PLSR equation are involved in this section. Finally, Section 4 provides a discussion and summary.
JMA/MRI-CPS2 is an atmosphere-land-ocean-sea ice coupled prediction system version 2 developed by the Japan Meteorological Agency/Meteorological Research Institute (JMA/MRI). It consists of the JMA Global Spectral Model with the horizontal resolution TL159, and the oceanic component MRI community ocean model version 3 at the horizontal resolution of 1° in the longitudinal direction and 0.3°–0.5° in the meridional direction. JMA/MRI-CPS2 is initialed every month, with an integration period of 11 months, and covers the period from January 1979 to June 2015. 10 members are carried out every initial month, comprising two groups of five members starting from two initial dates (15 days apart). The five sets of initial conditions on each initial date include two perturbations in the tropics, and two perturbations in the northern extratropics (Takaya et al., 2017; Takaya et al., 2018).
CFSv2 is the National Centers for Environmental Prediction’s (NCEP’s) Climate Forecast System, version 2, a fully coupled atmosphere-ocean-sea ice-land model for seasonal prediction. CFSv2 uses the atmospheric model NCEP’s Global Forecast System at T126 in the horizontal, the Modular Ocean Model version 4 coupled with an interactive three-layer sea ice model, and the four-level Noah land surface model. CFSv2’s seasonal prediction is out to 9 months, with initial conditions of the 0000, 0600, 1,200, and 1800 UTC cycles for every fifth day, over the retrospective forecast period 1982–2010 and the operational forecast 2010–2018. There is an ensemble size of 24 forecasts for each month with different initial conditions, except November, which has 28 forecasts (Saha et al., 2014).
CanCM3 is the Canadian Centre for Climate Modeling and Analysis (CCCma) Coupled Climate Model, version 3, which combines version 4 to form the Canadian Seasonal to Interannual Prediction System (CanSIPS). In CanCM3, the atmospheric component is CCCma’s third-generation atmospheric general circulation model CanAM3 (T63/L31), and the ocean component is CanOM4. It includes 10 ensemble members of different forecast initial conditions and is initialed at 0000 UTC on the first of every month over the period 1981–2011, with an integration period of 12 months (Merryfield et al., 2013).
The monthly mean surface air temperature reanalysis data used for verification is from the fifth generation European Centre for Medium-Range Weather Forecasts (ECMWF) atmospheric reanalysis of the global climate (ERA5), with a resolution of 0.5° latitude ×0.5° longitude, and back extension from 1950 to 1978 (preliminary version) and from 1979 onwards (hereafter referred to as observation). ERA5 uses ECMWF Integrated Forecasting System Cy41r2, which is significantly improved (temporal, horizontal, and vertical) compared with Cy31r2 used by its predecessor ERA-Interim. And it improves the data assimilation system, now it is based on a hybrid increment 4D-Var system, which can provide the background-error estimates through one control and nine perturbed members, and can provide more output variables (Hersbach et al., 2020; Bell et al., 2021). The comparison shows that ERA5 better characterizes global surface temperature change than other reanalysis data since 1958 (Yang et al., 2022). Although different reanalysis data may have some uncertainties for prediction skills in model evaluation, this dependence is small in terms of the multi-year mean correlation coefficient of global temperature (Kim et al., 2012).
In this study, the model assessment period is 1982–2011. For each model, the ensemble means of all the members equally weighted for each month is employed. The analysis focuses on seasonal predictions for the boreal summer (JJA, June-July-August) and winter (DJF, December-January-February). For the JJA (DJF) mean, the 0-month lead forecast is the forecast initialized in June (December), and the predictions of 1-month lead time are mainly evaluated in this study. For comparison, all the model hindcast results and the observation are re-interpolated to the same 2.5 ° × 2.5 ° grid using the bilinear interpolation method. This paper focuses primarily on global assessment, considering the distribution characteristics of the model prediction skills and some operational focus areas, and also evaluates the performance of some regions, such as East Asia, the different regional ranges are shown in Table 1.
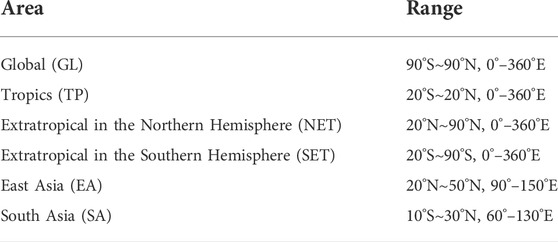
TABLE 1. The evaluation area range and abbreviation.
In this study, the skill of model seasonal predictions is evaluated by widely used deterministic (Temporal Correlation Coefficient, TCC; Anomaly Correlation Coefficient, ACC) and probabilistic (Ranking Probabilistic Skill Score, RPSS; Brier Skill Score, BSS) metrics.
TCC describes the prediction capability of the model at each grid point and obtains the spatial distribution of prediction skill. Firstly, the variance and covariance of each grid point are calculated, which are defined as follows:
where
ACC measures the spatial similarity between prediction and observation, and requires the time average and anomaly for each grid point, as defined below:
where
RPSS and BSS are widely used to assess probabilistic forecasts skills (Goddard et al., 2003; Kusunoki and Kobayashi, 2003; Wilks, 2007; Shukla and Lettenmaier, 2013; Yang et al., 2016). The RPSS is used to evaluate ensemble forecasts for multiple categories of events (Weigel et al., 2007; Wilks, 2007). In general, threshold values are estimated based on the theoretical probability distributions of temperature, both for model hindcasts and observation, events above or below the thresholds are categorized to the upper or lower tercile categories, respectively, and correspondingly regarded as above normal (AN), near normal (NN) and below normal (BN) event. Therefore, the forecast probabilities for different categories can be constructed based on the proportion of ensemble members that fall into the given category, and the observed probability of a certain event is either 0 or 1. In addition, using climatological forecasts as reference forecasts and calculating cumulative probabilities of climate is 0.33, 0.67 and 1, respectively, the same as (Goddard et al., 2003). The PRSS of 0 indicates no skill when compared to the reference forecast, and the PRSS of 1 is considered a “perfect forecast”. It measures the improvement of a multi-category probabilistic forecast relative to a reference forecast (usually a long-term or sample climate), and it is defined as:
where
While the RPSS reflects the overall probabilistic forecast performance of the different model predictions, the BSS is simpler and more effective for the respective forecasting skills for a particular event (e.g. cold and warm anomalies). The BSS is a special case of an RPSS with two categories (Weigel et al., 2007; Wilks, 2007), and it is used to assess the accuracy of probability forecasts for dichotomous events, that is, for the two categories of probability with
The partial least squares regression (PLSR) method is developed to build the linear regression model of multiple dependent variables to one or several independent variables. Rather than directly considering the relationship between the independent and dependent variables, it extracts the components of the variables that are more explanatory for the system and uses these component variables for modeling (Wold et al., 2001). First, standardizing the independent and dependent variables, and then extracting the pairs of principal components that could carry as much variability information as possible of the variables and have the greatest correlation from the standardized matrix. Second, the regression model is established to calculate the regression coefficient matrix and the residual matrix between the principal component of the independent variable and the independent or dependent variable. Finally, judging whether the residual meets the accuracy requirements. If not, use the residual matrix to replace the original data matrix, and repeat the above steps until the residual meets the accuracy requirements. The model is formulated as follows:
where
Since
In this study, the PLSR is applied to a multi-model ensemble correction. Using hindcast data derived from different seasonal prediction models as independent variables and corresponding observation as the dependent variable to build the PLSR equation at all grid points. Leave-one-out cross-validation is used within all training periods. The advantages of the PLSR method are that it takes the widespread multi-correlation (collinearity) between the individual model forecasts into account and allows the time length less than the number of models, thus creating a more robust regression equation. In addition, because the regression equation takes observation as the dependent variable, the PLSR could be regarded as observational constraints on the multimodel ensemble to improve the deterministic and probabilistic skills of the ensemble prediction.
Figure 1 shows TCC spatial distributions for the JJA and DJF temperature prediction from JMA/MRI-CPS2, CFSv2 and CanCM3. As shown, tropical marine areas possess a high skill level both in summer and winter, particularly in the central and eastern equatorial Pacific with the TCC greater than 0.70. High deterministic skill in the extratropical Northern Hemisphere (NET) is extend from the tropical marine continent to the northeast and southeast Pacific. Compared with the skills on the sea, the prediction skill over the land is generally lower. However, there are some regions such as most of South America, Africa, and parts of Australia, Southeast Asia, and North America, where the TCC skill appears moderately good. A similar spatial distribution is also described in some previous studies (Wang et al., 2009; Kim et al., 2012; Materia et al., 2014). It indicates that tropical SST anomalies are the most important source of climate predictability on the seasonal-interannual scale, most of the skillful predictions over the above regions are from the influence of ENSO through teleconnection and local air-sea interaction (Wang et al., 2009; Yang et al., 2016). In JJA, the prediction skills over Eurasia are quite limited, all models only show skillful prediction in Southeast Asia, but most other regions show statistically insignificant skills. During the DJF, CFSv2 and CanCM3 show significant correlations in reaching above 0.30 in central and northern Eurasia, respectively. The global averaged TCC prediction skills of the three models are generally comparable in summer and winter, the variation range is 0.44–0.50 and 0.47–0.52, respectively, with the CFSv2 having a slightly lower skill in JJA (0.44), primarily influenced by the lower skill in the tropics (Figure 1B).
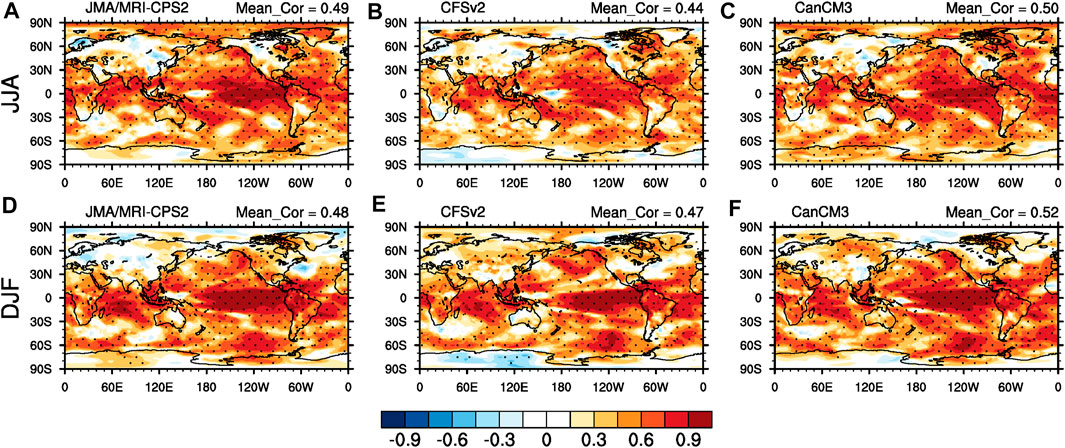
FIGURE 1. Spatial distributions of Temporal Correlation Coefficient (TCC) for JMA/MRI-CPS2 (A,D), CFSv2 (B,E) and CanCM3 (C,F) of temperature in JJA (A–C) and DJF (D–F) season for the period 1982–2011. The global-averaged scores are also displayed in the upper right corner of the plot. The dotted areas indicate statistical significance at the 95% level using the Student’s t-test.
A visual comparison of the deterministic skill TCC between the 3 models in different regions for JJA and DJF is displayed in Figure 2. In general, the prediction skills of the three models are more than 0.6 in the tropics, which is larger than that in the extratropical. The skills in the extratropical Southern Hemisphere (SET) are slightly higher than those in NET because most of the regions of SET are marine areas. The prediction skills in South Asia are also high, reaching more than 0.52. The prediction skills in East Asia are low. Except for the winter prediction skills of CFSv2 (0.36), the rest are within 0.30. In terms of different models, JMA/MRI-CPS2 is slightly better than CFSv2 and CanCM3 models in tropics and South Asia; the TCC prediction skill of CFSv2 in East Asia is slightly higher than that of the other two models, especially the TCC is about 0.10 larger than the other two models in DJF; CanCM3 has the best forecasting skills over the extratropical.
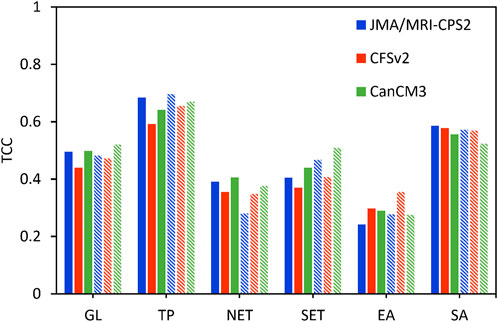
FIGURE 2. The area-averaged TCC in different regions for JMA/MRI-CPS2, CFSv2 and CanCM3 of temperature in JJA (solid) and DJF (shaded) season for the period 1982–2011.
Figure 3 exhibits the probabilistic skill RPSS of the three models. As seen, probabilistic skills are relatively smaller than TCC. The spatial patterns of the RPSS are characterized by a high skill in the tropical oceans, especially in the central and eastern equatorial Pacific where the RPSS forecast skill can even reach above 0.40 in DJF, while the extratropical marine skill is within 0.20. Nonetheless, features of the probabilistic skill are still possible to find that extend from the tropical Pacific to the central and northern Pacific. In addition to CanCM3 in DJF, probability skills are also shown in the North Atlantic. Instead, the RPSS is much smaller over land, some regions present meaningless negative values. In JJA, JMA/MRI-CPS2 exhibits some skills in central and northern Africa, southern Europe, Southeast Asia, the eastern coast of North America and Greenland; in addition to the above regions, CFSv2 also achieves RPSS skill of 0.10 or more in parts of northern East Asia, South America and Australia; while CanCM3 performs slightly worse in probabilistic forecasts over land, and has small positive skills in central Africa and Greenland. During the winter JMA/MRI-CPS2 exhibits skillful RPSS in most of Africa and South America; besides these areas, the probabilistic skills of CFSv2 in the Arabian Peninsula, the Mongolian Plateau, Greenland and parts of China are about 0.10; while the distribution of CanCM3 skill areas on land remains poor.
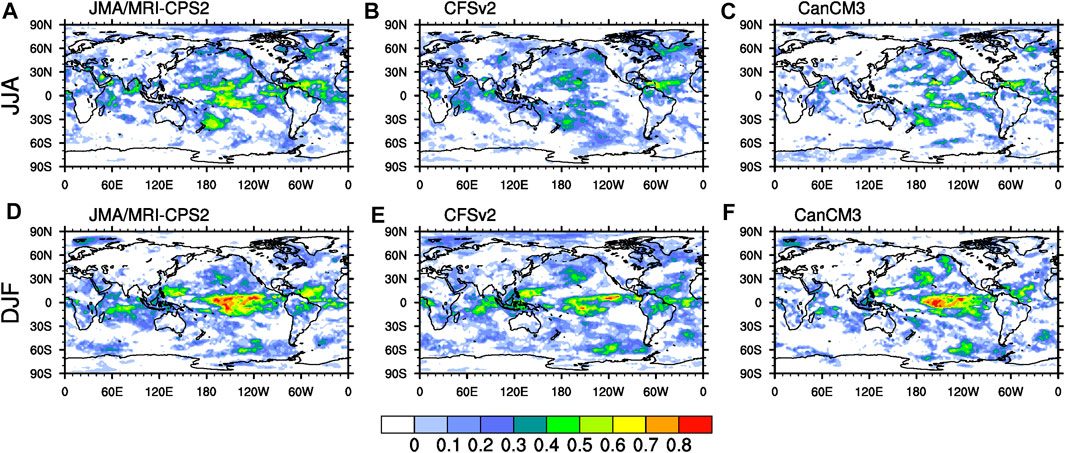
FIGURE 3. Spatial distributions of Ranked Probability Skill Scores (RPSS) for JMA/MRI-CPS2 (A,D), CFSv2 (B,E) and CanCM3 (C,F) of temperature in JJA (A–C) and DJF (D–F) season for the period 1982–2011.
As mentioned above, when the RPSS is larger than 0, it indicates an improvement in prediction skills relative to the climate probability. Therefore, the percentages of grid points with RPSS greater than 0 out of the global field for the three models are also calculated. Figure 4 displays regional averaged RPSS skills and the annual variation of its global average. The annual variations of global averaged RPSS during JJA and DJF seasons show higher skills in strong El Niño years than normal years, such as 1997/2009 (Figures 4A,B). Although there are still negative skills in some years, which may remain skillful predictions in specific regions such as the tropical region. The RPSS skill of JMA/MRI-CPS2 performs above 0.1 in the tropics, which is considerably higher than the other two models. CFSv2 has the highest skill of the three models in the extratropical, East Asia, and South Asia (in DJF), although sometimes with negative skill. It shows that CFSv2 is slightly better than JMA/MRI-CPS2 and CanCM3 in probability prediction except in the tropics. The RPSS skill for different regions of CanCM3 is positive only in the tropics during DJF, indicating that due to the low probability prediction skills of tropical CanCM3 performs slightly worse for probabilistic prediction in global and regional temperature (Figures 4E,F).
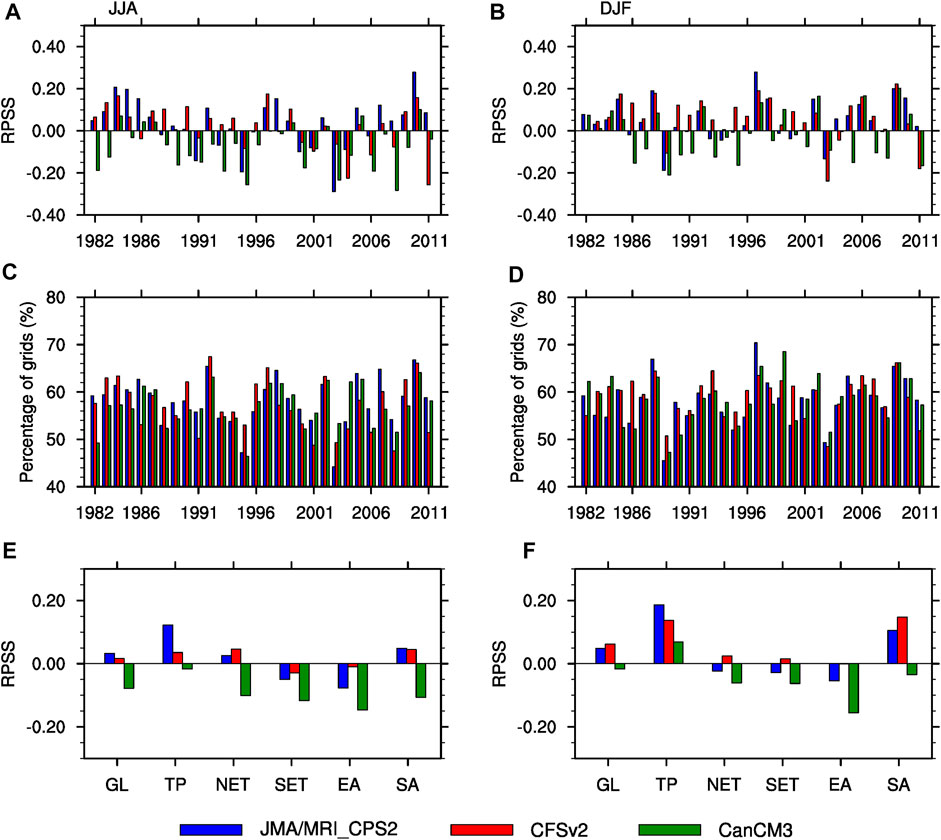
FIGURE 4. Time series of the global-averaged RPSS (A,B); and the percentage of grid cells where the RPSS is >0 out of the global grid cells (C,D); the area-averaged RPSS in different regions (E,F) for JMA/MRI-CPS2, CFSv2 and CanCM3 of temperature in JJA (left panel) and DJF (right panel) season for the period 1982–2011.
In terms of the fraction of area where the prediction is skillful (Figures 4C,D), the percentages of grids in the globe where RPSS is greater than 0 are generally above 50% in the three models. The multi-year mean of this fraction is about 58% in JJA and DJF for JMA/MRI-CPS2, comparable to CFSv2 (57% and 59%) and CanCM3 (57% and 58%). However, the percentages of the year when the largest fraction is detected from different models during individual years, reach 40% for JMA/MRI-CPS2 and CFSv2 in JJA, and correspondingly reach 30% and 43% in DJF, respectively. The multi-year mean of global averaged RPSS for JMA/MRI-CPS2 and CFSv2 respectively are 0.03 and 0.02 in JJA, 0.05 and 0.06 in DJF, while the values for CanCM3 are less than 0 in both seasons. It also shows that the probabilistic forecasting of JMA/MRI-CPS2 and CFSv2 is slightly better than that of CanCM3.
While RPSS reflects prediction skills for the probability of multiple category events, BSS can further reflect improved skills for a specific event relative to climate probability. As with the classifications of abnormal events for RPSS, BSS skills are examined for the AN, BN, and NN events. As shown in Figure 5, the regions with high prediction skills for the AN event are also mainly distributed in the tropical ocean in JJA and DJF, and also show some prediction skills in the North Atlantic for JJA. On land, the BSS of JMA/MRI-CPS2 in northern Africa, southern Europe, the Arabian Peninsula, Southeast Asia, and southern North America are 0.20–0.40 in summer; CFSv2 has skills with a varied range of 0.20–0.40 in Europe, most parts of Siberia and northern Africa, and about 0.20 in part regions of North America and South America; CanCM3 still performs low skills on land. In winter, the prediction skills of the three models are high in northern South America, which can reach more than 0.40, and all models show some skills in southern Africa. In general, the spatial patterns of BSS for the BN event are largely similar to that for normal events, but the prediction skills in tropical areas are increased (Supplementary Figure S1). The prediction skills of the model for AN and BN events are higher than those for the NN event, the mean BSS over the different regions of the normal event are both below 0 (Figure 6). The BSS for abnormal events of JMA/MRI-CPS2 in the tropics can reach 0.20 in DJF, but the corresponding skills of CanCM3 are only 0.10 or less, which is significantly lower than the other two models, and the skills in other regions are mainly negative. It is worth noting whether it is for the prediction of AN and BN events, CFSv2 shows higher skills in NET and East Asia than those of the other two models. It shows that CFSv2 has certain advantages in probabilistic prediction in NET and East Asia, especially for the below-normal in East Asia in DJF, that is, CFSv2 has a good ability to predict abnormal low temperatures in winter.
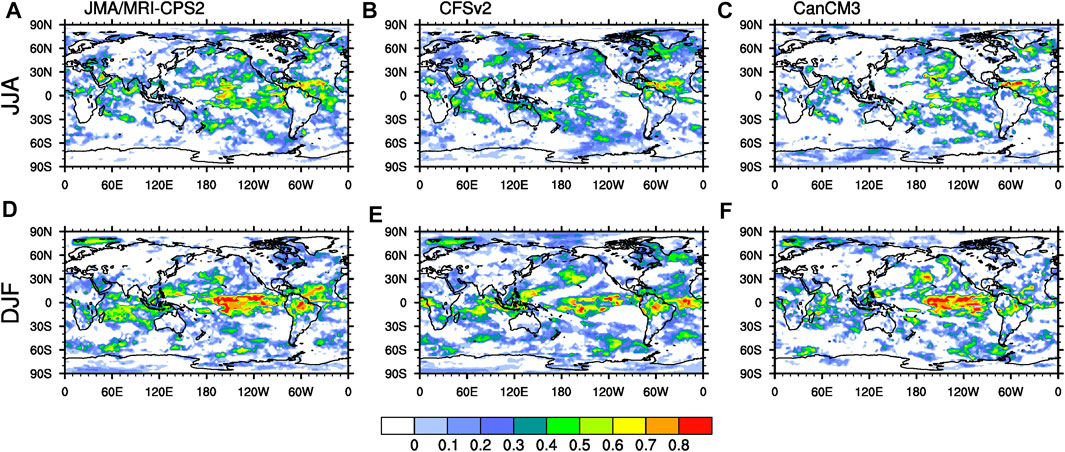
FIGURE 5. Spatial distributions of Brier Skill Scores (BSS) for the above normal (AN) event for JMA/MRI-CPS2 (A,D), CFSv2 (B,E) and CanCM3 (C,F) of temperature in JJA (A–C) and DJF (D–F) season for the period 1982–2011.
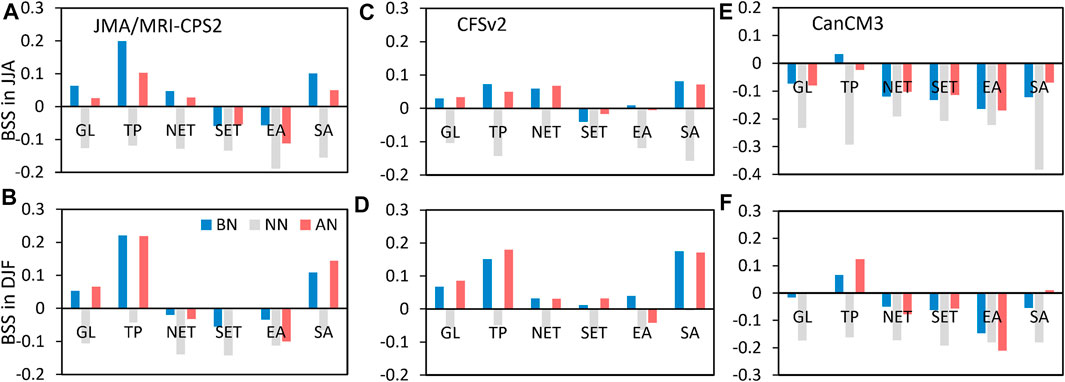
FIGURE 6. The area-averaged BSS in different regions for the above normal (AN), near normal (NN) and below normal (BN) event for JMA/MRI-CPS2 (A,B), CFSv2 (C,D) and CanCM3 (E,F) of temperature in JJA (upper panel) and DJF (below panel) season for the period 1982–2011.
According to the previous analysis, JMA/MRI-CPS2, CFSv2 and CanCM3 have their own advantages in deterministic and probabilistic predictions. If the prediction result of the ensemble means is corrected, is there any significant improvement in ensemble forecasting skills? Therefore, taking the ensemble mean of multi members of three models as the independent variables, the PRC method is used for the ensemble correction, and the deterministic metrics TCC and ACC are also used to test the correction results. As can be seen from Figures 7B,D, the TCC after PRC ensemble correction is improved, and the global averaged TCC is increased by at least 0.09 in JJA and DJF, compared with the results of the individual model (Figure 1). Relative to the MME (SCM), the TCC is also improved, such as in the equatorial east-central Pacific and parts of North America in summer, and in northern East Asia, central North America and Australia in winter. Furthermore, it is notable that the corrected results of the PRC ensemble are facilitated to capture the prediction advantages of individual models. For example, TCC skill presents to be significant in parts of northern Asia for CFSv2 and CanCM3 during DJF, whereas it is small and insignificant by the MME, but increases after the PRC ensemble and turns to significant. The same is true for North America, with significant TCC skills only for JMA/MRI-CPS2 in DJF. TCC remains insignificant in southern North America after the MME, but changes to be statistically significant across North America after the PRC method. Possibly due to the methodological advantages of the PLSR of combining principal components analysis and linear regression.
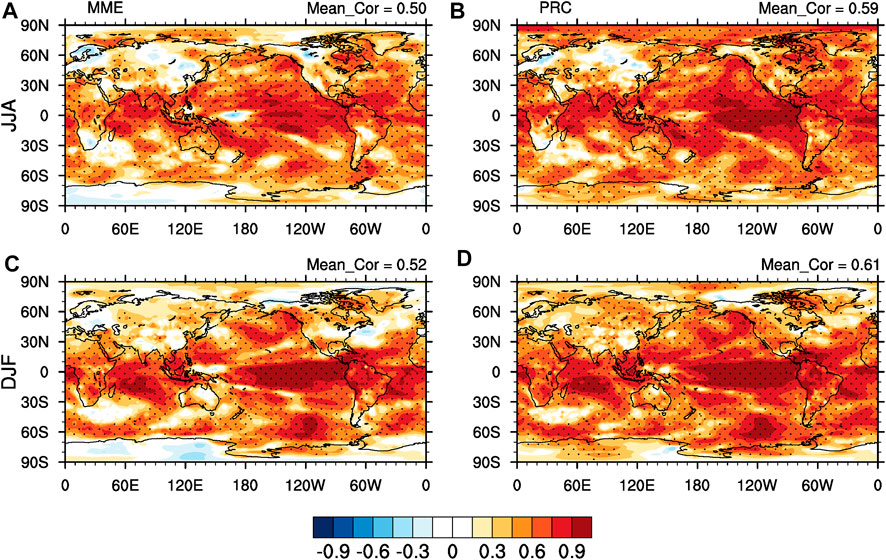
FIGURE 7. Spatial distributions of TCC for simple averaged multi-model ensemble (MME) (A,C) and the ensemble corrected with partial regression (PRC) (B,D) of temperature in JJA (upper panel) and DJF (below panel) season for the period 1982–2011. The global-averaged scores are also displayed in the upper right corner of the plot. The dotted areas indicate statistical significance at the 95% level using the Student’s t-test.
Statistics on the averaged TCC skill for different regions (Figures 8A,B) show that the global averaged TCC markedly increases after the PRC. TCC of the different regions increases by about 0.10 compared to the MME, except for the tropics (TP) and South Asia where the skill increases by about 0.07. Compared with the results of the individual models, TCC after the PRC method is about 0.15 higher than CFSv2 and CanCM3 over the globe, TP, NET and SET, and about 0.18 higher than JMA/MRI-CPS2 and CanCM3 in East Asia in JJA. During DJF, the PRC corrected TCC improved about 0.14 over the global average of the three models, by more than 0.16 over CanCM3 in the SET, and by about 0.17 and 0.26 over JMA/MRI-CPS2 and CanCM3 in East Asia, respectively. As shown in the time series of ACC (Figures 8C,D), the corrected ACC skill is noticeably higher than the MME. Except for a few years, the ACC with the PRC method is also larger than that of the individual model. The corrected multi-year mean ACCs for JJA and DJF are 0.57 and 0.55, respectively, which are about 0.13 higher than the MME and much higher than the mean ACC of the three models (0.30 and 0.29 for JJA and DJF, respectively). It is suggested that the PRC method is not only effective in reducing the mean errors between model temperature and the observation, but also in improving the spatial similarity of the model and the observation.
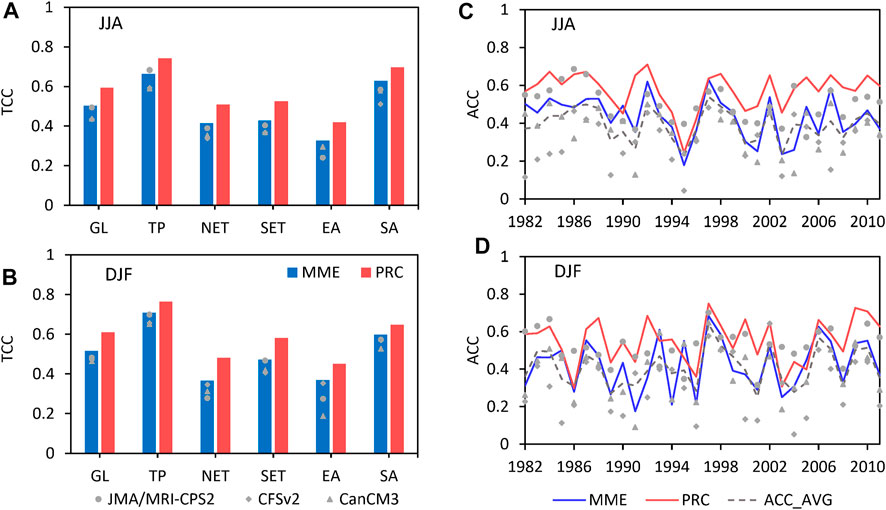
FIGURE 8. The area-averaged TCC (A,B) and time series of anomaly correlation coefficient (ACC) (C,D) for simple averaged multi-model ensemble (MME) and the ensemble with partial regression (PRC) of temperature in JJA (upper panel) and DJF (below panel) season for the period 1982–2011. The dashed line indicates the average ACC of the multi-model, and the gray marks present the ACC of the individual model.
To further explore the improvement of the PRC ensemble method on probabilistic forecasting, multiple PRC ensemble results are constructed for probability calculations. As the three models contain 10 (JMA/MRI-CPS2), 24 (CFSv2), and 10 (CanCM3) members, respectively, if one member from each model is selected as the independent variable for PRC calculation, then it would be generated 2400 PRC ensemble results, which may lead to excessive computation. Both the Taylor diagram (Taylor, 2001; Huang et al., 2022) and the DISO (Hu et al., 2019; Zhou et al., 2021) can be used to assess the performance of different climate models. Here the best 3 members in each model are selected through the Taylor diagram (Supplementary Figure S2) and used to construct multiple PRC ensemble results. For the multi-member ensemble, the probabilistic skill RPSS is calculated directly using these 9 members, while for the PRC ensemble, the RPSS is assessed by obtaining 27 PRC ensemble results from different combinations of these best 3 members in each model. The results show that the RPSS is noticeably improved in the equatorial region after the PRC ensemble compared to the multi-member ensemble, especially in some parts of the equatorial east-central Pacific where the skill can reach 0.80 in DJF. Besides, skilled areas on land have increased significantly, such as parts of North America and Asia, where the RPSS can reach about 0.20 shifting from no skill to skillful (Supplementary Figure S3). From the annual variation in global averaged RPSS (Figures 9A,B), except for a few years, the RPSS skill of PRC ensemble results is distinctly higher than that of the multi-member ensemble, particularly in years with positive skill. The global annual averaged RPSS increases by approximately 0.05 and 0.04 in JJA and DJF, respectively. In different regions, the RPSS skill of the PRC ensemble method is also higher, which is more improved in tropics and South Asia, up to more than 0.06, and about 0.05 in NET, but not much improved in SET and East Asia (about 0.01 and 0 respectively) (Figures 9C,D).
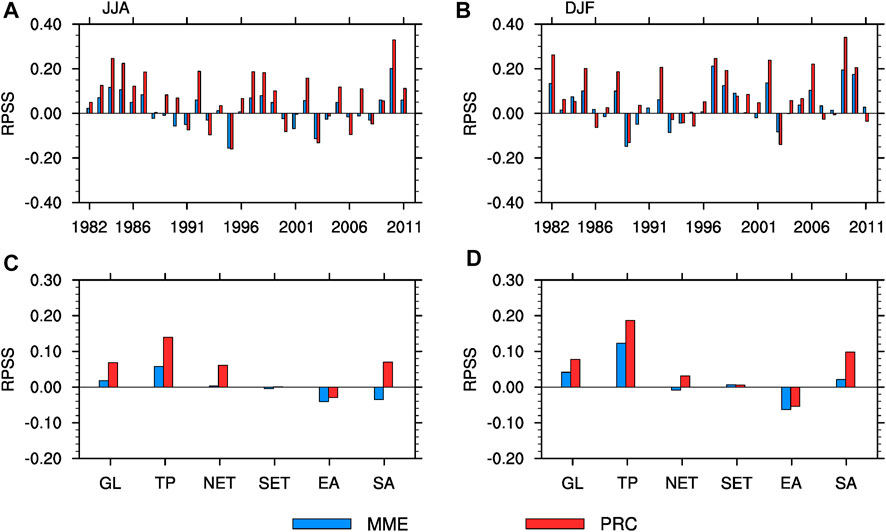
FIGURE 9. Time series of the global-averaged RPSS (A,B) and the area-averaged RPSS in different regions (C,D) for simple averaged multi-model ensemble (MME) and the ensemble with partial regression (PRC) of temperature in JJA (left panel) and DJF (right panel) season for the period 1982–2011.
In the PLSR equation, the dependent variable is the actual observation. Therefore, the partial regression equation is theoretically an observation constraint correction to the model predictions based on observations that are known. To examine the robustness of the PLSR model, 10-, 15- and 20-year training periods are selected as sliding windows for calculation, and the PLSR coefficients are statistically analyzed. Taking the results of the different training periods in JJA as an example, it can be seen that the zonal mean of regression coefficients from each seasonal prediction model varies little with the growing training period, whereas the variance of coefficients decreases significantly at the same latitude (Figure 10). It implies that the zonal mean of regression coefficients from the PLSR model remains broadly stable across latitudes regardless of the length of the training period, and its dispersion decreases significantly as the training period increases. Moreover, the variation range (variance) of the coefficients is smallest at low latitudes, but increases with latitude in the southern hemisphere and even reaches above 1.0 at the 10-year training, while increases first and then decreases with latitude in the northern hemisphere. It may be related to the slightly low predictability over land at high latitudes in the southern hemisphere and mid-latitudes in the northern hemisphere. However, for all models, the variance variation tends to be gentler as the training period increases (with the variance of the coefficients remaining within 0.20 at the 20-year training period). The regression coefficients vary similarly in DJF (Supplementary Figure S4). It suggests that for both JJA and DJF, the variation in the regression coefficients from the PLSR equation at each latitude becomes smaller and smaller as the training period increases, implying that the observation in the year of the forecast (which is usually not known at the time of building the partial regression model) becomes less and less important in the partial regression equation. Thus, by choosing the appropriate length of the training period (sufficiently long), the partial regression model would have increasingly smaller biases at different latitudes and have forecasting potential for seasonal temperature predictions.
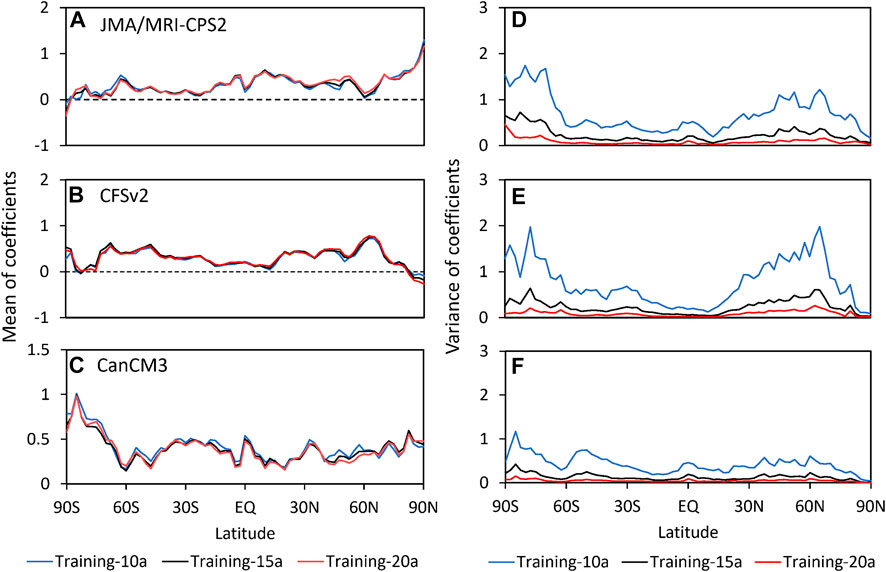
FIGURE 10. The zonal mean of regression coefficients of JMA/MRI-CPS2 (A,D), CFSv2 (B,E) and CanCM3 (C,F) which obtained in the different training periods for the ensemble with partial regression of temperature in JJA season for the period 1982–2011: the multi-year average (left panel) and the variance (right panel) of regression coefficients.
The sub-seasonal, seasonal and interdecadal climate prediction is helpful for decision-makers and relevant producers to understand and identify the short-term or future long-term climate change, evaluate the possible risks caused by climate change, and formulate corresponding guarantee strategies and adaptive services (Acharya et al., 2021). Several studies have evaluated the values of using seasonal climate prediction information in climate decision-making and services, but have also pointed out that the selection of evaluation metrics in seasonal prediction systems and the improvement of seasonal prediction skills and quality still need to be explored and solved (An-Vo et al., 2021; Streefkerk et al., 2022).
In this study, the capacity of three seasonal prediction models (JMA/MRI-CPS2, CFSv2 and CanCM3) and their ensemble mean in forecasting global temperature were comprehensively evaluated with deterministic and probabilistic metrics using hindcast data covering a 30-year period from 1982 to 2011. The global averaged prediction skills for the three models are generally similar, but each also shows its superiority. JMA/MRI-CPS2 presents better prediction skills in the tropics than the other two models. CFSv2 is superior for probabilistic forecasts in the NET and East Asia, especially for abnormal low winter temperatures in East Asia. CanCM3 provides better forecasting skills in the extratropical than JMA/MRI-CPS2 and CFSv2. These results quantified the deterministic skills of the models and provided quantile-based probabilistic skills that help users to compare and choose the valuable model forecasts for the concerned area, as well as extract predictive information for the abnormal events.
Following this, the PLSR method is introduced to correct the ensemble results of the above three models with observational constraints. It is found that the prediction skills after ensemble correction are obviously improved, compared with that of the individual models, and it is also better than that of MME. The PRC ensemble method through observational constraints can reduce the mean errors and enhance the spatial similarity between the observation and model forecasts, and also strengthen the consistency between them for abnormal events. It is worth noting that the PRC is yet only able to correct model prediction under observational constraints for known observations, and it still is a challenge for forecasting seasonal variation of climate in the future.
The ensemble validation test results show that the PLSR coefficients tend to be stable and their dispersion gradually decreases as the training period increases, especially at the middle and high latitudes. It suggests that the PRC ensemble method has certain forecasting potential over a sufficient length of the model training period, and could provide a useful tool for more accurate seasonal prediction. In other words, although the regression model is established based on observation and model hindcast datasets, the validation across different training periods shows that the regression coefficients of the PLSR model exhibited relative stability, which gives some potential to this PRC method for future temperature prediction. Here we mainly focus on the global prediction evaluation, but for specific regions, the PRC method can still improve relevant forecasting skills, give strategic forecasts in a targeted manner, and provide more accurate and effective forecasting services to specific users.
The datasets used during the current study are available from the corresponding author upon reasonable request.
YY: Conceptualization; methodology; software; formal analysis; writing - original draft; writing—review and editing. WS: Data curation. MZ: Data curation; writing—review and editing. SQ: Conceptualization; writing—review and editing. QL: Conceptualization; writing—review and editing.
This work was supported by the National Key R&D Program of China (Grant number 2017YFC1502301, 2018YFC1507705); the National Natural Science Foundation of China (Grant number 41975105).
The authors are thankful to ECMWF, JMA/MRI, NCEP, and CCCma for providing ERA5, JMA/MRI-CPS2, CFSv2 and CanCM3 datasets for this study.
The authors declare that the research was conducted in the absence of any commercial or financial relationships that could be construed as a potential conflict of interest.
All claims expressed in this article are solely those of the authors and do not necessarily represent those of their affiliated organizations, or those of the publisher, the editors and the reviewers. Any product that may be evaluated in this article, or claim that may be made by its manufacturer, is not guaranteed or endorsed by the publisher.
The Supplementary Material for this article can be found online at: https://www.frontiersin.org/articles/10.3389/fenvs.2022.1036006/full#supplementary-material
Acharya, N., Ehsan, M. A., Admasu, A., Teshome, A., and Hall, K. J. C. (2021). On the next generation (NextGen) seasonal prediction system to enhance climate services over Ethiopia. Clim. Serv. 24, 100272. doi:10.1016/j.cliser.2021.100272
Ahn, J. B., and Lee, J. (2016). A new multimodel ensemble method using nonlinear genetic algorithm: An application to boreal winter surface air temperature and precipitation prediction. J. Geophys. Res. Atmos. 121, 9263–9277. doi:10.1002/2016JD025151
An-Vo, D., Radanielson, A. M., Mushtaq, S., Reardon-Smith, K., and Hewitt, C. (2021). A framework for assessing the value of seasonal climate forecasting in key agricultural decisions. Clim. Serv. 22, 100234. doi:10.1016/j.cliser.2021.100234
Barkmeijer, J., Buizza, F., and Palmer, T. N. (1999). 3D-Var Hessian singular vectors and their potential use in the ECMWF Ensemble Prediction System. Q. J. R. Meteorol. Soc. 125, 2333–2351. doi:10.1002/qj.49712555818
Bell, B., Hersbach, H., Simmons, A., Berrisford, P., Dahlgren, P., Horányi, A., et al. (2021). The ERA5 global reanalysis: Preliminary extension to 1950. Q. J. R. Meteorol. Soc. 147, 4186–4227. doi:10.1002/qj.4174
Caloiero, T. (2017). Trend of monthly temperature and daily extreme temperature during 1951–2012 in New Zealand. Theor. Appl. Climatol. 129, 111–127. doi:10.1007/s00704-016-1764-3
Charney, J. G., FjÖrtoft, R., and Neumann, J. V. (1950). Numerical integration of the barotropic vorticity equation. Tellus 2, 237–254. doi:10.3402/tellusa.v2i4.8607
D'Arrigo, R., Wilson, R., and Li, J. (2006). Increased Eurasian-tropical temperature amplitude difference in recent centuries: Implications for the Asian monsoon. Geophys. Res. Lett. 33, L22706. doi:10.1029/2006GL027507
Deshpande, M., Pattnaik, S., and Salvekar, P. S. (2010). Impact of physical parameterization schemes on numerical simulation of super cyclone Gonu. Nat. Hazards 55, 211–231. doi:10.1007/s11069-010-9521-x
Devineni, N., and Sankarasubramanian, A. (2010). Improved categorical winter precipitation forecasts through multimodel combinations of coupled GCMs. Geophys. Res. Lett. 37, L24704. doi:10.1029/2010GL044989
Doblas-Reyes, F. J., Hagedorn, R., and Palmer, T. N. (2005). The rationale behind the success of multi-model ensembles in seasonal forecasting - II. Calibration and combination. Tellus A 57, 234–252. doi:10.1111/j.1600-0870.2005.00104.x
Fraedrich, K., and Smith, N. R. (1989). Combining predictive schemes in long-range forecasting. J. Clim. 2, 291–294. doi:10.1175/1520-0442(1989)002<0291:cpsilr>2.0.co;2
Fritsch, J. M., Hilliker, J., Ross, J., and Vislocky, R. L. (2000). Model consensus. Weather Forecast. 15, 571–582. doi:10.1175/1520-0434(2000)015<0571:MC>2.0.CO;2
Gneiting, T., and Raftery, A. E. (2005). Weather forecasting with ensemble methods. Science 310, 248–249. doi:10.1126/science.1115255
Goddard, L., Barnston, A. G., and Mason, S. J. (2003). Evaluation of the IRI's "net assessment" seasonal climate forecasts 1997-2001. Bull. Am. Meteorol. Soc. 84, 1761–1782. doi:10.1175/BAMS-84-12-1761
Goerss, J. S. (2000). Tropical cyclone track forecasts using an ensemble of dynamical models. Mon. Weather Rev. 128, 1187–1193. doi:10.1175/1520-0493(2000)128<1187:tctfua>2.0.co;2
Greene, A. M., Goddard, L., and Lall, U. (2006). Probabilistic multimodel regional temperature change projections. J. Clim. 19, 4326–4343. doi:10.1175/JCLI3864.1
Helfer, F., Lemckert, C., and Zhang, H. (2012). Impacts of climate change on temperature and evaporation from a large reservoir in Australia. J. Hydrol. X. 475, 365–378. doi:10.1016/j.jhydrol.2012.10.008
Hersbach, H., Bell, B., Berrisford, P., Hirahara, S., Horányi, A., Muñoz-Sabater, J., et al. (2020). The ERA5 global reanalysis. Q. J. R. Meteorol. Soc. 146, 1999–2049. doi:10.1002/qj.3803
Hu, Z., Chen, X., Zhou, Q., Chen, D., and Li, J. (2019). DISO: A rethink of taylor diagram. Int. J. Climatol. 39, 2825–2832. doi:10.1002/joc.5972
Hu, Z., Chen, X., Zhou, Q., Yin, G., and Liu, J. (2022). Dynamical variations of the terrestrial water cycle components and the influences of the climate factors over the Aral Sea Basin through multiple datasets. J. Hydrol. X. 604, 127270. doi:10.1016/j.jhydrol.2021.127270
Hu, Z., Zhang, Z., Sang, Y., Qian, J., Feng, W., Chen, X., et al. (2021). Temporal and spatial variations in the terrestrial water storage across Central Asia based on multiple satellite datasets and global hydrological models. J. Hydrol. X. 596, 126013. doi:10.1016/j.jhydrol.2021.126013
Huang, J., Li, Q., and Song, Z. (2022). Historical global land surface air apparent temperature and its future changes based on CMIP6 projections. Sci. Total Environ. 816, 151656. doi:10.1016/j.scitotenv.2021.151656
Kalnay, E. (2019). Historical perspective: Earlier ensembles and forecasting forecast skill. Q. J. R. Meteorol. Soc. 145, 25–34. doi:10.1002/qj.3595
Kang, S., Hur, J., and Ahn, J. B. (2014). Statistical downscaling methods based on APCC multi-model ensemble for seasonal prediction over South Korea. Int. J. Climatol. 34, 3801–3810. doi:10.1002/joc.3952
Khajehei, S., Ahmadalipour, A., and Moradkhani, H. (2018). An effective post-processing of the North American multi-model ensemble (NMME) precipitation forecasts over the continental US. Clim. Dyn. 51, 457–472. doi:10.1007/s00382-017-3934-0
Kim, H. M., Webster, P. J., and Curry, J. A. (2012). Seasonal prediction skill of ECMWF system 4 and NCEP CFSv2 retrospective forecast for the northern hemisphere winter. Clim. Dyn. 39, 2957–2973. doi:10.1007/s00382-012-1364-6
Kirtman, B. P., Bitz, C., Bryan, F., Collins, W., Dennis, J., Hearn, N., et al. (2012). Impact of ocean model resolution on CCSM climate simulations. Clim. Dyn. 39, 1303–1328. doi:10.1007/s00382-012-1500-3
Krishnamurti, T. N., Kishtawal, C. M., LaRow, T. E., Bachiochi, D. R., Zhang, Z., Eric Williford, C., et al. (1999). Improved weather and seasonal climate forecasts from multimodel superensemble. Science 285, 1548–1550. doi:10.1126/science.285.5433.1548
Kug, J. S., Lee, J. Y., and Kang, I. S. (2008). Systematic error correction of dynamical seasonal prediction of sea surface temperature using a stepwise pattern project method. Mon. Weather Rev. 136, 3501–3512. doi:10.1175/2008MWR2272.1
Kumar, A., Mitra, A. K., Bohra, A. K., Iyengar, G. R., and Durai, V. R. (2012). Multi-model ensemble (MME) prediction of rainfall using neural networks during monsoon season in India. Met. Apps. 19, 161–169. doi:10.1002/met.254
Kusunoki, S., and Kobayashi, C. (2003). Skill evaluation of probabilistic forecasts by the atmospheric seasonal predictability experiments. J. Meteorological Soc. Jpn. 81, 85–112. doi:10.2151/jmsj.81.85
Lee, D. Y., Ashok, K., and Ahn, J. B. (2011). Toward enhancement of prediction skills of multimodel ensemble seasonal prediction: A climate filter concept. J. Geophys. Res. 116, D06116. doi:10.1029/2010JD014610
Lee, J. Y., Wang, B., Kang, I. S., Shukla, J., Kumar, A., Kug, J. S., et al. (2010). How are seasonal prediction skills related to models' performance on mean state and annual cycle? Clim. Dyn. 35, 267–283. doi:10.1007/s00382-010-0857-4
Leith, C. E. (1974). Theoretical skill of Monte Carlo forecasts. Mon. Weather Rev. 102, 409–418. doi:10.1175/1520-0493(1974)102<0409:tsomcf>2.0.co;2
Li, Q. (2020). Statistical modeling experiment of land precipitation variations since the start of the 20th century with external forcing factors. Chin. Sci. Bull. 65, 2266–2278. doi:10.1360/TB-2020-0305
Li, Y., Wu, Z., He, H., Wang, Q. J., Xu, H., and Lu, G. (2021). Post-processing sub-seasonal precipitation forecasts at various spatiotemporal scales across China during boreal summer monsoon. J. Hydrol. X. 598, 125742. doi:10.1016/j.jhydrol.2020.125742
Liu, J., and Xie, Z. (2014). BMA probabilistic quantitative precipitation forecasting over the Huaihe Basin using TIGGE multimodel ensemble forecasts. Mon. Weather Rev. 142, 1542–1555. doi:10.1175/MWR-D-13-00031.1
Lorenz, E. N. (1965). A study of the predictability of a 28-variable atmospheric model. Tellus 17, 321–333. doi:10.3402/tellusa.v17i3.9076
Lorenz, E. N. (1963). Deterministic nonperiodic flow. J. Atmos. Sci. 20, 130–141. doi:10.1175/1520-0469(1963)020<0130:dnf>2.0.co;2
Mahyavanshi, P., Loliyana, V. D., and Sharma, P. J. (2021). “Variability of rainfall, temperature, and potential evapotranspiration at annual time scale over tapi to tadri river basin, India,” in Climate change impacts on water resources. Editors R. Jha, V. P. Singh, V. Singh, and L. Roy (Cham: Springer).
Materia, S., Borrelli, A., Bellucci, A., Alessandri, A., di Pietro, P., Athanasiadis, P., et al. (2014). Impact of atmosphere and land surface initial conditions on seasonal forecasts of global surface temperature. J. Clim. 27, 9253–9271. doi:10.1175/JCLI-D-14-00163.1
Meehl, G. A., Yang, D., Arblaster, J. M., Bates, S. C., Rosenbloom, N., Neale, R., et al. (2019). Effects of model resolution, physics, and coupling on southern hemisphere storm tracks in CESM1.3. Geophys. Res. Lett. 46, 12408–12416. doi:10.1029/2019GL084057
Merryfield, W. J., Lee, W. S., Boer, G. J., Kharin, V. V., Scinocca, J. F., Flato, G. M., et al. (2013). The canadian seasonal to interannual prediction system. part I: Models and initialization. Mon. Weather Rev. 141, 2910–2945. doi:10.1175/MWR-D-12-00216.1
Min, Y. M., Kryjov, V. N., and Oh, S. M. (2014). Assessment of APCC multimodel ensemble prediction in seasonal climate forecasting: Retrospective (1983–2003) and real-time forecasts (2008–2013). J. Geophys. Res. Atmos. 119, 12, 132–212, 150. doi:10.1002/2014JD022230
Mishra, N., Prodhomme, C., and Guemas, V. (2019). Multi-model skill assessment of seasonal temperature and precipitation forecasts over Europe. Clim. Dyn. 52, 4207–4225. doi:10.1007/s00382-018-4404-z
Mu, M., Duan, W., Wang, Q., and Zhang, R. (2010). An extension of conditional nonlinear optimal perturbation approach and its applications. Nonlinear process. geophys. 17, 211–220. doi:10.5194/npg-17-211-2010
Palmer, T. N., Alessandri, A., Andersen, U., Cantelaube, P., Davey, M., Délécluse, P., et al. (2004). Development of a European multimodel ensemble system for seasonal-to-interannual prediction (DEMETER). Bull. Am. Meteorol. Soc. 85, 853–872. doi:10.1175/BAMS-85-6-853
Peng, P., Kumar, A., Van Den Dool, H., and Barnston, A. G. (2002). An analysis of multimodel ensemble predictions for seasonal climate anomalies. J. -Geophys. -Res. 107, ACL 18-1–ACL 18-12. doi:10.1029/2002JD002712
Qian, G., Li, Q., Li, C., Li, H., Wang, X. L., Dong, W., et al. (2021). A novel statistical decomposition of the historical change in global mean surface temperature. Environ. Res. Lett. 16, 054057. doi:10.1088/1748-9326/abea34
Qiu, C., Shao, A., Xu, Q., and Wei, L. (2007). Fitting model fields to observations by using singular value decomposition: An ensemble-based 4DVar approach. J. Geophys. Res. 112, D11105. doi:10.1029/2006JD007994
Raftery, A. E., Gneiting, T., Balabdaoui, F., and Polakowski, M. (2005). Using Bayesian model averaging to calibrate forecast ensembles. Mon. Weather Rev. 133, 1155–1174. doi:10.1175/MWR2906.1
Rubin, J. I., Reid, J. S., Hansen, J. A., Anderson, J. L., Holben, B. N., Xian, P., et al. (2017). Assimilation of AERONET and MODIS AOT observations using variational and ensemble data assimilation methods and its impact on aerosol forecasting skill. J. Geophys. Res. Atmos. 122, 4967–4992. doi:10.1002/2016JD026067
Saha, S., Moorthi, S., Wu, X., Wang, J., Nadiga, S., Tripp, P., et al. (2014). The NCEP climate forecast system version 2. J. Clim. 27, 2185–2208. doi:10.1175/JCLI-D-12-00823.1
Scheuerer, M. (2014). Probabilistic quantitative precipitation forecasting using ensemble model output statistics. Q. J. R. Meteorol. Soc. 140, 1086–1096. doi:10.1002/qj.2183
Sheng, B., Wang, H., Sun, W., Li, H., Chao, L., Cheng, J., et al. (2021). Meridional temperature difference over pan-east Asia and its relationship with precipitation in century scales. Front. Environ. Sci. 9, 769439. doi:10.3389/fenvs.2021.769439
Shukla, S., and Lettenmaier, D. P. (2013). Multi-RCM ensemble downscaling of NCEP CFS winter season forecasts: Implications for seasonal hydrologic forecast skill. J. Geophys. Res. Atmos. 118, 10, 770–810, 790. doi:10.1002/jgrd.50628
Shukla, S., Roberts, J., Hoell, A., Funk, C. C., Robertson, F., and Kirtman, B. (2019). Assessing North American multimodel ensemble (NMME) seasonal forecast skill to assist in the early warning of anomalous hydrometeorological events over East Africa. Clim. Dyn. 53, 7411–7427. doi:10.1007/s00382-016-3296-z
Sloughter, J. M. L., Raftery, A. E., Gneiting, T., and Fraley, C. (2007). Probabilistic quantitative precipitation forecasting using bayesian model averaging. Mon. Weather Rev. 135, 3209–3220. doi:10.1175/MWR3441.1
IPCC (2013). in Climate change 2013: The physical science basis. Contribution of working group I to the fifth assessment report of the intergovernmental panel on climate change. Editors T. F. Stocker, D. Qin, G.-K. Plattner, M. Tignor, S. K. Allen, J. Boschunget al. (Cambridge and New York, NY: Cambridge University Press), 1535.
Streefkerk, I. N., van den Homberg, M. J. C., Whitfield, S., Mittal, N., Pope, E., Werner, M., et al. (2022). Contextualising seasonal climate forecasts by integrating local knowledge on drought in Malawi. Clim. Serv. 25, 100268. doi:10.1016/j.cliser.2021.100268
Takaya, Y., Hirahara, S., Yasuda, T., Matsueda, S., Toyoda, T., Fujii, Y., et al. (2018). Japan meteorological agency/meteorological research institute-coupled prediction system version 2 (JMA/MRI-CPS2): atmosphere–land–ocean–sea ice coupled prediction system for operational seasonal forecasting. Clim. Dyn. 50, 751–765. doi:10.1007/s00382-017-3638-5
Takaya, Y., Yasuda, T., Fujii, Y., Matsumoto, S., Soga, T., Mori, H., et al. (2017). Japan meteorological agency/meteorological research institute-coupled prediction system version 1 (JMA/MRI-CPS1) for operational seasonal forecasting. Clim. Dyn. 48, 313–333. doi:10.1007/s00382-016-3076-9
Tang, J., Niu, X., Wang, S., Gao, H., Wang, X., and Wu, J. (2016). Statistical downscaling and dynamical downscaling of regional climate in China: Present climate evaluations and future climate projections. J. Geophys. Res. Atmos. 121, 2110–2129. doi:10.1002/2015JD023977
Taylor, K. E. (2001). Summarizing multiple aspects of model performance in a single diagram. J. Geophys. Res. 106, 7183–7192. doi:10.1029/2000JD900719
Tebaldi, C., Smith, R. L., Nychka, D., and Mearns, L. O. (2005). Quantifying uncertainty in projections of regional climate change: A bayesian approach to the analysis of multimodel ensembles. J. Clim. 18, 1524–1540. doi:10.1175/JCLI3363.1
Toth, Z., and Kalnay, E. (1997). Ensemble forecasting at NCEP and the breeding method. Mon. Weather Rev. 125, 3297–3319. doi:10.1175/1520-0493(1997)125<3297:EFANAT>2.0.CO;2
Wang, B., Lee, J. Y., Kang, I. S., Shukla, J., Kug, J. S., Kumar, A., et al. (2008). How accurately do coupled climate models predict the leading modes of Asian-Australian monsoon interannual variability? Clim. Dyn. 30, 605–619. doi:10.1007/s00382-007-0310-5
Wang, B., Lee, J. Y., Kang, I. S., Shukla, J., Park, C. K., Kumar, A., et al. (2009). Advance and prospectus of seasonal prediction: Assessment of the APCC/CliPAS 14-model ensemble retrospective seasonal prediction (1980-2004). Clim. Dyn. 33, 93–117. doi:10.1007/s00382-008-0460-0
Weigel, A. P., Liniger, M. A., and Appenzeller, C. (2007). The discrete Brier and ranked probability skill scores. Mon. Weather Rev. 135, 118–124. doi:10.1175/MWR3280.1
Wilks, D. S. (2007). Statistical methods in the atmospheric sciences. second edition. Amsterdam, Netherlands: Elsevier.
Wold, S., Sjöström, M., and Eriksson, L. (2001). PLS-regression: A basic tool of chemometrics. Chemom. Intell. Lab. Syst. 58, 109–130. doi:10.1016/S0169-7439(01)00155-1
Yun, W. T., Stefanova, L., Mitra, A. K., Vijaya Kumar, T. S. V., Dewar, W., and Krishnamurti, T. N. (2005). A multi-model superensemble algorithm for seasonal climate prediction using DEMETER forecasts. Tellus A 57, 280–289. doi:10.1111/j.1600-0870.2005.00131.x
Yang, D., Yang, X. Q., Xie, Q., Zhang, Y., Ren, X., and Tang, Y. (2016). Probabilistic versus deterministic skill in predicting the Western North Pacific-East Asian summer monsoon variability with multimodel ensembles. J. Geophys. Res. Atmos. 121, 1079–1103. doi:10.1002/2015JD023781
Yang, Y., Li, Q., Song, Z., Sun, W., and Dong, W. (2022). A comparison of global surface temperature variability, extremes and warming trend using reanalysis datasets and CMST-Interim. Int. J. Climatol. 42, 5609–5628. doi:10.1002/joc.7551
Ye, L., Yang, G., Van Ranst, E., and Tang, H. (2013). Time-series modeling and prediction of global monthly absolute temperature for environmental decision making. Adv. Atmos. Sci. 30, 382–396. doi:10.1007/s00376-012-1252-3
Yun, K. S., Lee, J. Y., and Ha, K. J. (2014). Recent intensification of the south and east Asian monsoon contrast associated with an increase in the zonal tropical sst gradient. J. Geophys. Res. Atmos. 119, 8104–8116. doi:10.1002/2014JD021692
Yun, W. T., Stefanova, L., and Krishnamurti, T. N. (2003). Improvement of the multimodel superensemble technique for seasonal forecasts. J. Clim. 16, 3834–3840. doi:10.1175/1520-0442(2003)016<3834:IOTMST>2.0.CO;2
Keywords: surface temperature, seasonal prediction, deterministic forecast skill, probabilistic forecast skill, partial regression correction method
Citation: Yang Y, Sun W, Zou M, Qiao S and Li Q (2022) Multi-model seasonal prediction of global surface temperature based on partial regression correction method. Front. Environ. Sci. 10:1036006. doi: 10.3389/fenvs.2022.1036006
Received: 03 September 2022; Accepted: 21 September 2022;
Published: 11 October 2022.
Edited by:
Zengyun Hu, Chinese Academy of Sciences (CAS), ChinaReviewed by:
Yuqing Zhang, Huaiyin Normal University, ChinaCopyright © 2022 Yang, Sun, Zou, Qiao and Li. This is an open-access article distributed under the terms of the Creative Commons Attribution License (CC BY). The use, distribution or reproduction in other forums is permitted, provided the original author(s) and the copyright owner(s) are credited and that the original publication in this journal is cited, in accordance with accepted academic practice. No use, distribution or reproduction is permitted which does not comply with these terms.
*Correspondence: Qingxiang Li, bGlxaW5neDVAbWFpbC5zeXN1LmVkdS5jbg==
Disclaimer: All claims expressed in this article are solely those of the authors and do not necessarily represent those of their affiliated organizations, or those of the publisher, the editors and the reviewers. Any product that may be evaluated in this article or claim that may be made by its manufacturer is not guaranteed or endorsed by the publisher.
Research integrity at Frontiers
Learn more about the work of our research integrity team to safeguard the quality of each article we publish.