 Jian Tang1
 Jing Li2*
- 1The Institute for Sustainable Development, Macao University of Science and Technology, Taipa, China
- 2School of Finance, Zhejiang University of Finance and Economics, Hangzhou, China
This paper investigates the carbon risk and its role in stocks’ return prediction by identifying the carbon risk information implied in feature engineering. We predict the stock returns with different neural networks, construct the investment portfolio according to the predicted returns and reflect the returns of stocks with different carbon risks through the relevant evaluation of the investment portfolio. Our Multi-CNN method can best collect information on different relationship types and make full use of graph structure data to identify carbon risks. With or without carbon factor, the stock market performance of high-carbon industry is better than that of medium-carbon industry, and the performance of low-carbon industry is the worst. Moreover, our finding is consistent in both Chinese and American markets. Investment should pay attention to carbon risk and requires corresponding carbon risk premium.
1 Introduction
As concerns grow over global warming, climate extremes and human-generated carbon dioxide emissions, increasing attention has been paid on carbon issues (Bolton and Kacperczyk, 2021a; Ren et al., 2022a; Ren et al., 2022b). For example, the Paris Agreement was adopted at the Paris Climate Change Conference and signed by 195 countries worldwide. From then on, more countries have initiated policy measures to address climate change. Particularly, the Department of Resource Conservation and Environmental Protection issued the Working Guidance for Carbon Dioxide Peaking and Carbon Neutrality in Full and Faithful Implementation of the New Development Philosophy1 on 24 October 2021. These policies enhance the strategic significance to achieve the peak of carbon dioxide emissions and carbon neutrality, which may also impact the performances of carbon-related firms in capital markets. Therefore, a related research question is raised: whether some carbon risk factors are of concern to stock investors. If so, whether these carbon risk factors have important roles in predicting stock returns.
Carbon risk has attracted widespread attention (Görgen et al., 2020; Bolton and Kacperczyk, 2021; Wang et al., 2022a). Extreme climate events, physical risks and environmental regulations caused by carbon emissions may bring risks of low-carbon transition and lead to the revaluation of corporate financial assets (Carney, 2015; Campiglio et al., 2018; Wang et al., 2022b; Dou et al., 2022). Moreover, for companies facing carbon risks, especially fossil fuel-intensive companies, due to factors such as uncertainty in carbon control regulations and fluctuations in carbon prices, future cash flow is extremely unstable (Oestreich & Tsiakas, 2015; Ilhan et al., 2021). They might be very easy to fall into operational difficulties, which in turn affects the expectations on their stock returns. In addition, the stock returns of fossil fuel-intensive companies are also affected by the risk of fossil energy prices and commodity prices (Bolton and Kacperczyk, 2021).
However, it is very difficult to isolate carbon risk, as there are many kinds of characteristic factors that reflect stock information. In this paper, we choose two groups of carbon factors. First, for dominant carbon factors, we consider carbon emissions and crude oil prices, as documented in the literature (Wei Li et al., 2021; Ren X. et al., 2022c). Second, for non-dominant carbon factors that are not directly related to the company’s carbon risk, we use fundamental factors and price factors as they reflect the consistency of carbon risk of enterprises with the same degree of relevance to carbon. Accordingly, this paper also sorts all stocks into high-carbon, medium-carbon, and low-carbon industries, in order to distinguishing stocks based on the degree of relevance to carbon issues. In theory, the carbon risk in high-carbon industries might be the highest, followed by that in medium-carbon industries and the lowest in low-carbon industries.
There is a long line of literature on stocks’ return predictability, while only a few have considered the roles of carbon risk. In this paper, we assume that adding carbon risk would help to improve the accuracy of predicting stock returns, especially for stocks that are highly relevant with the carbon issues. We analyze individual stock information through feature engineering. Feature engineering plays a decisive role in neural network prediction to some extent. It provides predictable information for subsequent operations, and the richness of information as well as the content of expression play a key role.
This paper mainly contributes to the literature from three perspectives. First, we use a neural network model to find that there is a positive carbon risk premium in the stock market under the nonlinear assumption. Second, we use the Multi-CNN method to selectively gather information on different relationship types, and make full use of graph structure data to identify carbon risks, which gives the best prediction power when compared to other methods. Third, we find a significant strategy for selecting stocks with better performance based on our prediction results, in both Chinese and American markets. In particular, we predict the return and choose the best 100 stocks according to the predicted value to construct investment portfolios. Our portfolios outperform the benchmark portfolios in all cases.
The structure of this paper is as follows. In Section 2 we review related literature. In Section 3, we develop our main model used for prediction. In Section 4, we present our empirical methodologies and conduct robustness tests. Section 5 concludes and puts forward some potential research questions.
2 Literature review
2.1 Carbon risk and return prediction
Carbon risk generally refers to uncertainty risks associated with climate change or the use of fossil fuels (Hoffmann & Busch, 2008). The earliest definition of carbon risk includes three independent parts: regulatory risk, physical risk and business risk (Labatt & White, 2007). For example, the carbon reduction requirements in the Paris Agreement and related climate policies have prevented some traditional energy companies from making full use of existing resources, resulting in a decline in the value of these assets (McGlade & Ekins, 2015), which is a manifestation of regulatory risk. Some scholars also suggest six specific types of carbon risks (Lash & Wellington, 2007), namely regulatory risk, physical risk, reputational risk, legal risk, product and technology risk and supply chain risk. On this basis, related studies have carried out different studies on the connotation of carbon risk according to different focuses (Subramaniam et al., 2015; Gasbarro et al., 2017).
The long-term, structural and systemic effects of low-carbon transition and global warming have profoundly affected the stability of the real economy and financial markets (Svartzman et al., 2021; Dong et al., 2021). Among them, the important channels through which changes in investment decisions caused by carbon risk affect the financial market are mainly reflected in the relationship between carbon risk and stock returns. Therefore, many scholars begin to consider the impact of carbon risk on the stock market, and most of the results show that there is a positive carbon premium in the stock market. That is, investors require the securities issued by carbon emission companies they hold to provide higher expected returns to compensate for higher climate policy risk exposure. For example, Oestreich and Tsiakas (2015) apply the capital asset pricing and Fama-French factor models and use a “dirty” vs. “clean” portfolio approach with data from the German stock market. The abnormal returns (alpha) of the “dirty-minus-clean” portfolios are defined as a carbon premium. Wen et al. (2020), based on the data of 245 companies in Shenzhen Carbon emission rights Pilot Exchange, find that the establishment of carbon emission rights exchange significantly increases the carbon risk premium by using DID model. Bolton & Kacperczyk (2021) find that companies with higher total CO2 emissions have higher stock returns, mainly because investors are already demanding compensation for the carbon risks they face. Related to this, Hsu et al. (2022) look at the effects of environmental pollution on the cross-section of stock returns. They find that highly polluting firms are more exposed to environmental regulation risk and com-mand higher average returns. Kim et al. (2015) and Trinks et al. (2022), based on Korean and global data, show that carbon intensity is positively correlated with a firm’s cost of equity capital. However, some scholars have come to the opposite conclusion that there is a negative carbon premium in the stock market, and companies with higher carbon risks have lower expected stock returns. Garvey et al. (2018) find that a portfolio constructed by ranking stocks according to carbon emission intensity can produce positive α. In et al. (2017) similarly points out that the portfolio of long stocks of low carbon emission companies and short stocks of high emission companies will generate positive abnormal returns. Furthermore, Görgen et al. (2020) explores global stock prices and find no evidence of a significant carbon risk premium.
Therefore, it is interesting to investigate whether the carbon risk have impacts on predicting stock returns. If so, would the predictability vary across stocks with different degrees of relevance to the carbon.
2.2 Return prediction methods
Stocks’ return prediction is an important research topic. Early studies tend to investigate this topic by using traditional statistical methods, such as linear econometric models. Recently, some scholars start to use nonlinear models (e.g., neural network model). Financial time series are characterized by nonstationarity, nonlinearity, and high noise, and thus it is difficult for traditional statistical models to predict them accurately. Lin et al. (2013) put forward an SVM-based approach with a two-part feature selection and forecasting model, and prove that this method has better generalization ability than traditional methods. Wanjawa and Muchem (2014) propose the use of an Artificial Neural Network that is a feedforward multi-layer perceptron with error backpropagation and this model can better predict the typical stock market. Zhao et al. (2017) add a time weighting function to LSTM, and their result is better than other models. Zhang and Wen (2022) combine CNN and RNN and propose a new architecture-DWNN. The results show that compared with the conventional RNN model, the DWNN model can reduce the mean square error of prediction by 30%. Some other studies also enhance residual error (ER) which is used to extract important information from the shallow layer and migrate it to the deep layer. The neural networks prove robust to this new statistical test and emerge as the best-performing method in terms of predictability (LeippoldWang and Zhou, 2022).
CNN model is also widely used in image recognition. Krizhevsky et al. (2017) develop a new model structure —Alexnet, which greatly reduced the error rate and subverted the image recognition field, in order to enhance the network expression ability and enhance the network level. Szegedy et al. (2015) construct a 22-layer CNN model, which is cascaded by the Inception structure as the basic modules, and each module uses different sizes. The filter is processed in parallel with the maximum pooling, and the number of parameters is reduced by deleting the full connection layer. By constructing a dense block structure to approximate the optimal sparse structure, the performance can be improved without increasing the amount of computation. He et al. (2016) propose a residual network model (ResNet), which effectively solved the problem of gradient disappearance. Currently, convolutional neural network (CNNs) has been introduced into the field of stock performance prediction, which is capable of directly extracting the features of the input without sophisticated preprocessing and can efficiently process various complex data (Krizhevsky et al., 2017; Widiastuti 2019; Chen and Huang, 2018). When grouped according to the degree of carbon risk, combined with the characteristic engineering including dominant and non-dominant carbon factors, it essentially constitutes the relational data similar to the graph structure. The convolutional neural network is very suitable for processing graph structure data (Kim et al., 2019) because of its good fault tolerance, parallel processing ability, and generalization ability. At the same time, convolutional neural networks are widely used in carbon-related problems (Estrada and Pop, 2011; JiZou et al., 2019; ZhaoWang et al., 2019; Zhang and Wen, 2022), indicating that convolutional neural networks can efficiently identify carbon risks and carbon relationships.
Therefore, we also use the Multi-LSTM and CNN-LSTM methods as our baseline methods. However, in order to make full use of the excellent nature of the neural network in forecasting (Rather et al., 2015; Akita et al., 2016; Gao, 2016), we further develop the Multi-CNN approach to improve the accuracy of carbon risk identification and predicting stocks’ returns. We predict the rate of return to the screen, reduce the number of stocks and make them appear more obvious agglomeration effect.
3 Model development
3.1 CNN
Convolutional neural network has different layers which could be categorized into the input layer, convolutional layer, fully connected layer, and the output layer.
The convolutional layer is used to do the convolution operation on the data. We posit input of layer l−1 is an N×N matrix with F×F convolutional filters. Then, the input of layer l is calculated according to Eq. 1.
In the Eq. 1,
ReLu (Eq. 2) is a commonly used nonlinear activation function.
Fully connected layer is responsible for converting extracted features in the previous layers to the final output. The relation between two successive layers is defined by Eq. 3
In Eq. 3,
Dropout layer can avoid the model from too much learning of the training data. It discards some data in time to effectively prevent over-fitting.
When we distinguish high-carbon, medium-carbon and low-carbon industries, we automatically cluster the carbon risk information as the first type of information. The dominant carbon factor and the non-dominant carbon factor add two different types of data, and at the same time, the two types can be subdivided into other types of data. For example, the non-dominant carbon factor contains price information and fundamental information. There are relationships among these different types of data, such as subordination between individual stocks and characteristics, subordination between individual stocks and industries, etc. Thus, we innovatively adopt CNN in this paper to solve the estimation difficulty given these complex relationships and graph structure data.
3.2 LSTM
Long Short-Term Memory (LSTM) is first designed for overcoming the back-propagating errors (RumelhartHinton and Williams, 1986). As a special kind of RNN, capable of learning long-term dependencies, LSTM can solve the problem of exploding and vanishing gradient problem for general RNN (Graves 2012).
A typical LSTM cell is composed of an input gate, an output gate, and a forget gate. Each cell has two states, the cell state and the hidden state (Liu and Pun, 2022). The output of LSTM at time t is hi, which is defined by Eq. 4
In the Eq. 4:
In the Eq. 5, ot is the output of the output gate, σ is Sigmoid function, xt is the input vector at time t, ht is the output of the hidden layer at time t-1, and W, U as well as b are the weight matrix and offset vector during calculation, respectively. In the Eq. 6, it is the output of the input gate at time t. In the Eq. 6, ft is the output of the forget gate at time t.
3.3 CNN-LSTM
Figure 1 shows the CNN-LSTM structure used in the paper. The data is transmitted via the input layer, and the convergence of the network structure is accelerated by Batch Normalization layer, preserving the characteristic skew of the activation function at one and the mean activation average near zero due to normalization. The normalized result is calculated by the 1D convolutional layer and the LSTM layer. To match the size of the input data amount, two operations are performed separately. Following that, part of the data is discarded through the Dropout layer to prevent overfitting. The processing data is flattened and then passed through the fully connected layer (Dense) and the result is finally obtained through the output layer.
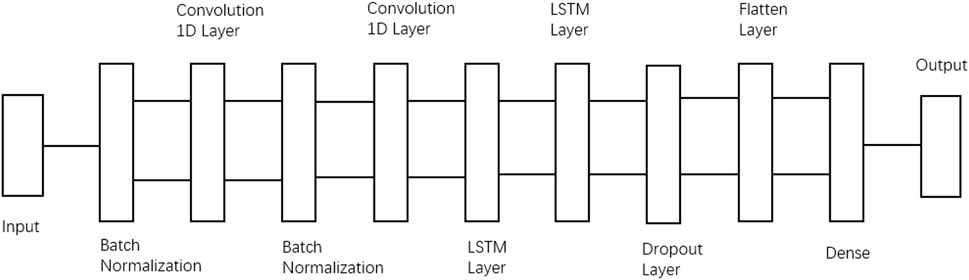
FIGURE 1. CNN-LSTM structure. Note: the data is transmitted via the input layer, and the convergence of the network structure is accelerated by Batch Normalization layer. The normalized result is calculated by the 1D convolutional layer and the LSTM layer. Following that, part of the data is discarded through the Dropout layer to prevent overfitting. The processing data is flattened and then passed through the fully connected layer (Dense) and the result is finally obtained through the output layer.
3.4 Sliding window
To study the impact of the real stock market, we use the sliding window method (Nair et al., 2010) to simulate the real investment process, as shown in Figure 2. The model performs estimation and prediction within one data window at a time, and after a single completion, lets the data window slide forward to perform the same estimation and prediction operation for the next interval. The sliding window method preserves the time series information within the data and is consistent with reality compared to traditional data set segmentation methods such as the random leave-out method (Li et al., 2017). Within each data window, we divide it into a training interval, a test interval and a validation interval. The training interval is to fit the parameters of the model using the data while the test interval is to test the selection of suitable hyperparameters and then refit the model on the training and validation data once suitable hyperparameters are obtained. Furthermore, the validation interval is to test the out-of-sample prediction of the resulting model.
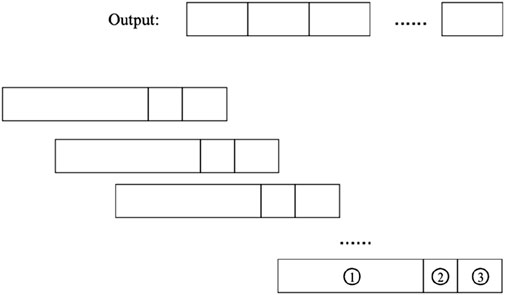
FIGURE 2. Sliding window operation mode. Note: the model performs estimation and prediction within one data window at a time, and after a single completion, lets the data window slide forward to perform the same estimation and prediction operation for the next interval. Within each data window, we divide it into a ① training interval; ② a test interval and a ③ validation interval.
3.5 Multi-CNN
Finally, based on the models and LSTM approach introduced above, we increase the complexity of the model and develop the Multi-CNN methodology as the main empirical model for our study. Basically, we refer to standard approach in the literature and select Conv1D layers, LSTM layers, Dense layers, Dropout layers, Batch Normalization layers, ReLu activation functions, finding suitable combinations for hyperparameters selection, model estimation, and performance evaluation. It is worth noting that we do not include Conv2D layers, Conv3D layers and Pooling layers in the construction of the model. This is because both layers require the input quantities to be converted to 2D or 3D, which can lose the original 1D data characteristics of the stock data and add a large amount of redundant information creating interference. Although Pooling layers can prevent over-fitting to some extent, they are essentially downscaling and abstraction of visual input objects modelled on the human visual system, which is clearly not applicable to stock data.
Moreover, we do not construct a particularly large set of features, preventing the influence of the carbon factor from being weakened. In addition, on the application of sliding windows, 90% of the first order of all trading day data for 5 years is taken as the training interval each time, and the remaining 10% is the test interval. The test interval is the 1 month of trading day data immediately following this 5-year period. All the neural networks are built using Keras, a high-level API for Tensorflow in Python, and to accomplish the computation of huge amounts of data, we program them on the Linux operating system, using GPU acceleration.
4 Empirical methodology
4.1 Data sample
We obtain Chinese daily quotes data for all A-share stocks listed on the Shanghai and Shenzhen stock exchanges from the Tendency and download carbon-related factors from Wind Database, the largest financial data provider in China. Meanwhile, according to the “Notice on the Release of Energy Efficiency Benchmarking Levels and Benchmarking Levels in Key Areas of High Energy-Consuming Industries (2021 Edition)", which defines high energy-consuming industries. All individual stocks are sorted into high-carbon, medium-carbon and low-carbon industries according to the CSRC Releases Guidance Document on Uncovered Losses of Listed Companies. Our data sample covers more than 4,600 A-share stocks traded from January 2000 to 2 December018. We also collect the same dimensional data for the US, obtaining daily frequency quotes for all US stocks from the Wharton CRSP database and for the S&P 500, which is set as the benchmark. In distinguishing between high-carbon, medium-carbon and low-carbon industries in US markets, we follow the industry classification of the Wharton database and refer to the definition of high energy-consuming industries by Bolton et al. The final sample of data from the US covers 7,528 stocks traded from January 2000 to December 2018.
For the data processing of the US and Chinese data, we used the same method. We build the pool of stock-level predictive characteristics, which includes 19 characteristics in total, including four carbon-related factors, namely China CO2 emissions, Global CO2 emissions, Futures Settlement Price (continuous): Brent Crude Oil, Futures Settlement Price (continuous): WTI Crude Oil. In terms of data frequency, all 15 stock characteristics are updated daily, 2 crude oil futures prices are daily updated and 2 carbon emissions factors annually. In order to improve the validity of the data, the annual data is converted into daily data.
Machine learning has been proven to be effective in extracting features for prediction in complex and noisy data environments. In order to exploit the potential of the data, enriching the amount of information provided by the limited data available, we process the data slices, not only in terms of the number of factors, but also in terms of the length of the data slices, creating a more complex three-dimensional tensor. For example, the training set shapes for the Chinese and US stock markets from 2014 to 2018 are 3339180*20*19 and 9106633*20*19 respectively.
4.2 Prediction accuracy assessment for baseline methods
The metric for evaluating forecast accuracy is defined as:
where y represents the true return,
We initiate our tests by using some baseline methods such as Multi-LSTM, CNN-LSTM methodologies, as shown in Table 1. Prediction accuracy assessment metric values (MSE, RMSE and MAE) are calculated under the without and with the carbon factor, respectively. The neural network method has similar prediction results for the all-stock, high-carbon and medium-carbon sectors, while the prediction accuracy is poorer for the low-carbon sector. Moreover, the prediction effect of the neural network is less affected by the carbon factor.
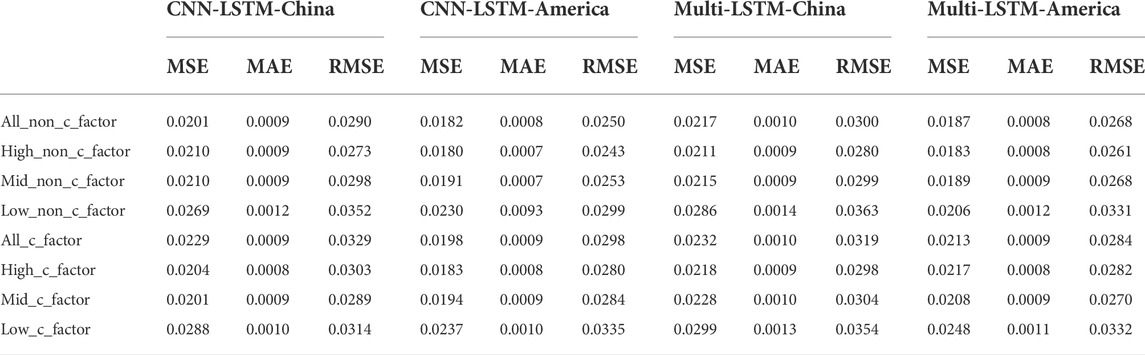
TABLE 1. Evaluation of prediction accuracy using Multi-LSTM method and CNN-LSTM method with and without carbon factor in feature engineering Note: This table records the values of MSE, RMSE and MAE used to evaluate the prediction accuracy of Multi-LSTM method and CNN-LSTM method. And all, high, mid as well as low represent the full stock, high-carbon, medium-carbon as well as low-carbon sectors respectively. Meanwhile, the values of Chinese market and American market are recorded respectively. Overall, in the case of feature engineering with and without carbon factor, the values of each forecast accuracy assessment indicator in different industries are small, indicating that the methodology has good forecasting effect and high forecast accuracy.
In order to more clearly and visibly represent the impact of the inclusion of factors representing the carbon macro environment on the stock market, we conduct an in-depth analysis by constructing a portfolio. For all stocks, we rank their returns over the forecast period. Then, to amplify the impact to get more valuable results, we select the top 100 stocks in terms of forecast returns to build the portfolio for that day and calculate both the true return and the cumulative return of the daily portfolio from January 2005 to December 2018. The SSE is used as a benchmark for the Chinese stock market and the S&P 500 is used as a benchmark for the US stock market, and they are used to compare the cumulative returns of the method with and without the carbon factor respectively. Figure 3 shows the cumulative returns of the portfolios constructed under the Multi-LSTM, CNN-LSTM methodologies for both the no-carbon factor and the carbon-containing factor. The portfolio constructed through the neural network approach outperforms and that the carbon factors have a significant impact on portfolio selection. With the addition of the carbon factor, the high carbon sector forecasts improve significantly in these neural network methodologies and the portfolios all achieve good returns. The total return, average return, omega ratio, Sharpe ratio and Sortino ratio of the portfolio, using Multi-LSTM method and CNN-LSTM method, are calculated for further analysis, given in Table 2. In fact, for high carbon sectors, they have higher carbon risk and investors need a higher risk premium to compensate.
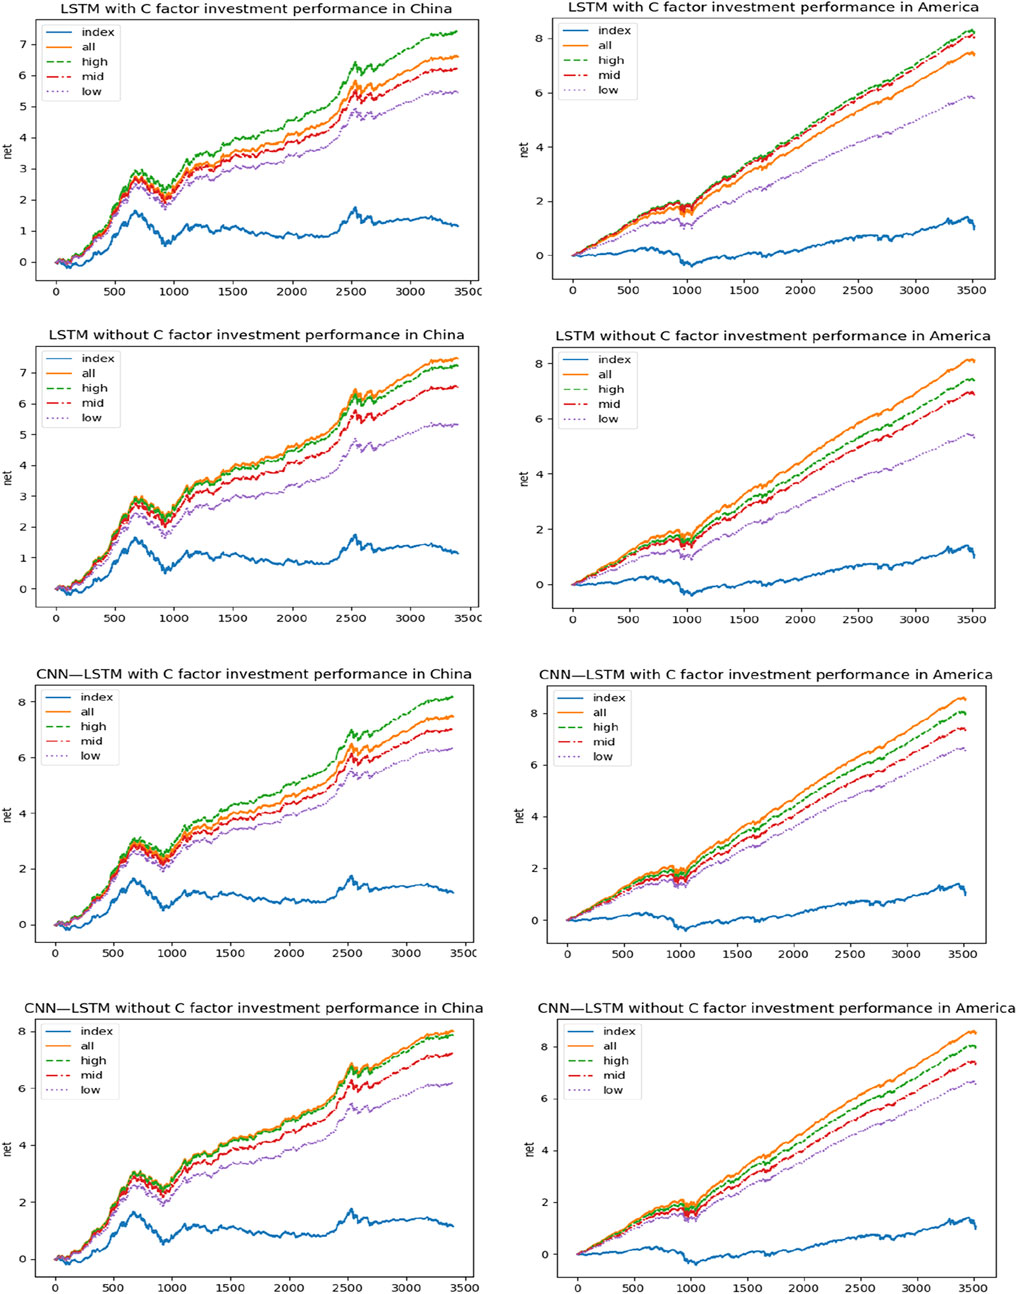
FIGURE 3. Cumulative return rate of portfolio constructed by Multi-LSTM method and CNN-LSTM method. Note: the figure shows the cumulative returns from January 2005 to December 2018 of investment portfolios constructed by China and America through Multi-LSTM method and CNN-LSTM method with and without carbon factors in feature engineering. SSE Composite Index is selected as benchmark in China, while the S&P 500 is selected in America. In the legend, all stands for all stocks, high stands for high-carbon industry, mid stands for medium-carbon industry and low stands for low-carbon industry.
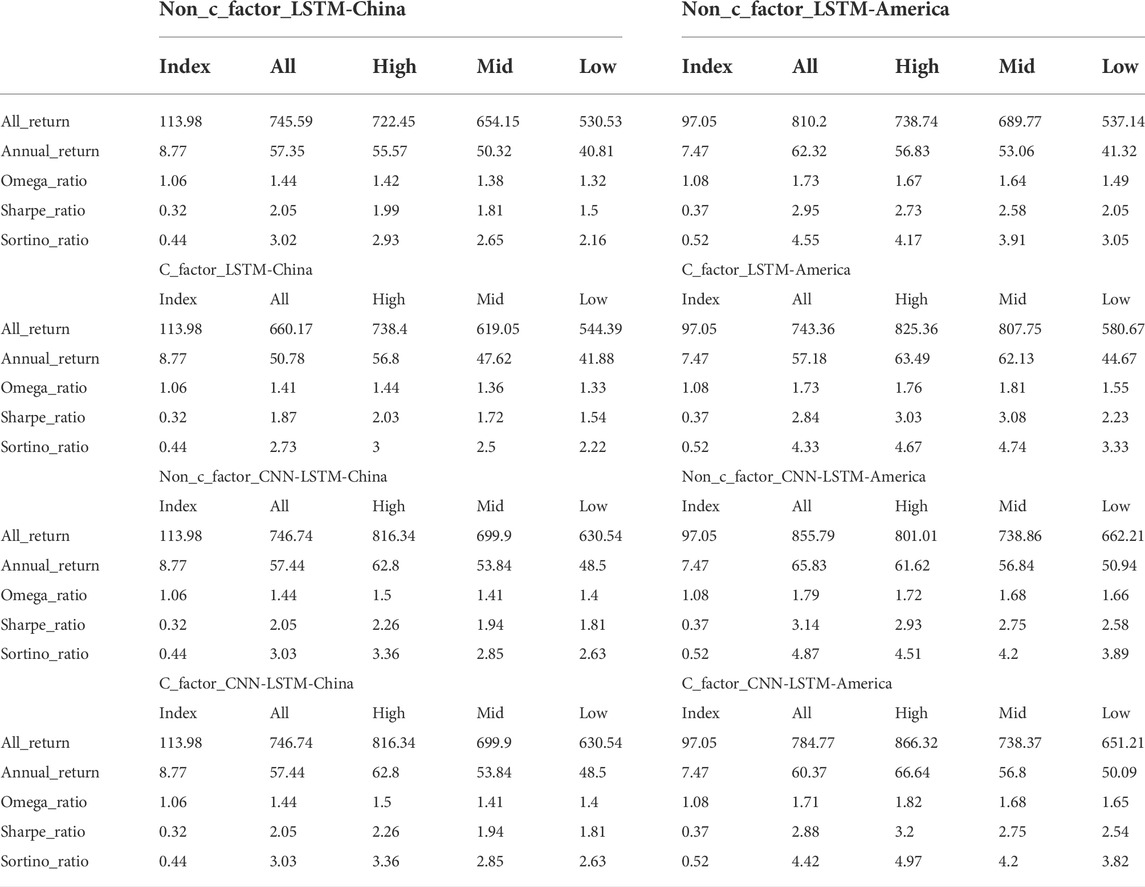
TABLE 2. Evaluation of performance of portfolio using Multi-LSTM method and CNN-LSTM method with and without carbon factor in feature engineering Note: This table records the values of total return, average return, omega ratio, Sharpe ratio and Sortino ratio used to evaluate the performance of portfolio of Multi-LSTM method and CNN-LSTM method. And all, high, mid as well as low represent the full stock, high-carbon, medium-carbon as well as low-carbon sectors respectively. Meanwhile, the values of Chinese market and American market are recorded respectively. And SSE Composite Index is selected as benchmark in China, while the S&P 500 is selected in America. Compared to the benchmark, the five measures of investment performance of the portfolio constructed by this methodology far exceed the benchmark, implying a significantly higher return per unit of risk, which is a positive prediction.
4.3 Further evidence from the Multi-CNN methods
Similarly to the tests we have done on the two baseline methods, Table 3 records the MSE, RMSE, MAE values of these prediction accuracy assessment metrics for the Multi-CNN methodology without and with carbon factors separately, where All, High, Mid, and Low represent the all-stock, high-carbon, medium-carbon, and low-carbon sectors, respectively.
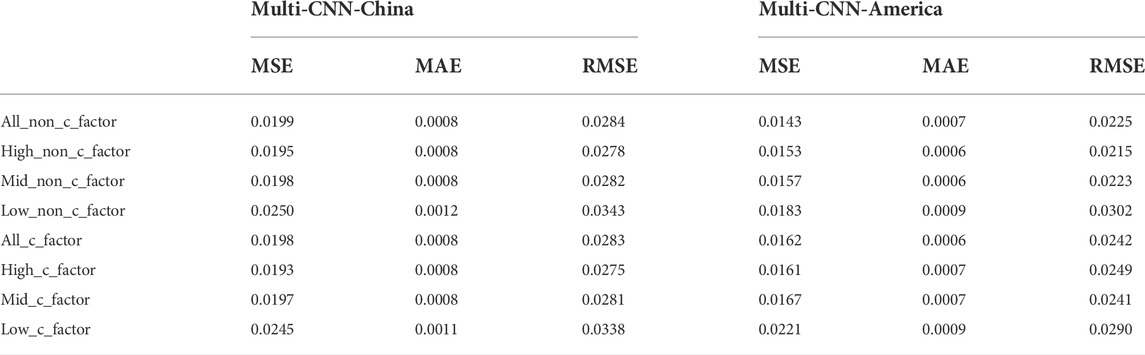
TABLE 3. Evaluation of prediction accuracy using Multi-CNN method with and without carbon factor in feature engineering Note: This table records the values of MSE, RMSE and MAE used to evaluate the prediction accuracy of Multi-CNN method. And all, high, mid as well as low represent the full stock, high-carbon, medium-carbon as well as low-carbon sectors respectively. Meanwhile, the values of Chinese market and American market are recorded respectively. Overall, in the case of feature engineering with and without carbon factor, the values of each forecast accuracy assessment indicator in different industries are small, indicating that the methodology has good forecasting effect and high forecast accuracy.
Clearly, the Multi-CNN methodology has the smallest MSE, RMSE and MAE values and performs the best, the CNN-LSTM methodology is in the middle and performs the second best, and the Multi-LSTM methodology is the largest and performs the worst, but compared to other traditional methods, the neural network methodologies still perform well in prediction.
In more detail, the values of each forecast accuracy assessment indicator in different industries are small, indicating that the methodology has good forecasting effect and high forecast accuracy. The high prediction accuracy of the Multi-CNN approach also shows that this method is suitable for the graph structure data used in this paper. It has good fault tolerance, parallel processing ability, and self-learning ability. It can deal with the problems of complex environmental information, unclear background knowledge, and unclear reasoning rules, and identify carbon risks efficiently. The close relationship between levels and spatial information makes it especially suitable for the processing and understanding of graph structure data, and it can automatically extract rich related features. From the results, the values of each indicator for the all-stock, high-carbon and medium-carbon sectors are not significantly different, implying that they have similar prediction results, while the values of each indicator for the assessment of prediction accuracy for the low-carbon sector are greater than those of the other groups, implying that the methodology has poorer prediction accuracy for the low-carbon sector. This may be because the small number of stocks in the low carbon sector means that the amount of data is low, which affects the forecasting effect. Following this, the groups with and without the carbon factor are similar in the values of these indicators, with only individual indicator values being smaller in the neural network system with the carbon factor. Thus, the inclusion of the carbon factor or not has no significant effect on the prediction accuracy. In terms of the dimension of prediction accuracy alone, the carbon factor has little influence on the predictive effectiveness of this multi-CNN method.
Furthermore, as illustrated in Figure 4, the cumulative returns of the portfolios constructed through the Multi-CNN methodology all significantly outperform the benchmark, although the downward trend and timing of returns occur roughly in line with the index. This again means that the methodology is not able to select stocks that perform well during a downturn in the stock market, which is not ideal, whereas when the index is running smoothly, the methodology’s forecasts are able to successfully select stocks with top real returns, resulting in an increasing cumulative portfolio return.
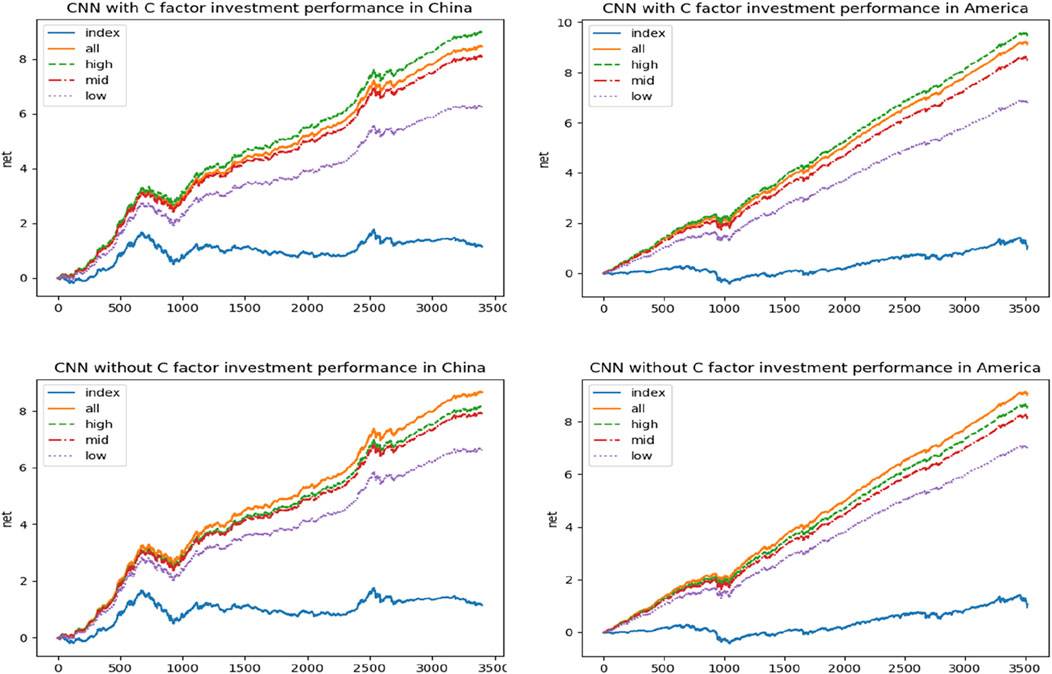
FIGURE 4. Cumulative return rate of portfolio constructed by Multi-CNN method. Note: the figure shows the cumulative returns from January 2005 to December 2018 of investment portfolios constructed by China and America through Multi-CNN method with and without carbon factors in feature engineering. SSE Composite Index is selected as benchmark in China, while the S&P 500 is selected in America. In the legend, all stands for all stocks, high stands for high-carbon industry, mid stands for medium-carbon industry and low stands for low-carbon industry.
We can also find that the addition of the carbon factor has a significant impact on sectors with different carbon relevance. A pool of all stocks without the carbon factor has the highest cumulative portfolio returns constructed through the neural network system, followed by high-carbon, medium-carbon and low-carbon sectors in that order. We believe that an all-stock group implies a greater range of selection and a wide variety of stocks covered, which can effectively avoid a collective decline in yield due to an over-concentration of stocks included in the group. And when the carbon factor is added, the cumulative returns of the high carbon sectors increase significantly, outperforming the cumulative returns of the all-equity range constructed portfolios. This reflects the presence of investors demanding a higher risk premium for carbon risk, a phenomenon highlighted by the introduction of the carbon factor.
The total return, average return, omega ratio, Sharpe ratio and Sortino ratio of the portfolio, using Multi-CNN method, are calculated for further analysis, given in Table 4. Compared to the benchmark, the five measures of investment performance of the portfolio constructed by this methodology far exceed the benchmark, implying a significantly higher return per unit of risk, which is a positive prediction. In contrast, we can see that overall investment performance declines with the addition of the carbon factor, possibly because the independent carbon factor changes the stable structure of the neural network’s already 15 factors, and is less effective than without the carbon factor in terms of overall input.
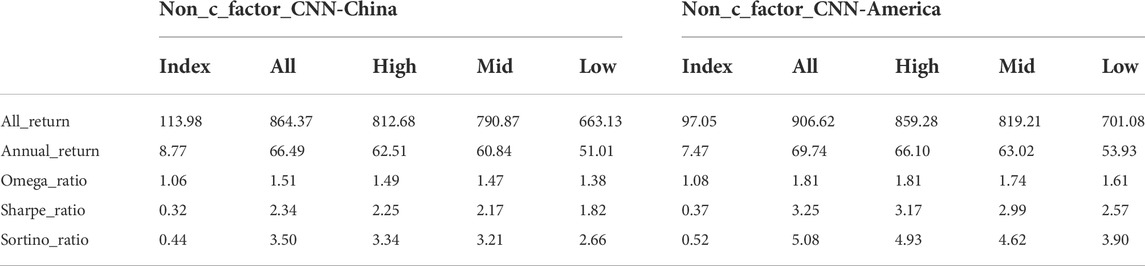
TABLE 4. Evaluation of performance of portfolio using Multi-CNN method with and without carbon factor in feature engineering Note: This table records the values of total return, average return, omega ratio, Sharpe ratio and Sortino ratio used to evaluate the performance of portfolio of Multi-CNN method. And all, high, mid as well as low represent the full stock, high-carbon, medium-carbon as well as low-carbon sectors respectively. Meanwhile, the values of Chinese market and American market are recorded respectively. And SSE Composite Index is selected as benchmark in China, while the S&P 500 is selected in America. Compared to the benchmark, the five measures of investment performance of the portfolio constructed by this methodology far exceed the benchmark, implying a significantly higher return per unit of risk, which is a positive prediction.
5 Conclusion
This paper mainly develops the Multi-CNN method to predict stock returns, dividing all stocks into high-carbon industry, medium-carbon industry and low-carbon industry for their carbon relevance degree. According to the predicted returns, we construct investment portfolios in different industries, and reflect the stock performance of with different carbon relevance. We analyze individual stock information through feature engineering, distinguishing all data between dominant and non-dominant carbon factors. It is found that under the nonlinear hypothesis, the stock market also has a carbon risk premium, and it is a positive carbon risk premium. We find that Multi-CNN methods can selectively collect information on different relationship types and make full use of graph structure data to identify carbon risks. Using Multi-CNN method for return predictions does outperform Multi-LSTM and CNN-LSTM methods.
In the empirical process, some interesting phenomena are found. For example, when the characteristic engineering contains an explicit carbon factor, the investment return of the portfolio formed by stocks selected from high-carbon industries is higher than that of the portfolio formed by stocks selected from all stocks. Theoretically, if the forecast is accurate, the return of the all-stock portfolio should be the highest. Thus, some further studies might be required to explain this phenomenon. Moreover, in reality, carbon risk is not the only influencing factor. Some other factors can be further controlled when studying carbon risk premium, which is reflected in the subdivision of internal stocks in high-carbon, medium-carbon, and low-carbon industries.
Some inspirations are drawn from the above conclusions. It is necessary to continuously improve the efficiency and effectiveness of carbon supervision, form a balanced carbon price signal through market operations, and guide the sustainable development of high-carbon enterprises. In addition, attention should also be paid to the role of laws and regulations in the green transformation of high-carbon enterprises, strengthening the connection between China and the global carbon market, and generating economic and political benefits.
Data availability statement
Publicly available datasets were analyzed in this study. This data can be found here: All A-share stocks listed on the Shanghai and Shenzhen stock exchanges from the Tendency and download carbon-related factors from Wind Database.
Author contributions
JT: Analysis, Software, Writing JL: Methodology, Analysis, Supervision and Writing and Editing.
Conflict of interest
The authors declare that the research was conducted in the absence of any commercial or financial relationships that could be construed as a potential conflict of interest.
Publisher’s note
All claims expressed in this article are solely those of the authors and do not necessarily represent those of their affiliated organizations, or those of the publisher, the editors and the reviewers. Any product that may be evaluated in this article, or claim that may be made by its manufacturer, is not guaranteed or endorsed by the publisher.
References
Akita, R., Yoshihara, A., Matsubara, T., and Uehara, K. (2016). “Deep learning for stock prediction using numerical and textual information,” in 2016 IEEE/ACIS 15th International Conference on Computer and Information Science (ICIS), 1–6. doi:10.1109/ICIS.2016.7550882
Bolton, P., and Kacperczyk, M. (2021). Do investors care about carbon risk? J. Financial Econ. 142 (2), 517–549. doi:10.1016/j.jfineco.2021.05.008
Campiglio, E., Dafermos, Y., Monnin, P., Ryan-Collins, J., Schotten, G., and Tanaka, M. (2018). Climate change challenges for central banks and financial regulators. Nat. Clim. Chang. 8 (6), 462–468. doi:10.1038/s41558-018-0175-0
Carney, M. (2015). Breaking the tragedy of the horizon–climate change and financial stability. Speech given A. T. Lloyd’s Lond. 29, 220–230.
Chen, A.-P., and Huang, S.-H. (2018). “Cloning strategies from trading records using agent-based reinforcement learning algorithm,” in IEEE International Conference on Agents (ICA), 34–37. doi:10.1109/AGENTS.2018.8460078
Dong, K. Y., Ren, X. H., and Zhao, J. (2021). How does low-carbon energy transition alleviate energy poverty in China? A nonparametric panel causality analysis. Energy Econ. 103, 105620. doi:10.1016/j.eneco.2021.105620
Dou, Y., Li, Y. Y., Dong, K. Y., and Ren, X. H. (2022). Dynamic linkages between economic policy uncertainty and the carbon futures market: Does Covid-19 pandemic matter? Resour. Policy 75, 102455. doi:10.1016/j.resourpol.2021.102455
Estrada, D., and Pop, E. (2011). Imaging dissipation and hot spots in carbon nanotube network transistors. Appl. Phys. Lett. 98, 073102. doi:10.1063/1.3549297
Gao, Q. (2016). Stock market forecasting using recurrent neural network. United states: ProQuest Dissertations Publishing.
Garvey, G. T., Iyer, M., and Nash, J. (2018). Carbon footprint and productivity: Does the “E” in ESG capture efficiency as well as environment. J. Invest. Manag. 16 (1), 59–69.
Gasbarro, F., Iraldo, F., and Daddi, T. (2017). The drivers of multinational enterprises' climate change strategies: A quantitative study on climate-related risks and opportunities. J. Clean. Prod. 160, 8–26. doi:10.1016/j.jclepro.2017.03.018
Görgen, M., Jacob, A., Nerlinger, M., Riordan, R., Rohleder, M., and Wilkens, M. (2020). Carbon risk. SSRN Electronic Journal.
Graves, A. (2012). Long short-term memory. Supervised Sequence Label. Recurr. Neural Netw. 385, 37–45.
He, K., Zhang, X., Ren, S., and Sun, J. (2016). “Deep residual learning for image recognition,” in Proceedings of the IEEE conference on computer vision and pattern recognition, 770–778. doi:10.1109/CVPR.2016.90
Hoffmann, V. H., and Busch, T. (2008). Corporate carbon performance indicators: Carbon intensity, dependency, exposure, and risk. J. Ind. Ecol. 12 (4), 505–520. doi:10.1111/j.1530-9290.2008.00066.x
Ilhan, E., Sautner, Z., and Vilkov, G. (2021). Carbon tail risk. Rev. Financ. Stud. 34 (3), 1540–1571. doi:10.1093/rfs/hhaa071
In, S. Y., Park, K. Y., and Monk, A. (2017). Is “being green” rewarded in the market? An empirical investigation of decarbonization risk and stock returns. Int. Assoc. Energy Econ. Singap. Issue) 46 (48).
JiZou, Y., He, K., and Zhu, B. (2019). Carbon futures price forecasting based with ARIMA-CNN-LSTM model. Procedia Comput. Sci. 162, 33–38. doi:10.1016/j.procs.2019.11.254
Kim, R., So, C. H., Jeong, M., Lee, S., Kim, J., and Kang, J. (2019). Hats: A hierarchical graph attention network for stock movement prediction. arXiv preprint arXiv:1908.07999.
Kim, Y. B., An, H. T., and Kim, J. D. (2015). The effect of carbon risk on the cost of equity capital. J. Clean. Prod. 93, 279–287. doi:10.1016/j.jclepro.2015.01.006
Krizhevsky, A., Sutskever, I., and Hinton, G. E. (2017). Imagenet classification with deep convolutional neural networks. Commun. ACM 60 (6), 84–90. doi:10.1145/3065386
Labatt, S., and White, R. R. (2007). Carbon finance: The financial implications of climate change. NewYork: John Wiley & Sons.
Lash, J., and Wellington, F. (2007). Competitive advantage on a warming planet. Harv. Bus. Rev. 85 (3), 94–102.
LeippoldWang, Q., and Zhou, W. (2022). Machine learning in the Chinese stock market. J. Financial Econ. 145 (2), 64–82. doi:10.1016/j.jfineco.2021.08.017
Li, B., Lin, Y., and Tang, W. X. (2017). ML-TEA: A set of quantitative investment algorithms based on machine learning and technical analysis. Syst. Eng. Theory Pract. 37 (5), 1089–1100.
Lin, Y., Guo, H., and Hu, J. (2013). “An SVM-based approach for stock market trend prediction,” in The 2013 international joint conference on neural networks (IJCNN), 1–7.
Liu, R., and Pun, C. S. (2022). Machine-learning-enhanced systemic risk measure: A two-step supervised learning approach. J. Bank. Finance 136, 106416. doi:10.1016/j.jbankfin.2022.106416
McGlade, C., and Ekins, P. (2015). The geographical distribution of fossil fuels unused when limiting global warming to 2 C. Nature 517 (7533), 187–190. doi:10.1038/nature14016
Nair, B. B., Mohandas, V. P., and Sakthivel, N. R. (2010). A decision tree-rough set hybrid system for stock market trend prediction. Int. J. Comput. Appl. 6 (9), 1–6. doi:10.5120/1106-1449
Oestreich, A. M., and Tsiakas, I. (2015). Carbon emissions and stock returns: Evidence from the EU emissions trading scheme. J. Bank. Finance 58, 294–308. doi:10.1016/j.jbankfin.2015.05.005
Rather, A. M., Agarwal, A., and Sastry, V. N. (2015). Recurrent neural network and a hybrid model for prediction of stock returns. Expert Syst. Appl. 42 (6), 3234–3241. doi:10.1016/j.eswa.2014.12.003
Ren, X. H., Duan, K., Tao, L. Z., Shi, Y. K., and Yan, C. (2022b). Carbon prices forecasting in quantiles. Energy Econ. 108, 105862. doi:10.1016/j.eneco.2022.105862
Ren, X. H., Li, Y. Y., Qi, Y. S., and Duan, K. (2022a). Asymmetric effects of decomposed oil-price shocks on the EU carbon market dynamics. Energy 254 (B), 124172. doi:10.1016/j.energy.2022.124172
Ren, X., Li, Y., Yan, C., Wen, F., and Lu, Z. (2022c). The interrelationship between the carbon market and the green bonds market: Evidence from wavelet quantile-on-quantile method. Technol. Forecast. Soc. Change 179, 121611. doi:10.1016/j.techfore.2022.121611
RumelhartHinton, G. E., and Williams, R. J. (1986). Learning representations by back-propagating errors. Nature 323 (6088), 533–536. doi:10.1038/323533a0
Subramaniam, N., Wahyuni, D., Cooper, B. J., Leung, P., and Wines, G. (2015). Integration of carbon risks and opportunities in enterprise risk management systems: Evidence from Australian firms. J. Clean. Prod. 96, 407–417. doi:10.1016/j.jclepro.2014.02.013
Svartzman, R., Bolton, P., Despres, M., Pereira Da Silva, L. A., and Samama, F. (2021). Central banks, financial stability and policy coordination in the age of climate uncertainty: A three-layered analytical and operational framework. Clim. Policy 21 (4), 563–580. doi:10.1080/14693062.2020.1862743
Szegedy, C., Liu, W., Jia, Y., Sermanet, P., Reed, S., Anguelov, D., and Rabinovich, A. (2015). “Going deeper with convolutions,” in Proceedings of the IEEE conference on computer vision and pattern recognition, 1–9.
Trinks, A., Ibikunle, G., Mulder, M., and Scholtens, B. (2022). Carbon intensity and the cost of equity capital. Energy J. 43 (2), 181. doi:10.5547/01956574.43.2.atri
Wang, X., Li, J., and Ren, X. (2022a). Asymmetric causality of economic policy uncertainty and oil volatility index on time-varying nexus of the clean energy, carbon and green bond. Int. Rev. Financial Analysis 83, 102306. doi:10.1016/j.irfa.2022.102306
Wang, X., Wang, X., Ren, X., and Wen, F. (2022b). Can digital financial inclusion affect CO2 emissions of China at the prefecture level? Evidence from a spatial econometric approach. Energy Econ. 109, 105966. doi:10.1016/j.eneco.2022.105966
Wanjawa, B. W., and Muchemi, L. (2014). ANN model to predict stock prices at stock exchange markets.
WeiLi, Y., Ren, X., and Duan, K. (2021). Crude oil price uncertainty and corporate carbon emissions. Environ. Sci. Pollut. Res. 29 (2), 2385–2400. doi:10.1007/s11356-021-15837-8
Wen, F., Wu, N., and Gong, X. (2020). China’s carbon emissions trading and stock returns. Energy Econ. 86, 104627. doi:10.1016/j.eneco.2019.104627
Widiastuti, N. (2019). Convolution neural network for text mining and natural language processing. IOP Conf. Ser. Mat. Sci. Eng. 662 (5), 052010. doi:10.1088/1757-899X/662/5/052010
Zhang, F., and Wen, N. (2022). Carbon price forecasting: A novel deep learning approach. Environ. Sci. Pollut. Res. 29 (36), 54782–54795. doi:10.1007/s11356-022-19713-x
Zhao, Z., Rao, R., Tu, S., and Shi, J. (2017). “Time-weighted LSTM model with redefined labeling for stock trend prediction,” in 2017 IEEE 29th international conference on tools with artificial intelligence (ICTAI), 1210–1217.
Keywords: carbon risk, return prediction, neural network, deep learning, multi-CNN
Citation: Tang J and Li J (2022) Carbon risk and return prediction: Evidence from the multi-CNN method. Front. Environ. Sci. 10:1035809. doi: 10.3389/fenvs.2022.1035809
Received: 03 September 2022; Accepted: 17 October 2022;
Published: 31 October 2022.
Edited by:
Xiaohang Ren, Central South University, ChinaReviewed by:
Kai Quan Zhang, Xiamen University, ChinaZeng Bing, Anhui University of Finance and Economics, China
Copyright © 2022 Tang and Li. This is an open-access article distributed under the terms of the Creative Commons Attribution License (CC BY). The use, distribution or reproduction in other forums is permitted, provided the original author(s) and the copyright owner(s) are credited and that the original publication in this journal is cited, in accordance with accepted academic practice. No use, distribution or reproduction is permitted which does not comply with these terms.
*Correspondence: Jing Li, amluZ2xpODg4MUBvdXRsb29rLmNvbQ==