 Chaogang Guo
 Weihua Ai*
95% of researchers rate our articles as excellent or good
Learn more about the work of our research integrity team to safeguard the quality of each article we publish.
Find out more
ORIGINAL RESEARCH article
Front. Environ. Sci. , 04 October 2022
Sec. Environmental Informatics and Remote Sensing
Volume 10 - 2022 | https://doi.org/10.3389/fenvs.2022.1034045
This article is part of the Research Topic Advances in Numerical Model, Data Assimilation, and Observations for Hazardous Weather Prediction View all 10 articles
C-band synthetic aperture radar (SAR) with all-weather observation capability is gradually being used for the high-resolution observation of hurricane. The extreme wind speed in hurricanes is retrieved by combining the co- and cross-polarized SAR signals. However, the heavy precipitation associated with hurricanes will seriously affect the retrieval of SAR sea surface wind speed. In this study, the effects of precipitation-related parameters and phenomena on wind speed retrieval under strong hurricane conditions were examined by using the data from co-located global precipitation measurement Dual-frequency Precipitation Radar, SAR on Sentinel-1 and Radarsat-2, and stepped frequency microwave radiometer. The results show that precipitation will increase the retrieval error of wind speed, and the effect of convective precipitation is more obvious than that of stratiform precipitation. When the wind speed is less than 30 m/s and the rain rate is less than 20 mm/h, the distribution of the melting layer has no obvious effect on SAR wind speed retrieval. Rain cells are mainly the product of convective precipitation and can also be produced when the storm top height is very low. An increase in the vertical-horizontal (VH) polarized normalized radar cross section (NRCS) in rain cells is usually greater than that of the vertical-vertical (VV) polarized NRCS because the sensitivity of the VH signal in a hurricane area is usually greater than that of the VV signal. When the rain rate is low, the difference between the retrieved wind speed inside and outside the rain cells is within the error range of hurricane wind speed retrieval. When the rain rate is further increased, the difference will exceed 10 m/s.
The synthetic aperture radar (SAR) is capable of all-day, all-weather, and high-spatial-resolution imaging. It is an important means to monitor the sea surface wind field. To accurately retrieve the wind speed in the middle and low range, several geophysical model functions (GMFs), such as CMOD4, CMOD_IFR2, and CMOD5, have been established based on the analysis of co-located European Remote Sensing (ERS) satellites scatterometer data, European Centre for Medium-Range Weather Forecasts (ECMWF) reanalysis data, and National Data Buoy Center (NDBC) buoy data and t based on the empirical relationship between co-polarized normalized radar cross section (NRCS) and the sea surface wind speed (Stoffelen and Anderson, 1997; Quilfen et al., 1998; Hersbach et al., 2007). However, when the sea surface wind speed exceeds 20 m/s, the vertical-vertical (VV) polarized NRCS tends to be saturated and will no longer increase monotonically with the wind speed, resulting in a rapid increase in the error of retrieving high wind speed from the VV NRCS (Donnelly et al., 1999; Shen et al., 2009). Meanwhile, the ability of vertical-horizontal (VH) polarized NRCS to retrieve high wind velocity was revealed from the superior performance of the four-polarization low-noise data of Radarsat-2 (Vachon and Wolfe, 2011). Studies have shown that compared to VV NRCS, VH NRCS has higher sensitivity at high wind speeds, making it more suitable for high wind speed retrieval (Hwang et al., 2010). VH NRCS increases monotonically with wind speed, does not depend on the external wind direction, and has little or no dependence on the radar incidence angle. Using the matching data of VH NRCS and NDBC buoys, dropsondes, and ECMWF reanalysis data and based on the empirical relationship between VH polarization NRCS and sea surface wind speed, GMFs such as C-2PO, C-2POD, and C-3PO, were established (Zhang and Perrie, 2012; Zhang and Perrie, 2013; Zhang et al., 2017). As these models do not require wind direction, wind speed can be retrieved directly from radar measurement data without extracting wind direction information from VV NRCS or external data.
A hurricane is an extremely destructive weather phenomenon and is often accompanied by heavy precipitation. Compared with X-band and Ku-band with shorter wavelengths, the C-band SAR is less affected by precipitation, and hence, it is more widely used for retrieving hurricane wind speed (Weissman and Bourassa, 2008; Marzano et al., 2010). Full polarimetric SAR data can provide complementary direction information for wind field retrieval. It can help improve the accuracy of wind field retrieval by comprehensively using multiple polarimetric data (Zhang et al., 2012). Based on the Satellite Hurricane Observation Campaign (SHOC) data of ESA, a new geophysical model function (MS1A) was proposed to interpret cross-polarized NRCS for wind speeds greater than 25 m/s. The extreme wind speed retrieved using co- and cross-polarized SAR data together showed that the maximum value of retrieved wind speed can reach 60 m/s (Mouche et al., 2017). GMF quantifies the relationship between VH NRCS and wind speed. However, the sea surface roughness is also affected by other non-wind-induced external factors, which will increase or decrease the VH NRCS signal. Precipitation is one of the important factors affecting sea surface roughness (Carratelli et al., 2006). However, almost none of the current GMF functions based on empirical relationships contain the precipitation paraments. In particular, for strong winds, reaching the hurricane level, the effect of precipitation can even produce 100% wind speed errors (Moore et al., 1983).
Precipitation generally affects the NRCS of microwave sensors in three ways, namely, the attenuation of the microwave signal in the atmosphere by precipitation, the backscattering caused by the falling precipitation, and the backscattering changes caused by the interaction of the precipitation with the sea surface (Nie and Long, 2008). The interaction between the precipitation and sea surface is a complex process, and it includes the splashing products (ring waves, stalks, and crowns) produced by raindrops striking the water surface, the changes in sea surface roughness caused by the downdraft associated with precipitation, and the turbulence in the upper water layer caused by raindrops, which attenuates the short gravity wave spectrum (Xu et al., 2014). A scatterometer usually has multiple antennas, which can be combined to obtain wind vectors from measurements from different angles. In order to remove the influence of precipitation, a rainfall algorithm is developed, which is used to infer the rainfall rate in the rainfall area and provide a rainfall marker for the wind vector. (Mears et al., 2000). However, the SAR has only one antenna, which cannot measure wind and rain simultaneously. Alpers et al. (Alpers et al., 2016) established the imaging mechanism of the SAR by analyzing the images and signals of SAR rain cells in different frequency bands and polarization modes when the rain rate is less than 50 mm/h. By matching Tropical Precipitation Measuring Mission (TRMM) PR, ERS-1/2, and ECMWF reanalysis data, Nie et al. (Nie and Long, 2008) established a wind–rain backscattering model of the scatterometer and re-evaluated the effect of precipitation on the C-band scatterometer. By analyzing co-located typhoon data observed by SAR and TRMM PR precipitation data, Shi et al. (Shi et al., 2019) found that when the incidence angle is in the range of 15°–30°, precipitation will suppress NRCS, and when the incidence angle is less than 10° and the incidence angle is in the range of 30°–45°, precipitation will enhance NRCS. Based on the difference between the co–and cross-polarization retrieval of the wind speed affected by precipitation, Hui et al. (Hui et al., 2018) proposed the quality index of the retrieval SAR vector wind speed polluted by rain and also proposed a method to rectify the effect of precipitation in the hurricane core area; this method effectively improved the wind speed retrieval in precipitation-contaminated areas.
The rain rate is clearly an intuitive and important parameter to study the effect of precipitation on microwave signals, but few studies explored the effect of other precipitation-related parameters on microwave signals. In this regard, we used the co-located global precipitation measurement (GPM) Dual-frequency Precipitation Radar (DPR) precipitation data, the SAR hurricane data of Sentinel-1 and Radarsat-2, and the stepped frequency microwave radiometer (SFMR) data to analyze the effects of precipitation, melting layer (ML) distribution, and precipitation type on SAR wind speed retrieval. The rest of this paper is organized as follows. Section 2 presents the data we used and the data-matching method. Section 3 provides an analysis of the effect of wind speed retrieval under different precipitation environments. Section 4 presents an analysis of the effect of rain cells on NRCS and wind speed retrieval. Section 5 provides a discussion and perspectives.
Sentinel-1 is part of ESA’s Copernicus satellite launch program. It consists of polar-orbiting satellites A and B that form a dual constellation system. Satellites A and B were launched in 2014 and 2016, respectively. The SAR sensor on Sentinel-1 has four imaging modes: Stripmap (SM), Interferometric Wide swath (IW), Extra Wide swath, and Wave (WV). The IW mode we used is to image three sub-bands with a swath of 250 km in a progressive scanning mode, and it covers an incidence angle range of 30°–42°. The level-1 ground range detected product has a range resolution of about 20 m and an azimuth resolution of about 22 m (Geudtner et al., 2014). Radarsat-2 is a high-resolution commercial SAR satellite jointly developed by the Canadian Space Agency and MacDonald Dettwiler and Associates Ltd. (MDA). Radarsat-2 was launched in 2007. We used its Scansar Wide mode (SCW), with an incidence angle of 20°–49° and a resolution of about 100 m in both the range and azimuth directions (Makynen et al., 2002).
As found, the sensitivity of the VH NRCS computed at 3-km resolution is reported to be more than 3.5 times larger than in VV(Mouche et al., 2017). Among the parameters used in wind field retrieval, VH NRCS signal is more sensitive than that of VV NRCS, so it has high requirements for the accuracy of NRCS. Before wind field retrieval, it is necessary to minimize the noise contained in the signal. In 2017, from an evaluation of the error of the Sentinel-1 data cross section, it was confirmed that the Sentinel-1 data met the radiation accuracy requirements. Subsequently, ESA improved the noise equivalent sigma zero (NESZ) estimation method. The first-level data processing algorithm of Sentinel-1 was further optimized, and a more accurate NESZ was obtained in the product (Hajduch et al., 2017). The Radarsat-2 dual-polarization measurement signal can reduce or minimize instrument noise through the noise reduction procedure, which is beneficial for the wind field data retrieval (Hui et al., 2014).
The GPM satellite was launched on 27 February 2014, and it is the successor of the world’s first spaceborne precipitation radar Tropical Precipitation Measuring Mission (TRMM). The payloads carried by the GPM core satellite are a multi-channel GPM Microwave Imager (GMI) and the first spaceborne Ku/Ka-band Dual-frequency Precipitation Radar (DPR). The DPR radar data used in this study includes a Ku-band precipitation radar (KuPR) operating at 13.6 GHz and a Ka-band precipitation radar (KaPR) operating at 35.5 GHz. The KuPR and TRMM PR operate at almost the same frequency, but the KuPR has twice the power of the TRMM PR. Hence, KuPR further improves the accuracy of precipitation measurement. With KaPR with the high-sensitivity scanning mode, the minimum detected precipitation intensity of DPR can reach 0.2 mm/h. GPM has four levels of products, and levels 1–3 are publicly available (Tang et al., 2015).
The GPM data are distributed by the NASA Space Flight Center Data Distribution Center. In this study, the dual-frequency retrieval product DPR_NS in the 2A-DPR orbital data product, which is the secondary product in the sixth edition data, was used. The product scans 49 points under the satellite in each measurement, with a resolution of 5 km, a scanning swath width of 245 km, and a vertical resolution of 250 m (Igarashi and Endo, 2014). These data were used in the research on the horizontal and vertical structures of precipitation, the distribution characteristics of the precipitation types, and the three-dimensional structural characteristics of precipitation under hurricane conditions; these researches laid the foundation for studying the effect of precipitation on SAR signals (Hu et al., 2019; Qiao et al., 2021; Hu et al., 2022).
Since 2007, the National Oceanic and Atmospheric Administration Hurricane Research Division has conducted the Hurricane Field Program, which performs planned observations of hurricanes in the Atlantic and eastern Pacific every year. The data collection methods of the program include the use of airborne SFMR, GPS dropsondes, doppler radar, etc., providing a large amount of effective data for studying hurricane evolution and path prediction. The SFMRs mounted on all hurricane hunter and hurricane research aircraft take measurements during flyovers over the hurricane by relying on six C-band radiometers spanning 4.6–7.2 GHz to estimate wind speed and precipitation during the hurricane. Uhlhorn et al. (Uhlhorn et al., 2007) revised the SFMR algorithm by using drop-sonde data collected in 2003, and they further revised the SFMR processing algorithm in 2007, extending the range of the maximum measurable wind speed to 70 m/s and removing the remaining bias of the medium wind speed to a certain extent. SFMR data enable near-real-time intensity forecasts of hurricanes and are an important source of hurricane climatology data. In addition, these data are widely used to develop GMFs under medium and high wind speed conditions and even under extreme wind speed conditions (Sapp et al., 2019).
The resolution of the satellite footprint of the GPM data is 5 km. To realize data co-location, we adjusted the spatial resolution of the SAR and SFMR data to 5 km by spatial resampling. As shown in Figure 1, the grayscale image is the SAR VV NRCS, and the red track is the route of the SFMR flying over the hurricane during the measurement. When GPM works, the satellite scans the passing sub-satellite points in the flight direction. The left half of the coverage area shown in Figure 1 is the precipitation rate for the near-surface data measured by the GPM.
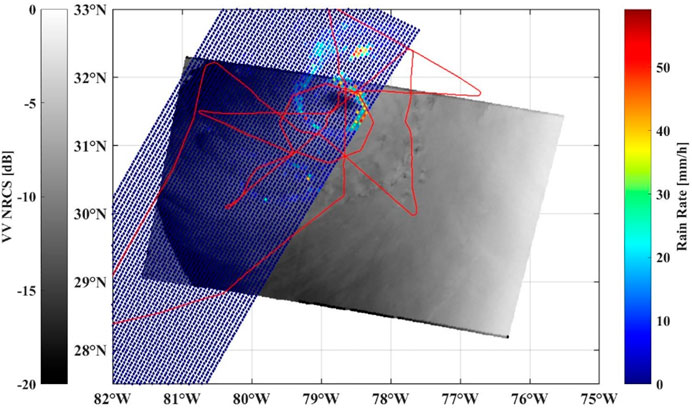
FIGURE 1. Radarsat-2 measured the VV NRCS of Hurricane Arthur during the period 3 July 2014, 11:13:56–3 July 2014, 11:14:50 (UTC). The red line is the SFMR flight route. The area on the left is the GPM scanning area. The scanning time 3 July 2014, 11:08:00–3 July 2014, 11:09:00 (UTC).
Because of the vector motion of the hurricane, the SAR coordinates should be corrected before matching. Previous studies validated the ability of the position offset method to improve the correlation between the SAR NRCS and the SFMR wind speed (Mouche et al., 2019; Guan, 2021). The National Hurricane Center can provide the coordinates, maximum wind force, and central pressure data of hurricanes at 6-hourly intervals. By combining the SAR coordinate information and the SFMR observation time difference, the SAR coordinates were translated according to the following formula:
where
Considering the effects of the violent horizontal movement of the hurricane, each co-located region contains overlapping swaths in which the time difference between the SAR time tags and the GPR DPR time tags is less than ±15 min and that between SAR time tags and SFMR time tags is less than ±1 h. As the co-located regions of SAR, DPR, and SFMR are relatively rare, we processed data from 1 July 2014, to 31 December 2021. Only two co-located hurricanes are found in this period. Information on the data is provided in Table 1. Generally, the duration of SAR acquisition is several seconds, while the SFMR observation time over a hurricane lasts up to several hours or even more. Therefore, it can be considered that the acquisition time of SAR is constant with respect to the observation time of SFMR (Mouche et al., 2019). The SAR observation duration as listed in the table is more than 1 min because the SAR may be continuously observed in the hurricane area, and multiple observation data can be spliced. For example, the collected data of Hurricane Nana are composed of three adjacent SAR data.
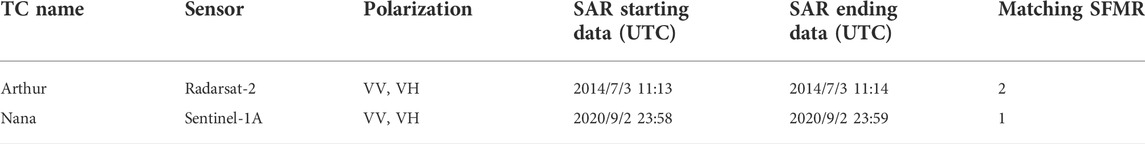
TABLE 1. Hurricane Information Collected by the synthetic aperture radar.
Since the discovery of the monotonically increasing relationship between the VH NRCS and wind speed, several GMFs were developed for different loadings and imaging modes. Alexis et al. (Mouche et al., 2017) developed a combined co- and cross-polarization SAR measurement method suitable for extreme wind conditions by using the hurricane data obtained from the SHOC active SAR in 2016, and they preliminarily realized the retrieval of wind speeds below 60 m/s. The method was further optimized in 2019 to retrieve maximum wind speeds of up to 75 m/s, and the deviation and root-mean-square error (RMSE) of the wind speed retrieved by this method compared with SFMR were about 1.5 and 5 m/s, respectively (Mouche et al., 2019). When the wind speed was less than 25 m/s, the VV NRCS, ECMWF wind direction, and CMOD5N GMF were used to retrieve the wind speed. When the wind speed was greater than 25 m/s, the VH NRCS and MS1A GMF were used to retrieve the wind speed. Co-polarization has a stable accuracy in retrieving wind speeds in the middle and low wind speed range, and the sensitivity of cross-polarization in retrieving high wind speeds also compensates for the problem of co-polarization saturation in the high wind speed range. Atlantic and Eastern Pacific hurricane data based on Sentinel-1 and Ra-darsat-2 satellite observations processed by the above methods (spatial resolution of the data: 0.01°) can be obtained from the Cyclobs Archive Center.
Precipitation is an important factor that affects the transmission of microwave signals. Traditionally, precipitation is considered transparent in the C-band, and its role is more obvious in the Ku band. However, studies revealed that effects of precipitation in the C-band may drastically change the total backscattering cross section and affect the retrieval of sea surface wind speeds (Draper and Long, 2004). The traditional ground-based radar can only observe land and offshore areas but cannot observe the precipitation over the sea. Although GPM satellite is not a polar-orbiting satellite, its observation area covers 90% of the global land and ocean. In addition, DPR data are transmitted to the ground station every 3 h, and hence, the DPR can provide more timely data for forecasting extreme weather events such as floods and hurricanes.
Figure 2 shows the scatter plot of the SAR-retrieved wind speed and the SFMR estimated wind speed. The data in Figure 2 1) shows no effect of precipitation. The RMSE of the two wind speeds is 4.82 m/s, which is almost the same as the RMSE of the combined co- and cross-polarization retrieval of extreme wind speed in the previous study [35]. Figure 2 2) shows the distribution of the SAR-retrieved wind speed and SFMR wind speed during precipitation, and the color map shows the near-surface rain rate measured by the DPR. The RMSE of the two wind speeds is 7.41 m/s. Similar to the conclusions of the previous research, this study showed that the existence of precipitation will lead to an increase in wind speed retrieval error. However, from the distribution of wind speed scatter plot, it is seen that the wind speed error is not clear only in the areas with strong wind or heavy precipitation intensity, indicating that the wind speed retrieval error does not simply increase monotonically with the rain rate but is also related to other factors.
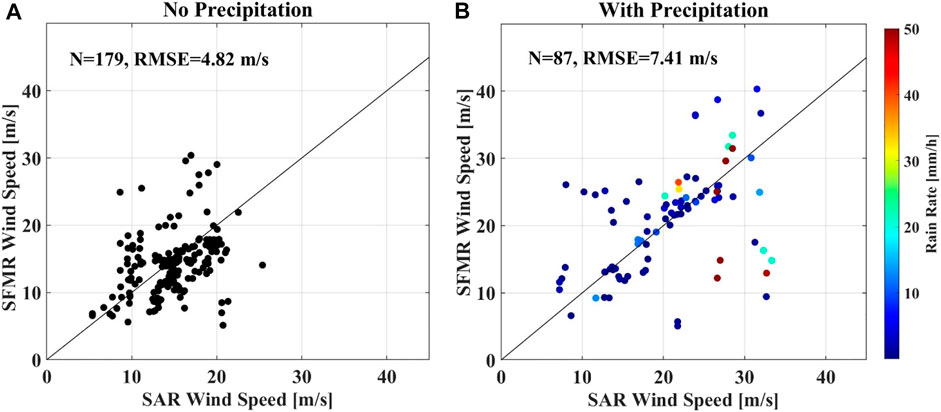
FIGURE 2. Effect of precipitation on SAR wind speed retrieval: (A) no precipitation, (B) precipitation accompanying the DPR measurement, and the colors represents the DPR near-surface rain rate.
DPR classifies rain into three major categories, namely, stratiform, convective, and other. In single-frequency modules, rain-type classification is made by a vertical profiling method (V-method). First, the bright band (BB) in the zero layer is one of the characteristics of continuous precipitation. A BB is detected by examining the profile of the radar reflective factor (Z). When a BB is detected, the rain type is classified as stratiform. When no BB is detected and the Z exceeds 40 dBZ, the rain type is convective (Awaka, 1998). In the dual-frequency module, a new method called the dual-frequency ratio method was developed by using the difference between the measured Ku-band Z in dB and the measured Ka-band Z in dB. This method was used for detecting the ML and for rain-type classification. The concept of ML has a wider meaning than BB. In other words, BB, which appears in stratiform rain, is a subset of ML (Le and Chandrasekar, 2013).
To analyze the effect of precipitation types on wind speed retrieval, we compared the SAR-retrieved wind speed with SFMR wind speeds for two precipitation types, as shown in Figure 3. Figure 3A shows the scatter plot of wind speed during stratiform precipitation (RMSE is 5.93 m/s). Compared with the wind speed error when there is no precipitation, as shown in Figure 2 (a), the wind speed retrieval error increases in the case of stratiform precipitation, but the impact is small. Figure 3B shows the scatter plot of wind speed during convective precipitation (RMSE: 9.12 m/s); compared with the case of no precipitation, the error is higher by 4.3 m/s, and the effect of precipitation is more obvious. Other precipitation types are areas where only cloud or noise is found in DPR measurement, so no analysis was conducted. A comparison of the distribution of wind speed scatter plots for the two precipitation types shows that convective precipitation has a greater effect on wind speed retrieval. This is so because the convective rain rate is always greater than the stratiform rain rate. The color change of the scatterplot in Figure 3 also reflects this fact.
FIGURE 3. Comparison of the SAR-retrieved wind speed and SFMR wind speed for different precipitation types. The color represents the rain rate. (A) Stratiform precipitation and (B) is convective precipitation.
Figure 4 1) shows the distribution of different precipitation types (indicated by different colors) on Hurricane Arthur. In Figure 4A, convective precipitation is indicated by the red dots, which are mainly distributed around the hurricane eye and in the spiral rainband at the southwest of the hurricane eye. Stratiform precipitation is indicated by blue dots, which is the main precipitation pattern of hurricane. The coverage area is usually larger than that of convective precipitation. Figure 4 2) shows the VV NRCS during Hurricane Arthur. In the rain belt on the southwest side of the hurricane eye, a series of connected rain cells are observed. However, there are almost no rain cells in the convective rain region in the hurricane eye. This is because of the very intense updraft of the hurricane near the eye wall, offsetting the downdraft caused by the precipitation decline. However, there are almost no rain cells or rainbands in the stratiform precipitation area, indicating that the rain cell phenomenon is mainly a product of convective precipitation.

FIGURE 4. (A) Precipitation type classified by DPR during Hurricane Arthur. There is no precipitation in the area covered by white dots; convective precipitation occurs in the area covered by blue dots; layered precipitation occurs in the area covered by red dots; other precipitation types occur in the area covered by yellow dots. (B) VV polarization NRCS during Hurricane Arthur.
The ML is an area where precipitation morphology changes. Above the ML, precipitation mainly exists in the form of solid ice crystals and snow particles. When passing through the ML, the ice crystals and snow particles melt into liquid water and form large water droplets through collision and polymerization. At this stage, the ML is an area where solid and liquid precipitation coexist. Below the ML, precipitation is mainly in the form of liquid water. For a given precipitation intensity, the attenuation and backscattering of ice crystals and snow particles on the C-band SAR signal are far less than that of liquid water, and the effect of precipitation particles above the ML on SAR signal is usually ignored (Long and Nie, 2017). The volume scattering and attenuation of precipitation are closely related to the distribution of the ML. By analyzing the characteristics and microphysical processes of the ML, Qiao et al. (Qiao et al., 2022a; Qiao et al., 2022b) found that the height of the ML is affected by the combined effect of latitude and hurricane category. Most precipitation types have the ML located at around 5 km (Petty, 2001). Considering the effect of raindrop density, the height of the ML in a real scenario was simulated by the uniform distribution height of 4 km for the precipitation density (Xu and Li, 2017).
DPR can provide the data of the top and bottom height of the ML, and the thickness of ML can be obtained by calculating the difference between them. As shown in Figure 5 (a), the red dot indicates the top height of the ML, and the blue dot indicates the bottom height of the ML. The top height of the ML is about 5 km, and the bottom height of the ML is about 4 km, and thus, most of the MLs are about 1 km thick. Figure 5 2) shows the scatter plot of wind speed bias and ML thickness.
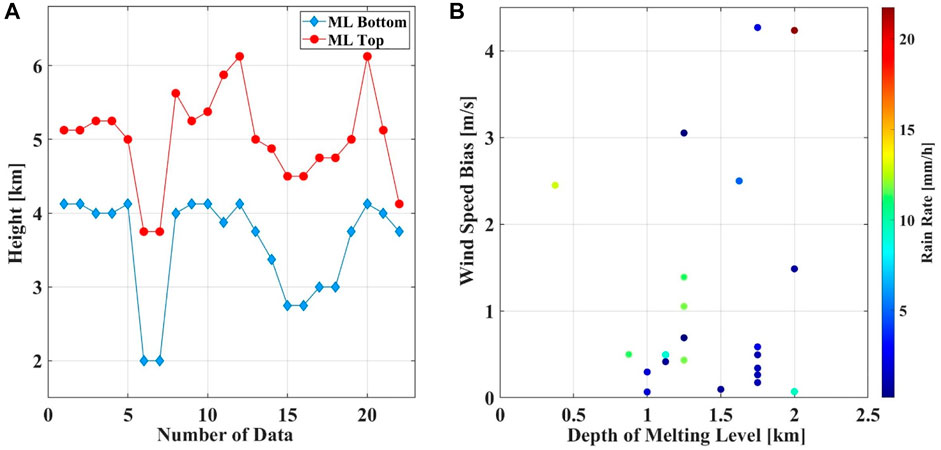
FIGURE 5. Relationship between SAR wind speed and SFMR wind speed difference and ML thickness. (A) Height distribution of top and bottom of ML, (B) Distribution of wind speed bias with different thickness of ML.
The ML thickness is about 2 km at most. The maximum bias between the SAR-retrieved wind speed and SFMR radiometer estimated wind speed is not more than 5 m/s, and is mostly up to 2 m/s. From data analysis, it is seen that when the rain rate does not exceed 20 mm/h, the maximum wind speed does not exceed 30 m/s, and the resolution is 5 km. The effect of changes in the distribution of the ML on the wind speed retrieval can be basically ignored. However, note that the current data are insufficient for analyzing the effects of larger rain rates and wind speeds above 30 m/s on the distribution of the ML, and further research is needed for this purpose.
Rain cells are an important indicator of the effect of precipitation on SAR images. This phenomenon has been observed since the first marine satellite was launched in 1978. The footprints of rain cells on SAR images are caused by the interaction between precipitation and signals in the atmosphere and sea surface. When the downdraft reaches the sea surface, it spreads radially outward as a strong local surface wind that increases the sea surface roughness. If the surrounding wind field is too weak to interfere with this downdraft, a nearly circular bright pattern with a sharp edge will appear on the C-band SAR image. This phenomenon is closely related to the frequency band and polarization mode. Alpers et al. (Shi et al., 2019) compared the rain cells in the L-band, X-band, and C-band SAR images and different polarizations and found that there are obvious differences in the manifestations of the rain cell phenomenon.
The gray scale diagram in Figure 6 1) shows Sentinel-1 VV polarimetric SAR NRCS acquired in IW mode over the Gulf of Honduras from 23:58:12 (UTC) on 2 September 2020, to 23:59:27 on 2 September 2020. The area covered by the scatter plot in the southwest to northeast direction is the near-surface rain rate measured by DPR. The time of the DPR covering the hurricane area is from 00:00:23 on 3 September 2020, to 00:01:35 on 3 September 2020 (UTC), which is only 2–3 min away from the SAR observation time. It can almost be considered that the observation time of the two is synchronized. Figure 6B–Figure 6D show the variations in the VV polarization NRCS, VH polarization NRCS, and SAR retrieval wind speed, respectively, along the cross section in the A, B, and C regions during Hurricane Nana. In Figure 6 (b), the SAR incidence angle is about 41°; the DPR near-surface rain rate in the central area is about 3 mm/h, and that in the peripheral area is 0 mm/h. Figure 6 2) shows the VV-polarized NRCS in the center of rain cell about 5–6 dB, and the VH-polarized NRCS increases by about 8 dB and at wind speed, which is an increase of 10 m/s relative to the edge area of rain cell. In Figure 6 (d), the SAR incidence angle is about 37°, the precipitation in the central region is about 91 mm/h, the rain rate in the upper part of the peripheral region is about 17 mm/h, and the rain rate in the lower part of the peripheral region is about 4 mm/h. Figure 6 4) shows that in the region along the C transect, the VV-polarized NRCS in the center of rain cell increases by about 3–4 dB, and the VH-polarized NRCS increases by about 6–7 dB, and the wind speed increases by 10 m/s relative to the edge area of the rain cell.
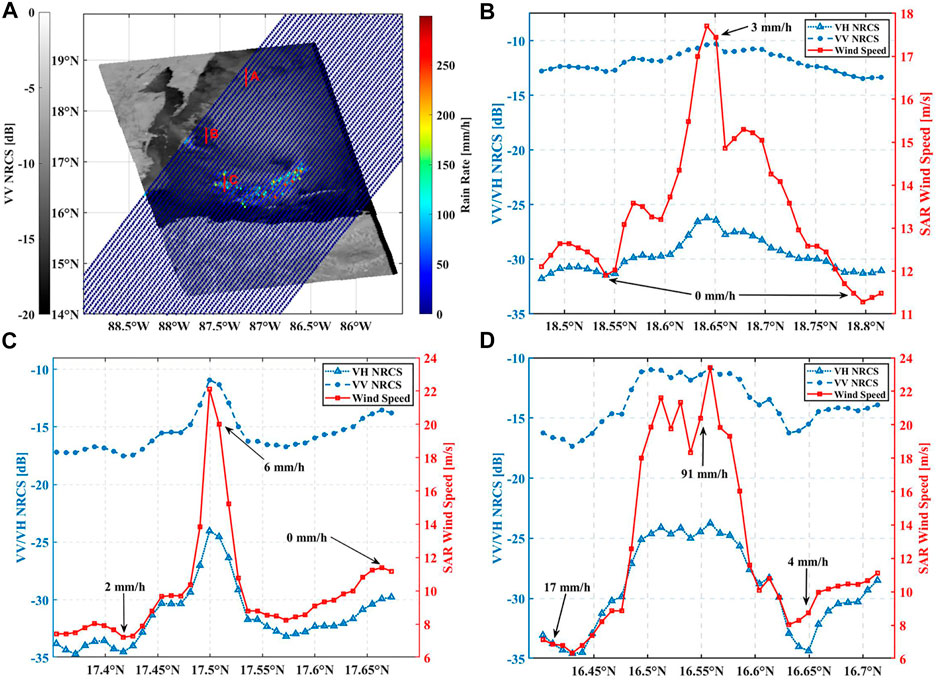
FIGURE 6. (A) VV-polarized NRCS acquired by Sentinel-1 during Hurricane Nana, overlaid with DPR-measured near-surface rain rate, with a color map representing the rain rate. The DPR time tags are in range of 00:00:23–00:01:35 on 3 October 2020 (UTC). Figures (B)–(D) show the NRCS and SAR-retrieved wind speed changes in regions (A), (B), and (C) during Hurricane Nana in Figure (A).
The changes in NRCS as shown in Figure 6 (b)–(d) show that under different rainfall rates, the increase in VH-polarized NRCS in the rain cell area is greater than that of VV-polarize NRCS, indicating that the sensitivity of VH NRCS is greater than that of VV NRCS. This difference in sensitivity is more pronounced as we approach the eye of the hurricane. Figure 6 2) shows that when the rain rate is small, the increase in NRCS will cause an increase in the retrieved wind speed, though the wind speed is still within the error range of hurricane wind speed retrieval. However, the rain rate of the rain cell further increases, and the increase in NRCS will lead to a wind speed retrieval error even exceeding 10 m/s. The comparison of the rain rate and NRCS changes in the peripheral areas in Figure 6 3) and Figure 6 4) shows that the NRCS in the areas with higher rain rates are smaller than those in the areas with lower rain rates. This, it is confirmed that the magnitude of rain rate does not have a simple positive correlation with the change in NRCS.
In Figure 6 (a), we do not observe any obvious dark spots in the center of the rain cell. Meanwhile, dark spots are usually located in a very small range at the center of the rain cell. The data resolution used in this study is too coarse to observe these spots clearly. In Figure 6B and Figure 6D, the NRCS in the central region shows obvious fluctuations, which are most likely caused by the dark spots at the center of the rain cell. On the other hand, because the rain cells in this study are located in the spiral rainbands of hurricanes, the wind speed at the center of the rain cell is usually in the medium–high wind speed range, and even if dark patches appear at the center of the rain cell, they are not as obvious as in the normal area.
The storm top height is the highest position where precipitation occurs. This height is usually slightly lower than the cloud top height. The analysis of storm top height can indirectly reflect the strength and stability of the updraft in clouds, and the effect of different cloud thickness on SAR NRCS is also different. Figure 7 1) shows the near-surface corrected reflectivity factor of Hurricane Arthur. In the figure, two continuous strong radar echo rainbands are observed at the lower left of the hurricane eye. Figure 7B shows the distribution of storm top heights during Hurricane Arthur. The storm top heights are concentrated in the range of 5–11 km, with a minimum height of less than 2 km and a maximum height of over 15 km. From a comparison of the rain rates during hurricanes, as shown in Figure 1, we can see that the storm top height is not positively correlated with rain rate. For example, the rain rate on the north side of the hurricane eye is as high as 55 mm/h, and the storm top height is about 5.5 km, while the rain rate on the west side of the hurricane eye is about 50 mm/h, and the corresponding storm top height is about 13 km. The precipitation intensity is not entirely determined by the storm top height; instead, it is also closely related to other physical processes occurring in the cloud.
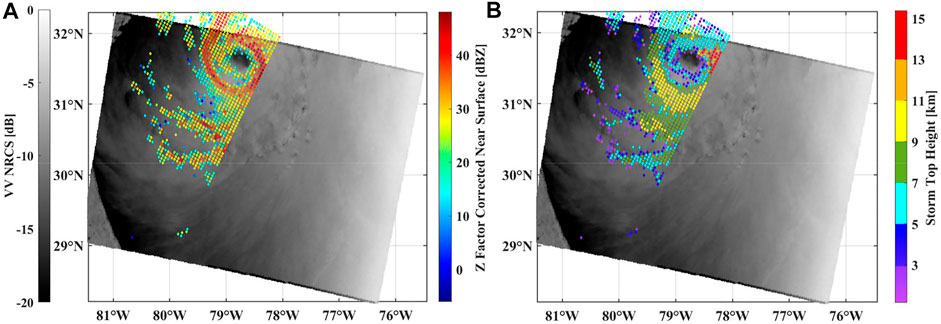
FIGURE 7. (A) Scatter plot of near-surface reflectance factor. (B) Storm top height for Hurricane Arthur.
A comparison of the precipitation types during Hurricane Arthur in Figure 4 1) show that the storm top height of convective precipitation is not always greater than that of stratiform precipitation. The storm top height of most stratiform precipitation is concentrated in the range of 5–11 km, while the distribution of convective precipitation is not concentrated but spread across all heights. In the two spiral rain belts in the southwest of the hurricane eye, the storm top height of convective precipitation was distributed between 2 and 9 km. From a comparison of the rain rate during Hurricane Arthur (Figure 1), it is seen that the rain rate in the rain cell area is concentrated at 10–30 mm/h, indicating that the generation of rain cells does not necessarily require very deep convective activities, and it may also occur when the storm top height is very low, but a certain intensity of rain rate is necessary.
The development and movement of hurricanes include complex interaction processes between the atmosphere and ocean. To accurately predict the hurricane intensity and track, it is necessary to accurately grasp the physical processes involved in TC production and development. Although a large number of studies explored hurricane, it is difficult to obtain accurate measurement data because of the wide coverage area involved and the intense movement of hurricane. Thus, the prediction of hurricane trajectory and wind intensity still remain a great challenge. The combined C-band SAR co-polarized and cross-polarized NRCS were found to enable the retrieval of hurricane winds. However, since TCs are usually accompanied by large-scale heavy precipitation activities, which will affect the measurement of SAR backscattering cross section, further analysis of the effect of precipitation is required.
In this study, by using co-located C-band SAR data, DPR precipitation data, and SFMR wind field data, we analyzed the effects of precipitation, different precipitation types, and ML distribution on wind speed retrieval. By comparing the RMSEs of the SAR-retrieved wind speeds and SFMR estimated wind speeds under different precipitation parameters, we found that the precipitation causes an increase in the wind speed retrieval error. This increasing trend is not simply positively related to rain rate but is related to other factors. The effect of convective precipitation on the retrieval error of wind speed is obviously greater than that of stratiform precipitation, which is inseparable from the fact that the rain rate of convective precipitation is usually greater than that of stratiform precipitation (M et al., 2019). Rain cells are mainly the product of convective precipitation. In the stratiform precipitation area, there are no rain cells even when the precipitation reaches a certain intensity. The ML height is used to calculate the attenuation and volume scattering parameters of the C-band SAR in the atmosphere. However, when the wind speed is less than 30 m/s and the rain rate is less than 20 mm/h, the distribution of the ML does not have a significant effect on the wind speed retrieval.
Both VV NRCS and VH NRCS increase in the rain cell area. However, because of the different sensitivities of SAR signals with VH polarization and VV polarization, the increase in the VH NRCS in the rain cell area is usually greater than that in the VV NRCS. This sensitivity is closely related to the distance between the rain cell and the hurricane center. When the rain rate is small, the difference between the SAR-retrieved wind speeds inside and outside the rain cell is about 5 m/s. After the rain rate increases, the difference between the two can reach more than 10 m/s, but this change does not follow a simple positive correlation with the rain rate. The storm top height is a parameter that characterizes the intensity of vertical motion in the cloud and the stability of the cloud; in this study, the storm top height of the convective precipitation during the hurricane was not completely higher than that of the stratiform precipitation. Rain cells can also occur at low storm top heights, but a certain rate of precipitation is necessary. More data are needed to determine this threshold.
When the rain cells are associated with the downdraft pattern, this geophysical phenomenon can be observed in the SAR of all frequency bands. However, the rain cells are not always associated with the downdraft, and precipitation may also occur in other forms, such as stratified rain, rain belt, and squall line. These different forms make it difficult to observe precipitation in SAR images. As the next step, we plan to use the co-located GPM data to mark the rainfall phenomenon in the SAR image and build a data set to train the depth learning model to identify the region containing precipitation from the SAR image. By restoring the NRCS of the precipitation area, the accuracy of the sea surface wind field retrieval can be further improved.
Although the platforms and payloads of hurricane research have increased in recent years, achieving high-resolution hurricane wind speed retrieval still remains a challenge. Precipitation is a continuous process, but the observation time of SAR for a given area is usually less than 1 min. So, it is impossible to fully describe the effect of precipitation. It is necessary to perform continuous observation and analysis of the precipitation process. The SHOC in Europe and the Hurricane Field Program in the United States provide valuable data for studying hurricanes. At present, the data of multiple load matching is not very rich, so it is necessary to carry out multi-platform joint observation. With accumulation of data, it is expected that SAR will become useful for accurately retrieving extreme weather events such as hurricanes.
The original contributions presented in the study are included in the article/supplementary material, further inquiries can be directed to the corresponding authors.
CG and WA designed the experiments; CG, SH, and XD performed the experiments; CG and NC analyzed the data; CG wrote the paper. All authors have read and agreed to the published version of the manuscript.
This research received no external funding.
We thank the Cyclobs for making the Sentinel-1 and Radarsat-2 products publicly available. We thank the National Oceanic and Atmospheric Administration for SFMR wind measurements and hurricane reports. We thank Earth Observation Research Center, Japan Aerospace Exploration Agency (JAXA/EROC) for providing the tropical cyclone database.
The authors declare that the research was conducted in the absence of any commercial or financial relationships that could be construed as a potential conflict of interest.
All claims expressed in this article are solely those of the authors and do not necessarily represent those of their affiliated organizations, or those of the publisher, the editors and the reviewers. Any product that may be evaluated in this article, or claim that may be made by its manufacturer, is not guaranteed or endorsed by the publisher.
Alpers, W., Zhang, B., Mouche, A., Zeng, K., and Chan, P. W. (2016). Rain footprints on C-band synthetic aperture radar images of the ocean - Revisited. Remote Sens. Environ. 187, 169–185. doi:10.1016/j.rse.2016.10.015
Awaka, J. (1998). Early results on rain type classification by the Tropical Rainfall Measuring Mission (TRMM) precipitation radar. China: CiNii.
Carratelli, E. P., Dentale, F., and Reale, F. (2006). Numerical pseudo-random simulation of SAR sea and wind response. Adv. SAR Oceanogr. Envisat ERS Missions 613, 35. https://www.researchgate.net/publication/234248364_Numerical_Pseudo-Random_Simulation_of_SAR_Sea_and_Wind_Response.
Donnelly, W. J., Carswell, J. R., Mcintosh, R. E., Chang, P. S., Wilkerson, J., Marks, F., et al. (1999). Revised ocean backscatter models at C and Ku band under high-wind conditions. J. Geophys. Res. 104 (5), 11485–11497. doi:10.1029/1998JC900030
Draper, D. W., and Long, D. G. (2004). Evaluating the effect of rain on SeaWinds scatterometer measurements. J. Geophys. Res. 109 (12), C02005. doi:10.1029/2002JC001741
Fang, M., He, J., Fu, Y., Zheng, P., Wang, D., et al. (2019). The precipitation structure for super typhoon Maria (1808) based on GPM satellite rainfall products. Trans. Atmos. Sci. 42 (6), 10. doi:10.13878/j.cnki.dqkxxb.20181101001
Geudtner, D., Torres, R., Snoeij, P., Davidson, M., and Rommen, B., (2014) SENTINEL-1 system capabilities and applications", in: IEEE Joint International Geoscience and Remote Sensing Symposium (IGARSS)/35th Canadian Symposium on Remote Sensing), 13-18 July 2014, Quebec City, 1457-1460.
Guan, C., Sun, J., and Zhang, J. (2021). Extreme wind speeds retrieval using sentinel-1 IW mode SAR data. Remote Sens. 13, 1867. doi:10.3390/rs13101867
Hajduch, G., Miranda, N., Piantanida, R., Meadows, P., and Franceschi, N. (2017). Thermal denoising of products generated by the S-1 IPF. MPC-0392.
Hersbach, H., Stoffelen, A., and de Haan, S. (2007). An improved C-band scatterometer ocean geophysical model function: CMOD5. J. Geophys. Res. 112 (3), C03006. doi:10.1029/2006JC003743
Hu, X., Ai, W., Qiao, J., Hu, S., Han, D., and Yan, W. (2022). Microphysics of summer precipitation over yangtze‐huai river valley region in China revealed by GPM DPR observation. Earth Space Sci. 9 (3), e2021EA002021. doi:10.1029/2021ea002021
Hu, X., Li, G. L., Zhang, C., and Yan, W. (2019). Precipitation and latent heating properties of tropical cyclone in the northwest pacific measured by gpm dpr and himawari-8. Int. Arch. Photogramm. Remote Sens. Spat. Inf. Sci. XLII-3/W9, 77–82. doi:10.5194/isprs-archives-XLII-3-W9-77-2019
Hui, S., Perrie, W., He, Y., and Liu, G. (2014). Wind speed retrieval from VH dual-polarization RADARSAT-2 SAR Images. IEEE Trans. Geosci. Remote Sens. 52 (9), 5820–5826. doi:10.1109/TGRS.2013.2293143
Hui, S., Seitz, C., Perrie, W., He, Y., and Powell, M. (2018). Developing a quality index associated with rain for hurricane winds from SAR. Remote Sens. 10 (11), 1783. doi:10.3390/rs10111783
Hwang, P. A., Zhang, B. A., Toporkov, J. V., and Perrie, W. (2010). Comparison of composite Bragg theory and quad-polarization radar backscatter from RADARSAT-2: With applications to wave breaking and high wind retrieval. J. Geophys. Res. 115, C08019. doi:10.1029/2009jc005995
Igarashi, T., and Endo, T. (2014). Status of global precipitation measurement (GPM) mission. jsprs. 53 (3), 111–117. doi:10.4287/jsprs.53.111
Le, M., and Chandrasekar, V. (2013). Precipitation type classification method for dual-frequency precipitation radar (DPR) onboard the GPM. IEEE Trans. Geosci. Remote Sens. 51 (3), 1784–1790. doi:10.1109/tgrs.2012.2205698
Long, D. G., and Nie, C. (2017). “Hurricane precipitation observed by SAR,” in Hurricane monitoring with spaceborne synthetic aperture radar. Editor X. Li (Singapore: Springer Singapore), 1–24.
Makynen, M., Manninen, T., Simila, M., Karvonen, J., and Hallikainen, M. (2002). "Incidence angle dependence of the mean C-band HH-polarization backscattering signatures of the Baltic Sea ice", in: IEEE International Geoscience and Remote Sensing Symposium), 24-28 June 2002, Toronto.
Marzano, F. S., Mori, S., and Weinman, J. A. (2010). Evidence of rainfall signatures on X-band synthetic aperture radar imagery over land. IEEE Trans. Geosci. Remote Sens. 48 (2), 950–964. doi:10.1109/tgrs.2009.2034843
Mears, C. A., Smith, D., and Wentz, F. J. (2000). "Detecting rain with QuikScat", in: IEEE International Geoscience & Remote Sensing Symposium), 24-28 July 2000, Honolulu.
Moore, R., Chaudhry, A., and Birrer, I. (1983). Errors in scatterometer-radiometer wind measurement due to rain. IEEE J. Ocean. Eng. 8 (1), 37–49. doi:10.1109/JOE.1983.1145541
Mouche, A. A., Chapron, B., Zhang, B., and Husson, R. (2017). Combined Co- and cross-polarized SAR measurements under extreme wind conditions. IEEE Trans. Geosci. Remote Sens. 55, 6746–6755. doi:10.1109/TGRS.2017.2732508
Mouche, A., Chapron, B., Knaff, J., Zhao, Y., Zhang, B., and Combot, C. (2019). Co‐ and Cross‐ polarized SAR measurements for high resolution description of major hurricane wind structures : Application to Irma category‐5 Hurricane. J. Geophys. Res. Oceans 124 (6), 3905–3922. doi:10.1029/2019JC015056
Nie, C., and Long, D. G. (2008). A C-band scatterometer simultaneous wind/rain retrieval method. IEEE Trans. Geosci. Remote Sens. 46 (11), 3618–3631. doi:10.1109/TGRS.2008.922146
Petty, G. W. (2001). Physical and microwave radiative properties of precipitating clouds. Part II: A parametric 1D rain-cloud model for use in microwave radiative transfer simulations. Am. Meteorological Soc. 40 (12), 2115–2129. doi:10.1175/1520-0450
Qiao, J., Ai, W., Hu, X., Hu, S., and Du, X. (2022a). Characteristics of melting layer in cyclones over the western north pacific detected by the GPM dual‐frequency precipitation radar. Earth Space Sci. 9 (3). doi:10.1029/2021ea001967
Qiao, J., Ai, W., Hu, X., Liu, M., and Hu, S. (2022b). An identification method of melting layer using the covariance wavelet transform based on GPM‐DPR observations. Earth Space Sci. 9 (3). doi:10.1029/2021EA002103
Qiao, J. Q., Ai, W. H., Hu, X., Hu, S. S., and Yan, W. (2021). A recognition method of hydrometeor in tropical cyclones by using the GPM dual-frequency precipitation radar. J. Trop. Meteorology 27 (2), 161–168. doi:10.46267/j.1006-8775.2021.015
Quilfen, Y., Chapron, B., Elfouhaily, T., Katsaros, K., and Tournadre, J. (1998). Observation of tropical cyclones by high-resolution scatterometry. J. Geophys. Res. 103 (C4), 767. doi:10.1029/97JC01911
Sapp, J., Alsweiss, S., Jelenak, Z., Chang, P., and Carswell, J. (2019). Stepped frequency microwave radiometer wind-speed retrieval improvements. Remote Sens. 11 (3), 214. doi:10.3390/rs11030214
Shen, H., He, Y., and Perrie, W. A. (2009). Speed ambiguity in hurricane wind retrieval from SAR imagery. Int. J. Remote Sens. 30, 2827–2836. doi:10.1080/01431160802555879
Shi, J., Hu, J., Shao, W., Wang, X., Li, X., Zhao, L., et al. (2019). The impact of rain to observed signal from Chinese Gaofen-3 synthetic aperture radar in typhoons. Acta Oceanol. Sin. 38 (11), 121–133. doi:10.1007/s13131-019-1502-7
Stoffelen, A., and Anderson, D. (1997). Scatterometer data interpretation: Estimation and validation of the transfer function CMOD4. J. Geophys. Res. 102 (C3), 5767–5780. doi:10.1029/96JC02860
Tang, G., Wei, W., Zeng, Z., Guo, X., Na, L., Di, L., et al. (2015). An overview of the global precipitation measurement (GPM) mission and it's latest development. Remote Sens. Technol. Appl.. doi:10.11873/j.issn.1004-0323.2015.4.0607
Uhlhorn, E. W., Black, P. G., Franklin, J. L., Goodberlet, M., Carswell, J., and Goldstein, A. S. (2007). Hurricane surface wind measurements from an operational stepped frequency microwave radiometer. Mon. Weather Rev. 135 (9), 3070–3085. doi:10.1175/mwr3454.1
Vachon, P. W., and Wolfe, J. (2011). C-band cross-polarization wind speed retrieval. IEEE Geosci. Remote Sens. Lett. 8 (3), 456–459. doi:10.1109/LGRS.2010.2085417
Weissman, D. E., and Bourassa, M. A. (2008). "Measurements of the effect of rain-induced sea surface roughness on the QuikSCAT scatterometer radar cross section and wind stress", in: OCEANS, 15-18 September 2008, Quebec.
Xu, F., and Li, X. (2017). “Electromagnetic scattering of rainfall and tropical cyclones over ocean,” in Hurricane monitoring with spaceborne synthetic aperture radar. Editor X. Li (Singapore: Springer Singapore), 271–298.
Xu, F., Li, X., Wang, P., Yang, J., Pichel, W. G., and Jin, Y. Q. (2014). A backscattering model of rainfall over rough sea surface for synthetic aperture radar. IEEE Trans. Geosci. Remote Sens. 53, 3042–3054. doi:10.1109/TGRS.2014.2367654
Zhang, B., and Perrie, W. (2012). Cross-polarized synthetic aperture radar: A new potential measurement technique for hurricanes. Bull. Am. Meteorol. Soc. 93 (4), 531–541. doi:10.1175/BAMS-D-11-00001.1
Zhang, B., and Perrie, W. (2013). "Recent development in SAR-derived winds using polarized RADARSAT-2 data", in: IGARSS 2013 - 2013 IEEE International Geoscience and Remote Sensing Symposium, 21-26 July 2013, Melbourne.
Zhang, B., Perrie, W., Vachon, P. W., Li, X., Pichel, W. G., Guo, J., et al. (2012). Ocean vector winds retrieval from C-band fully polarimetric SAR measurements. IEEE Trans. Geosci. Remote Sens. 50 (11), 4252–4261. doi:10.1109/TGRS.2012.2194157
Keywords: SAR, rain, global precipitation measurement, stepped frequency microwave radiometer, wind speed, NRCS, rain cells
Citation: Guo C, Ai W, Hu S, Du X and Chen N (2022) Effect of precipitation on synthetic aperture radar hurricane wind field retrieval. Front. Environ. Sci. 10:1034045. doi: 10.3389/fenvs.2022.1034045
Received: 01 September 2022; Accepted: 16 September 2022;
Published: 04 October 2022.
Edited by:
Feifei Shen, Nanjing University of Information Science and Technology, ChinaReviewed by:
Tao Xie, Nanjing University of Information Science and Technology, ChinaCopyright © 2022 Guo, Ai, Hu, Du and Chen. This is an open-access article distributed under the terms of the Creative Commons Attribution License (CC BY). The use, distribution or reproduction in other forums is permitted, provided the original author(s) and the copyright owner(s) are credited and that the original publication in this journal is cited, in accordance with accepted academic practice. No use, distribution or reproduction is permitted which does not comply with these terms.
*Correspondence: Weihua Ai, YXdoempheEAxMjYuY29t
Disclaimer: All claims expressed in this article are solely those of the authors and do not necessarily represent those of their affiliated organizations, or those of the publisher, the editors and the reviewers. Any product that may be evaluated in this article or claim that may be made by its manufacturer is not guaranteed or endorsed by the publisher.
Research integrity at Frontiers
Learn more about the work of our research integrity team to safeguard the quality of each article we publish.