 Ping Wang
 Raisa N. Shpakova
- 1Key Laboratory of Water Cycle and Related Land Surface Processes, Institute of Geographic Sciences and Natural Resources Research, Chinese Academy of Sciences, Beijing, China
- 2College of Resources and Environment, University of Chinese Academy of Sciences, Beijing, China
- 3Moscow State Institute of International Relations (MGIMO), Moscow, Russia
The climate is warming much faster than the global average at the northern mid–high latitudes, leading to intensified hydrological cycles. However, it is unclear whether the response of streamflow to climate change is uniform across river basins with areas of 104–105 km2. In this study, monthly streamflow data from five river basins (Bol’shoy Patom, Chara, Olekma, Timpton, and Uchur) and gridded monthly temperature and precipitation data from the Russian South Yakutia at 53.5–61.5°N were analysed to investigate changes in their annual streamflow from 1934 to 2019 and their responses to climate warming. The results showed significant increasing trends in air temperature for all five basins at rates of 0.20°C–0.22°C/decade (p < 0.001), with faster warming after the 1980s. Apart from the Uchur River Basin, increasing trends in annual precipitation were observed in the other four river basins at rates of 9.3–15.7 mm/decade (p < 0.01). However, temporal changes in streamflow were much more complex than those in air temperature and precipitation among the five basins. Only two of the five basins showed significant increasing trends in annual streamflow with change rates of 17.1 mm/decade (p < 0.001) for the Chara River and 7.7 mm/decade (p < 0.05) for the Olekma River. Although the other three basins showed slightly increasing trends in annual streamflow (1.8–4.0 mm/decade), these trends did not pass significance tests (p > 0.05). By analysing the temperature-precipitation-streamflow relationships, we determined that the annual streamflow positively responds to precipitation, while winter streamflow is most sensitive to temperature. With climate warming, the streamflow during the winter period (October-April) increased significantly in four of the five river basins at rates of 1.4–3.1 mm/decade (p < 0.001), suggesting that warming-induced permafrost thawing increases baseflow. Although the streamflow response of large Siberian rivers to climate change is consistent, our results suggest that the streamflow response to climate change in relatively small river basins (104–105 km2) is much more complex.
1 Introduction
Climate warming is accelerating global water cycles (Huntington, 2006; Oki and Kanae, 2006). In the high latitudes of the Northern Hemisphere, the rate of temperature warming is greater than the global average, which is known as Arctic amplification (Francis et al., 2017; Dai et al., 2019; Previdi et al., 2020; England et al., 2021). Recent studies have detected that Arctic temperatures increased four times faster than the global mean during the first two decades of the 21st century (Chylek et al., 2022), which is considerably more rapid than previous studies have shown. As a result of climate warming, the streamflow of Arctic rivers has increased significantly during the past decades (Peterson et al., 2002; Feng et al., 2021; Shiklomanov et al., 2021). In particular, the streamflow of the Lena River in eastern Siberia, one of the largest Arctic rivers, increased by approximately 22% during the period of 1936–2019 (Wang et al., 2021a).
Increases in river streamflow in Arctic river basins are strongly associated with increased precipitation and enhanced snow melting (Yang et al., 2002). Other studies have shown that the intensification of precipitation due to a warming climate was the main contributor to streamflow increases in permafrost-dominated basins (Wang et al., 2021a). Recent studies have found that the rates of increase in both air temperature and precipitation were greater in permafrost areas than in non-permafrost areas (Wang et al., 2021b; Wang et al., 2022a). Furthermore, the contribution of groundwater from thawing permafrost to streamflow in permafrost-dominated basins is likely to increase in the context of global warming (Lamontagne-Hallé et al., 2018; Jin et al., 2022; Liu et al., 2022). Therefore, the streamflow response to climate warming in permafrost-dominated basins will be more pronounced (Wang et al., 2021a).
Yakutia in eastern Siberia (Russia) has an extreme and severe climate, and the region is largely covered by continuous permafrost. During the period 1966–2016, the air temperature at 26 meteorological stations in Yakutia increased at rates of 0.3°C–0.6°C per decade, with a maximum warming rate in winter and a minimum warming rate in summer (Gorokhov and Fedorov, 2018). Additionally, the annual precipitation in this region also increased during 1966–2016, which was likely associated with the rise in air temperature (Gorokhov and Fedorov, 2018). As noted by Mekonnen et al. (2021), increases in precipitation and rises in surface air temperature comparably contribute to permafrost degradation in a warmer climate, leading to increases in the groundwater discharge to streamflow from the thawing permafrost (Wang et al., 2021a). Other studies also indicated that this region has experienced rapid climate warming since the late 1980s, leading to fast thermokarst processes (Pestryakova et al., 2012; Tarasenko, 2013) and notable increases in streamflow (Shpakova, 2021).
However, precipitation in Yakutia shows spatially complex trends. The greatest increases in precipitation were in the mountain-taiga regions of southern Yakutia, while the precipitation in the tundra landscapes of Yakutia showed negative trends (Gorokhov and Fedorov, 2018). Moreover, permafrost temperature and active-layer thickness in Yakutia also vary considerably in space and are dominated by the climatic gradient and soil type distribution (Beer et al., 2013). How streamflow in permafrost-dominated river basins responds to changes in temperature and precipitation along a climatic gradient is not fully understood. In addition, recent studies have found that the winter streamflow increased much faster than the annual streamflow in the permafrost-dominated upper river basins of Siberia (Panyushkina et al., 2021). Liu et al. (2022) further revealed uneven increases in streamflow during early, mid- and late winter across four large Arctic river basins. Winter streamflow in permafrost-dominated river basins is primarily recharged by the groundwater (Wang et al., 2021a; Liu et al., 2022), therefore, recent increases in winter streamflow likely reflect permafrost degradation under climate warming. Nevertheless, it remains unclear how the fast changes in winter streamflow and the changes in climate affect winter streamflow variations in relatively small, permafrost-dominated river basins (104–105 km2).
To address the above-mentioned issues, we selected five river basins with areas ranging from 2.76 × 10⁴ km2 to 11.5 × 10⁴ km2 along a climatic gradient (i.e., air temperature and precipitation gradients) from west to east in the Russian South Yakutia (Figure 1). The objectives of this study were to 1) detect the temporal changes in climate and streamflow across the five river basins in the Russian South Yakutia during the past several decades, and 2) reveal the various responses of annual and winter streamflow in permafrost-dominated river basins to changes in temperature and precipitation along a climatic gradient.
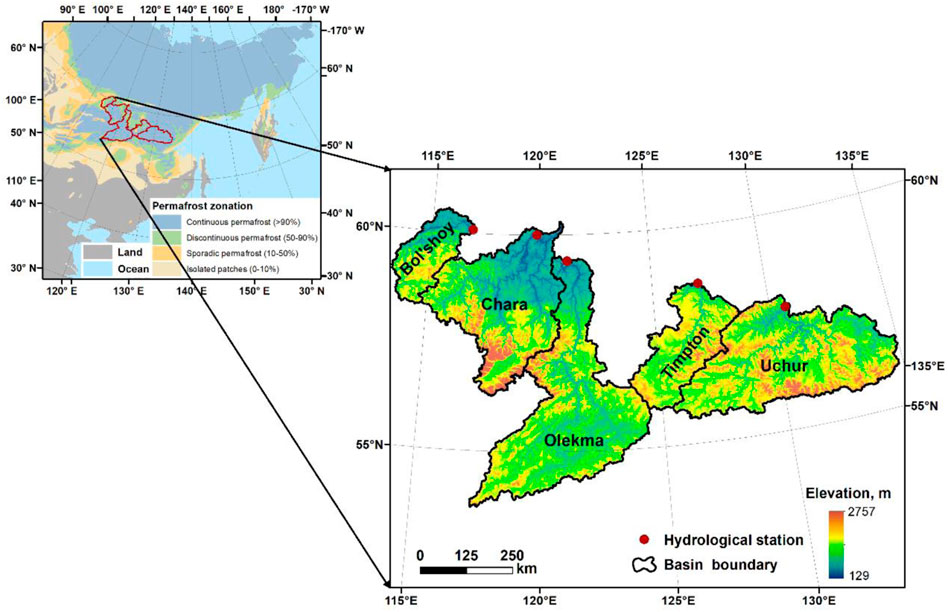
FIGURE 1. Locations of the five eastern Russian river basins (i.e., Bol’shoy Patom, Chara, Olekma, Timpton, and Uchur from west to east) along with permafrost (upper-left) (Brown et al., 2002) and elevation (low-right) (USGS, 1996) maps.
2 Materials and methods
2.1 Study area
Five river basins in South Yakutia, Russia, including Bol’shoy Patom, Chara, Olekma, Timpton, and Uchur, were selected for investigation in this study. The Bol’shoy Patom is the 11th longest tributary of the Lena River and has a length of approximately 570 km and a drainage basin area of 2.76 × 10⁴ km2 (Smith et al., 2007). The Chara is a tributary that flows into the Lena River; it is 850 km long and has a drainage basin area of 6.25 × 10⁴ km2 (Barinova et al., 2018). The Olekma, where the Kudu-Kyuel hydrological station is located, is one of the major tributaries of the Lena River in eastern Siberia (Tananaev et al., 2016). The Olekma is approximately 1,436 km long and has a drainage basin area of 11.5 × 10⁴ km2. The Timpton River is a right tributary of the Aldan River in the Lena Basin and has a length of 644 km and a drainage area of 4.37 × 10⁴ km2 (Nogovitsyn et al., 2013). The Uchur River is another right tributary of the Aldan River of the Lena Basin and has a length of 812 km and a drainage area of 10.8 × 10⁴ km2 (Vinogradov et al., 2011). The characteristics of these five river basins are listed in Table 1.
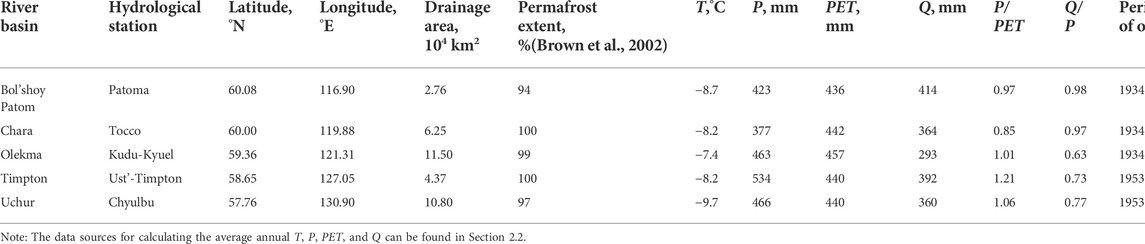
TABLE 1. Average annual temperature (T), precipitation (P), potential evapotranspiration (PET), and streamflow (Q) for the five river basins in South Yakutia, Russia.
2.2 Data sources
Long-term monthly river discharge (Q) data at five hydrological stations (Table 1) were obtained from the Russian Federal Service for Hydrometeorology and Environmental Monitoring (Roshydromet, https://www.meteorf.gov.ru/). The river discharge data for the Bol’shoy Patom, Chara, and Olekma Rivers spanned from 1934 to 2019, and such data for the Timpton and Uchur Rivers spanned from 1953 to 2019.
Monthly average temperature (T) data on a 0.5° × 0.5° grid (period: 1934–2019; https://crudata.uea.ac.uk/cru/data/hrg/) were obtained from the Climate Research Unit time series (CRU TS) v. 4.05 (Harris et al., 2020). Monthly precipitation (P) data from 1934 to 2019 with a 0.25° grid resolution were acquired from the Global Precipitation Climatology Center (GPCC; https://psl.noaa.gov/data/gridded/data.gpcc.html) (Schneider et al., 2020). The monthly gridded temperature data from the CRU and precipitation data from the GPCC were previously validated by Wang et al. (2021a) with observed data from the 167 meteorological stations located across the Siberian river basins. Additionally, potential evapotranspiration (PET) from the CRU (Harris et al., 2020), which is calculated using the Penman‒Monteith formula (Allen et al., 1998), was used for estimating the amount of evapotranspiration that would occur if a sufficient water source were available.
The permafrost distribution was taken from the Circum-Arctic Map of Permafrost and Ground-Ice Conditions (Version 2) (Brown et al., 2002). Digital elevation model (DEM) data were obtained from the global 30 arc-second elevation (GTOPO30) by the United States Geological Survey (USGS, 1996).
2.3 Method
Following the methods of Risbey and Entekhabi (1996) and Fu et al. (2007), the annual departures for streamflow (
where a is the intercept of the regression line, and
As proposed by Wang et al. (2021a), the precipitation and temperature departures are divided by their corresponding standard deviations for comparing equivalent streamflow–precipitation–temperature relationships among different basins. Then, the results of the above-mentioned calculations are plotted on a precipitation-temperature plane to demonstrate the streamflow–precipitation–temperature relationship. This approach can be applied to identify streamflow responses to climate change during particular periods (e.g., winter season, low flow periods) (Liu et al., 2022).
A simple linear regression model is used to examine the multiyear trends in Q, T, P, and PET with time, and p value thresholds for claiming statistical significance of 0.05, 0.01, and 0.001 are calculated to determine the significance level of the regression result using a t-test (Köhne and Pigeot, 1995). Additionally, breakpoints in a time series of Q, T, P, and PET are detected by the Pettitt test, which relies on the non-parametric Mann-Whitney U-test (Pettitt, 1979).
3 Results and discussion
3.1 Changes in climate
The average annual air temperatures in the five basins of Bol’shoy Patom, Chara, Olekma, Timpton, and Uchur were −8.7°C, −8.2°C, −7.4°C, −8.2°C, and −9.7°C, respectively, during the 1934–2019 period. The maximum monthly air temperature occurs in July, while the minimum values occur in January (Figure 2A). During the months of October to the following April, the multiyear average monthly air temperature is less than 0°C, which can be considered the winter period. During the months from May to September, the multiyear average monthly air temperature is greater than 0°C, which can be considered the non-winter period.
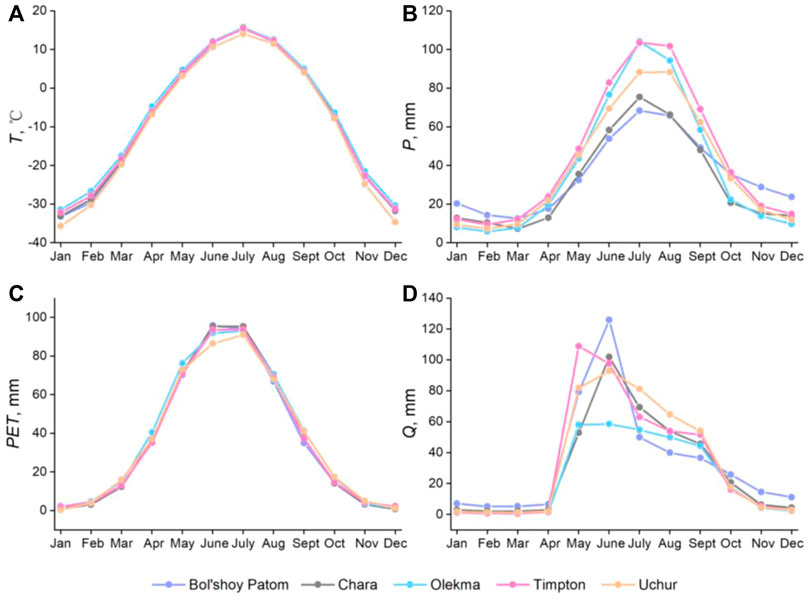
FIGURE 2. Multiyear monthly (A) temperature (T), (B) precipitation (P), (C) potential evapotranspiration (PET), and (D) streamflow (Q) in the Bol’shoy Patom, Chara, Olekma, Timpton, and Uchur river basins.
As shown in Figure 3A and Table 2, all five river basins experienced notable warming trends over the past 86 years (1934–2019), with temperature change rates of 0.20°C–0.22°C/decade (p < 0.001). These change rates are slightly lower than the rate of change in temperature for the entire Lena River Basin from 1936 to 2019 (0.25°C/decade), as estimated by Wang et al. (2021a). This result probably occurs because all five subbasins are in the southern Lena River Basin, where the average annual temperature is higher than the average temperature of the entire Lena River Basin. According to the hypothesis that “the colder the place is, the faster the warming” (Wang et al., 2022a), the warming rates in these five basins are slightly slower than that for the entire Lena River Basin.
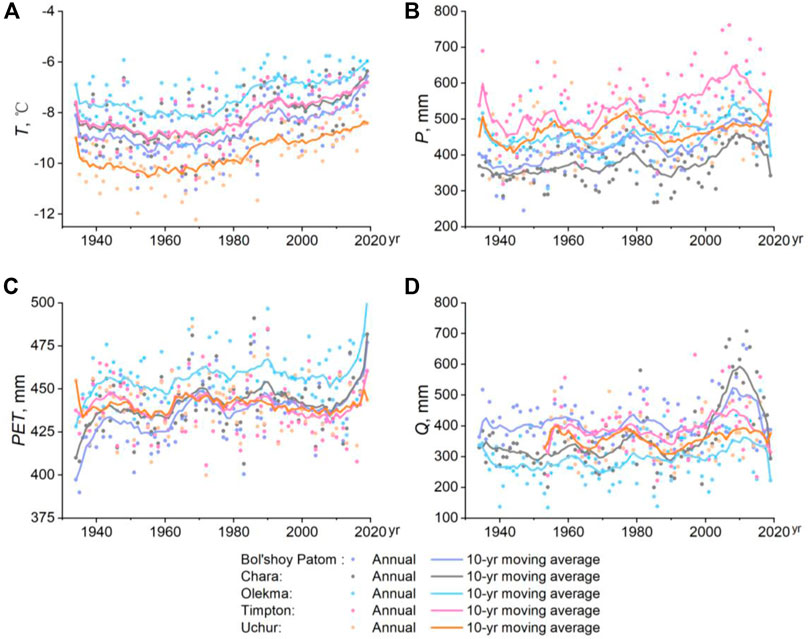
FIGURE 3. Time series of (A) temperature (T), (B) precipitation (P), (C) potential evapotranspiration (PET), and (D) streamflow (Q) in the Bol’shoy Patom, Chara, Olekma, Timpton, and Uchur river basins.
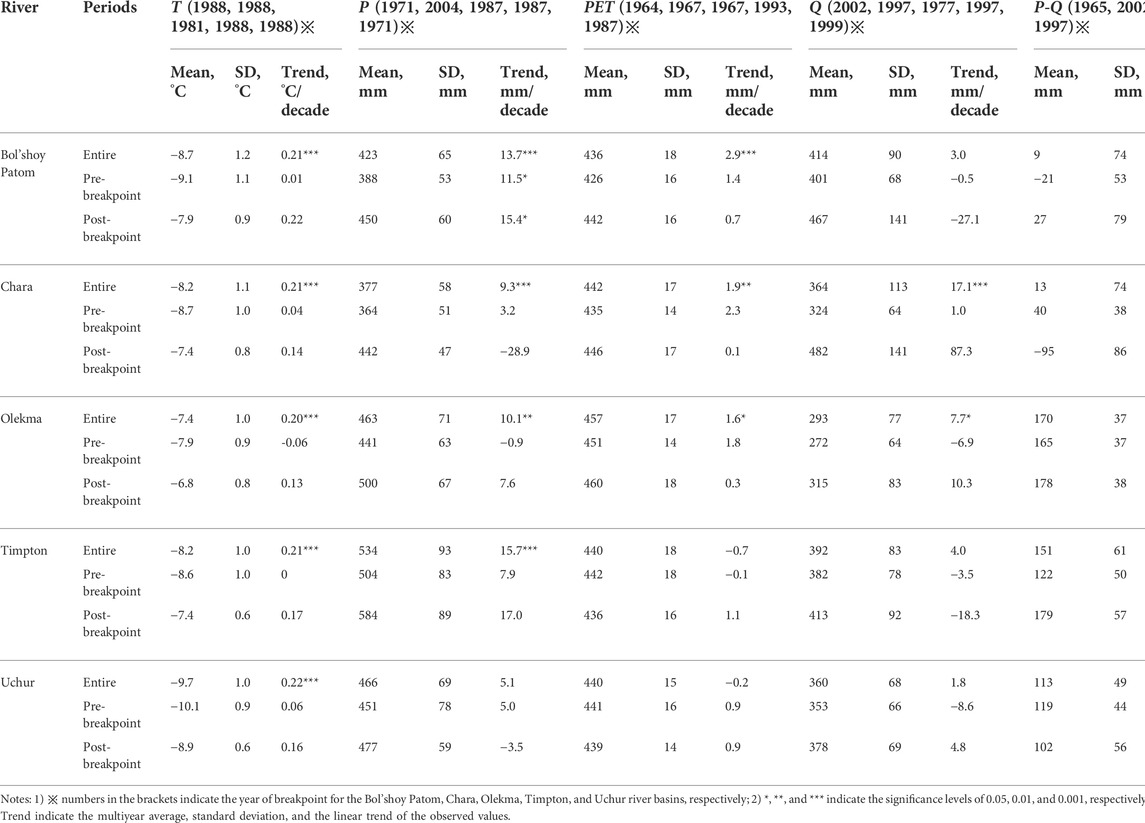
TABLE 2. Pettitt breakpoint test (Pettitt, 1979) and statistical characteristics of climatic and hydrological components.
A single change point in the annual air temperature based on Pettitt (1979) breakpoint detection was found in 1981 for the Olekma River Basin, and another was found in 1988 for the other four river basins. Prior to the change point, the annual air temperatures did not show notable trends, while afterwards, they started to increase. During the last three decades, the air temperature warmed by 0.5°C–0.7°C in the five selected river basins. This result is consistent with the global temperature change pattern; that is, global temperatures began to warm significantly in the 1980s (Hansen et al., 2006). However, the climate warming was not uniform, and faster warming was observed in the colder regions, for example, the Arctic has warmed nearly four times faster than the globe over 1979–2021 (Rantanen et al., 2022).
The multiyear average annual precipitation values were different among the five river basins. The Chara River Basin had the least annual precipitation (377 mm), while the Timpton River Basin had the greatest annual precipitation (534 mm). The multiyear average annual precipitation in the Bol’shoy Patom, Olekma, and Uchur river basins were 423, 463, and 466 mm, respectively. Seasonally, the maximum monthly precipitation in the five river basins occurred in July-August and the minimum monthly precipitation occurred in February-March (Figure 2B). The maximum monthly precipitation in July occurred in four river basins (Bol’shoy Patom, Chara, Olekma, and Timpton), and the maximum monthly precipitation in August occurred in the Uchur River Basin. Two river basins, namely, Bol’shoy Patom and Chara, had the lowest monthly precipitation in March, while the other three basins of Olekma, Timpton and Uchur had the lowest monthly precipitation in February.
Precipitation during the warm period (May-September) in the five river basins accounted for more than 2/3 of the annual precipitation. Although the precipitation during the non-winter period in the Bol’shoy Patom River basin was less than that in the other four river basins, the opposite was true during the cool period, especially from November to March (Figure 2B). Except for the Uchur River Basin, the other four river basins showed notable increasing trends in annual precipitation during 1934–2019 (Figure 3B). The Timpton River Basin had the fastest rate of increase at approximately 15.7 mm/decade, followed by the Bol’shoy Patom, Olekma, and Chara river basins, with change rates of 13.7 mm/decade, 10.1 mm/decade, and 9.3 mm/decade, respectively (Table 2). The annual precipitation in the Uchur River Basin did not show a significant change trend (p > 0.05). Different from the air temperature, the change points in annual precipitation amounts for the five river basins occurred between 1971 and 2004 (Table 2). This result indicated that temperature warming is consistent across Siberia (Wang et al., 2022a), while the changes in precipitation are more complex (Wang et al., 2021b).
The multiyear average PET values in the five basins were quite close, ranging from 436 to 457 mm. The monthly distribution of PET during the year was similar to that of temperature, with the maximum values of PET occurring in June-July and the minimum values occurring in December-January (Figure 2C). PET during the non-winter periods accounted for more than 80% of the annual PET. A previous study (Tang and Tang, 2021) observed that PET increased in the Lena River Basin from 1975 to 2014; this occurrence was mainly attributed to changes in meteorological variables such as air temperature, net radiation, wind speed, and vapor pressure deficit. At the subbasin scales of the Lena River Basins, only the Bol’shoy Patom, Chara, and Olekma river basins experienced increasing trends in PET during 1934–2019, while the remaining two river basins did not show significant changes in PET (p > 0.05) (Figure 3C; Table 2).
3.2 Changes in streamflow
The multiyear average annual streamflow varies significantly among the five river basins. The Bol’shoy Patom River Basin has the highest annual streamflow of 414 mm, followed by the Timpton, Chara, Uchur, and Olekma river basins, with annual streamflow of 392, 364, 360, and 293 mm, respectively. The annual streamflow in the Chara and Olekma river basins showed increasing trends with rates of 17.1 mm/decade (p < 0.001) and 7.7 mm/decade (p < 0.05), respectively, while the other three river basins did not show significant changes in annual streamflow (p > 0.05) (Figure 3D; Table 2). It is worth noting, however, that the Timpton River Basin, which has the highest annual precipitation (534 mm) and the fastest increase in precipitation (15.7 mm/decade), does not have the largest annual streamflow and a significant increase in annual streamflow (p > 0.05). In contrast, the Chara River Basin, which has the least precipitation (377 mm), has the fastest increase in annual streamflow (17.1 mm/decade).
The streamflow during the warm period (May-September) in the five river basins accounts for more than 80% of the total annual streamflow (Figure 2D), especially in the Olekma, Timpton, and Uchur river basins, where the warm period streamflow accounts for more than 90% of the annual streamflow. The maximum streamflow during the non-winter periods is 366 mm in the Timpton River, followed by the Uchur, Bol’shoy Patom, and Chara rivers with 333, 332, and 324 mm, respectively. The Olekma River has the smallest streamflow of approximately 265 mm during the warm period. Streamflow during the winter period (October-April) in the Bol’shoy Patom, Chara, Olekma, Timpton, and Uchur rivers are 76, 42, 29, 28, and 30 mm, respectively (Table 3).
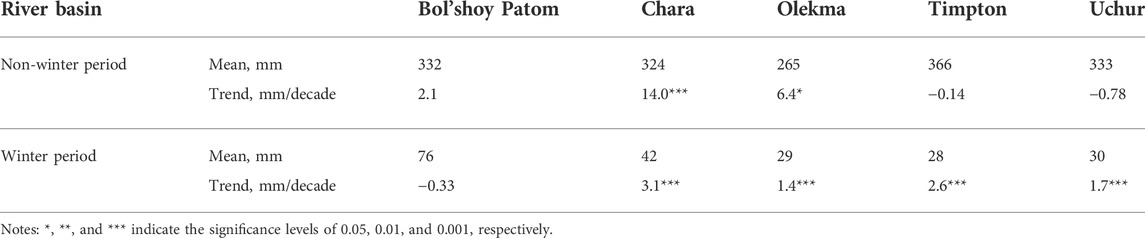
TABLE 3. Statistical characteristics of winter and non-winter period streamflow for the five eastern Russian river basins.
Although the streamflow during cold winter seasons accounts for only 7%–19% of the annual streamflow, winter streamflow in four of the five river basins shows increasing trends with rates of 1.4–2.6 mm/decade (p < 0.001). This result is consistent with those of previous studies, which found that cold season low-flow increases over most of the pan-Arctic rivers (Rennermalm et al., 2010). In contrast, during the warm non-winter period, streamflow in only two of five river basins show increasing trends with a significance level of p < 0.05. As noted by Walvoord et al. (2012) and Liu et al. (2022), streamflow during cold winter seasons is derived mainly from baseflow due to climate-driven permafrost thaw.
Increased winter streamflow reveals that baseflow is increasing under a warming climate. Recent studies have indicated that accelerated permafrost warming and widespread forest fires in South Siberia are the two major drivers for increasing winter streamflow (Panyushkina et al., 2021). In continuous permafrost-dominated river basins, permafrost thaw is altering terrestrial hydrological processes by increasing the active-layer thickness and extending recession flow durations (Feng et al., 2022). Additionally, climate warming is leading to a notable shift towards early spring high-flow events on permafrost-dominated Siberian rivers (Gautier et al., 2018; Melnikov et al., 2019; Song et al., 2020). Furthermore, the frequency and magnitude of extremely high streamflow in the permafrost-dominated river basins will be significantly increased under a warming climate (Gusev et al., 2019).
3.3 Response of streamflow to climate change
Our results show that changes in Q are highly sensitive to changes in P but less sensitive to changes in T in the Bol’shoy Patom, Olekma, Timpton, and Uchur river basins (Figures 4A,G,J,M). In particular, for the Chara and Olekma river basins, a 1% increases in precipitation would result in an approximately 1.5% increase in annual streamflow (Table 4). In contrast, changes in winter streamflow (Qwin) are sensitive to changes in both P and T for these permafrost-dominated river basins (Figures 4B,E,H,K,N), which indicates that winter streamflow is particularly sensitive to climate warming in basins with permafrost. As shown in Table 4, a 1°C increase in temperature will likely lead to a 0.1%–0.16% increase in winter streamflow, except in the Bol’shoy Patom River Basin. In addition, as the winter baseflow in permafrost-dominated regions is dominated by groundwater (St. Jacques and Sauchyn, 2009), streamflow during low flow periods from February to March (Q low flow) is even more sensitive to changes in T for the Bol’shoy Patom, Timpton, and Uchur river basins (Figures 4C,L,O; Table 4), which can be attributed to the enhanced groundwater recharge to rivers via permafrost thawing (Brabets and Walvoord, 2009; Evans et al., 2020; O'Donnell et al., 2012). For the Chara River basin, the responses of Q, Qwin, and Q low flow to changes in T and P are quite similar (Figures 4 D‐F).
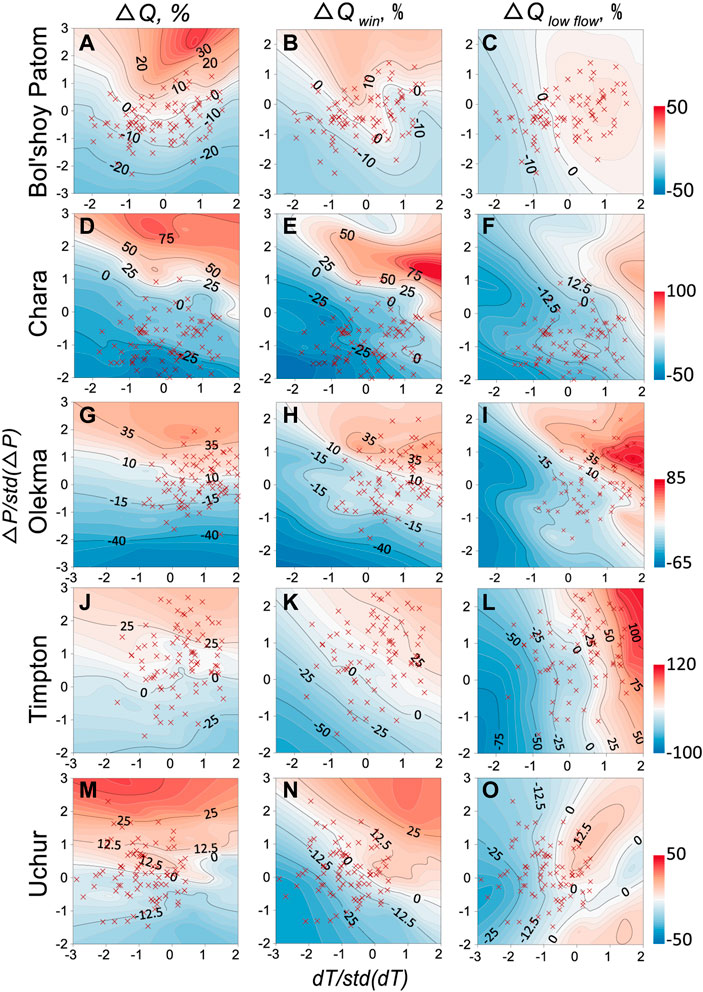
FIGURE 4. Contour plots of annual changes in annual streamflow (Q), winter streamflow (Qwin), and baseflow-dominated low flow (Q low flow) as functions of annual changes in precipitation (P) and temperature (T) for the Bol’shoy Patom (A–C), Chara (D–F), Olekma (G–I), Timpton (J–L) and Uchur (M–O) river basins, respectively. The “×” symbols represent the observed streamflow on a precipitation-temperature plane, based on which the contour lines are constructed by the Kriging interpolation method (Oliver and Webster, 1990). Q is the observed annual streamflow, and
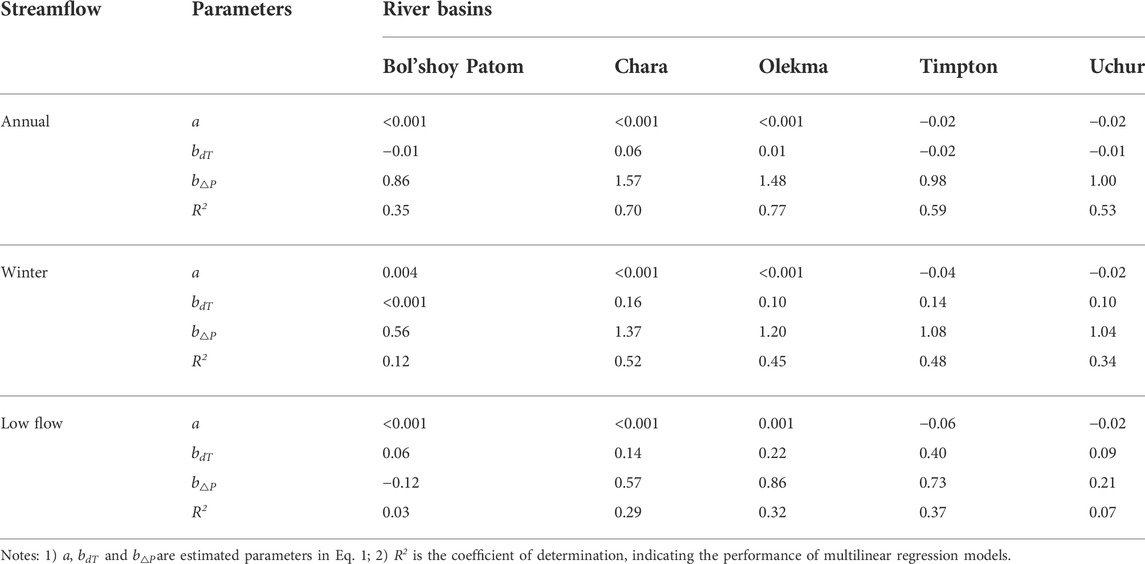
TABLE 4. Impacts of climate change on the streamflow estimated by Eq. 1.
Previous studies indicated that intensified precipitation is a predominant contributor to increased annual streamflow for Siberian rivers. However, at sub-basin scales, we note that the rate of increase in streamflow (17.1 mm/decade) was much greater than the rate of increase in precipitation (9.3 mm/decade) for the Chara River basin. These results suggest that increase in permafrost thawing-induced baseflow are likely the other important contributor to increased streamflow in permafrost-dominated river basins (Song et al., 2020; Wang et al., 2021a; Jin et al., 2022). Therefore, in addition to precipitation, annual streamflow in the Chara River Basin also increases with increased temperature (Figure 4D) at a rate of 0.06%/°C (Table 4).
Furthermore, despite the lowest annual Qwin (<30 mm) in the Olekma and Timpton river basins among these basins, the groundwater-dominated Qlow flow exhibits significant changes with temperature, which is even more notable than changes in Q with precipitation (Figures 4G,I,J,L). The differences in the warming impacts on low flows are likely related to the basin conditions, e.g., permafrost extent, groundwater recharge, and hydrological connectivity (Liu et al., 2022). In addition, changes in vegetation caused by climate change and permafrost degradation (Jin et al., 2021; Shi et al., 2021; Wang et al., 2022b; Shi et al., 2022) and a decrease in the thickness of ice cover in small and medium rivers (Dzhamalov et al., 2012) may be other important factors contributing to differences in streamflow response among the five river basins to climate change. Notably, the warming in permafrost regions is faster than that in the non-permafrost regions (Wang et al., 2022a). Thus, the response of winter streamflow in permafrost-dominated regions to climate warming is likely to become stronger in the future. To improve our ability to predict the response of streamflow to climate warming in permafrost-dominated regions, more efforts such as conducting long-term field monitoring and developing flexible permafrost hydrology models are required (Walvoord and Kurylyk, 2016; Gao et al., 2021).
4 Conclusion
In this study, we examined the changes in the annual, winter and low-flow streamflow of five river basins with areas of 104–105 km2 in the Russian South Yakutia from 1934 to 2019. Furthermore, we attempted to assess the potential impacts of climate change on streamflow in such permafrost-dominated river basins. Although streamflow for large Siberian rivers has experienced significant increasing trends over the past decades (Wang et al., 2021a), our results revealed that the annual streamflow for only two of the five river basins showed increasing trends during the past several decades. This indicated that changes in streamflow for relatively small river basins (from 104 to 105 km2) were more complex. As noted by Han and Menzel (2022), precipitation likely plays a predominant role in controlling the water availability in southern Siberian basins at the decadal scale. Our analysis of the temperature-precipitation-streamflow relationships confirmed that changes in annual streamflow are strongly associated with precipitation, which varies widely in space and time. Particularly, precipitation was positively correlated with streamflow with a lag of 0–2 months during the summer months in the Siberian Lena River Basin (Yang et al., 2002).
Furthermore, all the river basins experienced uniform climate warming at rates of 0.20°C–0.22°C/decade during the past 86 years. Climate warming is accelerating permafrost thawing, which leads to an increased baseflow via enhanced, deeper subsurface flow paths and intensified surface water-groundwater interactions (St. Jacques and Sauchyn, 2009). This is evidenced by the increasing trends in streamflow during winter periods from October to April. In addition, degradation of continuous permafrost sustains a water-rich surface condition and leads to a prominent shift from a snow-fed runoff regime to a snow-rainfall-fed regime during the rainy season (Han and Menzel, 2022). Conversely, in lake-rich cold regions, permafrost thaw is leading to a widespread surface water decline (Webb et al., 2022). Therefore, the impact of permafrost degradation on streamflow is extremely complex. Under a warm climate, permafrost is thawing globally (Biskaborn et al., 2019; Smith et al., 2022), which drives progressively deeper subsurface flow paths. As noted by McKenzie et al. (2021), groundwater processes in permafrost-dominated regions are becoming increasingly important catalysts of hydrological and environmental changes.
It is worthy to note, in addition to climate, many other factors, such as changes in vegetation, surface water–groundwater interactions, wildfire, and human intervention are also responsible for changes in streamflow (Loiselle et al., 2020; Han and Menzel, 2022; Shi et al., 2022). Therefore, further observations of climate, permafrost, vegetation and hydrology in sparsely monitored regions is needed to fully understand the responses of streamflow to climate and environmental changes. In addition to field observations, more effort should be focused on developing mathematical models of nonlinear freeze-thaw processes under different climate and permafrost conditions (Lamontagne-Hallé et al., 2020; Gao et al., 2022; Guo et al., 2022).
Data availability statement
The original contributions presented in the study are included in the article/supplementary material, further inquiries can be directed to the corresponding author.
Author contributions
Formal analysis, PW; Investigation, PW and RS; Writing—original draft, PW; Conceptualization, PW; Data curation, PW and RS; Writing—review and editing, PW and RS; Funding acquisition, PW. All authors have read and agreed to the published version of the manuscript.
Funding
The study was funded by grant from the National Natural Science Foundation of China (NSFC) (No. 42061134017).
Acknowledgments
The authors thank Shiqi Liu, Qiwei Huang, and Dan Chen for data processing and analysis. The authors gratefully acknowledge the Handling Editor, Shengping He, and two reviewers for their valuable comments and suggestions that have led to the substantial improvement of the earlier version of this manuscript.
Conflict of interest
The authors declare that the research was conducted in the absence of any commercial or financial relationships that could be construed as a potential conflict of interest.
Publisher’s note
All claims expressed in this article are solely those of the authors and do not necessarily represent those of their affiliated organizations, or those of the publisher, the editors and the reviewers. Any product that may be evaluated in this article, or claim that may be made by its manufacturer, is not guaranteed or endorsed by the publisher.
References
Allen, R. G., Pereira, L. S., Raes, D., and Smith, M. (1998). Rome: Crop evapotranspiration – Guidelines for computing crop water requirements. Irrigation and drainage paper, No. 56.
Barinova, S., Gabyshev, V. A., and Gabysheva, O. (2018). Climate impact on freshwater biodiversity: General patterns in extreme environments of north-eastern Siberia (Russia). Int. J. Environ. Clim. Change 4 (4), 423–443. doi:10.9734/bjecc/2014/9530
Beer, C., Fedorov, A. N., and Torgovkin, Y. (2013). Permafrost temperature and active-layer thickness of Yakutia with 0.5-degree spatial resolution for model evaluation. Earth Syst. Sci. Data 5 (2), 305–310. doi:10.5194/essd-5-305-2013
Biskaborn, B. K., Smith, S. L., Noetzli, J., Matthes, H., Vieira, G., Streletskiy, D. A., et al. (2019). Permafrost is warming at a global scale. Nat. Commun. 10 (1), 264. doi:10.1038/s41467-018-08240-4
Brabets, T. P., and Walvoord, M. A. (2009). Trends in streamflow in the yukon river basin from 1944 to 2005 and the influence of the pacific decadal oscillation. J. Hydrology 371 (1), 108–119. doi:10.1016/j.jhydrol.2009.03.018
Brown, J., Ferrians, O., Heginbottom, J. A., and Melnikov, E. (2002). Circum-arctic map of permafrost and ground-ice conditions. Version 2. Boulder, Colorado USA: NSIDC: National Snow and Ice Data Center.
Chylek, P., Folland, C., Klett, J. D., Wang, M., Hengartner, N., Lesins, G., et al. (2022). Annual mean arctic amplification 1970–2020: Observed and simulated by CMIP6 climate models. Geophys. Res. Lett. 49 (13), e2022GL099371. doi:10.1029/2022gl099371
Dai, A., Luo, D., Song, M., and Liu, J. (2019). Arctic amplification is caused by sea-ice loss under increasing CO2. Nat. Commun. 10 (1), 121. doi:10.1038/s41467-018-07954-9
Dzhamalov, R. G., Krichevets, G. N., and Safronova, T. I. (2012). Current changes in water resources in Lena River basin. Water Resour. 39 (2), 147–160. doi:10.1134/s0097807812020042
England, M. R., Eisenman, I., Lutsko, N. J., and Wagner, T. J. W. (2021). The recent emergence of arctic amplification. Geophys. Res. Lett. 48 (15), e2021GL094086. doi:10.1029/2021gl094086
Evans, S. G., Yokeley, B., Stephens, C., and Brewer, B. (2020). Potential mechanistic causes of increased baseflow across northern Eurasia catchments underlain by permafrost. Hydrol. Process. 34 (11), hyp.13759–2690. doi:10.1002/hyp.13759
Feng, D., Gleason, C. J., Lin, P., Yang, X., Pan, M., and Ishitsuka, Y. (2021). Recent changes to Arctic river discharge. Nat. Commun. 12 (1), 6917. doi:10.1038/s41467-021-27228-1
Feng, X., Duan, L., Kurylyk, B. L., and Cai, T. (2022). Impacts of permafrost thaw on streamflow recession in a discontinuous permafrost watershed of northeastern China. Sci. Total Environ. 847, 157624. doi:10.1016/j.scitotenv.2022.157624
Francis, J. A., Vavrus, S. J., and Cohen, J. (2017). Amplified arctic warming and mid‐latitude weather: New perspectives on emerging connections. WIREs Clim. Change 8 (5), e474. doi:10.1002/wcc.474
Fu, G., Charles, S. P., and Chiew, F. H. S. (2007). A two-parameter climate elasticity of streamflow index to assess climate change effects on annual streamflow. Water Resour. Res. 43 (11). doi:10.1029/2007wr005890
Gao, H., Han, C., Chen, R., Feng, Z., Wang, K., Fenicia, F., et al. (2022). Frozen soil hydrological modeling for a mountainous catchment northeast of the Qinghai–Tibet Plateau. Hydrol. Earth Syst. Sci. 26 (15), 4187–4208. doi:10.5194/hess-26-4187-2022
Gao, H., Wang, J., Yang, Y., Pan, X., Ding, Y., and Duan, Z. (2021). Permafrost hydrology of the qinghai-tibet plateau: A review of processes and modeling. Front. Earth Sci. (Lausanne). 8. doi:10.3389/feart.2020.576838
Gautier, E., Dépret, T., Costard, F., Virmoux, C., Fedorov, A., Grancher, D., et al. (2018). Going with the flow: Hydrologic response of middle Lena River (Siberia) to the climate variability and change. J. Hydrology 557, 475–488. doi:10.1016/j.jhydrol.2017.12.034
Gorokhov, A. N., and Fedorov, A. N. (2018). Current trends in climate change in Yakutia. Geogr. Nat. Resour. 39 (2), 153–161. doi:10.1134/s1875372818020087
Guo, L., Huang, K., Wang, G., and Lin, S. (2022). Development and evaluation of temperature-induced variable source area runoff generation model. J. Hydrology 610, 127894. doi:10.1016/j.jhydrol.2022.127894
Gusev, E. M., Nasonova, O. N., Kovalev, E. E., and Ayzel, G. V. (2019). Impact of possible climate change on extreme annual runoff from river basins located in different regions of the globe. Water Resour. 46 (1), S126–S136. doi:10.1134/s0097807819070108
Han, L., and Menzel, L. (2022). Hydrological variability in southern Siberia and the role of permafrost degradation. J. Hydrology 604, 127203. doi:10.1016/j.jhydrol.2021.127203
Hansen, J., Sato, M., Ruedy, R., Lo, K., Lea, D. W., and Medina-Elizade, M. (2006). Global temperature change. Proc. Natl. Acad. Sci. U. S. A. 103 (39), 14288–14293. doi:10.1073/pnas.0606291103
Harris, I., Osborn, T. J., Jones, P., and Lister, D. (2020). Version 4 of the CRU TS monthly high-resolution gridded multivariate climate dataset. Sci. Data 7 (1), 109. doi:10.1038/s41597-020-0453-3
Huntington, T. G. (2006). Evidence for intensification of the global water cycle: Review and synthesis. J. Hydrology 319 (1–4), 83–95. doi:10.1016/j.jhydrol.2005.07.003
Jacques, St.J.-M., and Sauchyn, D. J. (2009). Increasing winter baseflow and mean annual streamflow from possible permafrost thawing in the Northwest Territories, Canada. Geophys. Res. Lett. 36 (1), L01401. doi:10.1029/2008gl035822
Jin, H., Huang, Y., Bense, V. F., Ma, Q., Marchenko, S. S., Shepelev, V. V., et al. (2022). Permafrost degradation and its hydrogeological impacts. Water 14 (3), 372. doi:10.3390/w14030372
Jin, X.-Y., Jin, H.-J., Iwahana, G., Marchenko, S. S., Luo, D.-L., Li, X.-Y., et al. (2021). Impacts of climate-induced permafrost degradation on vegetation: A review. Adv. Clim. Change Res. 12 (1), 29–47. doi:10.1016/j.accre.2020.07.002
Köhne, S., and Pigeot, I. (1995). Resampling-based multiple testing. Examples and methods for p-value adjustment. Comput. Statistics Data Analysis 20 (2), 235–236. doi:10.1016/0167-9473(95)90129-9
Lamontagne-Hallé, P., McKenzie, J. M., Kurylyk, B. L., and Zipper, S. C. (2018). Changing groundwater discharge dynamics in permafrost regions. Environ. Res. Lett. 13 (8), 084017. doi:10.1088/1748-9326/aad404
Lamontagne‐Hallé, P., McKenzie, J. M., Kurylyk, B. L., Molson, J., and Lyon, L. N. (2020). Guidelines for cold‐regions groundwater numerical modeling. WIREs Water 7 (6), e1467. doi:10.1002/wat2.1467
Liu, S., Wang, P., Yu, J., Wang, T., Cai, H., Huang, Q., et al. (2022). Mechanisms behind the uneven increases in early, mid- and late winter streamflow across four Arctic river basins. J. Hydrology 606, 127425. doi:10.1016/j.jhydrol.2021.127425
Loiselle, D., Du, X., Alessi, D. S., Bladon, K. D., and Faramarzi, M. (2020). Projecting impacts of wildfire and climate change on streamflow, sediment, and organic carbon yields in a forested watershed. J. Hydrology 590, 125403. doi:10.1016/j.jhydrol.2020.125403
McKenzie, J. M., Kurylyk, B. L., Walvoord, M. A., Bense, V. F., Fortier, D., Spence, C., et al. (2021). Invited perspective: What lies beneath a changing Arctic? Cryosphere 15 (1), 479–484. doi:10.5194/tc-15-479-2021
Mekonnen, Z. A., Riley, W. J., Grant, R. F., and Romanovsky, V. E. (2021). Changes in precipitation and air temperature contribute comparably to permafrost degradation in a warmer climate. Environ. Res. Lett. 16 (2), 024008. doi:10.1088/1748-9326/abc444
Melnikov, V. P., Pikinerov, P. V., Gennadinik, V. B., Babushkin, A. G., and Moskovchenko, D. V. (2019). Change in the hydrological regime of siberian rivers as an indicator of changes in cryological conditions. Dokl. Earth Sc. 487 (2), 990–994. doi:10.1134/s1028334x19080270
Nogovitsyn, D. D., Nikolaeva, N. A., and Pinigin, D. D. (2013). Hydrological-hydrochemical regime of the Timpton River based on data of ecologic-engineering surveys for design of the Kankunskaya HPP. Power Technol. Eng. 47 (1), 1–6. doi:10.1007/s10749-013-0387-4
O'Donnell, J. A., Aiken, G. R., Walvoord, M. A., and Butler, K. D. (2012). Dissolved organic matter composition of winter flow in the Yukon River basin: Implications of permafrost thaw and increased groundwater discharge. Glob. Biogeochem. Cycles 26 (4), 2012GB004341. doi:10.1029/2012gb004341
Oki, T., and Kanae, S. (2006). Global hydrological cycles and world water resources. Science 313 (5790), 1068–1072. doi:10.1126/science.1128845
Oliver, M. A., and Webster, R. (1990). Kriging: A method of interpolation for geographical information systems. Int. J. Geogr. Inf. Syst. 4 (3), 313–332. doi:10.1080/02693799008941549
Panyushkina, I. P., Meko, D. M., Shiklomanov, A., Thaxton, R. D., Myglan, V., Barinov, V. V., et al. (2021). Unprecedented acceleration of winter discharge of Upper Yenisei River inferred from tree rings. Environ. Res. Lett. 16 (12), 125014. doi:10.1088/1748-9326/ac3e20
Pestryakova, L. A., Herzschuh, U., Wetterich, S., and Ulrich, M. (2012). Present-day variability and Holocene dynamics of permafrost-affected lakes in central Yakutia (Eastern Siberia) inferred from diatom records. Quat. Sci. Rev. 51, 56–70. doi:10.1016/j.quascirev.2012.06.020
Peterson, B. J., Holmes, R. M., McClelland, J. W., Vörösmarty, C. J., Lammers, R. B., Shiklomanov, A. I., et al. (2002). Increasing river discharge to the arctic ocean. Science 298 (5601), 2171–2173. doi:10.1126/science.1077445
Pettitt, A. N. (1979). A non-parametric approach to the change-point problem. Appl. Stat. 28 (2), 126–135. doi:10.2307/2346729
Previdi, M., Janoski, T. P., Chiodo, G., Smith, K. L., and Polvani, L. M. (2020). Arctic amplification: A rapid response to radiative forcing. Geophys. Res. Lett. 47 (17), e2020GL089933. doi:10.1029/2020gl089933
Rantanen, M., Karpechko, A. Y., Lipponen, A., Nordling, K., Hyvärinen, O., Ruosteenoja, K., et al. (2022). The Arctic has warmed nearly four times faster than the globe since 1979. Commun. Earth Environ. 3 (1), 168. doi:10.1038/s43247-022-00498-3
Rennermalm, A. K., Wood, E. F., and Troy, T. J. (2010). Observed changes in pan-arctic cold-season minimum monthly river discharge. Clim. Dyn. 35 (6), 923–939. doi:10.1007/s00382-009-0730-5
Risbey, J. S., and Entekhabi, D. (1996). Observed Sacramento Basin streamflow response to precipitation and temperature changes and its relevance to climate impact studies. J. Hydrology 184 (3), 209–223. doi:10.1016/0022-1694(95)02984-2
Schneider, U. B., AndreasFinger, P., Rustemeier, E., and Ziese, M. (2020). GPCC full data monthly product version 2018 at 0.5°: Monthly land-surface precipitation from rain-gauges built on GTS-based and historical data.
Shi, S., Wang, P., and Yu, J. (2022). Vegetation greening and climate change promote an increase in evapotranspiration across Siberia. J. Hydrology 610, 127965. doi:10.1016/j.jhydrol.2022.127965
Shi, S. Y., Wang, P., Zhang, Y. C., and Yu, J. J. (2021). Cumulative and time-lag effects of the main climate factors on natural vegetation across Siberia. Ecol. Indic. 133, 108446. doi:10.1016/j.ecolind.2021.108446
Shiklomanov, A., Déry, S., Tretiakov, M., Yang, D., Magritsky, D., Georgiadi, A., et al. (2021) Arctic hydrology, permafrost and ecosystems. D. Yang, and D. L. Kane. 703–738.Cham; Springer International Publishing
Shpakova, R. N. (2021). Changes in the behavior of long-term waterflow variations in the middle part of Yakutia under the global warming conditions. IOP Conf. Ser. Earth Environ. Sci. 666 (4), 042010. doi:10.1088/1755-1315/666/4/042010
Smith, L. C., Pavelsky, T. M., MacDonald, G. M., Shiklomanov, A. I., and Lammers, R. B. (2007). Rising minimum daily flows in northern eurasian rivers: A growing influence of groundwater in the high-latitude hydrologic cycle. J. Geophys. Res. 112 (G4). doi:10.1029/2006jg000327
Smith, S. L., O’Neill, H. B., Isaksen, K., Noetzli, J., and Romanovsky, V. E. (2022). The changing thermal state of permafrost. Nat. Rev. Earth Environ. 3 (1), 10–23. doi:10.1038/s43017-021-00240-1
Song, C., Wang, G., Mao, T., Dai, J., and Yang, D. (2020). Linkage between permafrost distribution and river runoff changes across the Arctic and the Tibetan Plateau. Sci. China Earth Sci. 63 (2), 292–302. doi:10.1007/s11430-018-9383-6
Tananaev, N. I., Makarieva, O. M., and Lebedeva, L. S. (2016). Trends in annual and extreme flows in the Lena River basin, northern eurasia. Geophys. Res. Lett. 43, 10, 764–10, 772. doi:10.1002/2016gl070796
Tang, Y., and Tang, Q. (2021). Variations and influencing factors of potential evapotranspiration in large Siberian river basins during 1975–2014. J. Hydrology 598, 126443. doi:10.1016/j.jhydrol.2021.126443
Tarasenko, T. V. (2013). Interannual variations in the areas of thermokarst lakes in Central Yakutia. Water Resour. 40 (2), 111–119. doi:10.1134/s0097807813010107
Vinogradov, Y. B., Semenova, O. M., and Vinogradova, T. A. (2011). An approach to the scaling problem in hydrological modelling: The deterministic modelling hydrological system. Hydrol. Process. 25 (7), 1055–1073. doi:10.1002/hyp.7901
Walvoord, M. A., and Kurylyk, B. L. (2016). Hydrologic impacts of thawing permafrost—a review. Vadose Zone J. 15, vzj2016.01.0010. doi:10.2136/vzj2016.01.0010
Walvoord, M. A., Voss, C. I., and Wellman, T. P. (2012). Influence of permafrost distribution on groundwater flow in the context of climate-driven permafrost thaw: Example from Yukon Flats Basin, Alaska, United States. Water Resour. Res. 48 (7), W07524. doi:10.1029/2011wr011595
Wang, P., Huang, Q., Liu, S., Cai, H., Yu, J., Wang, T., et al. (2022a). Recent regional warming across the siberian lowlands: A comparison between permafrost and non-permafrost areas. Environ. Res. Lett. 17 (5), 054047. doi:10.1088/1748-9326/ac6c9d
Wang, P., Huang, Q., Pozdniakov, S. P., Liu, S., Ma, N., Wang, T., et al. (2021a). Potential role of permafrost thaw on increasing Siberian river discharge. Environ. Res. Lett. 16 (3), 034046. doi:10.1088/1748-9326/abe326
Wang, P., Huang, Q. W., Tang, Q., Chen, X. L., Yu, J. J., Pozdniakov, S. P., et al. (2021b). Increasing annual and extreme precipitation in permafrost-dominated Siberia during 1959-2018. J. Hydrology 603, 126865. doi:10.1016/j.jhydrol.2021.126865
Wang, X., Ran, Y., Pang, G., Chen, D., Su, B., Chen, R., et al. (2022b). Contrasting characteristics, changes, and linkages of permafrost between the Arctic and the Third Pole. Earth-Science Rev. 230, 104042. doi:10.1016/j.earscirev.2022.104042
Webb, E. E., Liljedahl, A. K., Cordeiro, J. A., Loranty, M. M., Witharana, C., and Lichstein, J. W. (2022). Permafrost thaw drives surface water decline across lake-rich regions of the Arctic. Nat. Clim. Chang. doi:10.1038/s41558-022-01455-w
Keywords: streamflow, climate warming, permafrost degradation, Siberia, precipitation
Citation: Wang P and Shpakova RN (2022) Complex streamflow responses to climate warming in five river basins in South Yakutia, Russia. Front. Environ. Sci. 10:1033943. doi: 10.3389/fenvs.2022.1033943
Received: 01 September 2022; Accepted: 04 October 2022;
Published: 17 October 2022.
Edited by:
Shengping He, University of Bergen, NorwayReviewed by:
Eduardo Zorita, Helmholtz Centre for Materials and Coastal Research (HZG), GermanyLiang Ning, Nanjing Normal University, China
Copyright © 2022 Wang and Shpakova. This is an open-access article distributed under the terms of the Creative Commons Attribution License (CC BY). The use, distribution or reproduction in other forums is permitted, provided the original author(s) and the copyright owner(s) are credited and that the original publication in this journal is cited, in accordance with accepted academic practice. No use, distribution or reproduction is permitted which does not comply with these terms.
*Correspondence: Ping Wang, d2FuZ3BpbmdAaWdzbnJyLmFjLmNu