 Zhenhua Wang
 Ruijie Dai1
- 1College of Economics and Management, Shenyang Agricultural University, Shenyang, China
- 2Assistant Researcher, Party School of Liaoning Provincial Committee, Shenyang, China
- 3Associate Professor, School of Economics and Management, Jilin Agricultural University, Jilin, China
Whether the Environmental Kuznets curve is established in haze pollution has an important policy. Based on the PM2.5 concentration raster data of 283 cities in MODIS and MISR, this paper empirically examines the non-linear effects of industrial structure upgrading on haze pollution using a spatial econometric model, and further tests and extends the environmental Kuznets curve using a threshold model. The study finds that there is a significant spatial spillover effect on haze pollution between cities, an inverted ''U'' shaped relationship between industrial upgrading and haze pollution, confirming the environmental Kuznets curve, and that the effect of industrial upgrading on haze pollution is mainly a direct effect, while the indirect effect is not significant. Further discussion in this paper reveals that there is a threshold effect of industrial upgrading on haze pollution; the traditional environmental Kuznets curve can be refined and extended: on both sides of the inflection point, there may be both positive and negative effects of economic development on environmental pollution, and the environmental Kuznets curve is the result of the combined effect of the two different effects.
1 Introduction
Many Chinese cities have recently been plagued by haze. Air pollution, which is referred to as haze, is the universal term for suspended particles in the atmosphere. PM2.5, meaning particulate matter with a diameter of less than 2.5 microns, is also referred to as smog’s primary cause. The emergence of haze has both natural and artificial causes, and the haze caused by human activity is referred to as haze pollution (Tong, et al., 2019). Haze pollution has become a major topic of worry for the entire society since it can harm human health, decrease life satisfaction, impair economic development, and even affect the credibility of the government (Huang and Chew, 2021; Li and Yang et al., 2021).Scholars believe that haze pollution develops with economic development and that all economies, including the United States, Japan, European countries, and other countries that have experienced severe haze in the last century, experience environmental pollution in the early stages of industrial development (Jungwook K and Jinkyeong K, 2021). In theory, during the early stages of rapid economic development, the economy’s environmental pollution will gradually increase with the development of secondary industry. However, as the economy grows, industrial structure is optimized, and the quality of economic growth improves, environmental pollution will gradually decrease, as shown by the environmental Kuznets curve, which shows an inverted “U’’-shaped relationship between environmental pollution and industrial development (Cite Grossman and Krueger, 1995; Maddison D, 2006; Müller-Fürstenberger and Wagner, 2007).
This paper attempts to contribute to the analysis of the relationship between industrial structure and urban haze pollution by using raster panel data of PM2.5 concentrations from MODIS and MISR for 283 cities across China, establishing a spatial econometric model based on the non-linear framework of the Kuznets curve, and further extending the environmental Kuznets inverse “U’’ curve by using a threshold effect model. The spatial econometric model was developed to analyse the relationship between industrial structure and urban haze pollution, and the threshold effect model was used to extend the Kuznets inverse “U’’ curve to analyse the characteristics of the Kuznets inverse “U’’ curve at different stages of development and reveal the relationship between industrial structure and urban haze pollution. The preliminary conclusion is that the relationship between industrial structure and haze pollution conforms to the Kuznets curve, displaying an inverted “U’’ shape, indicating that haze pollution will worsen during the primary stage of industrial structure upgrading as the proportion of industrialization increases. Further industrial restructuring, particularly an increase in the proportion of senior service industry, will reduce smog pollution. At the same time, upgrading industrial structure may have a two-way effect on haze pollution at different stages of development, and the inverted “U’’ shaped curve reflects the combined effect of positive and negative effects.
2 Literature review
The mechanism of haze is more complex and is a consequence of the combined effect of natural factors and human economic activities (An and Huang, 2019; Liu and Dong, 2021; Bilal Muhammad and Hassan Mujtaba, 2022), scholars agree that economic and industrial development has a significant impact on environmental pollution. Theoretically, in the early stages of economic development and industrial upgrading, the impact of economic activities on the environment is mainly negative. The reason for this is that with economic development and industrial upgrading, human economic activities require increasing amounts of natural resources and the ability to transform nature is gradually strengthened. For example, the need for and ability to intervene in mineral resources, water and soil resources and forest resources will increase, while the exploitation and use of these natural resources will increase pollution emissions and reduce the carrying capacity of nature, thus increasing the sources of environmental pollution, destroying the ecological balance and causing environmental pollution. In addition, most of the natural resources concerned are disposable resources or resources that are difficult to restore in the short term and are therefore not conducive to the long-term balance of the natural ecology. With further economic development and the continuous upgrading of industries, the mode of economic growth will change from a sloppy to an intensive one, the quality of economic growth will improve and technical efficiency will increase, thus the level of energy consumption for economic development will decrease. Moreover, the government’s ability and technical means to manage the environment and regulate environmental pollution are increasing, which all help to reduce environmental pollution. Therefore, theoretically speaking, the combination of these two stages is the environmental Kuznets curve, that is, there is an inverted “U-shaped” relationship between the variables related to economic development and environmental pollution (Cite Grossman and Krueger, 1995; Maddison D, 2006; Müller-Fürstenberger, Wagner, 2007).
The history of the world economy also confirms the existence of the environmental Kuznets curve. For example, the United Kingdom, the birthplace of the industrial revolution, experienced serious environmental pollution and haze pollution in its early years, and Germany and the US in their later years did not escape the curse of environmental pollution and ecological destruction in the early stages of industrialisation (Jungwook K and Jinkyeong K, 2021). However, these countries have gradually improved their environment with further industrial upgrading, while the areas with more serious environmental pollution have now changed to economies such as China and India, which are in the middle of their economic development (Wang and He et al., 2021).
In existing empirical studies, scholars have also explored other factors that influence environmental problems. Compared with the energy consumption structure of other frontier industrialized countries, coal accounts for a higher proportion in the energy consumption structure, which is the direct cause of the large-scale haze in China (Xiaoxiao et al., 2020). Keshen (2017) Based on the panel data of 30 provinces in China, It is confirmed that the reduction of energy intensity will reduce haze pollution in this region, but increase haze pollution in neighboring regions. Huang et al. (2017) used the spatial Dubin model to analyze the impact of foreign direct investment on China’s environment and economic growth based on the panel data of 30 provinces in China, and found that foreign direct investment had a positive impact on the environmental quality of China’s inland areas. In addition, scholars have found that population concentration, urbanisation development, investment structure, energy intensity and structure, and political factors also affect urban haze pollution (Lan and Pan, 2019; Yang and Yan, 2021).
On the basis of the existing literature, there are several points that need to be added: first, scholars have confirmed the existence of environmental Kuznets curve in water pollution, solid waste pollution, non-point source pollution and carbon emissions in China (Zhang and Ni et al., 2016; Zhang and Wang et al., 2017), but the existing literature has not provided enough evidence and consistent conclusions on whether there is an environmental Kuznets curve in haze pollution in China. Different from water pollution, solid waste pollution and non-point source pollution, haze pollution may have different rules from water and solid pollution due to its own air mobility and sky inseparability (Liu, Li and Chen et al., 2021). New empirical evidence is needed to reveal the existence of Kuznets curve. Second, existing studies on the environmental Kuznets curve only discuss the comprehensive positive or negative impact of economic development on environmental pollution at different stages (Jungwook K and Jinkyeong K, 2021; Wang and He et al., 2021). But in reality, each stage of development, economic activities on the environment pollution is likely to exist at the same time the influence of positive and negative two aspects, the inverse “U’’ type curve are two of the comprehensive influence, the existing environmental kuznets curve is not discussed in each of the different stages, possible two-way influence economic development on the environment pollution, It is necessary to further analyze the environmental Kuznets inverted “U’’ curve based on the nonlinear framework of threshold model. Third, most of the existing literatures on the analysis of haze pollution in China use provincial data or provincial capital city data, while the literatures using prefecture-level city panel data are rare (Huang et al., 2017; Keshen, 2017). Due to the strong heterogeneity of industrial development among cities, the research units should be as detailed as possible to enhance the reliability of the results.
This paper attempts to systematically discuss the influence of industrial structure on haze pollution based on the theoretical framework of environmental Kuznets curve from the shortcomings of the above several existing studies. The two core issues discussed in this paper are as follows: First, verify whether the environmental Kuznets curve exists in urban haze pollution in China? That is, does the upgrading of China’s urban industrial structure have a nonlinear impact on haze pollution? Second, does economic development have both positive and negative impacts on environmental pollution in different stages?.
3 Methodology and data
3.1 Model
Considering the possible spatial correlation of haze pollution brought about by the regional correlation of stationary weather and moisture conditions, the mobility of haze pollution, and the correlation of economic activities between neighbouring cities and regions in the haze generation process,a spatial econometric model will be developed in this paper to test the correlation hypothesis (Feng and Wang, 2020). The general form of the spatial econometric model is the spatial Durbin model (SDM).
Assuming that PM2.5 concentration of city i in period t is Hazei,t and the factors determining and influencing urban haze pollution are vectors X. A spatial panel data Durbin model for urban haze pollution is established as follows:
In Eq. 1,
Of course, due to the presence of spatial effects,
Assuming that Eq. 1 contains
namely:
the matrix expression of Eq. 3 takes the form:
of which,
According to Eq. 3, the partial derivative of the rth explanatory variable
Similarly, according to Eq. 3, the partial derivative of city
In addition, considering the possible existence of “time inertia” of grey haze pollution, this paper will also introduce the lag term of grey haze pollution into the spatial Dubin model to construct a dynamic spatial Dubin model as follows:
This paper expands Eq. 7 in the form of the Kuznets curve to create the spatial Durbin model of this paper.
The core explanatory variables are the industrial structure indicator
3.2 Data
The data for this paper are derived from two sources.
The first is haze data. The haze data in this paper comes from the Center for International Earth Science Information Network (CIESIN) at Columbia University, United States, which relies on the Socio-Economic Data and Applications Center (SEDAC) to publish satellite-borne Moderate Resolution Imaging Spectroradiometer (MODIS) and Multi-angle Imaging Spectroradiometer (MISR) measurements to obtain aerosol optical thickness images that can be converted to PM2.5 concentration raster data, which is widely used in haze pollution studies (Zhang et al., 2021; Gan Yang and Liang et al., 2020; Van Donkelaar A, Martin RV and Brauer M,2015). In this paper, ArcGIS10.2 software was used to parse this data into PM2.5 concentration data for the corresponding year for sample cities above the prefecture level in mainland China.
This is followed by other urban economic related variables. The raw data for the indicators were obtained from publicly available government data such as the China City Statistical Yearbook1 and the China Regional Economic Statistical Yearbook2 for the sample period, and the data for each price deflator were obtained from publicly available provincial and municipal statistical yearbooks for the corresponding years and provinces.
In the process of data collection and collation, prefecture-level cities with a change in administrative units and samples with missing data for some indicators were removed in order to obtain balanced panel data, and balanced panel data for 283 mainland Chinese cities from 2006 to 2018 were finally collated.
The industrial structure indicators were calculated using the formula (Yi, et al., 2022):
Level of industrial structure:
Advanced industrial structure:
In Eq. 9,
In Eq. 10,
The other variable variables are quantified as follows: the energy intensity indicator is quantified using GDP output per unit of industrial electricity consumption (10,000RMB/10,000 kWh); Foreign direct investment is quantified by the logarithm of foreign direct investment (ten thousand yuan).The data are described in Table 1.
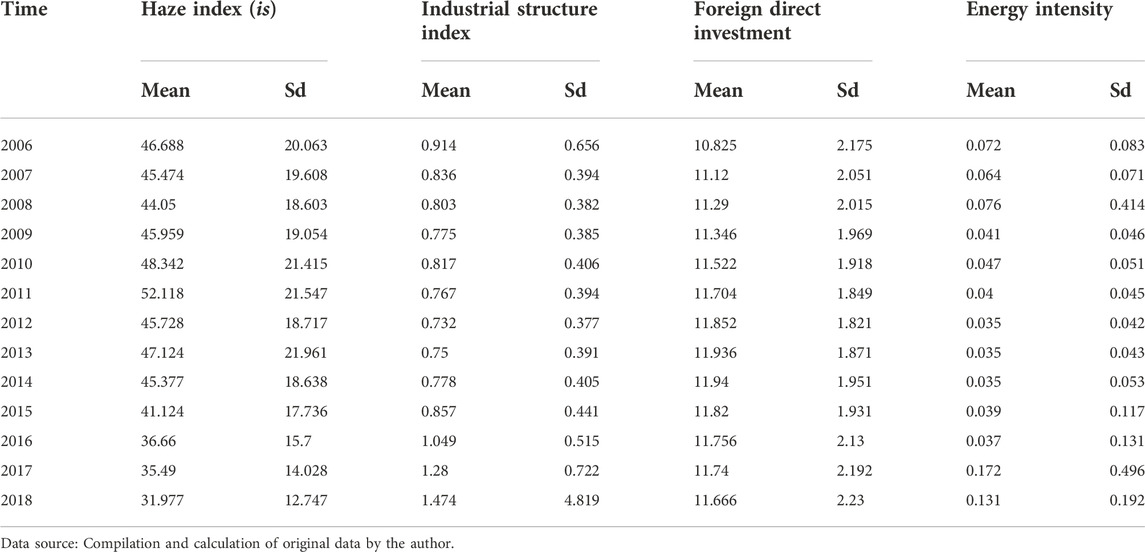
TABLE 1. Description of data.
4 Results of the empirical analysis
4.1 Spatial correlation test of urban haze pollution
The global Moran’s I index can examine the global spatial correlation of things or phenomena, and identify whether the neighboring regions in the research object have positive or negative spatial correlation, or are independent of each other. In this paper, we use Moran’s I index to test the spatial correlation between urban haze pollution (Zhang, 2020), and the formula for Moran’s I is:
in Eq. 11,
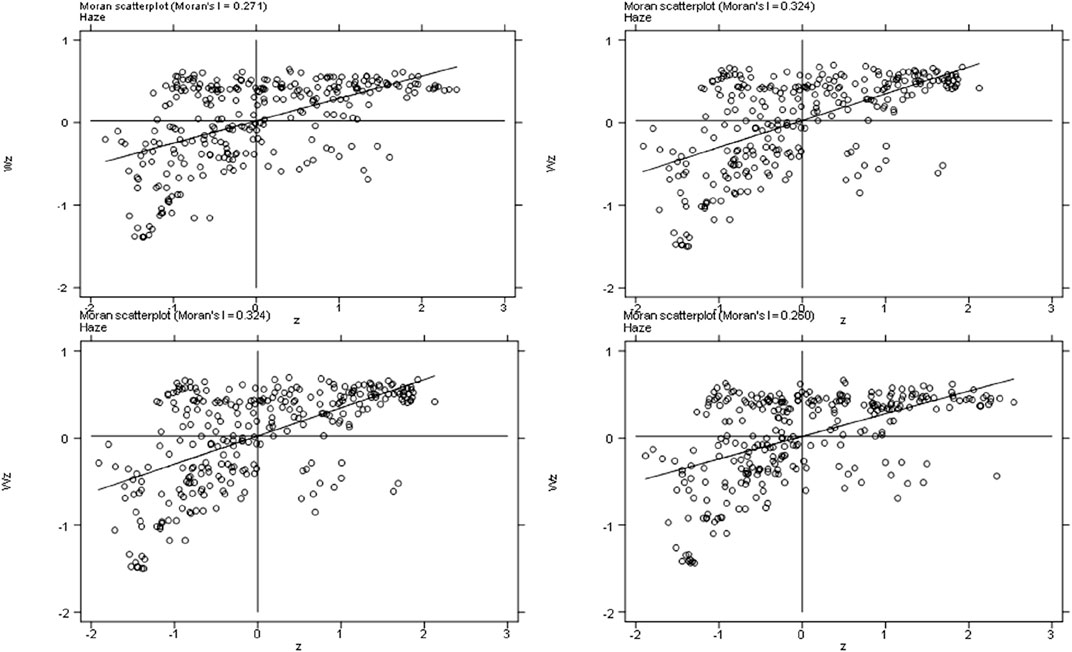
FIGURE 1. Moran’s I index scatter plot.
The test results of Moran’s I index are consistent with the existing literature (Hao and Liu, 2016). There are three possible reasons for the spatial spillover effect of haze pollution between cities: firstly, with the development of transportation infrastructure and communication technology, regional urban communities have been formed between cities, and the exchange of factors, technologies and products between neighbouring cities is more frequent, and the factor endowments and location characteristics of neighbouring cities are similar, and their economic performance is more consistent, so the haze emissions are similar. Secondly, from the mechanism of haze generation, human economic production activities lead to the emission of large amounts of fine particulate matter (including PM2.5, etc.), and when their emissions exceed the natural circulation carrying capacity, a stationary weather occurs and haze pollution is formed. Therefore, neighbouring cities share the same climatic characteristics and have similar probability and time of occurrence of stationary weather, thus easily forming a spatial correlation between neighbouring cities. Finally, as haze pollution is atmospheric pollution, the flow of air between neighbouring cities also tends to cause the correlation of haze between cities.
4.2 Testing the impact of industrial structure upgrading on haze pollution
The spatial econometric model of this paper is estimated with the help of Stata 14.0 software. The benchmark model of this paper is the spatial Dynamic Dubin model (DSDM). In order to compare the robustness of the conclusion, the estimation results of the spatial dynamic lag model (DSAR) are also given. The paper first chooses to run regressions on industry structure and its squared term, and then will add other control variables to compare the changes in findings.
In Table 2, the spatial correlation coefficients of all models passed the 1% significance level test, confirming the spatial correlation between haze pollution in cities, echoing the results of the Moran’s I index test in the previous section. The results of the Moran’s I index test are consistent with the previous results. Comparing the baseline model with the other models shows that the findings for the core explanatory variables are relatively consistent and all pass the significance level test, indicating that the findings in this section are robust.
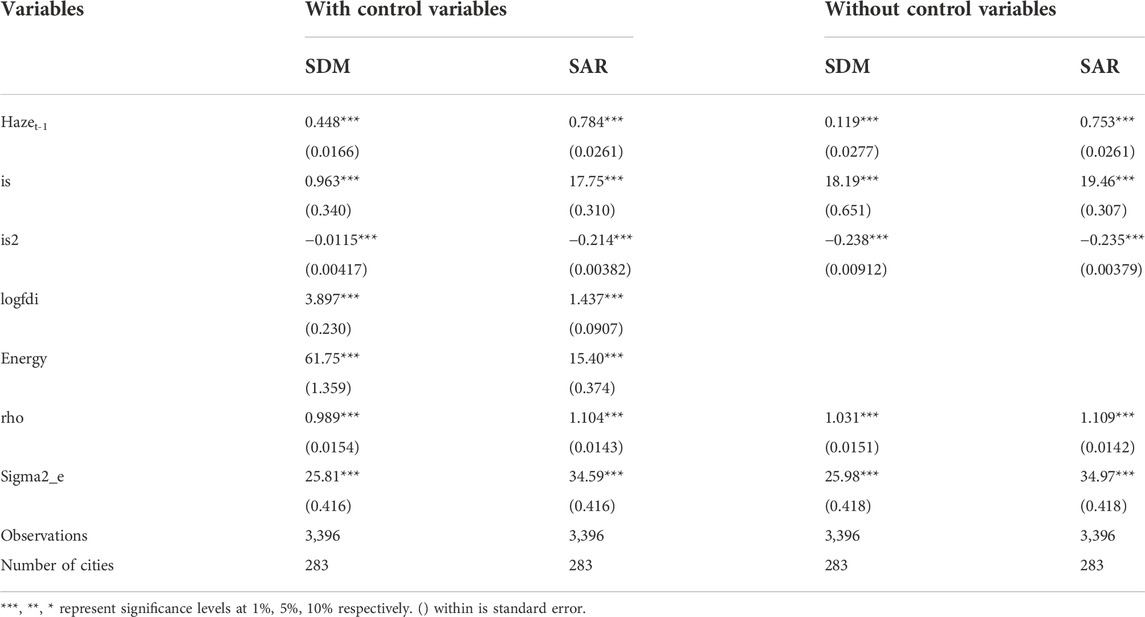
TABLE 2. The influence coefficient of industrial structure on haze pollution.
Specifically, the effect of the primary term of industrial structure on haze pollution is significantly positive (at 1% significance level), indicating that upgrading of industry will increase urban haze pollution; the effect of the secondary term of industrial structure on haze pollution is significantly negative (at 1% significance level), indicating that further upgrading of industry will reduce urban haze pollution. This shows that there is an inverted “U’’ shaped relationship between industrial structure and urban haze pollution, demonstrating the existence of an environmental Kuznets curve in urban haze pollution in China. In the early stages of industrial upgrading, the urban economy undergoes industrial transformation and the proportion of low-end manufacturing industries such as steel, cement and glass gradually increases. At the same time, as industrialisation proceeds, cities will attract an inflow of factors such as labour, which in turn will increase consumption of housing, household appliances, cars, restaurants and consumer goods, which will also increase urban haze pollution on the demand side. In addition, with industrial upgrading, more factors of production will be concentrated in the city, which will form industrial agglomeration, and industrial agglomeration will increase the pollutant emissions per unit of time and area, which will in turn exceed the carrying capacity of nature in the short term, increasing the likelihood of haze pollution. However, with the further upgrading of the city’s industries, related industries with higher energy consumption and pollution emissions will be eliminated and moved out to other areas, while new industries will have lower energy consumption, higher production efficiency and lower pollution emissions. Moreover, after industrial upgrading, the government’s increased ability and technical means to combat haze pollution will also help to reduce haze pollution. Therefore, there is an inverted “U’’ shaped relationship between industrial structure and urban haze pollution.
Among other control variables, energy intensity and foreign investment level also have significant effects on haze pollution, which are not discussed.
4.3 Further discussion: Regional differences
There are regional differences in haze pollution in Chinese cities (Zhang, Liu and Sun et al., 2020), and there are also differences in the development of China’s industrial structure between the eastern, central and western regions, with the development characteristics of high in the east and low in the west (Ma and Cao, 2022). Therefore, there may be regional differences in the impact of the improvement of industrial structure on haze pollution. In this part, 283 sample cities are subdivided according to the three regions of east, middle and west. The eastern region includes 100 cities under the jurisdiction of Hebei, Liaoning, Jiangsu, Zhejiang, Fujian, Shandong, Guangdong and Hainan. The central region includes 100 cities under the jurisdiction of Shanxi, Jilin, Heilongjiang, Anhui, Jiangxi, Henan, Hubei, Hunan and other provinces; the western region includes 83 cities in Inner Mongolia, Guangxi, Chongqing, Sichuan, Guizhou, Yunnan, Gansu, Qinghai, Ningxia and Xinjiang. After subdividing the samples, the dynamic spatial Durbin model is used to re-estimate the data after subdividing the samples, and the model estimation results are given (Table 3).
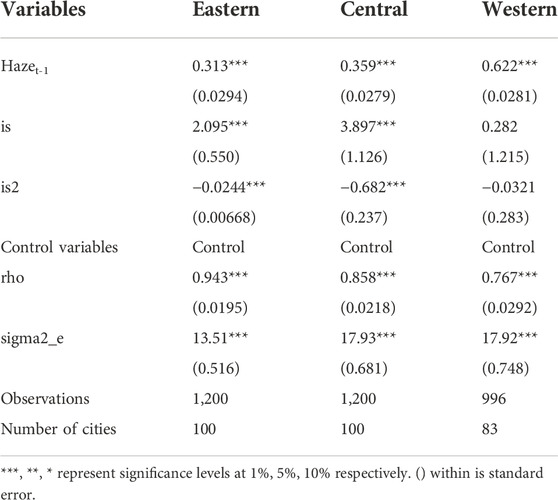
TABLE 3. The influence coefficient of industrial structure on haze pollution in different regions.
From the estimation results of the sub-region samples, the estimation results of the eastern and central region samples are similar to the estimation results of the whole sample, which is not discussed. The estimation results of the samples in the western region are not consistent with the estimation results of the overall samples. The causal relationship between the upgrading of the industrial structure in the western region and the urban haze pollution is not significant and robust. The possible explanation is that scholars have found that there is club convergence in haze pollution between China’s regions (Gong and Bai et al., 2022; Wang et al., 2022). The haze pollution in the western region is better than that in the central and eastern regions. At the same time, the level of industrial structure between the western region is relatively backward in the central and eastern regions, so the statistical relationship between the two variables is not consistent with that in the central and eastern regions.
4.4 Decomposition of the spatial effect of industrial structure on haze pollution
In Table 4 considering that the spatial error terms of the spatial econometric model all pass the 1% significance level test, which confirms the spatial spillover effect of haze pollution, but since the economic significance of each variable cannot be explained by the estimated coefficients, this paper draws on the existing literature and adopts the partial differential method of spatial econometric model to solve the spatial spillover direct effect and indirect effect of each variable on haze pollution.
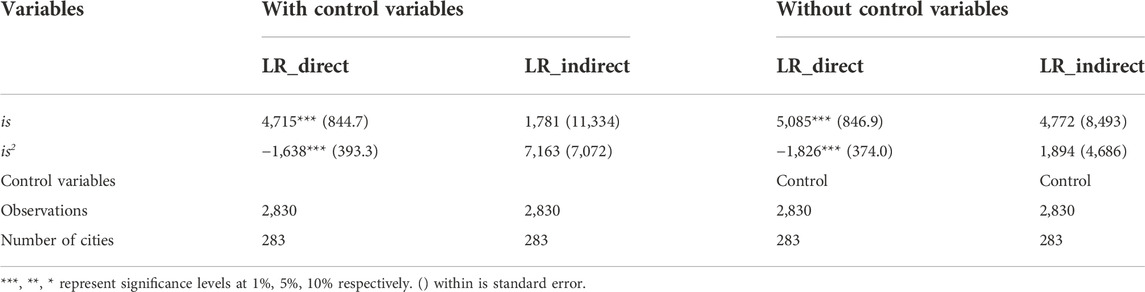
TABLE 4. Spatial spillover effect decomposition.
According to the research results of partial differential method on spatial spillover effect of haze pollution, the influence of industrial structure on haze pollution is mainly reflected as direct effect, that is, the upgrading of industrial structure of a city only affects the haze pollution within the city, and has no significant effect on the haze pollution of neighboring cities. It is still found to be robust after the addition of other control variables.
4.5 Further discussion of the environmental Kuznets curve: Threshold model
The environmental Kuznets curve theory and spatial econometric model in this paper both show that the impact of industrial structure on haze pollution has significant nonlinear effects, that is, the impact on haze pollution is different in different stages of industrial structure, so it may show typical “threshold” characteristics. Further threshold models are needed to test the impact of industrial structure on haze pollution in different threshold ranges. The impact of industrial structure on haze pollution at different thresholds needs to be further tested using a threshold model. In addition, it should be emphasized that adding a quadratic term to the primary term can test whether there is a “U’’ or inverted “U’’ type relationship between the independent and dependent variables, but this “U’’ or inverted “U" type relationship can be tested. However, this “U’’ or inverted “U’’ type relationship can only explain the unidirectional effect of industrial outcomes on haze pollution at different stages of industrial structure development. For example, an inverted “U’’ shaped relationship would explain that industrial upgrading increases haze pollution before the inflection point, and that industrial upgrading reduces haze pollution after the inflection point. In reality, this interpretation needs to be further deconstructed: the reason for this is that there may be a two-way effect of industrial upgrading on haze pollution at each stage of development, but the inverted “U’’ curve reflects the combined effect of positive and negative effects. For example, in the early stages of industrial upgrading, an increase in the proportion of high-emission industries will aggravate haze pollution, but at the same time, the level of technology is also improving, and the government’s ability to remedy environmental pollution is also improving, which will reduce haze pollution, but the former effect is greater than the latter, and the combined effect of the two is that industrial upgrading increases haze pollution. Therefore, a threshold model is needed to test the impact of industrial structure changes on haze pollution at different stages.
In this paper, the level of advanced industrial structure is used as the threshold variable to test the effects of the primary and secondary terms of industrial structure on urban haze pollution between different thresholds, with other control variables held constant.
This paper draws on Hansen (1999) to test the number of thresholds in the threshold model using a residual sum of squares minimisation method. The test procedure used the Bootstrap Method to draw samples 300 times for significance testing of the threshold effect. The results of the test for the number of thresholds are given in Table 5. The test results confirm the existence of a threshold effect, and the F-statistic and p-value results suggest that a single threshold model should be used for the analysis, which is consistent with the inverted “U’’ curve relationship confirmed in the previous section. In this paper, a single threshold model was selected for analysis.
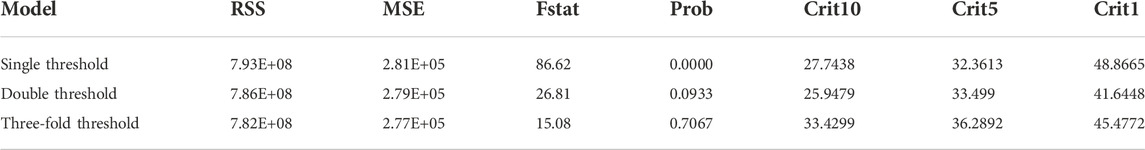
TABLE 5. Test results of the number of thresholds.
The distribution of the threshold values for the threshold model is given in Figure 2, which confirms the validity of the single threshold model. The threshold value calculated in this paper is 2.1290 and the threshold confidence interval at the 95% confidence level is (2.1251, 2.1306). Table 6 shows the estimation results of the threshold model, including the results of the model with and without the control variables.
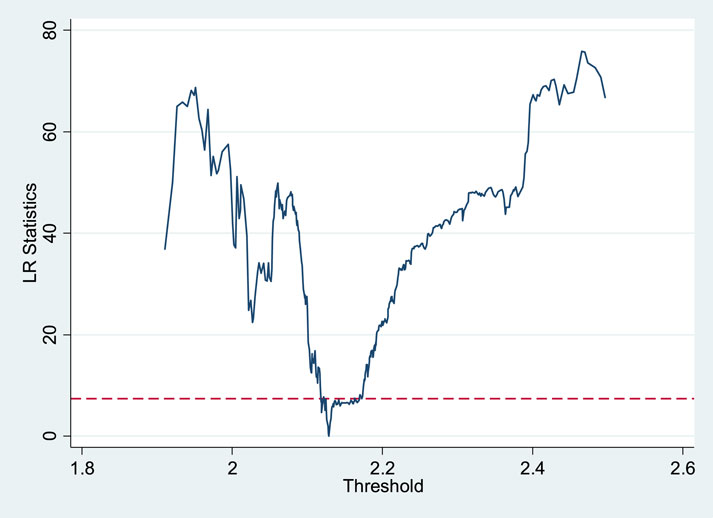
FIGURE 2. Single threshold confidence interval distribution.
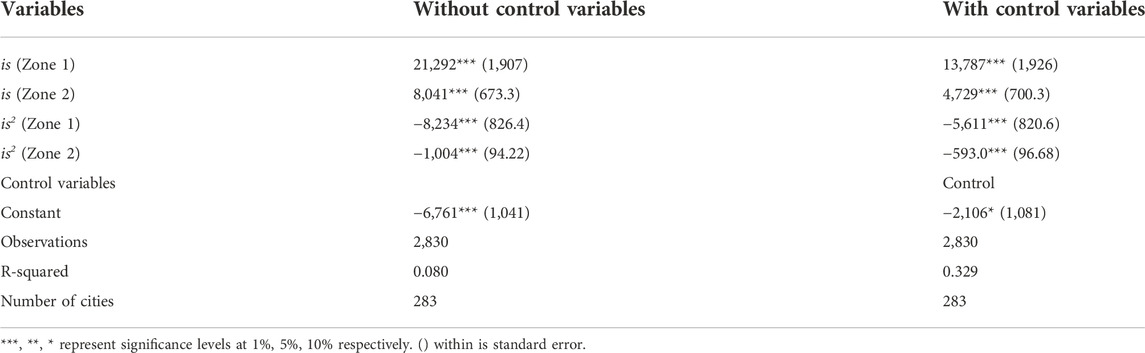
TABLE 6. Threshold model estimation results.
In advanced industrial structure into a variable threshold value, according to the results of the threshold value of the model test and estimate the level of industrial structure in primary and secondary items of urban smog pollution has significant effect in both range, respectively, have a positive effect and negative effect, consistent with the results of spatial econometric model, industry structure and the urban haze a inverted “U’’ shaped relationship between pollution. This also shows that in each period of industrial structure upgrading, industrial upgrading has two different effects on haze pollution. The mechanisms by which industrial upgrading aggravates haze pollution include: firstly, the continuous inflow of natural resources, labour and other factors into cities, the increase in factor inputs and the expansion of economic scale, which can derivatively lead to an increase in pollutant emissions; secondly, the concentration of population in cities leads to the expansion of city scale and an increase in housing demand, while the expanded population scale increases the consumption of urban heating, household appliances, cars, restaurants and other household goods, and Among them, housing, automobiles and heating are among the key industries in terms of pollution emissions, which will increase the emission of haze and other pollution and affect the environment; thirdly, industrial upgrading will bring about agglomeration, which is more likely to lead to pollution exceeding the carrying capacity of natural cycles in a specific time and space, and therefore increase environmental pollution (Zhao and Cao et al., 2020). The mechanisms by which industrial upgrading reduces haze pollution include: firstly, industrial upgrading promotes technological development and production efficiency, reducing the level of energy consumption per unit of economic output, which is conducive to reducing pollution emissions; secondly, industrial upgrading promotes the elimination and out-migration of energy-intensive industries, which helps reduce urban pollution; thirdly, industrial upgrading increases government revenue, which helps improve government supervision and control of environmental pollution such as haze capacity and reduce pollution (Shi and Zhang, 2020).
This paper argues that at each stage of economic development, there are both positive and negative effects of industrial upgrading on environmental pollution such as haze, and its combined effect on environmental pollution depends on the magnitude of the two effects: to the left of the traditional inflection point of the environmental Kuznets curve, the effect of industrial upgrading on aggravating environmental pollution such as haze is greater than its effect on reducing pollution, and therefore, as industry upgrades, it will aggravate haze pollution. With further industrial upgrading, its role in reducing pollution gradually increases, while the role in aggravating haze pollution gradually decreases, therefore, the inflection point of the Kuznets curve will be ushered in, and as the role of industrial upgrading in reducing pollution outweighs its role in aggravating pollution, it will eventually be reflected as industrial upgrading will reduce environmental pollution such as haze.
5 Conclusion and discussion
Haze pollution is a key issue concerned by the government, society and scholars. Based on MODIS and MISR data of PM2.5 concentration in 283 cities in mainland China, this paper empirically tests the nonlinear impact of industrial structure upgrading on haze pollution. It is found that haze pollution between cities has significant spatial spillover effect. The results of the dynamic spatial Dubin model show that the upgrading of industrial structure will first increase the haze pollution, and the further upgrading will reduce the haze pollution, that is, there is an inverted U-shaped relationship between industrial structure and haze pollution, and there is an environmental Kuznets curve, which is only significant in the eastern and central regions of China. The effect of industrial structure upgrading on haze pollution is mainly direct, but indirect effect is not significant. Further discussion in this paper found that there is a threshold effect of industrial upgrading on haze pollution. The traditional environmental Kuznets curve can be refined and expanded: on both sides of the inflection point, economic development may have both positive and negative impacts on environmental pollution. Of course, the combined impact of the two aspects is an inverted “U’’ shaped relationship.
In view of the spatial spillover characteristics of haze, the collaborative work of haze control between cities should be implemented. Since there is a Kuznets curve between the upgrading of industrial structure and haze pollution in eastern and central China, we should adhere to the optimization and upgrading of the internal industrial structure in the eastern and central regions, and guide the transfer of industries that do not have comparative advantages in the east to other regions to alleviate the ills of excessive concentration of heavy chemical industries in the eastern region. Other regions should strengthen the implementation of environmental standards when undertaking industrial transfer. Since the empirical results show that energy intensity has an important impact on haze pollution, China should optimize the energy consumption structure, reconfigure the energy production structure of each region, adhere to the policy of combining traditional energy cleaning and new energy supply, and promote the low-carbon, high-quality and diversified energy structure.
At the same time, the conclusion of this paper shows that in the process of economic development, the impact of economic production on environmental pollution has both positive and negative aspects. If the positive impact of economic development and industrial upgrading on environmental pollution can be stimulated, the inflection point of the inverted “U’’ shaped curve will come earlier. For haze pollution, it needs to be clear that the impact of industrial upgrading on haze pollution is always a “double-edged sword”. In different stages of economic development and the process of industrial upgrading, differentiated haze control policies should be formulated. In the early stage of industrial upgrading, we should not completely deny industrial upgrading or even affect economic construction under the pretext of affecting the environment. In the middle and later stages of industrial upgrading, we should always control and avoid the impact of industrial upgrading on environmental pollution. We should not only see the beneficial impact of industrial upgrading on environmental pollution, but also relax the regulation and control.
This paper focuses on the impact of industrial structure optimization on haze pollution, and there are still some limitations. This study still needs to be deepened. In terms of research content, this study needs to further subdivide the industrial structure, and further explore the impact of sub-industrial structure changes and interactions on haze pollution in China’s three industries.
Data availability statement
The raw data supporting the conclusion of this article will be made available by the authors, without undue reservation.
Author contributions
TJ and ZW presented the study and critically revised its important elements. JY, RD and BB supervised the data collection, performed the preliminary analysis, and reviewed and revised the manuscript. ZW corrected the data analysis and drafted the manuscript, and critically reviewed the manuscript. All authors read and approved the final manuscript.
Conflict of interest
The authors declare that the research was conducted in the absence of any commercial or financial relationships that could be construed as a potential conflict of interest.
Publisher’s note
All claims expressed in this article are solely those of the authors and do not necessarily represent those of their affiliated organizations, or those of the publisher, the editors and the reviewers. Any product that may be evaluated in this article, or claim that may be made by its manufacturer, is not guaranteed or endorsed by the publisher.
References
An, Zhisheng, Huang, Ru-Jin, Zhang, Renyi, Xuexi, Tie, Li, Guohui, Cao, Junji, et al. (2019). Severe haze in northern China: A synergy of anthropogenic emissions and atmospheric processes. Proc. Natl. Acad. Sci. U. S. A. 116 (18), 8657–8666. doi:10.1073/pnas.1900125116
Chew, Soo Hong, Huang, Wei, and Xun, Li (2021). Does haze cloud decision making? A natural laboratory experiment[J]. J. Econ. Behav. Organ. 182.
Feng, Yanchao, and Wang, Xiaohong (2020). Effects of urban sprawl on haze pollution in China based on dynamic spatial Durbin model during 2003–2016. J. Clean. Prod. 242 (C), 118368. doi:10.1016/j.jclepro.2019.118368
Gan, Ting, Yang, Huachao, Liang, Wei, and Liao, Xianchun (2020). Do economic development and population agglomeration inevitably aggravate haze pollution in China? New evidence from spatial econometric analysis[J]. Environ. Sci. Pollut. Res. 28, 5063–5079. doi:10.1007/s11356-020-10847-4
Grossman, G. M., and Krueger, A. B. (1995). Economic growth and the environment. Q. J. Econ. 110 (2), 353–377. doi:10.2307/2118443
Hansen, Bruce E. (1999). Threshold effects in non-dynamic panels: Estimation, testing, and inference. J. Econ. 93 (2), 345–368. doi:10.1016/s0304-4076(99)00025-1
Hao, Y., and Liu, Y. M. (2016). The influential factors of urban PM2.5 concentrations in China: a spatial econometric analysis. J. Clean. Prod. 112, 1443–1453. doi:10.1016/j.jclepro.2015.05.005
Huang, J. H., Chen, X. D., Huang, B. H., and Chen, T. (2017). Economic and environmental impacts of foreign direct investment in China: A spatial spillover analysis. China Econ. Re-view 45 (9), 289–309. doi:10.1016/j.chieco.2016.03.006
Kim, Jungwook, and Kim, Jinkyeong (2021). Regional patterns of the effect from environmental regulation: CO2 emissions across developed and developing countries[J]. J. APEC Stud. [ISSN:/eISSN 10, 13.
Lan, Hua, and Pan, Yun (2019). Analysis and research on influencing factors of haze weather. J. Phys. Conf. Ser. 1267, 012031. doi:10.1088/1742-6596/1267/1/012031
LeSage James, P. (2008). An introduction to spatial econometrics. rei. 123 (123), 19–44. doi:10.4000/rei.3887
Li, Wenli, Yang, Guangfei, and Li, Xianneng (2021). Correlation between PM2.5 pollution and its public concern in China: Evidence from baidu index. J. Clean. Prod. 293, 126091. doi:10.1016/j.jclepro.2021.126091
List, J. A., and Co, C. Y. (2000). The effects of environmental regulations on foreign direct investment. J. Environ. Econ. Manag. 40 (1), 1–20. doi:10.1006/jeem.1999.1095
Liu, Xiaohong, and Jiang, Keshen (2017). Analyzing effect of urbanization on haze pollution based on static and dynamic spatial panel model[J]. Editor. Office Trans. Chin. Soc. Agric. Eng. 33 (20).
Liu, Xiaoxiao, Wang, Zihe, Sun, Xinran, Zhang, Lu, and Zhang, Ming (2020). Clarifying the relationship among clean energy consumption, haze pollution and economic growth–based on the empirical analysis of China's Yangtze River Delta Region. Ecol. Complex. 44, 100871. doi:10.1016/j.ecocom.2020.100871
Liu, Yafei, Li, Chenlu, Zhang, Chen, Liu, Xingang, Qu, Yu, An, Junling, et al. (2021). Chemical characteristics, source apportionment, and regional contribution of PM2.5 in zhangjiakou, northern China: A multiple sampling sites observation and modeling perspective. Environ. Adv. 3, 100034. doi:10.1016/j.envadv.2021.100034
Liu, Yajie, and Dong, Feng (2021). Exploring the effect of urban traffic development on PM2.5 pollution in emerging economies: Fresh evidence from China. Environ. Sci. Pollut. Res. 28, 57260–57274. (prepublish). doi:10.1007/s11356-021-14366-8
Ma, Tao, and Cao, Xiaoxi (2022). Spatial econometric study on the impact of industrial upgrading on green total factor productivity. Math. Problems Eng. 2022, 1–11. doi:10.1155/2022/1133340
Maddison, D. (2006). Environmental kuznets curves: A spatial econometric approach. J. Environ. Econ. Manag. 51 (2), 218–230. doi:10.1016/j.jeem.2005.07.002
Muhammad, Bilal, Hassan, Mujtaba, Tahir Danyal, Bin Taufiq, Iqbal, Muhammad Shahid, and Imran, Shahid (2022). Understanding the role of atmospheric circulations and dispersion of air pollution associated with extreme smog events over South Asian megacity[J]. Environ. Monit. Assess. 194 (2).
Müller-Fürstenberger, Georg, and Wagner, Martin (2006). Exploring the environmental Kuznets hypothesis: Theoretical and econometric problems[J]. Ecol. Econ. 62 (3).
Qiu, Y., Wang, H., and Wu, J. (2022). Impact of industrial structure upgrading on green innovation: Evidence from Chinese cities[J]. Environ. Sci. Pollut. Res. 23, 1–14.
Shi, Tao, Zhang, Wei, Zhou, Qian, and Wang, Kai (2020). Industrial structure, urban governance and haze pollution: Spatiotemporal evidence from China. Sci. Total Environ. 742, 139228. (prepublish). doi:10.1016/j.scitotenv.2020.139228
Tong, Xin, Li, Xuesen, Tong, Lin, and Chen, Kai (2019). Research of spatial and temporal evolution mechanism and countermeasures of haze spatial pattern in China: Visual field based on dynamic evolution and spatial agglomeration. Adv. Meteorology 2019, 1–16. doi:10.1155/2019/7232481
Van Donkelaar, A., Martin, R. V., Brauer, M., and Boys, B. L. (2015). Use of satellite observations for long-term exposure assessment of global concentrations of fine particulate matter. Environ. Health Perspect. 123, 135–143. doi:10.1289/ehp.1408646
Wang, Feng, He, Jingze, and Niu, Yuan (2022). Role of foreign direct investment and fiscal decentralization on urban haze pollution in China. J. Environ. Manag. 305, 114287. doi:10.1016/j.jenvman.2021.114287
Wang, Hua, and Jin, Y. (2007). Industrial ownership and environmental performance: Evidence from China. Environ. Resour. Econ. (Dordr). 36 (3), 255–273. doi:10.1007/s10640-006-9027-x
Wang, Shuhong, He, Yuqing, and Song, Malin (2021). Global value chains, technological progress, and environmental pollution: Inequality towards developing countries. J. Environ. Manag. 277, 110999. doi:10.1016/j.jenvman.2020.110999
Wang, Yan, Gong, Yuan, Bai, Caiquan, Yan, Hong, and Xing, Yi (2022). Exploring the convergence patterns of PM2.5 in Chinese cities. Environ. Dev. Sustain. 2022, 1–26. doi:10.1007/s10668-021-02077-6
Yang, Yuanhua, and Yan, Dan (2021). Does urban sprawl exacerbate urban haze pollution? Environ. Sci. Pollut. Res. 28 (40), 56522–56534. doi:10.1007/s11356-021-14559-1
Zhang, Chen, Wang, Yuan, Song, Xiaowei, Kubota, Jumpei, He, Yanmin, Tojo, Junji, et al. (2017). An integrated specification for the nexus of water pollution and economic growth in China: Panel cointegration, long-run causality and environmental Kuznets curve. Sci. Total Environ. 609, 319–328. doi:10.1016/j.scitotenv.2017.07.107
Zhang, Ming, Liu, Xiaoxiao, Sun, Xinran, and Wang, Wenwen (2020). The influence of multiple environmental regulations on haze pollution: Evidence from China. Atmos. Pollut. Res. 11 (6), 170–179. doi:10.1016/j.apr.2020.03.008
Zhang, Shengling, Wang, Yao, Liu, Zhiwei, and Yu, Hao (2021). The spatial dynamic relationship between haze pollution and economic growth: New evidence from 285 prefecture-level cities in China. J. Environ. Plan. Manag. 64 (11), 1985–2020. doi:10.1080/09640568.2020.1854694
Zhang, Tong, Ni, Jiupai, and Xie, Deti (2016). Assessment of the relationship between rural non-point source pollution and economic development in the Three Gorges Reservoir Area. Environ. Sci. Pollut. Res. 23 (8), 8125–8132. doi:10.1007/s11356-016-6344-7
Zhang, Yanyan (2020). Analysis of the spatial effects of inter-provincial air pollution in China[J]. Proceedings of the E3S Web of Conferences, Les Ulis, France: Beijing China. June 2020, 194.
Keywords: industrial upgrading, haze pollution, Kuznets curve, spatial Durbin model, threshold effect
Citation: Wang Z, Dai R, Yang J, Bai B and Jiang T (2022) Non-linear effects of industrial structure on urban haze pollution: A test and extension of the environmental Kuznets curve. Front. Environ. Sci. 10:1033563. doi: 10.3389/fenvs.2022.1033563
Received: 31 August 2022; Accepted: 14 November 2022;
Published: 28 November 2022.
Edited by:
Faik Bilgili, Erciyes University, TurkeyReviewed by:
Mofakhar Hussain, University of Toronto, CanadaUtku Utkulu, Dokuz Eylül University, Turkey
Copyright © 2022 Wang, Dai, Yang, Bai and Jiang. This is an open-access article distributed under the terms of the Creative Commons Attribution License (CC BY). The use, distribution or reproduction in other forums is permitted, provided the original author(s) and the copyright owner(s) are credited and that the original publication in this journal is cited, in accordance with accepted academic practice. No use, distribution or reproduction is permitted which does not comply with these terms.
*Correspondence: TianLong Jiang, ODA5Mjg1OTdAcXEuY29t