 Peng Zhao
 Lu Gao
 Miaomiao Ma6
- 1Linze Inland River Basin Research Station, Key Laboratory of Inland River Basin Science, Northwest Institute of Eco-Environment and Resource, Chinese Academy of Sciences, Lanzhou, China
- 2University of Chinese Academy of Sciences, Beijing, China
- 3Institute of Geography, Fujian Normal University, Fuzhou, China
- 4Fujian Provincial Engineering Research Center for Monitoring and Accessing Terrestrial Disasters, Fujian Normal University, Fuzhou, China
- 5Key Laboratory for Humid Subtropical Eco-Geographical Processes of the Ministry of Education, Fujian Normal University, Fuzhou, China
- 6China Institute of Water Resources and Hydropower Research, Beijing, China
Air temperature is the primary indicator of climate change. Reanalysis temperature products are important datasets for temperature estimates over high-elevation areas with few meteorological stations. However, they contain biases in observations, so a bias correction is required to enhance the accuracy of modeling predictions. In this study, we used the temperature lapse-rate method to correct ERA-Interim reanalysis-temperature data in the Qilian Mountains of China from 1979 to 2017. These temperature lapse rates were based on observations (ΓObs) and on model internal vertical lapse rates derived from different ERA-Interim pressure levels (ΓERA). The results showed that the temperature lapse rates in warm periods were larger than those in cold periods. Both the original and corrected ERA-Interim temperature can significantly capture the warming trend exhibited by observations. In general, the temperature lapse rate method was reliable for correcting ERA-interim reanalysis-temperature data. Although ΓObs performed best in bias correction, it depends heavily on the density of ground observation stations and is not appropriate for remote areas with a low data coverage. Correction methods based on ΓERA were shown to be reliable for bias correction, and will be especially applicable to mountainous areas with few observation stations. Our results contribute to the improvement of quality of data products and enhance the accuracy of modeling of climate change effects and risks to the environment and human health.
1 Introduction
The Qilian Mountains (QLM), located on the northeast margin of the Tibetan Plateau (TP), serve as an important ecological security barrier for northwestern China and an important water source for the Heihe River basin (Sun and Liu, 2013; Yang et al., 2020). However, the ecological environment of the QLM has been impacted by human activities, including deforestation, overgrazing, overexploitation of water and energy resources (Yang et al., 2017; Wang X. et al., 2019; Zhou et al., 2019). Ground observations are the most widely used source of data for climate change studies in the QLM. However, surface meteorological stations are sparse in the QLM, especially in high-elevation areas (>2500 m) with complex terrain (Lv et al., 2019), decreasing the prediction value of data (Lin et al., 2017; Wang et al., 2018; Liu et al., 2020a; Liu et al., 2020b; Cheng et al., 2020). Moreover, observation data acquired by surface meteorological stations are inherently limited due to uneven spatiotemporal distribution, especially in mountain areas, and such data may not be sufficient to replicate true variability in the climatic characteristics in the QLM.
Spatial interpolation methods, such as inverse distance weights (IDW) and Kriging interpolation, are generally applied to obtain data in areas lacking observational data (Gao et al., 2018). However, interpolation methods often lead to large errors resulting from inadequate density and uneven spatial distribution of observational stations. Reanalysis data have been widely verified and used because they have higher temporal resolution and longer time series than observation data, and they can substitute for observation data (Gao et al., 2016; Zhang et al., 2019; Zhao et al., 2019; Makama and Lim, 2020; Demchev et al., 2021; Politi et al., 2021; Rakhmatova et al., 2021; Xu et al., 2021; Zhao and He, 2022b). However, some systematic biases exist between reanalysis and observations (Dyakonov et al., 2020; Rakhmatova et al., 2021), necessitating a bias correction of reanalysis.
Bias corrections of ERA-Interim reanalysis data have been studied in previous studies (Di Giuseppe et al., 2013; Kryza et al., 2016; Jones et al., 2017). For example, Bieniek et al. (2016) constructed a downscaling method that effectively reduced biases between reanalysis and observation data, especially for those errors that were caused by elevation differences. Szczypta et al. (2011) constructed a GPCP (product of the Global Precipitation Climatology Project) correction method to correct ERA-Interim data and showed that this method can reduce biases between ERA-Interim and observation data. Gao et al. (2014) constructed a LASSO (least absolute shrinkage and selection operator) algorithm and found that this method performed well in predicting the occurrence of a precipitation event, and reduced biases for some observational stations more than other downscaling methods. Paredes et al. (2018) used a regression correction method to correct ERA-Interim data and showed that it could significantly reduce root-mean-square-error (RMSE) between ERA-Interim and observations.
Previous studies have shown that this bias can be significantly corrected and reduced by an elevation correction method. Temperature lapse rates, representing the empirical relationship between elevation and temperature, are often applied to interpolate observations or to scale model results of near surface air temperature with respect to elevation as well as for generating the required small-scale information of near surface air temperature (Gao et al., 2012; Gao et al., 2017). The most common used value for temperature lapse rate is −6.0 and −6.5°C to more complex approaches, which use varied numbers for the month of the year or at least different values for different seasons. However, a fixed lapse rate can be problematic because temperature gradients can vary significantly over short time periods and short distances, especially in complex terrain. The variability of lapse rate may be affected by many factors (Jiang et al., 2016; Qing et al., 2018). This lapse rate variability can just be monitored by dense meteorological station networks or by using alternative methods that can cover the temporal and spatial change of air temperature.
A solution is to use reanalysis data for different pressure levels that can also be used for a characterization of lapse rates and a subsequent downscaling of modeled temperatures that are independent with observations (Gao et al., 2012; Gao et al., 2017). For example, Gao et al. (2017) used the temperature lapse rate method to correct ERA-Interim reanalysis temperature data and showed that this method could correct ERA-Interim temperature data and improve the quality of downscaling. Gao et al. (2012) constructed a temperature-correction model by using ERA-Interim temperature and geopotential height at 925 hPa, 850 hPa and 700 hPa levels, independent of meteorological stations; subsequent tests showed that the model could successfully correct ERA-Interim. Previous studies about the correction of reanalysis temperature in the Chinese Qilian Mountains remained unclear. Our studies can provide a reference when using and correcting reanalysis temperature in the Qilian Mountains.
Here, we used ERA-Interim temperature and geopotential height at 600 hPa, 700 hPa, 850 hPa, and 925 hPa to calculate temperature lapse rates and combine lapse rates derived from observations to correct ERA-Interim reanalysis temperature data, with the purpose of revealing climatic trends based on optimally corrected ERA-Interim data. The ERA-Interim reanalysis data, observational temperature data and correction methods are introduced in Section 2. The correction results were shown in Section 3. The discussion is analyzed in Section 4. Finally, the conclusions in this study are summarized in Section 5.
2 Data and methods
2.1 ERA-Interim data (Te)
ERA-Interim reanalysis data were downloaded from the European Centre for Medium Range Weather Forecasts (ECMWF); the data had a time step of 6 h (00.00, 06.00, 12.00, and 18.00 UTC), spatial resolution of 0.25 × 0.25°, and covered a time period from 1 January 1979 to 31 December 2017. Geographical locations of the ERA-Interim grid points spanned 35.5–40.75°N and 93.0–104.5°E, sufficient to cover the entire QLM (Figure 1). A time difference conversion method was applied to match the ERA-Interim temperature data in UTC time zone and observation data in local time. The used output variables are 2 m temperature, surface geopotential as well as temperature and geopotential height at 600, 700, 850, and 925 hPa levels. The ERA-Interim surface geopotential height (HERA) was obtained by dividing geopotential by gravity at each grid point. Altitudes corresponding to the four pressure layers (600, 700, 850, and 925 hPa) were approximately 4,000, 3,000, 1,500, and 500 m, respectively. It should be noted that the main reason for the selection of these pressure layers was that the geopotential heights of these pressure layers can reflect true characteristics of mountain climate (Gao et al., 2018), and can cover the altitude range of most stations in the QLM, which is convenient for subsequent correction and comparison.

FIGURE 1. Distribution of the ERA-Interim grid points and meteorological stations in the QLM.
2.2 Observations (To)
Observational temperature data and altitude information recorded by meteorological stations were downloaded from the China Meteorological Data Sharing Service System of the National Meteorological Information Center (http://cdc.cma.gov.cn/index.jsp). The quality of observed temperature data was strictly controlled and verified by the data provider. The quality and completeness of observed temperature data are significantly improved after controlling, so it can be applied directly in climate change research. Twenty-four meteorological stations located in the QLM were selected. Observations from these stations included altitude, latitude, longitude, daily mean temperature, daily maximum temperature, and daily minimum temperature. Detailed information on the 24 meteorological stations can be found in Table 1. Briefly, these stations are located at different altitudes ranging from approximately 1,000–3,500 m. The highest station is Station No.15 with an altitude of 3,460 m, and the lowest station is Station No.1 with an altitude of 1,100 m. The geographical distribution of the 24 meteorological stations and ERA-Interim grid points are shown in Figure 1 and Table 1. There are positive elevation differences at 23 stations, only Station No.11 has a negative elevation difference between Te and To. ERA-Interim grid points nearest to each meteorological station were selected for comparison based on the longitude and latitude coordinates of 24 meteorological stations, which can avoid the error caused by multigrid spatial interpolation (Zhao et al., 2020). Four seasons were defined as: spring (March to May), summer (June to August), autumn (September to November), and winter (December to February).
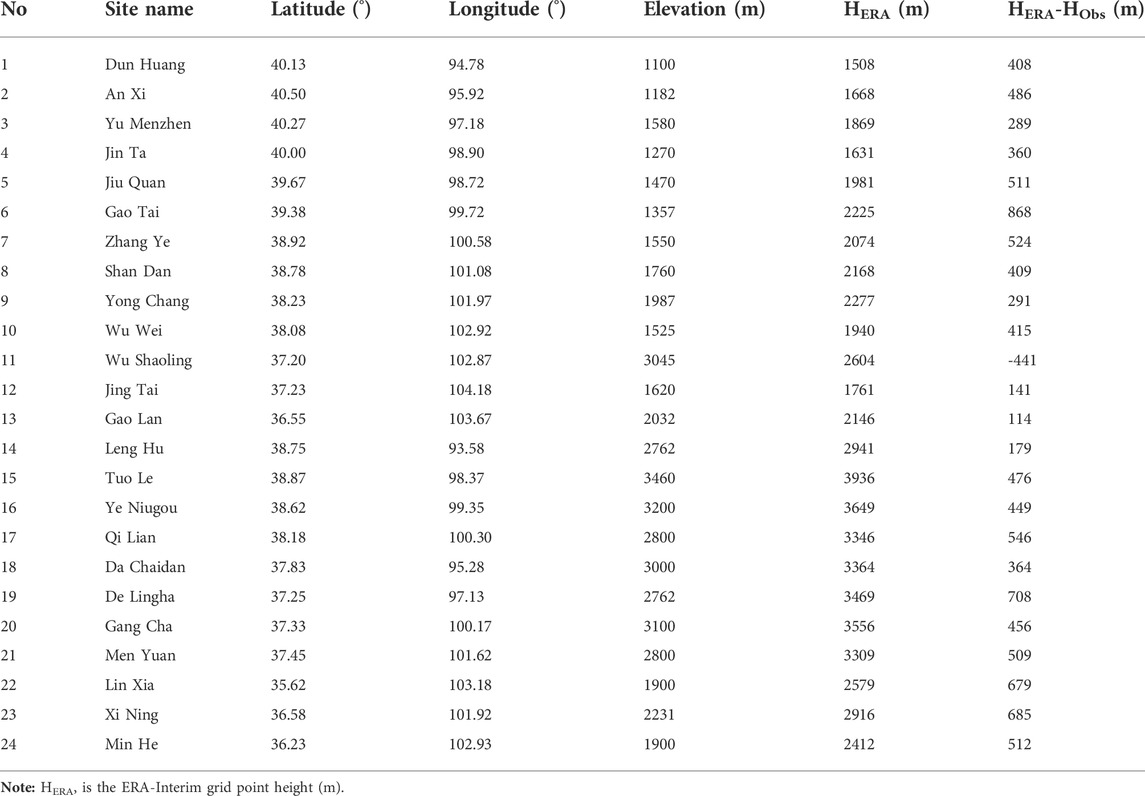
TABLE 1. Meteorological stations information.
2.3 Correction methods
ERA-Interim reanalysis temperature data were corrected using Equation 1:
where Tt is the corrected temperature, and Tref is the temperature to be corrected. △h is the elevation difference between meteorological stations and ERA-Interim grid points. Γ represents temperature lapse rates calculated from observations and ERA-Interim temperatures as well as geopotential heights at different pressures. Γ can be calculated from Equations 2–6. These calculations were repeated to obtain temperature lapse rates for five different sets of pressures, here referred to as Methods I–V (Table 2). ERA-Interim internal lapse rates are fully independent of observations (Gao et al., 2017). Γ600-700, Γ600-850, Γ700-850, Γ700-925 represent the temperature lapse rates at four pressure levels. T600, T700, T850 and T925 represent the temperature at 600, 700, 850 and 925 hPa pressure level, respectively. H600, H700, H850 and H925 represent the height at 600, 700, 850 and 925 hPa pressure level, respectively. ΓObs is the temperature lapse rate calculated from observations. TObs and HObs are the temperature and elevation of meteorological stations, respectively.
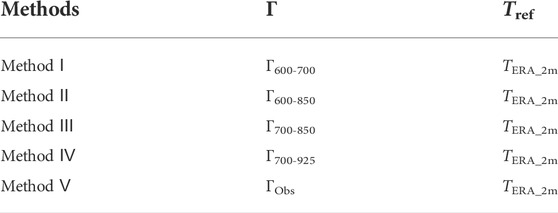
TABLE 2. Summary of Γ and Tref used in five correction methods for 24 test stations.
3 Results
3.1 Variability in temperature lapse rates
Table 3 and Figure 2 show the variability in five temperature lapse rates over a 12-month period across the QLM; these lapse rates are Γ600-700, Γ600-850, Γ700-850, Γ700-925, and ΓObs. The four ERA-Interim temperature lapse rates (ΓERA) were different from the temperature lapse rate based on observations (ΓObs) with ΓObs was lower than ΓERA across the whole period in general. The five temperature lapse rates initially increased, and then decreased across the 12-month period, with the largest values in May and June (Figure 3). The lowest temperature lapse rates were found in winter.
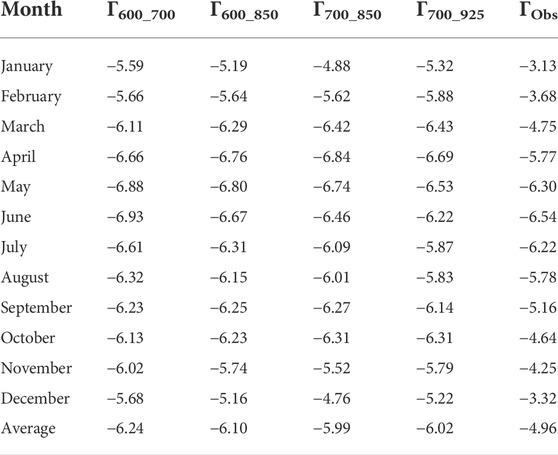
TABLE 3. Monthly lapse rates (°C/km) based on observations (ΓObs) and ERA-Interim (Γ600_700, Γ600_850, Γ700_850, and Γ700_925) during the period 1979–2017.

FIGURE 2. Box plots of monthly mean ΓObs and ΓERA during the period 1979‒2017.
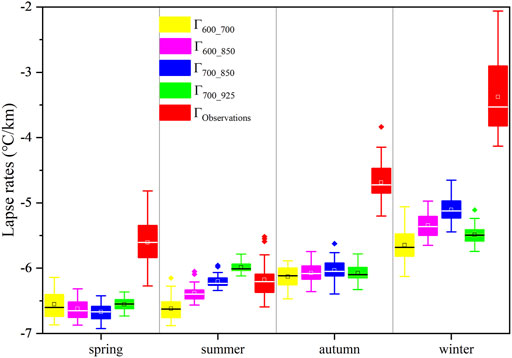
FIGURE 3. Box plots of seasonal mean ΓObs and ΓERA during the period 1979‒2017.
3.2 Evaluation of correction methods
Table 4 shows the biases between observed and original ERA-Interim temperature as well as corrected ERA-Interim temperature for 24 meteorological stations during the period 1979–2017. The bias between observed and original ERA-Interim temperature at Station No.11 was positive (2.83°C), which indicated that ERA-Interim data were higher than observation data at Station No.11. Biases at Station No.11 remained positive after correction, but biases were smaller than the uncorrected ERA-Interim; the smallest bias for corrected ERA-Interim was found using Method Ⅰ (0.08°C). Biases between the original ERA-Interim temperature and observed temperature at Stations No.12, 13, and 15 were negative (−1.33, −1.05, and −3.86°C, respectively), which indicated that ERA-Interim data were lower than observation data. There were also clear biases for the five sets of corrected ERA-Interim temperature at these stations, and these biases were also negative. The largest reductions in bias were obtained with Method Ⅰ, in which they were reduced to −0.45, −0.34, and −0.90°C at Stations No.12, 13 and 15, respectively. Biases between original ERA-Interim and observed temperatures were also negative at Stations No.8, 20, 21 and 24 (−2.06, −2.54, −2.57 and −3.02°C, respectively), which again indicated that ERA-Interim data were lower than observation data. The largest reductions in bias for these four stations were found by correcting ERA-Interim using Method Ⅴ, and biases were reduced to −0.03, −0.27, −0.05, and −0.48°C, respectively. Biases for corrected ERA-Interim at these four stations using Methods Ⅰ‒Ⅳ were larger and remained negative. For all other stations, biases for uncorrected ERA-Interim were negative, but those for corrected ERA-Interim (using all five methods) were positive. Generally, the corrected results obtained via Method Ⅴ were better than those obtained with the other four methods, which was mainly because the temperature lapse rates of Method Ⅴ were calculated using observation data, while those of the other four methods were calculated using ERA-Interim data. Biases for corrected ERA-Interim using Method Ⅰ were generally smaller than when using Methods II‒IV; this may be because the temperature lapse rates of Method Ⅰ were calculated with ERA-Interim height and temperature in the 600–700 hPa range, and the geopotential height in this range is higher than that at the other three pressure levels used. Meteorological stations in the QLM are mainly at elevations above 2,000 m; therefore, temperature lapse rates may be not applicable to the correction of ERA-Interim temperature data for those areas where elevations are below 1,500 m.
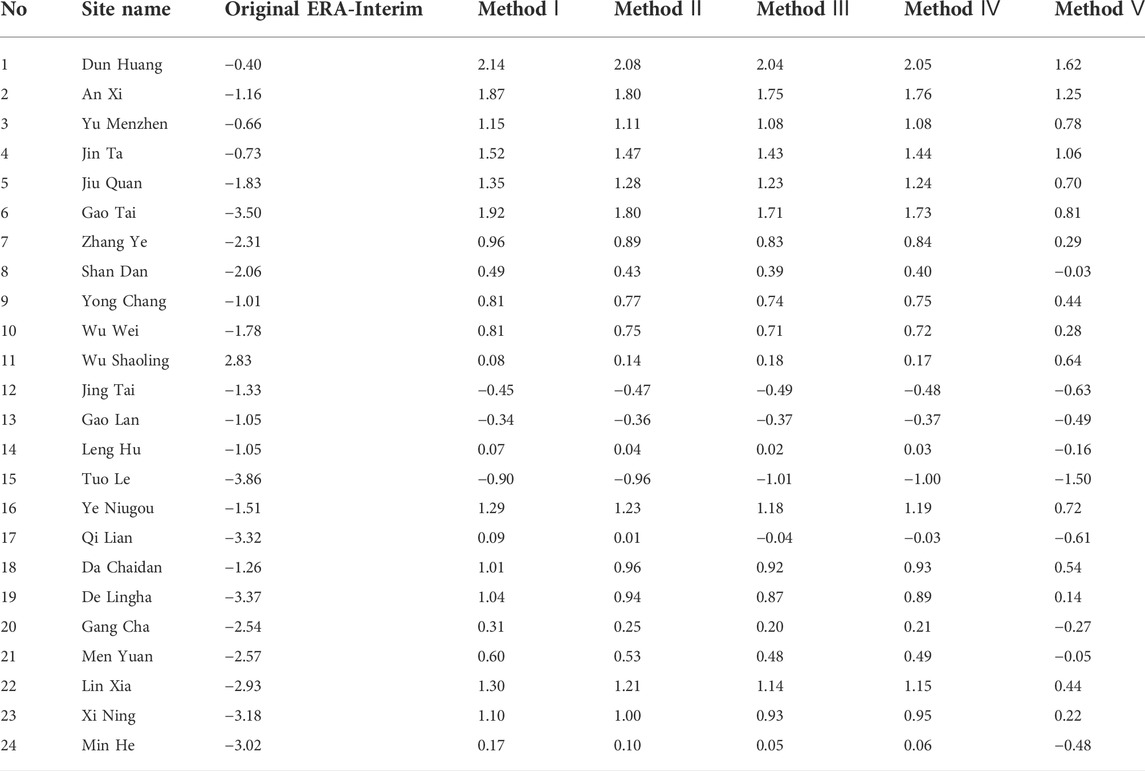
TABLE 4. Biases (°C) between daily observed and original ERA-Interim temperature, and between observed and corrected ERA-Interim temperature (Methods I‒V) for 24 meteorological stations during the period 1979–2017.
Table 5 shows seasonal biases between observed temperature and original ERA-Interim temperature, and for the corrected ERA-Interim temperature data for the QLM. In general, all five correction methods showed significantly reduced biases compared to those between observed and original ERA-Interim temperature. Biases for corrected ERA-Interim temperature data with four methods, and the correction result obtained using Method Ⅳ were markedly lower. The mean seasonal biases of the original ERA-Interim and the four correction methods based on the ΓERA were 0.77, 0.71, 0.67, 0.68, and 0.24°C, respectively. Corrected biases for spring and autumn were generally smaller than for summer and winter. For example, with Method Ⅴ, biases in spring, summer, autumn, and winter were 0.03, 0.55, 0.07, and 0.30°C, respectively. Correlation coefficients (r) between observations and original ERA-Interim as well as corrected ERA-Interim were all above 0.9 (Table 6). RMSE improved (decreased) for the corrected ERA-Interim temperature data (Table 7). RMSE for corrected ERA-Interim temperature data decreased for Stations No. 5–24 indicating that temperature lapse rates effectively corrected ERA-Interim temperature at these stations. Method Ⅰ performed best at Station 11, reducing RMSE by 91%. Methods Ⅱ, III, and Ⅳ performed best at Station No.17, reducing RMSE by 90.3, 90.2, and 90.3%, respectively. Method Ⅴ performed best at Station No.19, reducing RMSE by 91.6%. However, RMSE increased for corrected ERA-Interim temperature data at Stations No. 1-4 compared to those for non-corrected ERA-Interim temperature data. This may be due to low elevations of these four stations, which were below 1600 m. Therefore, temperature lapse rates may be unsuitable for correcting ERA-Interim temperature data at these stations. The average RMSE for corrected ERA-Interim temperature data across the 24 meteorological stations using our correction methods were 0.98, 0.94, 0.91, 0.92, and 0.70, respectively for Methods I to V, representing reductions in the mean RMSE of 50.2%, 52.2%, 53.9%, 53.5%, and 65.3%, respectively, compared to the uncorrected ERA-Interim data. In general, Method Ⅴ performed best. Correction Methods Ⅰ‒Ⅳ performed better than Method Ⅴ at Stations No. 11, 12, 13, 14, 15, 17, 20, and 24. These eight stations were at high elevations; stations No.11, 15, and 20 were located at altitude above 3,000 m; 13, 14, and 17 were at were located at altitude above 2,000 m, and 12 and 24 were at were located at altitude above 1500 m. Methods Ⅰ‒Ⅳ may therefore be more suitable for correcting ERA-Interim temperature data at high-elevation meteorological stations.
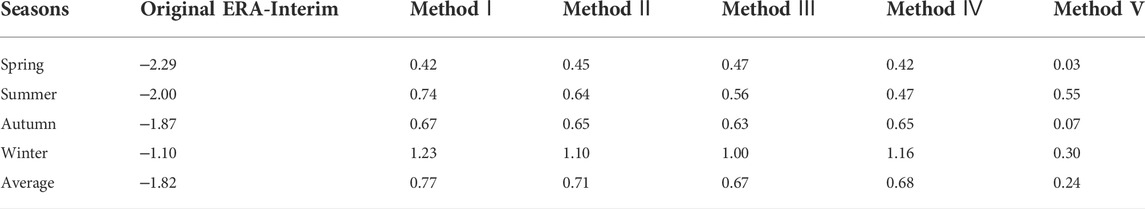
TABLE 5. Mean seasonal bias (°C) of original ERA-Interim temperature and corrected temperature data compared with observed temperature for 24 meteorological stations during the period 1979–2017.
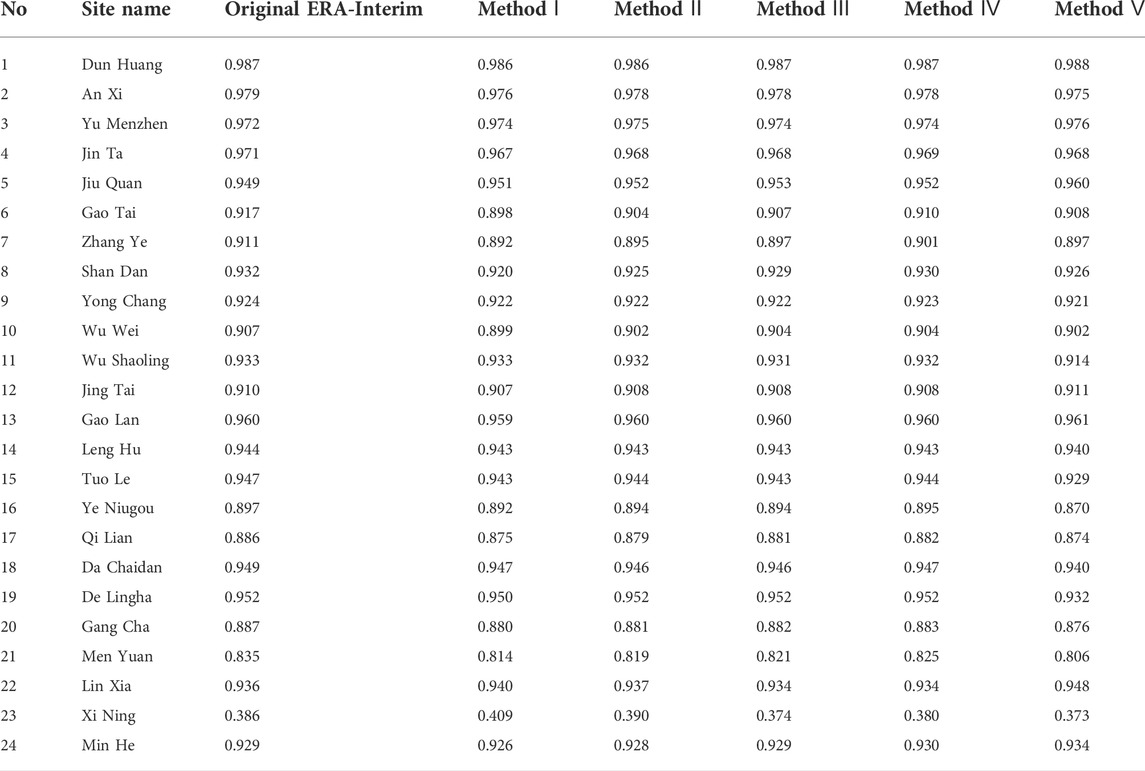
TABLE 6. Correlation coefficients (r) between daily observed and original ERA-Interim temperature, and between observed temperature and data obtained from five correction methods for 24 meteorological stations during the period 1979–2017.
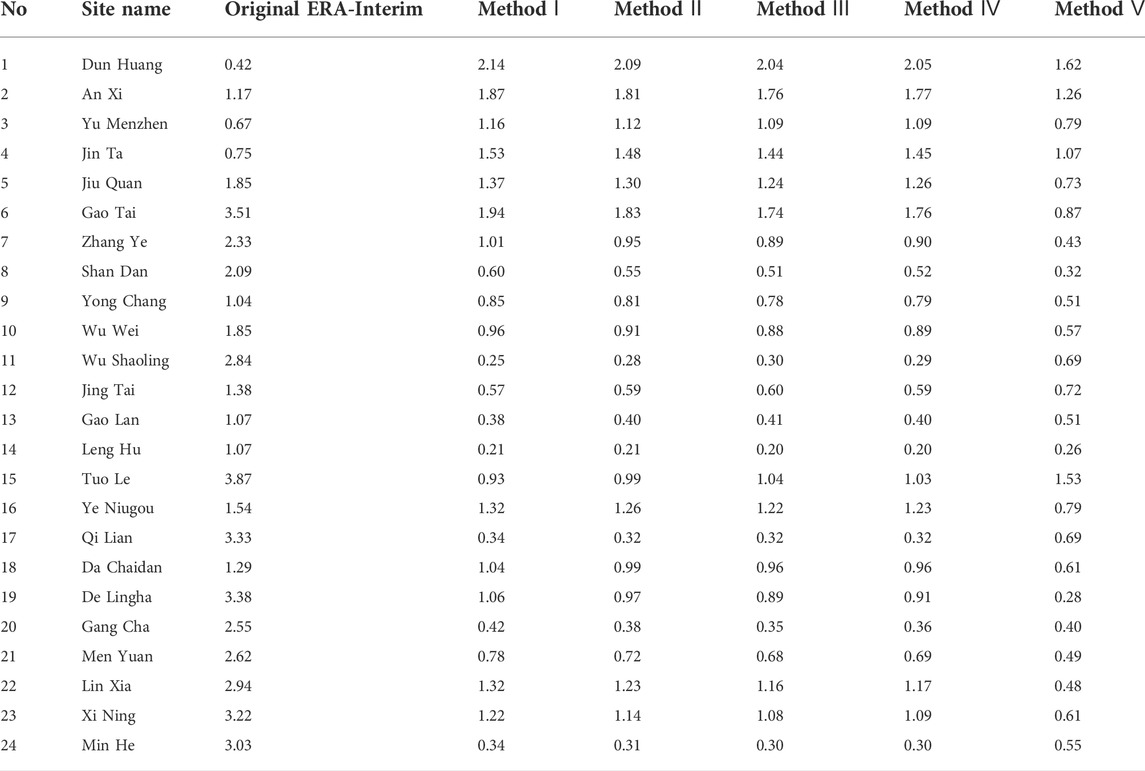
TABLE 7. RMSE (°C) between daily observed and original ERA-Interim temperature, and between observed temperature and data obtained from five correction methods for 24 meteorological stations during the period 1979–2017.
3.3 Plateau-wide temperature climatology and trends
Figure 4 shows the inter-annual variations and warming trends over the QLM from 1979 to 2017. The ERA-Interim and corrected temperature can successfully capture trends in the observations, including an increasing trend in observed temperature, original ERA-Interim temperature, and corrected temperature during the period 1979–2017 (Table 8). The largest increasing rate was found in summer (0.55°C/decade), and the smallest increasing rate was found in winter (0.34°C/decade). The increasing trends shown by both the original ERA-Interim temperature and corrected temperature data underestimated the warming trend exhibited by observation data. The internal variability and increasing trends were similar for Methods Ⅰ‒Ⅳ, while Method Ⅴ most closely matched the warming trend of the observed temperatures. In general, Method Ⅴ reflected the best correction results, showing the smallest biases at a seasonal scale, and the best reflection of warming rates in the QLM.
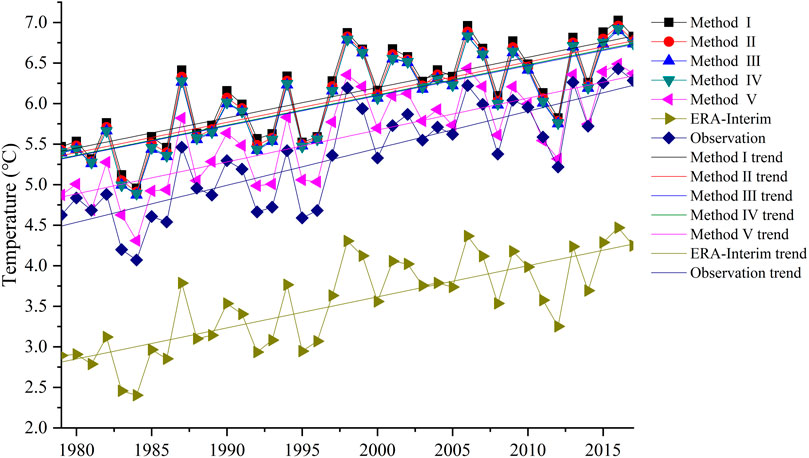
FIGURE 4. Inter-annual variability and warming trends in the QLM temperatures: observed, original ERA-Interim temperature, and corrected using five lapse rates, during the period 1979‒2017.
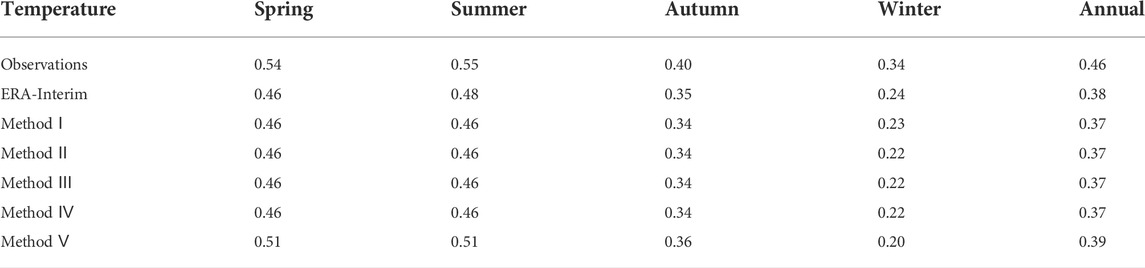
TABLE 8. Seasonal warming trends (°C/decade) observed, original ERA-Interim temperature, and temperatures corrected with five methods for the period 1979-2017 in the QLM.
4 Discussion
4.1 Analysis of temperature lapse rates
Our results indicated that temperature lapse rates exhibited bigger values in warm periods and smallest values in cold periods, which is mainly because the cold air invasion in winter has a more dramatic effect on the temperature at low altitudes than at high altitudes. (Jiang et al., 2016). Qing et al. (2018) also found that temperature lapse rates during warmer months are bigger than that in colder months in the QLM, which is consistent with this study. In this study, the absolute value of ΓObs was lower than that of ΓERA, and the lowest temperature lapse rates were detected in winter, which is consistent with previous research (Jiang et al., 2016).
4.2 Analysis of correction results
The corrected temperatures obtained in this study using Method Ⅴ were better than those obtained using the other four correction methods in terms of the increasing trend in observed temperature, which was similar with previous studies (Gao et al., 2012; Gao et al., 2017). The temperature lapse rates in Method Ⅴ were calculated using observed temperature data, the correction results were tested with observation data, and the method depends critically on the density of ground observation stations; therefore, Method Ⅴ may outperform the other methods. However, although Method Ⅴ performed well, mountainous areas have few meteorological stations, therefore this method cannot be widely promoted. Gao et al. (2012) also found that temperature lapse rates calculated from observations were not reliable when observations contained outliers. Methods Ⅰ‒Ⅳ, which were based on ΓERA, were more flexible and independent of meteorological stations, may be applicable to correcting temperature data specifically for high-elevation stations. Furthermore, this method should be easy to extend, and will be particularly useful in mountainous areas with few observation stations. The most important advantage is that the method based on ΓERA is fully independent from the observed data. Thus, it provides a tool for correcting ERA-Interim temperature data for any high mountainous areas where no observations exist (Gao et al., 2018; Luo et al., 2019; Fan et al., 2021). Gao et al. (2017) indicates that the correction method using ERA-Interim internal vertical lapse rates can capture the inter-annual variations for the plateau-wide climatology very well, which is similar with this study. The bias reflects the specific difference of temperature before and after the correction, while the correlation coefficient mainly reflects the similarity between the site observations and the ERA-Interim temperature changes. The correction method based on temperature lapse rate mainly corrects the ERA-Interim temperature according to the height difference between meteorological stations and reanalysis grid points. Therefore, it mainly corrects the systematic errors between ERA-Interim temperature and observed values, which has little influence on the temperature trend. This is the reason why the bias of some sites decreased after correction, but the correlation coefficient did not change much. The correction skills are weak in winter except for Method V (Table 5, Table 8). In addition to the altitude difference, the snow cover and glaciers may also be the main reasons for the bias in winter (Zhao and He, 2022a), so the elevation correction method may not be suitable for the bias correction in winter. In addition, after comparing biases, RMSE, and r of Methods Ⅰ‒Ⅳ based on ΓERA, we concluded that the corrected results using Method Ⅲ were superior to those using Methods Ⅰ, Ⅱ, and Ⅳ. The seasonal bias, RMSE, r, and mean station biases of Method Ⅲ were 0.67°C, 0.91°C, 0.905, and 0.67°C, respectively (Table 9). Hence, Method Ⅲ should be the most suitable for the correction of ERA-Interim temperature data in the Qilian Mountains. Gao et al. (2012) found that using (global climate) model showed a convincing performance when compared to measured data of the twelve stations, again especially for those in higher elevations, which is similar with this study.
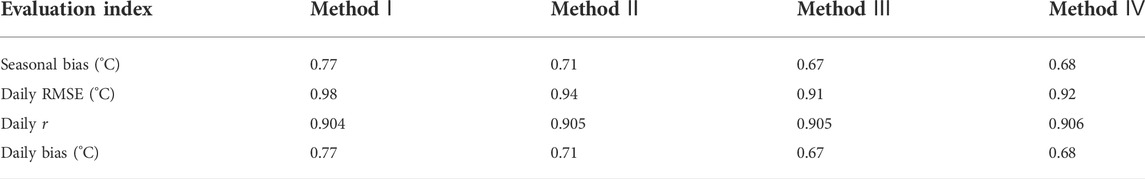
TABLE 9. Comparison of four correction methods based on ΓERA.
4.3 Analysis of potential uncertainties
Although the five correction methods can improve the accuracy of ERA-Interim temperature data, they do not consider the characteristics of terrain or geographical location. Errors between the observed and ERA-Interim temperature data were not only caused by the differences between the station and ERA-Interim grid cell elevation, but also by other factors, such as the large-scale error of ERA-Interim, glacier, and errors introduced by the assimilation system and the interpolation method (Dee, 2005; Dee and Uppala, 2009). Therefore, it may not be sufficient to correct ERA-Interim temperature using only the temperature lapse rate; additional influencing factors need to be considered in future research. The 24 meteorological stations considered in this study were situated at different altitudes and were widely spaced geographically. Discrepancies exist in direct comparisons of temperature lapse rates established using observation data and those established using ERA-Interim data. The 2881 ERA-interim grid points shown in Figure 1 span a large area, covering not only the QLM, but also areas adjacent to the QLM. Some of these grid points were located in the interior of the Tibetan Plateau, which increased terrain complexity and may lead to different temperature lapse rates. Moreover, due to the spatial location and altitude of the 24 meteorological stations are different, the calculated temperature lapse rates cannot represent a single station, but instead, represent a generalized area. Whether the representativeness is significant or not is worthy of a further study. Finally, in the formula Tt=Tref +Γ×△h, the Tref uses the ERA-Interim 2 m temperature values corresponding to the 24 stations, and the system error for Tref is transferred, contributing to the final correction error. In addition, temperature lapse rate changes could be more variable from surface to within boundary layer and in the presence of clouds, which may affect the overall bias correction.
4.4 Future research
The aims of the error corrections performed in this study were to verify the reliability of the method and to establish a foundation for future downscaling research. For example, with DEM data for the entire QLM, we can correct all 2881 ERA-Interim grid points using Method III, and obtain temperature data from all grid points. ERA-Interim temperature data can be downscaled to higher resolution, contributing to a high-resolution data set for climate change research in this region (Gao et al., 2018; Fan et al., 2021). We focused on ERA-Interim data in this study, which is the third-generation reanalysis product of the ECMWF. However, future studies can extend the methods used here to other reanalysis products such as ERA5 and ERA5-Land (Wang C. et al., 2019; Liu et al., 2021; Zhao and He., 2022a). In addition, it would be worth trying to use radiosonde vertical profiles to calculate lapse rates and to verify the same in this study. Moreover, temperature lapse rate may vary in different atmospheric conditions and slightly from one geographical location, especially in the boundary layer and in the presence of cloud.
5 Conclusions
In this study, ERA-Interim temperature data were corrected using temperature lapse rate methods, with the corrected results were verified using bias, r, and RMSE. Four ERA-Interim temperature lapse rates (ΓERA) were different from the temperature lapse rate based on observations (ΓObs). The ΓERA and ΓObs in warm periods were larger than those in cold periods. Biases indicated that the corrected results using Method Ⅴ were more accurate than those using the other four methods. Among the four ERA-Interim temperature lapse rates (i.e., Methods I‒IV), Method III generally performed best. For seasonal biases, Method Ⅴ performed best. The mean seasonal biases of the original ERA-Interim and the four correction methods based on the ΓERA were 0.77, 0.71, 0.67, 0.68, and 0.24°C, respectively, with significant correlation coefficients (r > 0.9). In general, the corrected results for spring and autumn were more accurate than those for summer and winter. For the correction coefficient (r), the corrected r was above 0.9 for the majority of meteorological stations. The RMSE for corrected ERA-Interim improved compared to RMSE for uncorrected ERA-Interim for 19 stations, indicating that the temperature lapse rate method was suitable for correcting ERA-Interim temperature data. The mean RMSE of the five correction methods used here for data from 24 stations were 0.98°C, 0.94°C, 0.91°C, 0.92°C, and 0.70°C, respectively. The ERA-Interim and five sets of corrected temperature data successfully captured the trend of increasing observed temperatures in the QLM for the period 1979–2017. In general, temperature lapse rate method is reliable for correcting reanalysis temperature data. Although ΓObs performed best in bias correction, it critically depends on the density of ground observation stations. Correction methods based on ΓERA were shown to be reliable for bias correction and are applicable in mountainous areas with few observation stations.
Data availability statement
Publicly available datasets were analyzed in this study. This data can be found here: https://apps.ecmwf.int/datasets/data/interim-full-daily/levtype=sfc/.
Author contributions
PZ: Designed study, collected meteorological data and write article. LG, MM and JD: Final edit and provide fund support.
Funding
This study was supported by the National Key Research and Development Program of China, No. 2019YFC0507403, the National Key Program for Developing Basic Science, Grant No. 2018YFC1505805, the Scientific Project from Fujian Provincial Department of Science and Technology, No. 2019R1002-3, and the Scientific Project from Fujian Key Laboratory of Severe Weather, No. 2020KFKT01.
Conflict of interest
The authors declare that the research was conducted in the absence of any commercial or financial relationships that could be construed as a potential conflict of interest.
Publisher’s note
All claims expressed in this article are solely those of the authors and do not necessarily represent those of their affiliated organizations, or those of the publisher, the editors and the reviewers. Any product that may be evaluated in this article, or claim that may be made by its manufacturer, is not guaranteed or endorsed by the publisher.
References
Bieniek, P. A., Bhatt, U. S., Walsh, J. E., Rupp, T. S., Zhang, J., Krieger, J. R., et al. (2016). Dynamical downscaling of ERA-interim temperature and precipitation for Alaska. J. Appl. Meteorol. Climatol. 55, 635–654. doi:10.1175/jamc-d-15-0153.1
Cheng, P., Kong, X., Luo, H., and Wang, Y. (2020). Climate change and its runoff response in the middle section of the Qilian Mountains in the past 60 years. Arid. land Geogr. 43, 1192–1201.
Dee, D. P., and Uppala, S. (2009). Variational bias correction of satellite radiance data in the ERA-Interim reanalysis. Q. J. R. Meteorol. Soc. 135, 1830–1841. doi:10.1002/qj.493
Dee, D. P. (2005). Bias and data assimilation. Q. J. R. Meteorol. Soc. 131, 3323–3343. doi:10.1256/qj.05.137
Demchev, D. M., Kulakov, M. Y., Makshtas, A. P., Makhotina, I. A., Fil’chuk, K. V., and Frolov, I. E. (2021). Verification of ERA-interim and ERA5 reanalyses data on surface air temperature in the arctic. Russ. Meteorol. Hydrol. 45, 771–777. doi:10.3103/s1068373920110035
Di Giuseppe, F., Molteni, F., and Dutra, E. (2013). Real-time correction of ERA-Interim monthly rainfall. Geophys. Res. Lett. 40, 3750–3755. doi:10.1002/grl.50670
Dyakonov, G. S., Ibrayev, R. A., and Shishkova, P. O. (2020). Assessment of ERA-interim reanalysis data quality for the caspian sea area. Russ. Meteorol. Hydrol. 45, 650–657. doi:10.3103/s106837392009006x
Fan, M., Xu, J., Chen, Y., and Li, W. (2021). Reconstructing high-resolution temperature for the past 40 years in the Tianshan Mountains, China based on the Earth system data products. Atmos. Res. 253, 105493. doi:10.1016/j.atmosres.2021.105493
Gao, L., Bernhardt, M., and Schulz, K. (2012). Elevation correction of ERA-Interim temperature data in complex terrain. Hydrol. Earth Syst. Sci. 16, 4661–4673. doi:10.5194/hess-16-4661-2012
Gao, L., Bernhardt, M., Schulz, K., and Chen, X. (2017). Elevation correction of ERA-Interim temperature data in the Tibetan Plateau. Int. J. Climatol. 37, 3540–3552. doi:10.1002/joc.4935
Gao, L., Bernhardt, M., Schulz, K., Chen, X., Chen, Y., and Liu, M. (2016). A first evaluation of ERA-20cm over China. Mon. Weather Rev. 144, 45–57. doi:10.1175/mwr-d-15-0195.1
Gao, L., Schulz, K., and Bernhardt, M. (2014). Statistical downscaling of ERA-interim forecast precipitation data in complex terrain using LASSO algorithm. Adv. Meteorology 2014, 1–16. doi:10.1155/2014/472741
Gao, L., Wei, J., Wang, L., Bernhardt, M., Schulz, K., and Chen, X. (2018). A high-resolution air temperature data set for the Chinese Tian Shan in 1979–2016. Earth Syst. Sci. Data 10, 2097–2114. doi:10.5194/essd-10-2097-2018
Jiang, J. C., Liu, J. Z., Qin, C. Z., Miao, Y. M., and Zhu, A. X. (2016). Near-surface air temperature lapse rates and seasonal and type differences in China. Prog. Geogr. 35, 1538–1548.
Jones, P. D., Harpham, C., Troccoli, A., Gschwind, B., Ranchin, T., Wald, L., et al. (2017). Using ERA-Interim reanalysis for creating datasets of energy-relevant climate variables. Earth Syst. Sci. Data 9, 471–495. doi:10.5194/essd-9-471-2017
Kryza, M., Wałaszek, K., Ojrzyńska, H., Szymanowski, M., Werner, M., and Dore, A. J. (2016). High-resolution dynamical downscaling of ERA-interim using the WRF regional climate model for the area of Poland. Part 1: Model configuration and statistical evaluation for the 1981–2010 period. Pure Appl. Geophys. 174, 511–526. doi:10.1007/s00024-016-1272-5
Lin, P., He, Z., Du, J., Chen, L., Zhu, X., and Li, J. (2017). Recent changes in daily climate extremes in an arid mountain region, a case study in northwestern China's Qilian Mountains. Sci. Rep. 7, 2245. doi:10.1038/s41598-017-02345-4
Liu, H., Li, Y., Zhang, X., and Xu, M. L. (2021). Climate differences in different time scales in the east and west sections of the Qilian Mountains. J. Lanzhou Univ. Nat. Sci. 56, 724–732. doi:10.13885/j.issn.0455-2059.2020.06.003
Liu, J., Hagan, D. F. T., and Liu, Y. (2020a). Global land surface temperature change (2003–2017) and its relationship with climate drivers: AIRS, MODIS, and ERA5-land based analysis. Remote Sens. 13, 44. doi:10.3390/rs13010044
Liu, J., Jiang, G., Wu, Q., Zhang, T., and Gao, S. (2020b). Regional climate change signals inferred from a borehole temperature profile in Muli, Qilian Mountain, using the Tikhonov method. Arct. Antarct. Alp. Res. 52, 450–460. doi:10.1080/15230430.2020.1801149
Luo, H., Ge, F., Yang, K., Zhu, S., Peng, T., Cai, W., et al. (2019). Assessment of ECMWF reanalysis data in complex terrain: Can the CERA‐20C and ERA‐Interim data sets replicate the variation in surface air temperatures over Sichuan, China? Int. J. Climatol. 39, 5619–5634. doi:10.1002/joc.6175
Lv, Y., Li, Z., Feng, Q., Li, Y. G., Yuan, R. F., Gui, J., et al. (2019). Analysis of extreme temperature changes in Qilian Mountains in the past 60years. Plateau meteorol. 38, 959–970.
Makama, E. K., and Lim, H. S. (2020). Variability and trend in integrated water vapour from ERA-interim and IGRA2 observations over peninsular Malaysia. Atmosphere 11, 1012. doi:10.3390/atmos11091012
Paredes, P., Martins, D. S., Pereira, L. S., Cadima, J., and Pires, C. (2018). Accuracy of daily estimation of grass reference evapotranspiration using ERA-Interim reanalysis products with assessment of alternative bias correction schemes. Agric. Water Manag. 210, 340–353. doi:10.1016/j.agwat.2018.08.003
Politi, N., Vlachogiannis, D., Sfetsos, A., and Nastos, P. T. (2021). High-resolution dynamical downscaling of ERA-Interim temperature and precipitation using WRF model for Greece. Clim. Dyn. 57, 799–825. doi:10.1007/s00382-021-05741-9
Qing, W. W., Han, C. T., and Liu, J. F. (2018). A study on temperature lapse rate in Hulugou watershed, Qilian Mountains. J. Lanzhou Univ. Nat. Sci. 54, 44–50+58. doi:10.13885/j.issn.0455-2059.2018.01.008
Rakhmatova, N., Arushanov, M., Shardakova, L., Nishonov, B., Taryannikova, R., Rakhmatova, V., et al. (2021). Evaluation of the perspective of ERA-interim and ERA5 reanalyses for calculation of drought indicators for Uzbekistan. Atmosphere 12, 527. doi:10.3390/atmos12050527
Sun, J., and Liu, Y. (2013). Drought variations in the middle Qilian Mountains, northeast Tibetan Plateau, over the last 450 years as reconstructed from tree rings. Dendrochronologia 31, 279–285. doi:10.1016/j.dendro.2012.07.004
Szczypta, C., Calvet, J. C., Albergel, C., Balsamo, G., Boussetta, S., Carrer, D., et al. (2011). Verification of the new ECMWF ERA-Interim reanalysis over France. Hydrol. Earth Syst. Sci. 15, 647–666. doi:10.5194/hess-15-647-2011
Wang, C., Graham, R. M., Wang, K., Gerland, S., and Granskog, M. A. (2019a). Comparison of ERA5 and ERA-interim near-surface air temperature, snowfall and precipitation over arctic sea ice: Effects on sea ice thermodynamics and evolution. Cryosphere 13, 1661–1679. doi:10.5194/tc-13-1661-2019
Wang, Q., Yang, Q., Guo, H., Xiao, X., Jin, H., Li, L., et al. (2018). Hydrothermal variations in soils resulting from the freezing and thawing processes in the active layer of an alpine grassland in the Qilian Mountains, northeastern Tibetan Plateau. Theor. Appl. Climatol. 136, 929–941. doi:10.1007/s00704-018-2529-y
Wang, X., Chen, R., Han, C., Yang, Y., Liu, J., Liu, Z., et al. (2019b). Response of frozen ground under climate change in the Qilian Mountains, China. Quat. Int. 523, 10–15. doi:10.1016/j.quaint.2019.06.006
Xu, J., Tian, R., and Feng, S. (2021). Comparison of atmospheric vertical motion over China in ERA-interim, JRA-55, and NCEP/NCAR reanalysis datasets. Asia. Pac. J. Atmos. Sci. 57, 773–786. doi:10.1007/s13143-021-00226-5
Yang, W., Wang, Y., Wang, S., Webb, A. A., Yu, P., Liu, X., et al. (2017). Spatial distribution of Qinghai spruce forests and the thresholds of influencing factors in a small catchment, Qilian Mountains, northwest China. Sci. Rep. 7, 5561. doi:10.1038/s41598-017-05701-6
Yang, Y., Chen, R-s., Song, Y-x., Han, C-t., Liu, Z-w., and Liu, J-f. (2020). Spatial variability of soil hydraulic conductivity and runoff generation types in a small mountainous catchment. J. Mt. Sci. 17, 2724–2741. doi:10.1007/s11629-020-6258-1
Zhang, B., Zhang, R., Wu, L., and Nie, C. (2019). Changes of precipitation and moisture extremes in ERA-interim reanalysis viewed from a new space. Environ. Res. Commun. 2, 011004. doi:10.1088/2515-7620/ab59c7
Zhao, P., and He, Z. (2022a). A first evaluation of ERA5-land reanalysis temperature product over the Chinese qilian mountains. Front. Earth Sci. 10, 907730. doi:10.3389/feart.2022.907730
Zhao, P., and He, Z. (2022b). Temperature change characteristics in gansu province of China. Atmosphere 13, 728. doi:10.3390/atmos13050728
Zhao, P., Gao, L., Wei, J., Ma, M., Deng, H., Gao, J., et al. (2020). Evaluation of ERA-interim air temperature data over the qilian mountains of China. Adv. Meteorology 2020, 1–11. doi:10.1155/2020/7353482
Zhao, S., Zhang, S., Cheng, W., and Zhou, C. (2019). Model simulation and prediction of decadal mountain permafrost distribution based on remote sensing data in the qilian mountains from the 1990s to the 2040s. Remote Sens. 11, 183. doi:10.3390/rs11020183
Keywords: bias correction, ERA-interim reanalysis, temperature lapse rates, Qilian Mountains, climate change
Citation: Zhao P, Gao L, Ma M and Du J (2022) Bias correction of ERA-Interim reanalysis temperature for the Qilian Mountains of China. Front. Environ. Sci. 10:1033202. doi: 10.3389/fenvs.2022.1033202
Received: 31 August 2022; Accepted: 02 November 2022;
Published: 15 November 2022.
Edited by:
Shaoquan Liu, Institute of Mountain Hazards and Environment (CAS), ChinaReviewed by:
Xiaotong Zhang, Beijing Normal University, ChinaJianping Tang, Nanjing University, China
Narendra Singh, Aryabhatta Research Institute of Observational Sciences, India
Copyright © 2022 Zhao, Gao, Ma and Du. This is an open-access article distributed under the terms of the Creative Commons Attribution License (CC BY). The use, distribution or reproduction in other forums is permitted, provided the original author(s) and the copyright owner(s) are credited and that the original publication in this journal is cited, in accordance with accepted academic practice. No use, distribution or reproduction is permitted which does not comply with these terms.
*Correspondence: Lu Gao, bC5nYW9AZm94bWFpbC5jb20=